CONDENSED FINANCIAL REPORT – SUPPLEMENTARY DATA - Novartis · PDF fileNovartis Q4 and FY...
87
Novartis International AG Novartis Global Communications CH-4002 Basel Switzerland http://www.novartis.com CONDENSED FINANCIAL REPORT – SUPPLEMENTARY DATA Novartis Q4 and FY 2014 Condensed Financial Report – Supplementary Data INDEX Page GROUP AND DIVISIONAL OPERATING PERFORMANCE Q4 AND FY 2014 Group 2 Pharmaceuticals 6 Alcon 13 Sandoz 16 Vaccines 18 Consumer Health 20 CASH FLOW AND GROUP BALANCE SHEET 23 INNOVATION REVIEW 25 CONDENSED CONSOLIDATED FINANCIAL STATEMENTS Condensed consolidated income statements 33 Condensed consolidated statements of comprehensive income 35 Condensed consolidated balance sheets 36 Condensed consolidated changes in equity 37 Condensed consolidated cash flow statements 38 Notes to condensed consolidated financial statements, including update on legal proceedings 40 SUPPLEMENTARY INFORMATION 54 CORE RESULTS Reconciliation from IFRS results to core results 56 Group 58 Pharmaceuticals 60 Alcon 62 Sandoz 64 Corporate – continuing operations 66 Discontinuing operations 68 Vaccines 70 Consumer Health 72 Corporate -- discontinuing operations 74 ADDITIONAL INFORMATION Condensed consolidated changes in net debt / Share information 76 Free cash flow 77 Net sales of the top 20 Pharmaceuticals products 78 Pharmaceuticals sales by business franchise 80 Net sales by region 82 Currency translation rates / Income from associated companies 84 Vaccines segment – 2013 comparative information 85 DISCLAIMER 86
Transcript of CONDENSED FINANCIAL REPORT – SUPPLEMENTARY DATA - Novartis · PDF fileNovartis Q4 and FY...

Novartis International AG Novartis Global Communications CH-4002 Basel Switzerland http://www.novartis.com
CONDENSED FINANCIAL REPORT – SUPPLEMENTARY DATA Novartis Q4 and FY 2014 Condensed Financial Report – Supplementary Data INDEX Page
GROUP AND DIVISIONAL OPERATING PERFORMANCE Q4 AND FY 2014
Group 2
Pharmaceuticals 6
Alcon 13
Sandoz 16
Vaccines 18
Consumer Health 20
CASH FLOW AND GROUP BALANCE SHEET 23
INNOVATION REVIEW 25
CONDENSED CONSOLIDATED FINANCIAL STATEMENTS
Condensed consolidated income statements 33
Condensed consolidated statements of comprehensive income 35
Condensed consolidated balance sheets 36
Condensed consolidated changes in equity 37
Condensed consolidated cash flow statements 38
Notes to condensed consolidated financial statements, including update on legal proceedings 40
SUPPLEMENTARY INFORMATION 54
CORE RESULTS
Reconciliation from IFRS results to core results 56
Group 58
Pharmaceuticals 60
Alcon 62
Sandoz 64
Corporate – continuing operations 66
Discontinuing operations 68
Vaccines 70
Consumer Health 72
Corporate -- discontinuing operations 74
ADDITIONAL INFORMATION
Condensed consolidated changes in net debt / Share information 76
Free cash flow 77
Net sales of the top 20 Pharmaceuticals products 78
Pharmaceuticals sales by business franchise 80
Net sales by region 82
Currency translation rates / Income from associated companies 84
Vaccines segment – 2013 comparative information 85
DISCLAIMER 86

2/87
GROUP AND DIVISIONAL OPERATING PERFORMANCE Key figures excl. Diagnostics1 Reported excl. Diagnostics1 Reported
Q4 20142 Q4 2013 % change Q4 2013 FY 20142 FY 2013 % change FY 2013USD m USD m USD cc3 USD m USD m USD m USD cc3 USD m
Net sales 14 633 14 926 - 2 4 15 078 57 996 57 355 1 3 57 920
Continuing operations operating income 2 266 2 461 - 8 1 2 461 11 156 11 636 - 4 2 11 636Corporate income & expense, net 85 - 128 nm nm - 128 - 67 - 653 90 91 - 653Discontinuing operations operating loss/income -1 179 - 55 nm nm 40 - 353 - 312 - 13 -5 - 73
Group operating income 1 172 2 278 - 49 - 39 2 373 10 736 10 671 1 7 10 910
As % of net sales 8.0% 15.3% 15.7% 18.5% 18.6% 18.8%Income from associated companies 579 154 276 277 154 1 920 600 220 220 600Interest expense - 188 - 163 - 15 - 21 - 163 - 704 - 683 - 3 - 6 - 683Other financial income and expense 13 - 42 nm nm - 42 - 31 - 92 66 31 - 92Taxes - 89 - 228 61 56 - 264 -1 641 -1 352 - 21 - 28 -1 443
Net income 1 487 1 999 - 26 - 16 2 058 10 280 9 144 12 19 9 292
EPS (USD) 0.62 0.81 -23 -13 0.83 4.21 3.70 14 20 3.76
Free cash flow3 4 419 3 130 41 3 319 10 762 9 592 12 9 945
Core3 Operating income 3 322 3 293 1 9 14 616 14 191 3 8
As % of net sales 22.7% 22.1% 25.2% 24.7% Net income 2 914 2 892 1 9 12 755 12 351 3 8
EPS (USD) 1.21 1.18 3 12 5.23 5.01 4 10
Following the announcement of the transactions with GlaxoSmithKline plc (GSK) and Eli Lilly and Company (Lilly) on April 22, 2014 (and the subsequent transaction with CSL Limited), in order to comply with International Financial Reporting Standards (IFRS), Novartis separated the Group’s reported financial data for the current and prior years into “discontinuing” and “continuing” operations, defined on page 22. The transaction with Lilly closed on January 1, 2015 with the divestment of Animal Health. Novartis expects the transaction with GSK to be completed in the first half of 2015, and the transaction with CSL Limited (CSL) to be completed in the second half of 2015, subject to customary closing conditions including regulatory approvals. Despite the IFRS required presentation of discontinuing versus continuing operations, until the GSK and CSL transactions are closed, Novartis remains fully committed to all Group activities. In addition, all growth rates related to Novartis Group and Vaccines Division results contained within this release, unless otherwise noted, refer to 2013 data excluding the blood transfusion diagnostics business, to help illustrate performance on a comparable basis.
1 All comparisons to prior year are based on 2013 data excluding the blood transfusion diagnostics unit. See page 85. 2 2014 results exclude depreciation and amortization related to discontinuing operations from the portfolio transformation announcement date. 3 Constant currencies (cc), core results, free cash flow and 2013 data excluding the blood transfusion diagnostics unit are non-IFRS measures. An explanation of non-IFRS measures and reconciliation tables can be found beginning on page 54.

3/87
Fourth quarter Group net sales Group net sales amounted to USD 14.6 billion (-2%, +4% cc) in the fourth quarter. Growth Products1 contributed USD 4.7 billion or 32% of Group net sales, up 14% (USD) over the prior-year quarter. Corporate income and expense, net Corporate income and expense, which includes the cost of Group management and central services, amounted to a net income of USD 85 million in the fourth quarter compared to a net expense of USD 128 million in the prior-year period, mainly due to a USD 248 million gain in the quarter from selling a Novartis Venture Fund investment. Group operating income Group operating income decreased 49% (-39% cc) to USD 1.2 billion, mainly due to an exceptional pre-tax impairment charge of USD 1.1 billion related to the pending divestment to CSL of the influenza vaccines business. Currency had a negative impact of 10 percentage points, primarily due to the weakening of the euro, yen and ruble against the US dollar. Operating income margin decreased to 8.0% of net sales, down 6.4 percentage points (cc) from the prior-year quarter mainly on account of the exceptional influenza vaccines business impairment charge. Currency had a negative impact of 0.9 percentage points, resulting in a net decrease of 7.3 percentage points. The cessation of depreciation and amortization charges related to the discontinuing operations had a positive impact of USD 101 million for the quarter, improving the operating income margin by 0.7 percentage points (cc). The adjustments made to Group operating income to arrive at core operating income increased to USD 2.2 billion (2013: USD 1.0 billion), mainly on account of the exceptional USD 1.1 billion impairment charge for the influenza vaccines business in the fourth quarter of 2014. Excluding these items, Group core operating income increased 1% (+9% cc) to USD 3.3 billion. Core operating income margin in constant currencies increased 1.1 percentage points mainly due to lower functional costs driven by productivity programs, partly offset by unfavorable other income and expense. The cessation of depreciation and amortization charges related to the discontinuing operations had a positive impact of USD 49 million, improving the core operating income margin by 0.3 percentage points (cc). Currency had a negative impact of 0.5 percentage points, resulting in a net increase of 0.6 percentage points to 22.7% of net sales. Income from associated companies Income from associated companies amounted to USD 579 million compared to USD 154 million in the fourth quarter of 2013. The increase was mainly due to a gain of USD 421 million recognized on the sale of the shares of LTS Lohmann Therapie-Systeme AG in November 2014. The contribution from the investment in Roche amounted to USD 153 million compared to USD 168 million in the prior-year quarter. Core income from associated companies increased from USD 198 million in the prior-year period to USD 209 million in the fourth quarter of 2014. Interest expense and other financial income/expense Interest expense increased to USD 188 million from USD 163 million in the prior-year period due to recent bond issues. Other financial income and expense amounted to a net income of USD 13 million compared to a net expense of USD 42 million in the 2013 period, mainly due to hedging gains. Taxes The total Group’s tax rate (taxes as percentage of pre-tax income) in the fourth quarter decreased to 5.6% from 10.2% in the prior-year quarter, mainly due to the USD 1.1 billion impairment charge for the influenza vaccines business, other exceptional items in the quarter and the effect of adjusting to the full-year tax rate which was less than the previously estimated full-year rate. The Group’s core tax rate (taxes as percentage of pre-tax income) increased to 13.2% from 12.0% in the prior-year quarter.
1 "Growth Products" comprise products launched in 2009 or later, or products with exclusivity until at least 2018 in key markets (EU, US, Japan) (except Sandoz, which includes only products launched in the last 24 months).

4/87
Net income and EPS Group net income of USD 1.5 billion was down 26% (-16% cc), mainly due to lower operating income, partially offset by higher income from associated companies, which included a USD 0.4 billion pre-tax gain from the divestment of the shareholding in LTS Lohmann Therapie-Systeme AG and lower tax expense. EPS was USD 0.62 (-23%, -13% cc), down slightly less than net income due to lower average outstanding shares and lower minority interest. Group core net income of USD 2.9 billion was up 1% (+9% cc), in line with core operating income. Core EPS was USD 1.21 (+3%, +12% cc), growing ahead of core net income mainly due to lower average outstanding shares and lower minority interest. Comparing results for the fourth quarter of 2014 and the same period in 2013 including the blood transfusion diagnostics unit, Group total net sales decreased 3% in USD (+3% cc), Group total operating income was down 51% (-42% cc), Group total net income decreased 28% (-18% cc), and Group total EPS decreased 25% (-16% cc), down slightly less than Group total net income due to the lower average number of outstanding shares and lower minority interest. The tax rate in the fourth quarter of 2014 was 5.6%, compared to the prior-year period tax rate including the divested blood transfusion diagnostics unit of 11.4%. Full year Group net sales Group net sales increased 1% (+3% cc) to USD 58.0 billion in the full year. Growth Products contributed USD 18.6 billion or 32% of Group net sales, up 18% (USD) over 2013. Loss of exclusivity, including for Diovan, impacted sales by approximately USD 2.4 billion. Corporate income and expense, net Corporate income and expense amounted to a net expense of USD 67 million in 2014 compared to USD 653 million in the prior year, mainly due to a USD 456 million increase in other revenues principally related to the retained Vaccines intellectual property rights, including a USD 302 million commercial settlement gain and a USD 248 million gain from selling a Novartis Venture Fund investment. Group operating income Group operating income increased 1% (+7% cc) to USD 10.7 billion. The USD 0.9 billion exceptional gain in the first quarter from the divestment of the blood transfusion diagnostics unit to Grifols S.A. was more than offset by an exceptional pre-tax impairment charge of USD 1.1 billion in the fourth quarter related to the pending divestment to CSL of the influenza vaccines business. The negative currency impact of 6 percentage points was mainly due to the weakening of emerging market currencies (especially the ruble) and the yen against the US dollar. Operating income margin was 18.5% of net sales, up 0.8 percentage points (cc) from the prior-year period. Currency had a negative impact of 0.9 percentage points, resulting in a net decrease of 0.1 percentage points. The cessation of depreciation and amortization charges related to the discontinuing operations had a positive impact of USD 277 million for the full year, improving operating income margin by 0.5 percentage points (cc). The adjustments made to Group operating income to arrive at core operating income amounted to USD 3.9 billion (2013: USD 3.5 billion). These adjustments include a USD 0.9 billion pre-tax gain from the divestment of the blood transfusion diagnostics unit and the USD 0.3 billion commercial settlement gain, which were offset by the exceptional USD 1.1 billion impairment charge for the influenza vaccines business. Excluding these items, Group core operating income increased 3% (+8% cc) to USD 14.6 billion. Core operating income margin in constant currencies increased 1.2 percentage points; currency had a negative currency impact of 0.7 percentage points, resulting in a net increase of 0.5 percentage points to 25.2% of net sales. The cessation of depreciation and amortization charges related to the discontinuing operations had a positive impact of USD 134 million, improving the core operating income margin by 0.2 percentage points (cc).

5/87
Income from associated companies Income from associated companies amounted to USD 1.9 billion in 2014, compared to USD 600 million in 2013. The increase was mainly due to the gains recognized on the sale of shares of LTS Lohmann Therapie-Systeme AG and on the sale of the shares of Idenix Pharmaceuticals, Inc., which amounted to USD 421 million and USD 812 million, respectively. An additional income of USD 64 million was recorded on investments in associated companies held by the Novartis Venture Funds, which have been accounted at fair value from January 1, 2014 onwards, consistent with other investments held by these Funds. The contribution from the investment in Roche of USD 599 million was approximately in line with the prior-year level. Core income from associated companies increased to USD 945 million from USD 877 million in the prior-year period. Interest expense and other financial income/expense Interest expense increased slightly to USD 704 million from USD 683 million in the prior year. Other financial income and expense amounted to a net expense of USD 31 million compared to a net expense of USD 92 million in 2013, mainly as a result of hedging gains. Taxes The total Group’s tax rate in the full year of 2014 increased to 13.8% from 12.9% in 2013, principally due to the impact of taxes on the various exceptional gains and impairments and other exceptional charges which occurred during the year. The core tax rate increased slightly to 14.0% from 13.9% in 2013. Net income and EPS Group net income of USD 10.3 billion was up 12% (+19% cc), growing ahead of operating income mainly due to higher income from associated companies, which included a pre-tax gain of USD 0.8 billion from the sale of the shares of Idenix Pharmaceuticals, Inc. to Merck & Co., and a pre-tax gain of USD 0.4 billion from the divestment of the shareholding in LTS Lohmann Therapie-Systeme AG, partly offset by an increase in tax expense. EPS was up 14% (+20% cc) to USD 4.21, growing ahead of net income due to lower average outstanding shares and lower minority interest. Group core net income of USD 12.8 billion was up 3% (+8% cc), in line with core operating income. Core EPS was USD 5.23 (+4%, +10% cc), growing ahead of core net income due to lower average outstanding shares and lower minority interest. Comparing results for the full year of 2014 and the same period in 2013 including the blood transfusion diagnostics unit, Group total net sales remained stable in USD (0%, +2% cc), Group total operating income was down 2% (+5% cc), Group total net income increased 11% (+17% cc) and Group total EPS grew slightly ahead of net income at 12% (+18% cc) due to lower average outstanding shares and lower minority interest. The tax rate in the full year of 2014 was 13.8%, compared to the prior-year period tax rate including the divested blood transfusion diagnostics unit of 13.4%.

6/87
CONTINUING OPERATIONS1 Pharmaceuticals
Q4 2014 Q4 2013 % change
FY 2014 FY 2013 % change
USD m USD m USD cc USD m USD m USD ccNet sales 7 860 8 323 -6 0 31 791 32 214 -1 1 Operating income 1 611 2 013 -20 -14 8 471 9 376 -10 -5 As % of net sales 20.5 24.2 26.6 29.1 Core operating income 1 977 2 133 -7 0 9 514 9 523 0 4 As % of net sales 25.2 25.6 29.9 29.6
Fourth quarter Net sales Pharmaceuticals net sales were USD 7.9 billion (-6%, 0% cc) with volume growth of 8 percentage points offset by the negative impact of generic competition (-8 percentage points), largely for Diovan monotherapy and Exforge (US generic entry for Exforge on September 30, 2014 and for Exforge HCT on December 1, 2014). Growth products2 generated USD 3.6 billion of division net sales, growing 18% (cc) over the same period last year. These products – which include Gilenya, Afinitor, Tasigna, Galvus, Lucentis, Xolair, the COPD (chronic obstructive pulmonary disease) portfolio3 and Jakavi – contributed 46% of division net sales, compared to 39% in the 2013 quarter. Regionally, European sales (USD 2.7 billion, +5% cc) were strong, driven by Growth Products. US sales (USD 2.4 billion, -8% cc) declined due to generic competition for Diovan monotherapy, Exforge, Myfortic and Ritalin, which more than offset growth for Gleevec/Glivec, Gilenya, Afinitor and Tasigna. Japan sales (USD 0.6 billion, -20% cc) decreased, mainly due to a continued decline in Diovan sales, a biennial price cut for many brands and the impact of issues related to investigator initiated trials. Emerging Growth Markets (USD 2.2 billion, +13% cc) continued to perform strongly. Oncology sales grew 10% (cc) to USD 3.1 billion, driven mainly by Tasigna (USD 428 million, +30% cc), Afinitor (USD 426 million, +24% cc) and Gleevec/Glivec (USD 1.2 billion, +5% cc). In Specialty Care, Gilenya (USD 666 million, +32% cc) grew double-digit in the US and most ex-US markets, and Lucentis sales (USD 588 million, +1% cc) grew slightly, driven by the uptake in non-AMD indications, offsetting the impact of wet AMD competition. Primary Care strategic franchise performance (USD 0.7 billion, +14% cc) was underpinned by continued strong uptake of the COPD portfolio3 (USD 149 million, +94% cc) and Xolair (USD 200 million, +25% cc), partly offset by Galvus (USD 295 million, -1% cc), which Novartis stopped distributing in Germany in July. Operating income Operating income of USD 1.6 billion (-20%, -14% cc) declined principally due to exceptional items including net impairments of USD 157 million (primarily related to DEB025, which was terminated as a result of a hepatitis C virus strategy review) and net restructuring charges of USD 207 million (mainly related to a voluntary retirement program in Japan). Prior-year adjustments amounted to USD 120 million, principally due to the amortization of intangible assets of USD 70 million and impairment charges of USD 86 million, partially offset by gains on selling financial assets of USD 125 million. Core operating income was USD 2.0 billion (-7%, 0% cc). Core margin in constant currencies remained in line with the prior year; currency had a negative impact of 0.4 percentage points, resulting in a core margin of 25.2% of net sales.
1 Continuing operations do not yet include the results from oncology assets to be acquired from GSK on closing of the transaction or the results from the 36.5% interest in the GSK/Novartis consumer healthcare OTC joint venture interest which will be created at the same time. 2 "Growth products" comprise products launched in 2009 or later, or products with exclusivity until at least 2018 in key markets (EU, US, Japan). 3 The COPD portfolio includes Onbrez Breezhaler/Arcapta Neohaler, Seebri Breezhaler and Ultibro Breezhaler.

7/87
Core gross margin as a percentage of net sales improved by 0.2 percentage points (cc). Core R&D expenses improved by 0.3 percentage points (cc), and core M&S and core G&A expenses remained unchanged, marking another quarter of productivity programs and effective resource allocation. Core Other Income and Expense, net decreased the margin by 0.5 percentage points (cc). Full year Net sales Pharmaceuticals delivered net sales of USD 31.8 billion (-1%, +1% cc) for the full year, driven by volume growth (+7 percentage points) and pricing (+1 percentage points), offset by the impact of generic competition (-7 percentage points). Growth Products continued to drive performance and rejuvenate the portfolio, generating USD 13.7 billion of division net sales, up 17% (cc) over the previous year. Europe (USD 11.2 billion, +3% cc) benefited from the performance of growth products, partially offset by generic competition. The US (USD 9.8 billion, -5% cc) was impacted by generic competition for Diovan, Myfortic, Ritalin and TOBI nebulizer solution. Japan’s performance (USD 2.7 billion, -11% cc) was mainly impacted by a continued decline in Diovan sales, the biennial price decrease and the impact of issues related to investigator initiated trials. Emerging Growth Markets (USD 8.1 billion, +11% cc) showed double-digit growth, notably in Turkey, Brazil and China. Operating income Operating income was USD 8.5 billion (-10%, -5% cc) for the full year. Included in operating income was USD 576 million of net restructuring charges related to redeployment initiatives and a voluntary retirement program in Japan, USD 266 million of net impairment charges, USD 157 million for the US Healthcare Fee exceptional charge and the USD 125 million charge related to the Lucentis investigation in Italy (which nevertheless continues to be vigorously defended), partly offset by exceptional divestment gains of USD 237 million. The full year of 2013 had net adjustments of USD 147 million. Core operating income was USD 9.5 billion (0%, +4% cc), generating core operating leverage in constant currency due to productivity programs and effective resource allocation. Core margin in constant currencies improved by 1.1 percentage points; currency had a negative impact of 0.8 percentage points, resulting in a net margin expansion of 0.3 percentage points to 29.9% of net sales. Core gross margin as a percentage of net sales remained stable from the prior year. Core R&D expenses improved by 0.7 percentage points (cc), reflecting prior-year increased investments in late-stage clinical trials, as well as continued productivity efforts. Core M&S and core G&A expenses improved by 0.8 percentage points (cc), as continuing productivity efforts and funding reduction for non-strategic brands offset additional investments in new product launches. Core Other Income and Expense, net decreased the margin by 0.4 percentage points (cc).

8/87
Pharmaceuticals product review The information in this release reflects 2014 franchise structure within the Pharmaceuticals Division. As of January 2015, the Pharmaceuticals Division includes the following areas: Oncology, Immunology and Dermatology, Cardio-Metabolic, Retina, Neuroscience, Respiratory, Cell and Gene Therapies, and Established Medicines. The presentation of franchise performance using the new structure will commence with the first quarter 2015 earnings release with comparable 2014 information restated. All comments below focus on fourth quarter movements. PRIMARY CARE Q4 2014 Q4 2013 % change FY 2014 FY 2013 % change USD m USD m USD cc USD m USD m USD cc Onbrez Breezhaler/Arcapta Neohaler 56 53 6 15 220 192 15 17 Seebri Breezhaler 42 25 68 88 146 58 152 159 Ultibro Breezhaler 51 6 nm nm 118 6 nm nm COPD portfolio 149 84 77 94 484 256 89 93Galvus 295 328 -10 -1 1 224 1 200 2 6 Xolair1 200 173 16 25 777 613 27 30 TOBI 65 88 -26 -23 281 387 -27 -26 Other 8 10 -20 2 46 40 15 20 Total strategic franchise products
717 683 5 14 2 812
2 496 13 16
Diovan 379 843 -55 -53 2 345 3 524 -33 -32 Exforge 298 372 -20 -14 1 396 1 456 -4 -2 Tekturna/ Rasilez 47 59 -20 -15 207 290 -29 -27 Other 274 352 -22 -16 1 201 1 312 -8 -6 Established medicines 998 1 626 -39 -34 5 149 6 582 -22 -20Total Primary Care products 1 715 2 309 -26 -20 7 961 9 078 -12 -10 nm = not meaningful Onbrez Breezhaler/Arcapta Neohaler (USD 56 million, +15% cc) continued to grow worldwide as a once-daily bronchodilator of airflow obstruction in adult patients with chronic obstructive pulmonary disease (COPD). Onbrez Breezhaler/Arcapta Neohaler (indacaterol), a long-acting beta-2 agonist (LABA) approved in over 100 countries, is delivered via the low-resistance Breezhaler/Neohaler inhalation device. Seebri Breezhaler (USD 42 million, +88% cc), a once-daily inhaled long-acting muscarinic antagonist (LAMA) indicated as a maintenance bronchodilator treatment to relieve symptoms in adult patients with COPD, showed strong growth in the quarter. Delivered via the Breezhaler inhalation device, Seebri Breezhaler (glycopyrronium bromide) is approved in over 70 countries across Europe, Japan, Canada, Latin America, Asia, Australia and the Middle East, and a regulatory application has been submitted in the US. Glycopyrronium bromide was exclusively licensed to Novartis in April 2005 by Vectura and its co-development partner Sosei. Ultibro Breezhaler (USD 51 million) is a LABA/LAMA approved as a first-in-class once-daily dual bronchodilator in over 50 countries outside the US (including EU and Japan) and launched in over 25 countries (including the UK, Germany, Japan and Canada). Ultibro Breezhaler is a fixed-dose combination of indacaterol and glycopyrronium bromide, and in the EU, is indicated as a maintenance bronchodilator treatment to relieve symptoms in adult patients with COPD. A regulatory application has been submitted in the US. The COPD portfolio, which includes Onbrez Breezhaler/Arcapta Neohaler, Seebri Breezhaler and Ultibro Breezhaler, grew 94% (cc) to USD 149 million in the fourth quarter.
1 Revenue reflects Xolair sales for all indications (i.e. Xolair SAA and Xolair CSU, which are managed by the Integrated Hospital Care franchise).

9/87
Galvus Group (USD 295 million, -1% cc), which includes Galvus, an oral treatment for type 2 diabetes, and Eucreas, a single-pill combination of vildagliptin (the active ingredient in Galvus) and metformin, saw sales decline, driven by the distribution stop in the German market on July 1, 2014. Sales for the first six months of 2014 in Germany were USD 57 million. Galvus delivered a solid performance overall, with strong growth in many markets around the world. The focus for Galvus remains on patients whose diabetes is uncontrolled on metformin, as well as on expansion of usage in key segments, such as elderly and renal-impaired patients. Galvus Group is currently approved in more than 120 countries. Xolair (USD 200 million, +25% cc), currently approved in more than 90 countries as a treatment for moderate-to-severe or severe persistent allergic asthma, continued to grow strongly in Canada, Europe and Latin America. Xolair is also approved in the EU, Switzerland and 35 other countries as a treatment for chronic spontaneous urticaria (CSU), also known as chronic idiopathic urticaria (CIU), for which it is approved in the US, Canada and Australia. Novartis co-promotes Xolair with Genentech/Roche in the US and shares a portion of the operating income, but does not book US sales. TOBI Group (USD 65 million, -23% cc), which includes TOBI nebulizer solution formulation and TOBI Podhaler, a dry powder formulation of the antibiotic tobramycin for the management of cystic fibrosis sales, declined due to generic competition for TOBI nebulizer solution formulation. Approved in over 60 countries, TOBI Podhaler contributed 65% of total TOBI Group sales in the fourth quarter. Diovan Group (USD 379 million, -53% cc), consisting of Diovan monotherapy and the combination product Co-Diovan/Diovan HCT, saw a continued sales decline worldwide due to generic competition in most markets including the US (following July 7, 2014 Diovan monotherapy generic entry), many EU countries and Japan (generic entry in June 2014), compounded in Japan by the impact of issues related to investigator initiated trials. Exforge Group (USD 298 million, -14% cc), which includes Exforge and Exforge HCT, declined due to the entry of generic competition in the US for both Exforge (generic entry in October 2014) and Exforge HCT (November 2014). Sales remained stable in the EU and continued to experience double-digit growth in China and a number of emerging markets. Exforge is now available in more than 100 countries. Exforge HCT is available in over 60 countries. ONCOLOGY Q4 2014 Q4 2013 % change FY 2014 FY 2013 % change USD m USD m USD cc USD m USD m USD cc Gleevec/Glivec 1 237 1 227 1 5 4 746 4 693 1 2 Tasigna 428 352 22 30 1 529 1 266 21 24 Subtotal Bcr-Abl franchise 1 665 1 579 5 10 6 275 5 959 5 7Sandostatin 416 416 0 5 1 650 1 589 4 6 Afinitor/Votubia 426 361 18 24 1 575 1 309 20 22 Exjade 243 244 0 5 926 893 4 6 Femara 98 100 -2 6 380 384 -1 2 Jakavi 84 47 79 91 279 163 71 72 Zometa 57 94 -39 -34 264 600 -56 -55 Proleukin 15 26 -42 -42 74 91 -19 -19 Zykadia 12 0 nm nm 31 0 nm nm Other 66 60 10 11 249 228 9 10 Total Oncology products 3 082 2 927 5 10 11 703 11 216 4 6nm = not meaningful Our Bcr-Abl franchise, consisting of Tasigna and Gleevec/Glivec, reached USD 1.7 billion in sales (+10% cc) in the fourth quarter, driven by growth of both products. Gleevec/Glivec (USD 1.2 billion, +5% cc) experienced modest growth in the fourth quarter, driven mainly by the US. In the US, Novartis Pharmaceuticals Corporation has settled its litigation with a subsidiary of Sun Pharmaceutical Industries Ltd. relating to Novartis patents covering the use of certain polymorphic forms of Gleevec/Glivec, which expire in 2019 (including pediatric exclusivity). The basic compound patent for Gleevec/Glivec expires in the US on July 4, 2015. As a result of the settlement, Novartis will permit Sun’s subsidiary to market a generic version of Gleevec/Glivec in the US on February 1, 2016.

10/87
Tasigna (USD 428 million, +30% cc) double-digit performance in the fourth quarter was driven by strong growth in the US and other markets. Tasigna is a more effective, targeted therapy than Gleevec/Glivec for adult patients newly diagnosed with Philadelphia chromosome-positive (Ph+) chronic myeloid leukemia (CML) in the chronic phase or for adult patients in the chronic or accelerated phase who are resistant or intolerant to at least one prior therapy including Gleevec/Glivec. Sandostatin (USD 416 million, +5% cc) continued to benefit from the increasing use of Sandostatin LAR1 in key markets. Sandostatin is a somatostatin analogue used to treat patients with acromegaly as well as neuroendocrine tumors (NET). In NET, it is used for both the treatment of patients with symptoms of carcinoid syndrome and those with advanced NET of the midgut or unknown primary tumor location (currently approved in 47 countries). An enhanced presentation of Sandostatin LAR, which includes an improved diluent, safety needle and vial adapter, has been approved in 58 countries, with additional filings underway. Afinitor/Votubia (USD 426 million, +24% cc) performance in the fourth quarter was driven by strong growth in the US, Japan and other markets. Afinitor is an oral inhibitor of the mTOR pathway approved in combination with exemestane for the treatment of patients with HR+/HER2- advanced breast cancer after failure with a non-steroidal aromatase inhibitor, for advanced renal cell carcinoma following vascular endothelial growth factor-targeted therapy and for the treatment of advanced pancreatic NET. Afinitor is also approved for subependymal giant cell astrocytoma (SEGA) and renal angiomyolipoma associated with tuberous sclerosis complex. Everolimus, the active ingredient in Afinitor/Votubia, is available under the trade names Zortress/Certican for use in other non-oncology indications and is exclusively licensed to Abbott and sublicensed to Boston Scientific for use in drug-eluting stents. Exjade (USD 243 million, +5% cc), a once-daily oral therapy for chronic transfusional iron overload approved in more than 100 countries, is also approved for the treatment of chronic iron overload in patients with non-transfusion-dependent thalassemia in more than 70 countries, with additional regulatory reviews underway. Regulatory applications have been submitted in the US, Canada and Colombia for a new film-coated tablet formulation that can be swallowed. Applications for the new formulation are currently being filed in other countries. Jakavi (USD 84 million, +91% cc), an oral inhibitor of the JAK 1 and JAK 2 tyrosine kinases, experienced very strong growth in the quarter. It is the first JAK inhibitor indicated for the treatment of disease-related splenomegaly or symptoms in adult patients with primary myelofibrosis (also known as chronic idiopathic myelofibrosis), post-polycythemia vera myelofibrosis or post-essential thrombocythemia myelofibrosis. Jakavi (ruxolitinib) is currently approved in more than 65 countries, including EU member states, Japan, Canada, Australia, Mexico and Argentina. Regulatory applications have been submitted in the EU, Switzerland and Japan for Jakavi in polycythemia vera. Novartis licensed ruxolitinib from Incyte Corporation for development and commercialization outside the US.
1 Long acting release

11/87
SPECIALTY CARE Neuroscience Q4 2014 Q4 2013 % change FY 2014 FY 2013 % change USD m USD m USD cc USD m USD m USD cc Gilenya 666 527 26 32 2 477 1 934 28 30 Exelon/Exelon Patch 240 250 -4 0 1 009 1 032 -2 -1 Comtan/Stalevo 89 103 -14 -5 371 401 -7 -4 Extavia 43 37 16 20 177 159 11 11 Other 16 21 -24 -24 66 78 -15 -15 Total strategic franchise products 1 054 938 12 18 4 100 3 604 14 15 Established medicines 100 112 -11 -2 409 444 -8 -3 Total Neuroscience products 1 154 1 050 10 16 4 509 4 048 11 13
Gilenya (USD 666 million, +32% cc), the first once-daily oral therapy to treat relapsing forms of multiple sclerosis (MS), continued to show strong double-digit growth as the market moves towards oral treatments with higher efficacy and away from more traditional injectable therapies. Gilenya continued to see volume growth through new patient initiations (includes new patient starts, i.e. naïve patients, plus switches) in both the US and ex-US markets. Gilenya is approved in over 80 countries around the world and it is estimated that Gilenya has been used to treat approximately 114,000 patients in clinical trials and in a post-marketing setting, with a total patient exposure of approximately 195,000 patient years. Gilenya is licensed from Mitsubishi Tanabe Pharma. Exelon/Exelon Patch (USD 240 million, 0% cc) sales remained stable in the fourth quarter due to generic competition for Exelon Patch in the EU offsetting a solid performance for Exelon Patch in the US. Exelon Patch is approved for the treatment of mild-to-moderate Alzheimer’s disease dementia (AD) in more than 90 countries, including more than 20 countries where it is also approved for Parkinson’s disease dementia. Exelon Patch is also indicated for the treatment of patients with severe AD in 11 countries, including the US. In Europe, the high-dose patch (15 cm2) for mild-to-moderately severe AD was launched in several markets in 2013. Exelon Patch total patient exposure is approximately 3.8 million patient years. Ophthalmics Q4 2014 Q4 2013 % change FY 2014 FY 2013 % change USD m USD m USD cc USD m USD m USD cc Lucentis 588 630 -7 1 2 441 2 383 2 5 Other 13 14 -7 -4 63 61 3 5 Total Ophthalmics products 601 644 -7 1 2 504 2 444 2 5
Lucentis (USD 588 million, +1% cc) sales grew slightly, driven by the uptake in non-age-related macular degeneration (non-AMD) indications (such as visual impairment due to diabetic macular edema; macular edema secondary to central and branch retinal vein occlusion; and choroidal neovascularization secondary to pathologic myopia), offsetting the impact of competition in the wet AMD indication. The Lucentis pre-filled syringe was successfully launched in all key European countries, as well as Japan and Australia. Non-AMD indications contributed 43% of Lucentis sales in the fourth quarter, compared to 32% for the 2013 period. Emerging Growth Markets contributed 19% of Lucentis sales versus 18% last year. Lucentis is an anti-VEGF therapy specifically designed for the eye, minimizing systemic exposure, that has demonstrated significant efficacy with individualized dosing in its licensed indications and has a well-established safety profile supported by extensive clinical studies and real-world experience. Genentech/Roche holds the rights to Lucentis in the US.

12/87
Integrated Hospital Care Q4 2014 Q4 2013 % change FY 2014 FY 2013 % change USD m USD m USD cc USD m USD m USD cc Neoral/Sandimmun 164 195 -16 -9 684 750 -9 -6 Myfortic 131 159 -18 -10 543 637 -15 -11 Zortress/Certican 85 63 35 45 327 249 31 36 Ilaris 54 37 46 54 199 119 67 69 Other 45 43 5 9 173 169 2 4 Total strategic franchise products 479 497 -4 4 1 926 1 924 0 3 Everolimus stent drug 62 46 35 46 205 247 -17 -18 Established medicines 224 259 -14 -9 981 1 112 -12 -10 Total IHC products 765 802 -5 2 3 112 3 283 -5 -3
Xolair is listed in the Primary Care franchise section.
Myfortic (USD 131 million, -10% cc), a transplantation medicine, has experienced a sales decline after the expected launch of generic competition in the US in early 2014. Myfortic continued to grow in geographies without generic competition. Zortress/Certican (USD 85 million, +45% cc), available in more than 90 countries to prevent organ rejection in adult heart and kidney transplant patients, continued to show strong growth in the fourth quarter. It is also approved in over 70 countries for liver transplant patients, in the EU, US, and many other countries worldwide. Everolimus, the active ingredient in Zortress/Certican, is marketed for other indications under the trade names Afinitor/Votubia. Everolimus is exclusively licensed to Abbott and sublicensed to Boston Scientific for use in drug-eluting stents. Ilaris (USD 54 million, +54% cc) continued to grow as a treatment for adults and children suffering from cryopyrin-associated periodic syndrome, for which it is approved in more than 60 countries. Additionally, Ilaris is approved for the treatment of active systemic juvenile idiopathic arthritis in the US, EU and other countries – an important growth driver for the product. Ilaris is also available for the symptomatic treatment of refractory acute gouty arthritis in the EU and is being developed for Hereditary Periodic Fever Syndromes.

13/87
Alcon Q4 2014 Q4 2013 % change FY 2014 FY 2013 % change USD m USD m USD cc USD m USD m USD cc
Net sales 2 703 2 665 2 7 10 827 10 496 3 6Operating income 365 172 112 155 1 597 1 232 30 43 As % of net sales 13.5 6.5 14.8 11.7 Core operating income 895 851 5 14 3 811 3 694 3 8 As % of net sales 33.1 32.1 35.2 35.2 Fourth quarter Net sales Alcon net sales were USD 2.7 billion (+2%, +7% cc) in the fourth quarter, led by robust growth in the Ophthalmic Pharmaceuticals and Surgical franchises. Emerging Growth Markets grew strongly (+7%, +17% cc), offset by weaker growth in Japan. Ophthalmic Pharmaceuticals grew (+4%, +10% cc), driven by double-digit growth (cc) in the glaucoma franchise, Systane for dry eye, and Ilevro, a non-steroidal anti-inflammatory. Surgical performance (+1%, +7% cc) benefited from strong sales of the Centurion phacoemulsification cataract platform, with improving growth performance in AcrySof intraocular lenses. Vision Care (0%, +4% cc) was driven by strong growth of Dailies Total1 and AirOptix Colors, offset by a decline in contact lens care solutions resulting from a continued market shift to daily disposable lenses as well as strong competitive pressures in the US. Regionally, Emerging Growth Markets delivered strong growth (cc), led by China (+26%, +28% cc), Russia (-11%, +30% cc), and India (+12%, +12% cc). Latin America also grew strongly (+9%, +18% cc), driven by double-digit growth (cc) across franchises. North America (+6%, +7% cc) saw strong growth in Ophthalmic Pharmaceuticals and Vision Care with moderate growth in Surgical against a high prior-year comparator. Sales in Europe, the Middle East and Africa (-4%, +4% cc) improved, driven by solid Ophthalmic Pharmaceuticals performance, offset by weaker performance in Vision Care. Japan sales were weaker (-10%, +2% cc) across franchises. Operating income Operating income increased 112% (+155% cc) to USD 365 million, driven by strong operating performance and the ending in 2013 of integration charges related to the acquisition of Alcon. Adjustments to arrive at core operating income for the quarter amounted to USD 530 million, consisting of USD 522 million for the amortization of intangible assets, USD 10 million for restructuring costs including Group-wide rationalization of manufacturing sites, and other net income of USD 2 million. Prior-year adjustments amounted to USD 679 million due to amortization, integration costs, and restructuring charges. Core operating income advanced 5% (+14% cc) to USD 895 million, driven by higher sales and productivity programs. Core operating income margin in constant currencies increased by 2.1 percentage points; currency had a negative impact of 1.1 percentage point, resulting in a net increase of 1.0 percentage points to 33.1% of net sales. Core gross margin as a percentage of net sales increased by 0.9 percentage points (cc), driven by improved product mix. Core R&D expenses decreased by 0.6 percentage points (cc) compared to prior year, driven by continued project prioritization, which offset continued investment in important clinical trials. Core M&S and core G&A expenses decreased by 0.9 percentage points (cc), despite continued investment in new product launches. Core Other Income and Expense, net increased by 0.3 percentage points (cc).
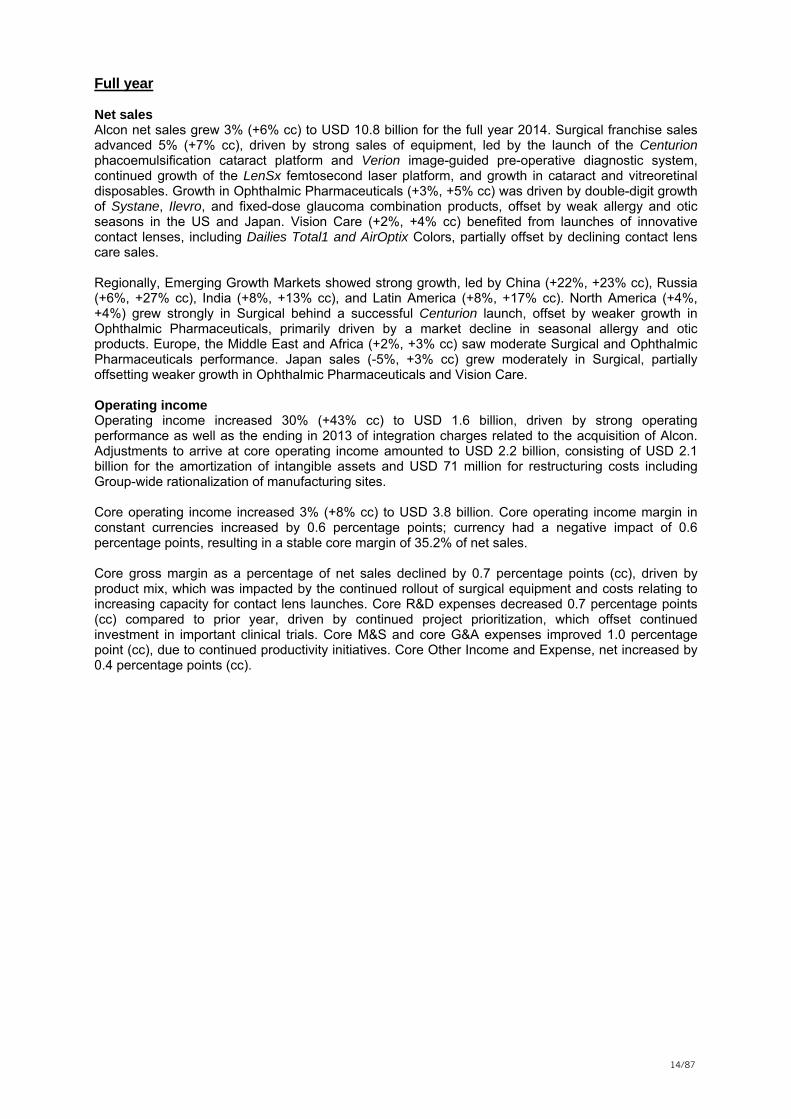
14/87
Full year Net sales Alcon net sales grew 3% (+6% cc) to USD 10.8 billion for the full year 2014. Surgical franchise sales advanced 5% (+7% cc), driven by strong sales of equipment, led by the launch of the Centurion phacoemulsification cataract platform and Verion image-guided pre-operative diagnostic system, continued growth of the LenSx femtosecond laser platform, and growth in cataract and vitreoretinal disposables. Growth in Ophthalmic Pharmaceuticals (+3%, +5% cc) was driven by double-digit growth of Systane, Ilevro, and fixed-dose glaucoma combination products, offset by weak allergy and otic seasons in the US and Japan. Vision Care (+2%, +4% cc) benefited from launches of innovative contact lenses, including Dailies Total1 and AirOptix Colors, partially offset by declining contact lens care sales. Regionally, Emerging Growth Markets showed strong growth, led by China (+22%, +23% cc), Russia (+6%, +27% cc), India (+8%, +13% cc), and Latin America (+8%, +17% cc). North America (+4%, +4%) grew strongly in Surgical behind a successful Centurion launch, offset by weaker growth in Ophthalmic Pharmaceuticals, primarily driven by a market decline in seasonal allergy and otic products. Europe, the Middle East and Africa (+2%, +3% cc) saw moderate Surgical and Ophthalmic Pharmaceuticals performance. Japan sales (-5%, +3% cc) grew moderately in Surgical, partially offsetting weaker growth in Ophthalmic Pharmaceuticals and Vision Care. Operating income Operating income increased 30% (+43% cc) to USD 1.6 billion, driven by strong operating performance as well as the ending in 2013 of integration charges related to the acquisition of Alcon. Adjustments to arrive at core operating income amounted to USD 2.2 billion, consisting of USD 2.1 billion for the amortization of intangible assets and USD 71 million for restructuring costs including Group-wide rationalization of manufacturing sites. Core operating income increased 3% (+8% cc) to USD 3.8 billion. Core operating income margin in constant currencies increased by 0.6 percentage points; currency had a negative impact of 0.6 percentage points, resulting in a stable core margin of 35.2% of net sales. Core gross margin as a percentage of net sales declined by 0.7 percentage points (cc), driven by product mix, which was impacted by the continued rollout of surgical equipment and costs relating to increasing capacity for contact lens launches. Core R&D expenses decreased 0.7 percentage points (cc) compared to prior year, driven by continued project prioritization, which offset continued investment in important clinical trials. Core M&S and core G&A expenses improved 1.0 percentage point (cc), due to continued productivity initiatives. Core Other Income and Expense, net increased by 0.4 percentage points (cc).

15/87
Alcon product review All comments below focus on fourth quarter movements. Surgical
Q4 2014 Q4 2013 % change FY 2014 FY 2013 % change USD m USD m USD cc USD m USD m USD cc Cataract products 836 826 1 7 3 174 3 037 5 7 IOLs - Cataract 319 333 -4 1 1 264 1 297 -3 0 Vitreoretinal products 158 161 -2 4 615 592 4 7 Refractive/Other 72 70 3 10 284 268 6 8 Total 1 066 1 057 1 7 4 073 3 897 5 7
Global Surgical sales increased 1% (+7% cc) to USD 1.1 billion in the fourth quarter, driven by strong equipment sales, including Centurion and Verion, as well as cataract and vitreoretinal disposables. While the cataract procedure market continued to expand strongly in Emerging Growth Markets, the US market experienced only moderate growth. Sales of advanced technology IOLs improved (-2%, +3% cc). Ophthalmic Pharmaceuticals Q4 2014 Q4 2013 % change FY 2014 FY 2013 % change USD m USD m USD cc USD m USD m USD cc Glaucoma 331 315 5 13 1 319 1 265 4 7 Allergy/Otic/Nasal 178 173 3 5 887 939 -6 -4 Infection/Inflammation 279 263 6 11 1 066 1 019 5 7 Dry Eye/Tears 155 142 9 15 608 558 9 12 Other 81 90 -10 1 331 327 1 6 Total 1 024 983 4 10 4 211 4 108 3 5
Global sales in Ophthalmic Pharmaceuticals grew 4% (+10% cc) to USD 1.0 billion in the fourth quarter. Glaucoma sales grew double-digit, driven by strong sales of fixed-dose combination products globally, including DuoTrav, Azarga and Simbrinza. Otic and allergy sales, including Ciprodex and Pataday/Patanol products, grew moderately despite the impact of generic competitive entries to Patanase in the US. Within the Infection/Inflammation segment, sales growth was driven by Ilevro and Durezol, and other products which benefited from a low prior-year comparator. Alcon continued to experience strong growth momentum in Dry Eye, led by the Systane eye drops and ointments product family (+19%, +25% cc), from increased channel distribution and new product launches. Vision Care Q4 2014 Q4 2013 % change FY 2014 FY 2013 % change USD m USD m USD cc USD m USD m USD cc Contact lenses 455 436 4 10 1 897 1 793 6 7 Contact lens care 158 179 -12 -7 646 698 -7 -5 Total 613 615 0 4 2 543 2 491 2 4
Vision Care global product sales were stable (0%, +4% cc) at USD 613 million in the fourth quarter, benefiting from strong contact lens performance (+4%, +10% cc) with the continued rollout of Dailies Total1, AirOptix Colors, Dailies AquaComfort Plus (DACP) Toric and DACP Multifocal. Sales of contact lens solutions (-12%, -7% cc) declined, driven by the market shift to daily disposable lenses as well as competitive pressures in the US.
16/87
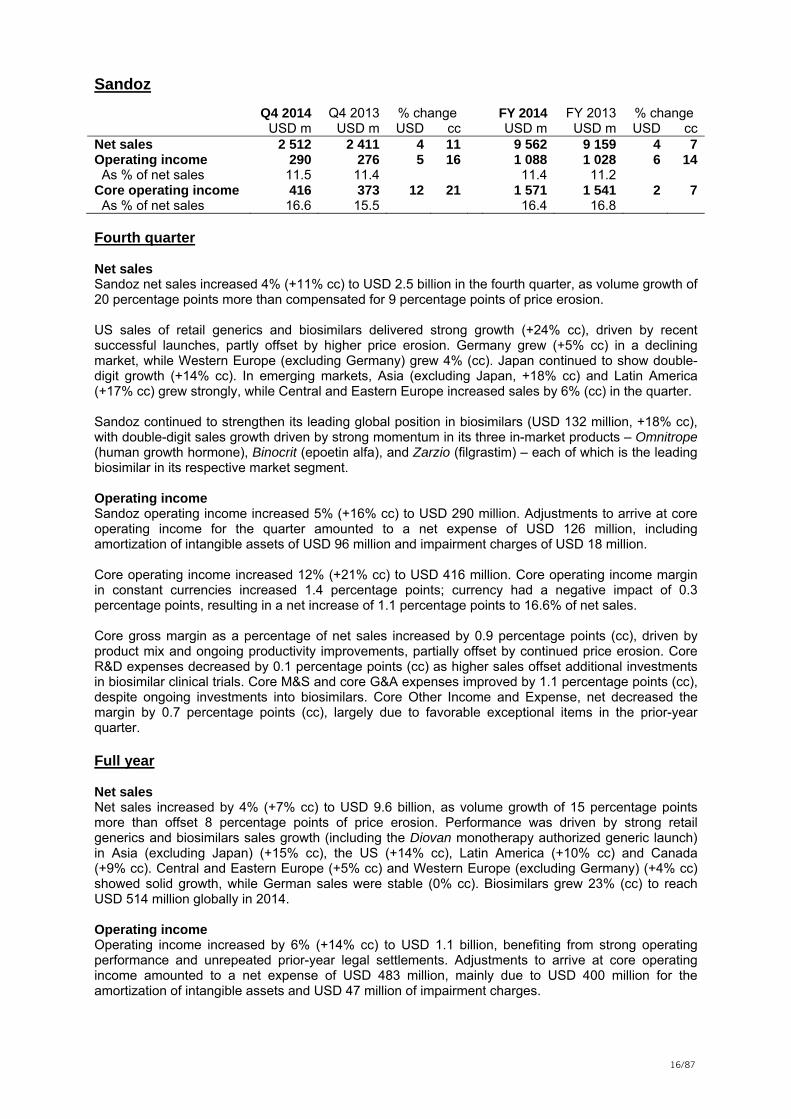
Sandoz Q4 2014 Q4 2013 % change FY 2014 FY 2013 % change USD m USD m USD cc USD m USD m USD cc
Net sales 2 512 2 411 4 11 9 562 9 159 4 7Operating income 290 276 5 16 1 088 1 028 6 14 As % of net sales 11.5 11.4 11.4 11.2 Core operating income 416 373 12 21 1 571 1 541 2 7 As % of net sales 16.6 15.5 16.4 16.8 Fourth quarter Net sales Sandoz net sales increased 4% (+11% cc) to USD 2.5 billion in the fourth quarter, as volume growth of 20 percentage points more than compensated for 9 percentage points of price erosion. US sales of retail generics and biosimilars delivered strong growth (+24% cc), driven by recent successful launches, partly offset by higher price erosion. Germany grew (+5% cc) in a declining market, while Western Europe (excluding Germany) grew 4% (cc). Japan continued to show double-digit growth (+14% cc). In emerging markets, Asia (excluding Japan, +18% cc) and Latin America (+17% cc) grew strongly, while Central and Eastern Europe increased sales by 6% (cc) in the quarter.
Sandoz continued to strengthen its leading global position in biosimilars (USD 132 million, +18% cc), with double-digit sales growth driven by strong momentum in its three in-market products – Omnitrope (human growth hormone), Binocrit (epoetin alfa), and Zarzio (filgrastim) – each of which is the leading biosimilar in its respective market segment. Operating income Sandoz operating income increased 5% (+16% cc) to USD 290 million. Adjustments to arrive at core operating income for the quarter amounted to a net expense of USD 126 million, including amortization of intangible assets of USD 96 million and impairment charges of USD 18 million. Core operating income increased 12% (+21% cc) to USD 416 million. Core operating income margin in constant currencies increased 1.4 percentage points; currency had a negative impact of 0.3 percentage points, resulting in a net increase of 1.1 percentage points to 16.6% of net sales. Core gross margin as a percentage of net sales increased by 0.9 percentage points (cc), driven by product mix and ongoing productivity improvements, partially offset by continued price erosion. Core R&D expenses decreased by 0.1 percentage points (cc) as higher sales offset additional investments in biosimilar clinical trials. Core M&S and core G&A expenses improved by 1.1 percentage points (cc), despite ongoing investments into biosimilars. Core Other Income and Expense, net decreased the margin by 0.7 percentage points (cc), largely due to favorable exceptional items in the prior-year quarter. Full year Net sales Net sales increased by 4% (+7% cc) to USD 9.6 billion, as volume growth of 15 percentage points more than offset 8 percentage points of price erosion. Performance was driven by strong retail generics and biosimilars sales growth (including the Diovan monotherapy authorized generic launch) in Asia (excluding Japan) (+15% cc), the US (+14% cc), Latin America (+10% cc) and Canada (+9% cc). Central and Eastern Europe (+5% cc) and Western Europe (excluding Germany) (+4% cc) showed solid growth, while German sales were stable (0% cc). Biosimilars grew 23% (cc) to reach USD 514 million globally in 2014. Operating income Operating income increased by 6% (+14% cc) to USD 1.1 billion, benefiting from strong operating performance and unrepeated prior-year legal settlements. Adjustments to arrive at core operating income amounted to a net expense of USD 483 million, mainly due to USD 400 million for the amortization of intangible assets and USD 47 million of impairment charges.

17/87
Core operating income was up 2% (+7% cc) to USD 1.6 billion. Core operating income margin in constant currencies increased by 0.1 percentage points, despite high price erosion; currency had a negative impact of 0.5 percentage points, resulting in a net decrease of 0.4 percentage points to 16.4% of net sales. Core gross margin as a percentage of net sales decreased 0.2 percentage points (cc), as high price erosion was only partially compensated by favorable sales mix and productivity programs. Core R&D expenses improved by 0.1 percentage points (cc), and Core M&S and core G&A expenses improved by 0.3 percentage points (cc), driving operating leverage as sales continued to grow. Core Other Income and Expense, net decreased the margin by 0.1 percentage points (cc). Sandoz franchises Sandoz continued to strengthen its global leadership position in differentiated generics,1 including medicines that are difficult to develop and manufacture. Differentiated generics accounted for 45% of Sandoz sales in 2014. Q4 2014 Q4 2013 % change FY 2014 FY 2013 % change USD m USD m USD cc USD m USD m USD cc Retail Generics 2 065 2 016 2 10 7 933 7 663 4 6 Biopharmaceuticals & Oncology Injectables 305 246 24 32 1 094 888 23 25 Anti-Infectives 142 149 -5 3 535 608 -12 -12 Total 2 512 2 411 4 11 9 562 9 159 4 7
1 Sandoz differentiated products are comprised of biosimilars and generic injectables, ophthalmics, dermatologics, and respiratory, as well as difficult-to-make oral solids (such as tacrolimus).

18/87
DISCONTINUING OPERATIONS1 Vaccines2
excl. Diagnostics3 Reported excl. Diagnostics3 Reported
Q4 2014 Q4 2013 % change Q4 2013 FY 2014 FY 2013 % change FY 2013 USD m USD m USD cc USD m USD m USD m USD cc USD m
Net sales 494 503 -2 4 655 1 537 1 422 8 10 1 987Operating loss -1 084 -96 nm nm -1 -552 -477 -16 -15 -238 As % of net sales -219.4 -19.1 -0.2 -35.9 -33.5 -12.0Core operating loss -6 -52 nm nm -290 -302 4 5 As % of net sales -1.2 -10.3 -18.9 -21.2
All periods exclude certain intellectual property rights and related other revenues which will be retained by Novartis and are now reported under Corporate activities, with 2013 results restated for this impact. All comparisons to prior year are based on 2013 data excluding the blood transfusion diagnostics unit. 2014 results exclude depreciation and amortization related to discontinuing operations from the portfolio transformation announcement date. Fourth quarter Net sales Net sales were USD 494 million (-2%, +4% cc) for the fourth quarter compared to USD 503 million in the prior-year period. Solid demand across the product portfolio was driven by the Meningitis franchise, which benefited from sales of recently launched Bexsero. This was offset by an earlier US influenza season and lower sales to the US Department of Health and Human Services. Operating loss Operating loss was USD 1.1 billion for the fourth quarter compared to a loss of USD 96 million in the prior-year period, driven by an exceptional pre-tax impairment charge of USD 1.1 billion related to the pending divestment to CSL of the influenza vaccines business. Due to the cessation of depreciation and amortization charges from the portfolio transformation announcement date, the prior year contained approximately USD 73 million of higher depreciation and amortization charges in the quarter compared to the current year, comprised of USD 35 million for depreciation and USD 38 million for amortization. Adjustments to arrive at core operating loss amounted to USD 1.1 billion compared to adjustments of USD 44 million in the prior-year period, driven by the USD 1.1 billion impairment charge for the influenza vaccines business. Core operating loss for the fourth quarter was USD 6 million compared to a loss of USD 52 million for the prior-year period. The improvement in core operating loss was mainly due to a higher margin product mix and the cessation of depreciation of USD 35 million, partially offset by increased operating costs of the Holly Springs facility in the US and enrollment in two large Phase III quadrivalent influenza vaccine studies.
1 Despite the IFRS required presentation of discontinuing versus continuing operations, until the transactions with GSK and CSL are closed, Novartis remains fully committed to all Group activities. 2 All periods exclude certain intellectual property rights and related other revenues which will be retained by Novartis and are now reported under Corporate activities, with 2013 reported results being restated for this impact. 3 All comparisons to prior year are based on 2013 data excluding the blood transfusion diagnostics unit. See page 85.

19/87
Full year Net sales Net sales increased 8% (+10% cc) to USD 1.5 billion for the year compared to USD 1.4 billion in 2013, driven by solid demand across the product portfolio, particularly in the Meningitis franchise (USD 454 million, +41% cc) due to Menveo, Menjugate and the recently launched Bexsero. In the Travel and Pediatric franchise, sales grew 11% (cc) to USD 607 million, driven by tick-borne encephalitis vaccine and Ixiaro sales. Influenza vaccine sales amounted to USD 476 million (-8% cc) as lower pre-pandemic sales, driven by the US Department of Health and Human Services, were partially offset by strong seasonal influenza sales. Operating loss Operating loss was USD 552 million for 2014 compared to a loss of USD 477 million in 2013. The increase in operating loss was driven by the exceptional USD 1.1 billion impairment charge for the influenza vaccines business, mostly offset by the USD 876 million exceptional gain from the divestment of the blood transfusion diagnostics unit to Grifols S.A. Due to the cessation of depreciation and amortization charges from the portfolio transformation announcement date, the prior year contained approximately USD 204 million of higher depreciation and amortization charges compared to the current year, comprised of USD 95 million for depreciation and USD 109 million for amortization. Adjustments to arrive at core operating loss amounted to USD 262 million, driven by the USD 1.1 billion impairment of the influenza vaccines business, mostly offset by the USD 876 million exceptional divestment gain. Prior-year adjustments amounted to USD 175 million, mainly due to amortization. Core operating loss was USD 290 million in 2014 compared to a loss of USD 302 million in the prior year. The improvement in core operating loss was due to increased sales and the cessation of depreciation of USD 95 million, partially offset by operating costs of the Holly Springs facility and enrollment in two large Phase III quadrivalent influenza vaccine studies.

20/87
Consumer Health Q4 20141 Q4 2013 % change FY 20141 FY 2013 % change
USD m USD m USD cc USD m USD m USD ccNet sales 1 064 1 034 3 11 4 279 4 064 5 8Operating income 172 48 258 292 470 178 164 196 As % of net sales 16.2 4.6 11.0 4.4 Core operating income 115 60 92 122 452 298 52 72 As % of net sales 10.8 5.8 10.6 7.3
Fourth quarter Net sales Consumer Health, which comprises OTC and Animal Health, saw net sales increase 3% (+11% cc) to USD 1.1 billion in the fourth quarter, driven by strong OTC momentum. OTC delivered double-digit sales growth (+14% cc) in the quarter. The Cough Cold portfolio grew double-digit (cc), mainly due to the recent US re-launch of Theraflu and Otrivin in Russia. Voltaren (+20% cc), the seventh-largest global over-the-counter brand, continued to deliver broad-based, double-digit growth. North America delivered robust double-digit growth driven by the US re-launch of Theraflu and the Excedrin portfolio, including the recently launched Mild Headache. Emerging Growth Markets continued to grow double-digit (cc), led by Russia, China and Brazil. Animal Health delivered single-digit sales growth (+3% cc) in the quarter, with North America showing a slight decline against a strong prior-year comparator. Sentinel, a companion animal parasiticide product, which was re-launched in North America last year, continued to gain market share. In Europe, the business declined slightly (cc) from the previous-year quarter, while both Asia Pacific and Latin America delivered strong, double-digit sales growth (cc). Key products such as Onsior in the companion animal category and Denagard and Agita in the farm animal category grew double-digit in the quarter. Emerging Growth Markets were led by double-digit growth (cc) in Russia, Thailand, Vietnam, Brazil and China. Operating income Operating income amounted to USD 172 million compared to USD 48 million in the prior-year quarter, driven by higher gross margin from sales, strong operating leverage and income from a divestment in the US. The cessation of depreciation and amortization charges from the portfolio transformation announcement date had a positive impact of USD 28 million for the quarter, comprised of USD 13 million for depreciation and USD 15 million for amortization. Adjustments to arrive at core operating income for the quarter amounted to USD 57 million, due to income from a divestment partially offset by integration costs and restructuring expenses. Prior-year adjustments amounted to USD 12 million, consisting mainly of the amortization of intangible assets. Core operating income increased 92% (+122% cc) to USD 115 million. Core operating income margin in constant currencies increased by 5.9 percentage points; currency had a negative impact of 0.9 percentage points, resulting in a net increase of 5.0 percentage points to 10.8% of net sales. Core gross margin as a percentage of net sales increased by 0.3 percentage points (cc), largely due to the cessation of depreciation charges. Core R&D expenses decreased by 1.0 percentage point (cc). Core M&S expenses decreased by 4.7 percentage points (cc) due to operating leverage as sales continued to grow and due to good cost management. Core G&A expenses decreased by 1.5 percentage points (cc). Core Other Income and Expense, net had a negative margin effect of 1.6 percentage points (cc).
1 2014 results exclude depreciation and amortization related to discontinuing operations from the portfolio transformation announcement date.

21/87
Full year On January 1, 2015, Novartis completed the divestment of its Animal Health division to Eli Lilly and Company (Lilly) for approximately USD 5.4 billion. This will realize a pre-tax gain of approximately USD 4.6 billion. Net sales Consumer Health net sales increased 5% (+8% cc) to USD 4.3 billion in 2014, driven by strong performance of key global brands and product re-launches in OTC and Animal Health. OTC sales reached USD 3.1 billion, up 9% (cc) over the previous year, driven by strong growth of all strategic brands, including Theraflu, Voltaren, Excedrin and Otrivin. Voltaren (+22% cc) delivered strong double-digit sales growth following successful launches of the 12-hour formulation and continued solid commercial execution in key markets. Theraflu delivered double-digit growth (cc) supported by the US re-launch, despite the weaker cough and cold season early in 2014. North America achieved double-digit growth due to a strong performance of Voltaren in Canada, as well as the US re-launch of Theraflu. Europe grew significantly ahead of the market, driven by Germany and Southern Europe. Emerging Growth Markets delivered double-digit growth (cc), led by China and Brazil, with robust growth in Russia. Animal Health sales reached USD 1.2 billion, up 5% (cc) over the previous year, with high single-digit growth in North America, driven by continued growth momentum in Sentinel since its re-launch in April 2013. Europe grew mid-single digit (cc), led by strong performance of Milbemax, the number one de-wormer for cats and dogs. Asia and Latin America also delivered single-digit growth (cc) over the previous year. Key products such as Deramaxx and Onsior in the companion animal category, as well as Clik, Zolvix and Agita in the farm animal category, delivered strong double-digit growth (cc) compared to 2013. Growth in Emerging Growth Markets was led by Russia, China, Thailand and Brazil. Operating income Operating income amounted to USD 470 million compared to USD 178 million in the prior-year period, driven by higher gross margin from incremental sales and lower Lincoln plant remediation and restructuring expenses. The impact of cessation of depreciation and amortization charges from the portfolio transformation announcement date had a positive impact of USD 73 million in the year, comprised of USD 34 million for depreciation and USD 39 million for amortization. Adjustments to arrive at core operating income amounted to USD 18 million, consisting mainly of income from a divestment in the US, amortization of intangible assets, integration costs and restructuring expenses. Prior-year adjustments amounted to USD 120 million, consisting mainly of Lincoln-related impairments and restructuring expenses as well as amortization of intangibles. Core operating income increased 52% (+72% cc) to USD 452 million. Core operating income margin in constant currencies increased by 4.3 percentage points. Currency had a negative impact of 1.0 percentage point, largely driven by erosion of emerging markets currencies, resulting in a net increase of 3.3 percentage points to 10.6% of net sales. Product mix, lower current-year costs at the Lincoln manufacturing facility and the cessation of depreciation charges generated a core gross margin increase of 1.8 percentage points (cc). Core R&D expenses decreased by 0.4 percentage points (cc). Core M&S expenses decreased by 3.1 percentage points (cc) driving operating leverage as sales continued to grow. Core G&A expenses decreased by 0.6 percentage points (cc). Core Other Income and Expense, net had a negative margin effect of 1.6 percentage points (cc), largely driven by income from divestments of smaller non-core brands in the prior year.

22/87
Consolidated financial statements reflecting the portfolio transformation Following the announcement of the transactions with GlaxoSmithKline plc (GSK) and Eli Lilly and Company (Lilly) on April 22, 2014 (and the subsequent transaction with CSL Limited), in order to comply with International Financial Reporting Standards (IFRS), Novartis has separated the Group’s reported financial data for the current and prior years into “discontinuing” and “continuing” operations. Discontinuing operations include the Animal Health Division, the OTC Division, and all of the Vaccines Division except for certain intellectual property rights and related other revenues which will be retained by Novartis and are now reported under Corporate activities. Also included under Corporate are certain transaction-related expenses.
Discontinuing operations also include the gain on the divestment of the blood transfusion diagnostics unit, completed on January 9, 2014, and related prior-year results for this activity. Due to this divestment, the 2013 Novartis Group and Vaccines divisional data contained within this release excludes the results of the blood transfusion diagnostics unit, to help illustrate performance on a comparable basis. As required by IFRS, 2014 results exclude from the announcement date any further depreciation and amortization related to discontinuing operations. The transaction with Lilly closed on January 1, 2015 with the divestment of Animal Health. Novartis expects the transaction with GSK to be completed in the first half of 2015, and the transaction with CSL Limited (CSL) to be completed in the second half of 2015, subject to customary closing conditions including regulatory approvals. Despite the IFRS required presentation of discontinuing versus continuing operations, until the GSK and CSL transactions are closed, Novartis remains fully committed to all Group activities. Continuing operations comprise all other activities of the Novartis Group, including the Pharmaceuticals, Alcon and Sandoz Divisions and the retained Corporate activities. Continuing operations do not yet include the results from oncology net assets to be acquired from GSK on closing of the transaction or the results from the 36.5% interest in the GSK/Novartis consumer healthcare joint venture that will be created at the same time. Details of the split of the Group’s consolidated income statement into discontinuing and continuing operations for all quarters of 2013 and for the first quarter of 2014 can be found on our website at http://www.novartis.com/downloads/investors/financial-results/quarterly-results/q2-2014-required-changes.pdf.

23/87
CASH FLOW AND GROUP BALANCE SHEET Cash flow Fourth quarter Cash flow from Group total operating activities in the fourth quarter amounted to USD 5.2 billion compared to USD 4.5 billion in the prior-year period. The increase was due to higher hedging gains and lower net working capital as well as lower payments out of provisions. Of the Group total, continuing operations contributed USD 4.7 billion compared to USD 4.0 billion in the prior-year period. The cash outflows for Group total investing activities in the fourth quarter amounted to USD 0.9 billion compared to USD 2.7 billion in the prior-year period. The investing cash outflows from continuing operations amounted to USD 0.8 billion, compared to an outflow of USD 2.6 billion in 2013. In the current year, there was an inflow from the final installment on the sale of the investment in LTS Lohmann Therapie-Systeme AG of USD 0.3 billion, while the prior year included an outflow for investments in marketable securities of USD 1.5 billion. Investments in property, plant and equipment of USD 0.8 billion were lower by USD 0.2 billion and investments in intangible, financial and other non-current assets remained consistent with the prior-year level. The current year outflow for the acquisition of WaveTech of USD 0.4 billion was offset by the inflows from the sale of property, plant and equipment, intangible, financial and other non-current assets. The Group total cash flow used in financing activities in the fourth quarter amounted to USD 0.7 billion compared to USD 1.5 billion in the prior-year period. The current year includes a cash outflow for treasury share transactions of USD 1.9 billion which was partially offset by the net proceeds of USD 1.2 billion from the issue of new EUR bonds and repayment of other financial debt. The prior-year period included an outflow for treasury shares of USD 0.7 billion and for the net repayment of current debt of USD 0.8 billion. Free cash flow for the fourth quarter was USD 4.4 billion, an increase of 41% or USD 1.3 billion compared to the year-ago period. This was primarily due to higher cash flows from operating activities which mainly benefited from higher hedging gains and lower net working capital. Also contributing were higher proceeds from Novartis Venture Fund divestments and lower investment in property, plant and equipment. Full year Cash flow from Group total operating activities increased to USD 13.9 billion from USD 13.2 billion in 2013, an increase of USD 0.7 billion. This was primarily due to higher operating income adjusted for non-cash items, despite negative currency effects, and increased hedging gains, partially offset by payments for legal settlements and restructuring. The Group’s total investing activities resulted in an inflow of USD 0.9 billion compared to an outflow of USD 3.4 billion in 2013 mainly on account of an inflow from the net proceeds of USD 1.1 billion related to the divestment of the blood transfusion diagnostics unit to Grifols S.A.. In 2014, there were also proceeds from the sale of investments in associated companies included, in particular LTS Lohmann Therapie-Systeme AG and Idenix Pharmaceuticals, Inc. of USD 0.6 billion and USD 0.8 billion respectively and of USD 1.9 billion from the net sale of other marketable securities including maturing long-term deposits. These inflows were offset by outflows of USD 2.6 billion for property, plant and equipment and a net amount of USD 0.7 billion for acquisition of businesses mainly the acquisition of WaveTec (USD 0.4 billion) and other non-current assets, primarily intangible assets. The prior year outflow for investing activities of USD 3.4 billion was primarily related to investments in property, plant and equipment of USD 2.9 billion and a net outflow of USD 0.5 billion for the acquisition of businesses and other non-current assets, mainly intangible assets. The Group total cash flows used in financing activities amounted to USD 8.1 billion compared to USD 8.8 billion in 2013. The current year includes the dividend payment of USD 6.8 billion, net treasury share transactions of USD 4.5 billion and a net increase in financial debt of USD 3.3 billion, principally due to the issuance of four bonds totaling USD 5.5 billion reduced by the repayment at maturity of a bond of USD 2.0 billion. In 2013, the dividend payment amounted to USD 6.1 billion, net treasury share transactions were USD 1.2 billion and financial debt decreased by a net amount of USD 1.3 billion.

24/87
Free cash flow for the year was USD 10.8 billion, an increase of 12% or USD 1.2 billion compared to prior year. This was primarily due to higher cash flows from operating activities, which mainly benefited from higher operating income adjusted for non-cash items, despite negative currency effects and, increased hedging gains partially offset by higher investments in intangible assets. Balance sheet Assets There has been a significant reclassification of assets as a result of the portfolio transformation announced on April 22, 2014. Total non-current assets of USD 87.8 billion at December 31, 2014 decreased by USD 7.9 billion as compared to 2013, mainly as a result of the assets transferred to discontinuing operations. Total current assets increased by USD 7.0 billion to USD 37.6 billion at December 31, 2014, also mainly due to the reclassification mentioned above and an increase in cash and marketable securities. Excluding the effect of the reclassifications, total non-current assets decreased by USD 3.7 billion to USD 92.1 billion at December 31, 2014. The reduction of USD 3.3 billion in intangible assets and goodwill was driven by the amortization and impairment charges of USD 3.5 billion. Property, plant and equipment reduced by USD 0.8 billion. This was partially offset by an increase in financial and other non-current assets of USD 0.4 billion. Excluding the effect of reclassifications, trade receivables and other current assets decreased by USD 0.5 billion respectively while inventory remained stable at USD 7.3 billion. The Group has an equivalent of approximately USD 0.4 billion of cash in Venezuela in local currency, which is only slowly being approved for remittance outside of the country. As a result, the Group is exposed to a potential devaluation loss in the income statement on its total intercompany balances with its subsidiaries in Venezuela, which at December 31, 2014 amounted to USD 0.4 billion. The Group continues to use for the consolidation of the financial statements of its Venezuelan subsidiaries the official exchange rate of VEF 6.3/USD, which is applied for health and food imports as published by the Centro Nacional de Comercio Exterior (CENCOEX, formerly CADIVI). Financial debt Total financial debt, including derivatives, amounted to USD 20.4 billion at December 31, 2014 compared to USD 18.0 billion at December 31, 2013. Long-term debt increased by USD 2.6 billion to USD 13.8 billion at December 31, 2014, due to the issuance of four bonds and additional long-term debt totaling USD 5.5 billion and a reclassification to short-term debt of bonds which mature within 12 months totaling USD 2.9 billion. Short-term borrowings amounted to USD 6.6 billion at December 31, 2014 compared to USD 6.8 billion at December 31, 2013. Liabilities At December 31, 2014, trade payables of USD 5.4 billion, other current liabilities of USD 12.5 billion and other non-current liabilities of USD 13.8 billion decreased compared to prior year, mainly due to the reclassification to discontinuing operations. On a comparable basis, trade payables of the Group decreased slightly by USD 0.1 billion compared to the prior year, while other current liabilities and other non-current liabilities increased by USD 0.2 billion and USD 0.3 billion respectively. Group equity The Group’s equity decreased by USD 3.6 billion to USD 70.8 billion at December 31, 2014 mainly on account of currency translation differences of USD 2.2 billion. Net actuarial losses and the repurchase commitment under the share buy-back trading plan further reduced equity by USD 0.8 billion and USD 0.7 billion respectively, while positive impact of the net income of USD 10.3 billion and from share based compensation of USD 1.1 billion were compensated by the dividend payments for 2013 of USD 6.8 billion and net purchases of treasury shares for USD 4.5 billion. Net debt and debt/equity ratio The Group’s liquidity amounted to USD 13.9 billion at December 31, 2014, compared to USD 9.2 billion at December 31, 2013, and net debt decreased over the same period by USD 2.3 billion to USD 6.5 billion. The debt/equity ratio increased to 0.29:1 at December 31, 2014 compared to 0.24:1 at December 31, 2013.

25/87
INNOVATION REVIEW Benefiting from our continued focus on innovation, Novartis has one of the industry’s most competitive pipelines with more than 200 projects in clinical development, including 135 in Pharmaceuticals. Key developments from the fourth quarter of 2014 include:
New approvals and positive opinions
In January 2015, the European Commission (EC) and FDA approved Cosentyx (secukinumab, formerly known as AIN457) as a first-line systemic treatment of moderate-to-severe plaque psoriasis in adults who are candidates for systemic therapy. The EC approval followed a positive recommendation from the Committee for Medicinal Products for Human Use (CHMP), marking the first time that the CHMP has recommended a biologic treatment as first-line systemic, reinforcing the favorable safety profile of Cosentyx. The US decision followed a unanimous recommendation from the FDA’s Dermatologic and Ophthalmic Drugs Advisory Committee.
The Japanese Ministry of Health, Labour and Welfare (MHLW) approved Cosentyx for the treatment of both psoriasis vulgaris and psoriatic arthritis in adults who are not adequately responding to systemic therapies (except for biologics). This decision marked the first country approval for Cosentyx in the world and made it the first interleukin-17A (IL-17A) inhibitor to receive regulatory approval in either of these indications in Japan.
The EC approved Signifor (pasireotide) as a new long-acting release formulation for once-monthly intramuscular injection to treat adult patients with acromegaly for whom surgery is not an option or has not been curative and who are inadequately controlled on treatment with a first-generation somatostatin analogue. The FDA also approved pasireotide, as Signifor LAR, for injectable suspension as a treatment for patients with acromegaly who have had an inadequate response to surgery and/or for whom surgery is not an option.
The EC approved a new indication for Alcon’s Travatan eye drops solution (40µg/mL
travoprost) to decrease elevated intraocular pressure in pediatric patients with ocular hypertension or pediatric glaucoma.
The FDA Ophthalmic Devices Advisory Committee gave a positive recommendation for Alcon’s AcrySof IQ ReSTOR 3.0D Toric Intraocular Lens.
In the EU, Alcon received approval for an expanded range of power parameters for Dailies Total1 contact lenses.
Alcon received FDA approval of Xtoro (finafloxacin otic suspension) 0.3% for the treatment of acute otitis externa, commonly known as swimmer’s ear.
In January 2015, the FDA’s Oncology Drugs Advisory Committee (ODAC) voted unanimously
to recommend approval of Sandoz’ biosimilar filgrastim in all indications currently on the reference product’s (Neupogen®) label. The FDA accepted Sandoz biosimilar application for filgrastim in July, marking the industry’s first filing under the new biosimilar pathway created in the Biologics Price Competition and Innovation Act of 2009.
In January 2015, FDA granted an accelerated approval of Bexsero (Meningococcal Group B Vaccine [recombinant, adsorbed]) for active immunization to prevent invasive meningococcal disease caused by serogroup B (also known as meningitis B) in adolescents and young adults from 10 years through 25 years of age.
Regulatory submissions and filings The last components of the LCZ696 new drug application (NDA) for heart failure with reduced
ejection fraction (HFrEF) were submitted to the FDA, starting the formal review clock. A marketing authorization application was also submitted in the EU, with initiation of the CHMP accelerated assessment in January 2015. The CHMP’s decision to grant accelerated assessment to LCZ696 shortened the review process by 60 days.

26/87
Regulatory applications were submitted to the FDA for QVA149 (indacaterol/glycopyrronium
bromide) and NVA237 (glycopyrronium bromide) in chronic obstructive pulmonary disease (COPD).
The FDA extended its review period by up to three months for the NDA of LBH589
(panobinostat) in combination with bortezomib and dexamethasone for patients with previously treated multiple myeloma. The extension follows an FDA ODAC meeting in November. Regulatory filings for LBH589 were submitted in the EU in May 2014 and in Japan (where it has orphan drug status) in September 2014.
Regulatory applications for a new film-coated tablet formulation of deferasirox (Exjade FCT) were submitted in Canada and Colombia.
Results from ongoing trials and other highlights In the CLEAR study, Cosentyx (secukinumab) demonstrated superiority to Stelara®
(ustekinumab) and met its primary endpoint of achieving Psoriasis Area and Severity Index (PASI) 90, which represents clear or almost clear skin at Week 16. The study also met the secondary endpoint of achieving PASI 75 at Week 4. Safety results were consistent with previously reported Phase III clinical trials for Cosentyx.
Novartis presented results from the MEASURE 1 and MEASURE 2 pivotal Phase III studies for Cosentyx in ankylosing spondylitis (AS) at the American College of Rheumatology Congress. In these studies, Cosentyx met the primary endpoint, demonstrating rapid and statistically significant improvements versus placebo in the signs and symptoms of AS.
At the same meeting, Novartis shared first results from the pivotal Phase III FUTURE 1 and FUTURE 2 studies, which demonstrated rapid and significant clinical improvements with Cosentyx versus placebo in improving the signs and symptoms of psoriatic arthritis.
Following the results of the NURTURE 1 study of AIN457 (secukinumab) in rheumatoid arthritis (RA), in which the study met its primary endpoint but did not reach statistical significance for several pre-specified endpoints, Novartis will discontinue the development program of AIN457 in RA.
New analyses confirmed LCZ696 could change the course of heart failure for patients, with lower incidence of sudden deaths, emergency room visits, hospitalizations, worsening symptoms and need for more intense treatment versus enalapril in HFrEF patients.
In December 2014, Novartis announced positive top-line results from the pivotal Phase III clinical trial programs for QVA149 and NVA237 to support NDAs with the FDA for the long-term maintenance treatment of COPD. The results from the EXPEDITION and GEM clinical trial programs met their primary and secondary endpoints.
Data on investigational chimeric antigen receptor (CAR) therapy CTL019 were presented at
the American Society of Hematology (ASH) annual meeting. In one long-term pediatric study, results showed that 36 of 39 patients with relapsed/refractory acute lymphoblastic leukemia (r/r ALL), or 92%, experienced complete remissions with CTL019. Sustained remissions were achieved up to one year or more with six-month event-free survival of 70% and overall survival of 75%, in most cases without further therapy. All pediatric patients who responded to the therapy experienced a cytokine release syndrome, while their reprogrammed T-cells were expanding. Additional abstracts presented at ASH evaluated the efficacy and safety of CTL019 in the treatment of B-cell cancers including r/r ALL, chronic lymphocytic leukemia and B-cell non-Hodgkin lymphoma. These trials continue to increase the understanding of the science and potential benefit/risk profile of CTL019.
An update involving more than 1,000 patients from the JUMP study – the largest clinical trial of myelofibrosis patients treated with Jakavi (ruxolitinib) to date – supported the safety profile and efficacy benefit of Jakavi, as measured in primary and secondary endpoints, respectively. The findings, which were presented at ASH, showed 69% of patients treated with Jakavi achieved more than 50% reduction in spleen length from baseline and had a clinically

27/87
meaningful improvement in myelofibrosis symptom score, important treatment goals for patients with myelofibrosis.
Six-year results from the randomized Phase III ENESTnd study presented at ASH continue to demonstrate the superiority of Tasigna (nilotinib) compared to Gleevec/Glivec (imatinib) at achieving higher rates of early, deep and sustained molecular responses in newly-diagnosed patients with Philadelphia chromosome-positive chronic myeloid leukemia (Ph+ CML). These data confirmed the favorable risk/benefit profile of Tasigna vs. Gleevec/Glivec in this patient population.
In December 2014, Alcon initiated a Phase III program to evaluate the efficacy and safety of
RTH258 (formerly known as ESBA1008) versus aflibercept in patients with wet age-related macular degeneration (AMD). This program follows positive Phase II study results comparing the safety and efficacy of RTH258 to ranibizumab and aflibercept, respectively.
Results from the Phase III BOLERO-1 trial evaluating Afinitor (everolimus) in combination with trastuzumab and paclitaxel as a first-line treatment in women with human epidermal growth factor receptor-2 positive (HER2+) advanced breast cancer were presented at the San Antonio Breast Cancer Symposium. The trial did not meet the threshold of statistical significance for both primary objectives of the study: progression-free survival (PFS) among patients with HER2+ advanced breast cancer, or the sub-population of women with hormone-receptor negative (HR-) HER2+ advanced breast cancer. However, the PFS benefit of 7 months shown in the HR-/HER2+ population suggests the potential role of PI3K/AKT/mTOR pathway inhibition in HER2+ advanced breast cancer. Novartis is not planning any regulatory submissions for everolimus in HER2+ advanced breast cancer.
The Phase III INFORMS study of fingolimod in primary progressive multiple sclerosis (PPMS) did not meet the primary endpoint. The trial did not show a significant difference between fingolimod and placebo on a combination of disability measures. The safety results were consistent with the well-characterized safety profile of fingolimod in relapsing MS. There are currently no approved treatments that have been shown to change the course of PPMS.
In January 2015, Novartis announced it signed collaboration and licensing agreements with
Intellia Therapeutics for the discovery and development of new medicines using CRISPR genome editing technology (including engineered chimeric antigen receptor T-cells and hematopoietic stem cells) and Caribou Biosciences for the development of drug discovery tools.
In January 2015, Novartis established a joint investment company with Qualcomm Ventures of up to USD 100 million to support early stage companies with technologies, products or services that go “beyond the pill” to benefit physicians and patients. Novartis aims to leverage digital technologies to provide integrated solutions and optimize the value of innovative medicines.

28/87
Selected approvals: US, EU and Japan
Product Active ingredient Indication Approval date Cosentyx (AIN457) secukinumab Psoriasis Japan – December 2014
EU – January 2015 US – January 2015
Cosentyx (AIN457) secukinumab Psoriatic arthritis Japan – December 2014
Signifor LAR pasireotide Acromegaly US – December 2014
Signifor pasireotide Acromegaly EU – November 2014
Selected projects awaiting regulatory decisions
Completed submissions Product Indication US EU Japan News update Cosentyx (AIN457)
Psoriasis
Q4 2013 Q4 2013 Q4 2013
- CHMP opinion in Nov. 2014 for first-line treatment of moderate-to-severe psoriasis patients
- Unanimous recommendation of approval from FDA Advisory Committee in Oct. 2014
- Swissmedic decision expected Q1 2015 following submission in Nov. 2013
- Total country submissions to date: 15 Exjade FCT Iron overload Q2 2014 Jakavi Polycythemia
vera Approved1 Q2 2014 Q3 2014
LBH589 Multiple myeloma Q1 2014 Q2 2014 Q3 2014 - Global filings underway - FDA extended review period by up to
three months for LBH589 NDA - Orphan drug designation in Japan
LCZ696 Chronic heart failure with reduced ejection fraction
Q4 2014 Q4 2014 - Final components submitted to US FDA in Dec. 2014
- MAA submitted in EU, initiation of accelerated assessment
LDE225 (sonidegib)
Advanced basal cell carcinoma
Q3 2014 Q2 2014 - US application submitted Sep. 2014
Seebri Breezhaler (NVA237)
Chronic obstructive pulmonary disease (COPD)
Q4 2014 Approved Approved - US application submitted Dec. 2014
Ultibro Breezhaler (QVA149)
COPD Q4 2014 Approved Approved - US application submitted Dec. 2014
Zykadia (LDK378)
ALK+ non-small cell lung cancer
Approved Q1 2014
1 Novartis licensed ruxolitinib from Incyte Corporation for development and commercialization outside the US. Ruxolitinib is marketed in the US by Incyte under the brand name Jakafi®.

29/87
Selected Pharmaceuticals pipeline projects
Project/ Compound
Potential indication/ Disease area
First planned submissions
Current Phase
News update
Ilaris (ACZ885) Hereditary periodic fevers 2016 III - Umbrella pivotal trial, FPFV June 2014
ACZ885 (canakinumab)
Secondary prevention of cardiovascular events
2017 III - Study fully enrolled
Afinitor/Votubia Non-functioning GI/lung NET
2015 III - RADIANT-4 pivotal trial results expected in Q2 2015
TSC seizures 2016 III - Phase III study enrolling Diffuse large B-cell lymphoma
≥ 2019 III
Cosentyx (AIN457)
Psoriatic arthritis 2015 III - Submission planned in H1 2015 - Phase III data presented at
American College of Rheumatology (ACR) Congress in Nov. 2014
Ankylosing spondylitis 2015 III - Submission planned in H1 2015 - Phase III data presented at ACR in
Nov. 2014 BAF312 Secondary progressive
MS ≥ 2019 III
BCT197 COPD ≥ 2019 II BGJ398 Solid tumors ≥ 2019 IIBGS649 Obese hypogonadotropic
hypogonadism ≥ 2019 II
BKM120 mBC ER+ AI resistant mTOR naive
2015 III - BELLE-2 pivotal trial results expected in Q2 2015
mBC ER+ post AI and mTOR inhibitor
2016 III
Solid tumors ≥ 2019 I BYL719 Solid tumors ≥ 2019 I BYM338 Sporadic inclusion body
myositis 2016 III
Hip fracture ≥ 2019 II Sarcopenia ≥ 2019 II CAD106 Alzheimer’s disease ≥ 2019 II CJM112 Immune disorders ≥ 2019 I CTL019 Adult & pediatric acute
lymphoblastic leukemia 2016 II
Diffuse large B-cell lymphoma
2017 II
EGF816 Solid tumors ≥ 2019 I/II FCR001 Renal Transplant ≥ 2019 II Fovista (OAP030A)
Wet AMD 2016 III
Gilenya Chronic inflammatory demyelinating polyradiculoneuropathy
2017 III
HSC835 Stem cell transplantation ≥ 2019 II INC280 Non-small cell lung
cancer 2018 II
KAE609 Malaria 2017 II KAF156 Malaria ≥ 2019 II LCI699 Cushing’s disease 2017 III LCQ908 Familial chylomicronemia
syndrome 2015 III - Phase III study recruitment
completed LCZ696 Chronic heart failure with
preserved ejection fraction
≥ 2019 III - PARAGON-HF FPFV achieved in Jul. 2014

30/87
LEE011 HR+, HER2 negative advanced breast cancer (in postmenopausal women)
2016
III
- Phase III registration study enrolling
HR+, HER2 negative advanced breast cancer (in premenopausal women)
2018 III - Phase III registration study enrolling
Solid tumors 2018 I LGX818 Solid tumors ≥ 2019 II LIK066 Type II diabetes ≥ 2019 II LJM716 Solid tumors ≥ 2019 I Lucentis Choroidal
neovascularization and macular edema secondary to conditions other than age-related macular degeneration, diabetic macular edema, retinal vein occlusion and pathologic myopia
2016 III
Retinopathy of Prematurity (ROP)
2018 III
MEK1621 NRAS mutant melanoma 2016 III - Phase III study enrolling Low-grade serous ovarian
cancer 2016 III - Phase III study enrolling
Solid tumors ≥ 2019 II MEK1621+LGX818 BRAF mutant melanoma 2016 III - Phase III study enrolling PKC412
Aggressive systemic mastocytosis
2015 II - Final results from pivotal Phase II trial presented at American Society of Hematology Annual Meeting
Acute myeloid leukemia 2015 III QAW039 Asthma ≥ 2019 II Atopic dermatitis ≥ 2019 II QAX576 Allergic diseases ≥ 2019 II QGE031 Asthma ≥ 2019 II RLX030 (serelaxin)
Acute heart failure 2016 III - RELAX2 registration study ongoing - RELAX-ASIA registration study
ongoing Signifor LAR Cushing’s disease 2016 III Tasigna CML treatment-free
remission 2016 II - Study fully enrolled
Tekturna Chronic heart failure 2016 III - Phase III outcome study (ATMOSPHERE) ongoing in heart failure
Zykadia (LDK378)
ALK+ advanced non-small cell lung cancer (first-line, treatment naïve)
2017 III - Phase III study enrolling
1 Conditional on completion of the previously announced transactions with GSK, we expect to return our rights in MEK162 to Array BioPharma Inc.

31/87
Selected Alcon pipeline projects
Project/ Compound
Potential indication/ Disease area
Planned submissions
Current Phase
News update
SURGICAL AcrySof IQ ReSTOR IOL 2.5D
Cataract US 2013 JP 2013
Filed Approved
- Filing occurred Aug. 2013 - Approved Apr. 2014
AcrySof IQ ReSTOR Toric IOL 2.5D
Cataract US 2015 JP 2014
Advanced Filed - Filing occurred Jul. 2014
AcrySof IQ ReSTOR 3.0D Toric IOL
Cataract US 2013 JP 2013
Filed Approved
- Filing occurred Aug. 2013 - Approved Jan. 2014
AcrySof IQ ReSTOR 3.0D Toric IOL diopter range expansion
Cataract US 2015 JP 2015
Advanced Advanced
Intrepid IOL Cataract US 2017 EU 2016 JP 2017
Redeveloped - Project being redeveloped
Centurion Phaco Platform
Cataract US 2012 EU 2013 JP 2013
Approved - Approved May 2014
Verion Surgical Planning System
Cataract US 2013 EU 2013 JP 2014
Approved - Launched Jun. 2014 - Launched Jun. 2014 - Approved Mar. 2014
LenSx Laser Cataract JP 2013 Approved - Approved Sep. 2014 LenSx Laser, system expansion
Refractive US 2013 EU 2013 JP 2015
Approved Approved Advanced
- Approved Apr. 2013 - Approved Sep. 2013
OPHTHALMIC PHARMACEUTICALS Brinzolamide/ Brimonidine fixed combination
Glaucoma US 2012 EU 2013
Approved Approved
- Approved Apr. 2013 - Approved Jul. 2014
IZBA, travoprost 0.003%
Glaucoma US 2013 EU 2012
Approved Approved
- Approved May 2014 - Approved Feb. 2014
JETREA Retina EU 2011 JP 2015
Approved Phase III
- Approved Mar. 2013
RTH258 (ESBA1008) Retina Phase III - Phase III development initiated Dec. 2014
Olopatadine 0.77% Allergy US 2014
Approved - Approved Dec. 2014
EXE844 Otic infections US 2014 Filed - Filing occurred Apr. 2014 VISION CARE New lens care solution
Lens care solution US 2014 EU 2014 JP 2015
Filed Approved Advanced
- Filing occurred Sep. 2014 - Approved Sept. 2014

32/87
Selected Sandoz pipeline projects (biosimilars)
Project/ Compound
Potential indication/ Disease area
Submissions Current Phase
News update
EP2006 (filgrastim)
Chemotherapy-induced neutropenia; mobilization of peripheral blood progenitor cells and others intravenous (same as originator)
Submitted in US in Q3
III - ODAC voted for approval in all indications (14-0)
GP2013 (rituximab)
Non-Hodgkin lymphoma, chronic lymphocytic leukemia, rheumatoid arthritis, granulomatosis with polyangiitis (also known as Wegener’s granulomatosis), and microscopic polyangiitis and others (same as originator)
II and III - Recruitment in Phase III follicular lymphoma trial completed in Jan. 2015
GP2015 (etanercept)
Arthritidies (rheumatoid arthritis, ankylosing spondylitis, psoriatic arthritis), plaque psoriasis and others (same as originator)
III - Patient enrollment complete
GP2017 (adalimumab)
Arthritidies (rheumatoid arthritis, ankylosing spondylitis, psoriatic arthritis), plaque psoriasis and others (same as originator)
III
LA-EP2006 (pegfilgrastim)
Chemotherapy-induced neutropenia and others (same as originator)
III - Trial complete
Selected Vaccines pipeline projects
Project/ Compound
Potential indication/ Disease area
Planned submissions
Current Phase
News update
Bexsero (US)
Multi-component vaccine for prevention of meningococcal disease (serogroup B)
Started
Filing - FDA granted accelerated approval in January 2015
Flucelvax (US) Prevention of influenza disease in persons 18 years of age and older
Complete Approved - Approved by FDA for adults - US BLA for age 4 and older
submitted Q4 2014 Fluad (US) Prevention of seasonal
influenza (trivalent subunit vaccine with MF59 adjuvant)
2014 Filing - US BLA submitted in Q4 2014
Quadrivalent Influenza Vaccine (QIV)
Prevention of seasonal influenza
≥2015
III - Phase III trials for adjuvanted (aQIV) ongoing and cell-based (QIVc) QIVs completed
MenABCWY Prevention of meningococcal disease (serogroups A, B, C, Y and W-135)
≥2015 II - Phase III in preparation
Group B streptococcus
Prevention of group B streptococcus
≥2015 II - Phase III in preparation
Pandemic influenza vaccines
Universal vaccination in case of an influenza pandemic
NA NA - H7N9 clinical study completed - US Department of Health and
Human Services (HHS) purchased stockpile
Staph. aureus
Prevention of Staphylococcus aureus
≥2015 I
TdaP Prevention of Tetanus, Diphtheria, Pertussis
≥2015 I

33/87
CONDENSED CONSOLIDATED FINANCIAL STATEMENTS
Consolidated income statements
Fourth quarter (unaudited) Q4 2014 Q4 2013 Change
USD m USD m USD m
Net sales to third parties from continuing operations 13 075 13 389 -314
Sales to discontinuing segments 55 51 4
Net sales from continuing operations 13 130 13 440 -310
Other revenues 224 188 36
Cost of goods sold -4 416 -4 428 12
Gross profit from continuing operations 8 938 9 200 -262
Marketing & Sales -3 229 -3 451 222
Research & Development -2 537 -2 486 -51
General & Administration -736 -695 -41
Other income 606 513 93
Other expense -691 -748 57
Operating income from continuing operations 2 351 2 333 18
Income from associated companies 580 155 425
Interest expense -188 -163 -25
Other financial income and expense 13 -42 55
Income before taxes from continuing operations 2 756 2 283 473
Taxes -308 -268 -40
Net income from continuing operations 2 448 2 015 433
Net loss/income from discontinuing operations -961 43 -1 004
Total net income 1 487 2 058 -571
Attributable to:
Shareholders of Novartis AG 1 491 2 029 -538
Non-controlling interests -4 29 -33
Average number of shares outstanding – Basic (million) 2 408 2 432 -24
Basic earnings per share from continuing operations (USD) 1 1.02 0.82 0.20
Basic earnings per share from discontinuing operations (USD) 1 -0.40 0.01 -0.41
Total basic earnings per share (USD) 1 0.62 0.83 -0.21
Average number of shares outstanding – Diluted (million) 2 449 2 469 -20
Diluted earnings per share from continuing operations (USD) 1 1.00 0.81 0.19
Diluted earnings per share from discontinuing operations (USD) 1 -0.39 0.01 -0.40
Total diluted earnings per share (USD) 1 0.61 0.82 -0.21
1 Earnings per share (EPS) is calculated on the amount of net income attributable to shareholders of Novartis AG.

34/87
Consolidated income statements
Full year (audited) FY 2014 FY 2013 Change
USD m USD m USD m
Net sales to third parties from continuing operations 52 180 51 869 311
Sales to discontinuing segments 239 221 18
Net sales from continuing operations 52 419 52 090 329
Other revenues 1 215 626 589
Cost of goods sold -17 345 -16 579 -766
Gross profit from continuing operations 36 289 36 137 152
Marketing & Sales -12 377 -12 638 261
Research & Development -9 086 -9 071 -15
General & Administration -2 616 -2 603 -13
Other income 1 391 1 205 186
Other expense -2 512 -2 047 -465
Operating income from continuing operations 11 089 10 983 106
Income from associated companies 1 918 599 1 319
Interest expense -704 -683 -21
Other financial income and expense -31 -92 61
Income before taxes from continuing operations 12 272 10 807 1 465
Taxes -1 545 -1 498 -47
Net income from continuing operations 10 727 9 309 1 418
Net loss from discontinuing operations -447 -17 -430
Net income 10 280 9 292 988
Attributable to:
Shareholders of Novartis AG 10 210 9 175 1 035
Non-controlling interests 70 117 -47
Average number of shares outstanding – Basic (million) 2 426 2 441 -15
Basic earnings per share from continuing operations (USD) 1 4.39 3.76 0.63
Basic earnings per share from discontinuing operations (USD) 1 -0.18 0.00 -0.18
Total basic earnings per share (USD) 1 4.21 3.76 0.45
Average number of shares outstanding – Diluted (million) 2 470 2 479 -9
Diluted earnings per share from continuing operations (USD) 1 4.31 3.70 0.61
Diluted earnings per share from discontinuing operations (USD) 1 -0.18 0.00 -0.18
Total diluted earnings per share (USD) 1 4.13 3.70 0.43
1 Earnings per share (EPS) is calculated on the amount of net income attributable to shareholders of Novartis AG.

35/87
Consolidated statements of comprehensive income
Fourth quarter (unaudited) Q4 2014 Q4 2013 Change
USD m USD m USD m
Net income 1 487 2 058 -571
Other comprehensive income to be eventually recycled
into the consolidated income statement:
Fair value adjustments on financial instruments, net of taxes 78 -60 138
Novartis share of other items recorded in comprehensive
income recognized by associated companies, net of taxes 5 7 -2
Translation effects -873 472 -1 345
Total of items to eventually recycle -790 419 -1 209
Other comprehensive income never to be recycled
into the consolidated income statement:
Net actuarial gains from defined benefit plans, net
of taxes 320 344 -24
Comprehensive income 1 017 2 821 -1 804
Attributable to:
Shareholders of Novartis AG 1 022 2 791 -1 769
Continuing operations 2 022 2 740 -718
Discontinuing operations -1 000 51 -1 051
Non-controlling interests -5 30 -35
Full year (audited) FY 2014 FY 2013 Change
USD m USD m USD m
Net income 10 280 9 292 988
Other comprehensive income to be eventually recycled
into the consolidated income statement:
Fair value adjustments on financial instruments, net of taxes 110 173 -63
Novartis share of other items recorded in comprehensive
income recognized by associated companies, net of taxes -5 5 -10
Translation effects -2 220 676 -2 896
Total of items to eventually recycle -2 115 854 -2 969
Other comprehensive income never to be recycled
into the consolidated income statement:
Net actuarial (losses)/gains from defined benefit plans, net
of taxes -822 1 504 -2 326
Comprehensive income 7 343 11 650 -4 307
Attributable to:
Shareholders of Novartis AG 7 274 11 538 -4 264
Continuing operations 7 820 11 512 -3 692
Discontinuing operations -546 26 -572
Non-controlling interests 69 112 -43

36/87
Condensed consolidated balance sheets (audited) Dec 31, Dec 31,
2014 2013 Change
USD m USD m USD m
Assets
Non-current assets
Property, plant & equipment 15 983 18 197 -2 214
Goodwill 29 311 31 026 -1 715
Intangible assets other than goodwill 23 832 27 841 -4 009
Financial and other non-current assets 18 700 18 648 52
Total non-current assets 87 826 95 712 -7 886
Current assets
Inventories 6 093 7 267 -1 174
Trade receivables 8 275 9 902 -1 627
Other current assets 2 530 3 392 -862
Cash and cash equivalents, marketable securities,
commodities and derivatives 13 862 9 222 4 640
Assets related to discontinuing operations 6 801 759 6 042
Total current assets 37 561 30 542 7 019
Total assets 125 387 126 254 -867
Equity and liabilities
Equity attributable to Novartis AG shareholders 70 766 74 343 -3 577
Non-controlling interests 78 129 -51
Total equity 70 844 74 472 -3 628
Non-current liabilities
Financial debts 13 799 11 242 2 557
Other non-current liabilities 13 771 14 172 -401
Total non-current liabilities 27 570 25 414 2 156
Current liabilities
Trade payables 5 419 6 148 -729
Financial debts and derivatives 6 612 6 776 -164
Other current liabilities 12 524 13 394 -870
Liabilities related to discontinuing operations 2 418 50 2 368
Total current liabilities 26 973 26 368 605
Total liabilities 54 543 51 782 2 761
Total equity and liabilities 125 387 126 254 -867

37/87
Condensed consolidated changes in equity
Fourth quarter (unaudited) Q4 2014 Q4 2013 Change
USD m USD m USD m
Consolidated equity at October 1 71 424 72 179 -755
Comprehensive income 1 017 2 821 -1 804
Purchase of treasury shares -1 891 -770 -1 121
Treasury share repurchase commitment under a
share buy-back trading plan 17 17
Increase in equity from exercise of options and
employee transactions 3 12 -9
Equity-based compensation 277 263 14
Change in non-controlling interests -3 -33 30
Consolidated equity at December 31 70 844 74 472 -3 628
Full year (audited) FY 2014 FY 2013 Change
USD m USD m USD m
Consolidated equity at January 1 74 472 69 263 5 209
Comprehensive income 7 343 11 650 -4 307
Purchase of treasury shares -6 926 -2 990 -3 936
Treasury share repurchase commitment under a
share buy-back trading plan -658 -658
Increase in equity from exercise of options and
employee transactions 2 400 1 691 709
Dividends related to shareholders of Novartis AG -6 810 -6 100 -710
Equity-based compensation 1 143 1 077 66
Impact of change in ownership of consolidated entities -10 10
Change in non-controlling interests -120 -109 -11
Consolidated equity at December 31 70 844 74 472 -3 628

38/87
Condensed consolidated cash flow statements
Fourth quarter (unaudited) Q4 2014 Q4 2013 Change
USD m USD m USD m
Net income from continuing operations 2 448 2 015 433
Reversal of non-cash items
Taxes 308 268 40
Depreciation, amortization and impairments 1 291 1 211 80
Change in provisions and other non-current liabilities 316 204 112
Income from associated companies -580 -155 -425
Net financial income 175 205 -30
Other -118 -6 -112
Net income adjusted for non-cash items 3 840 3 742 98
Interest and other financial receipts 394 -65 459
Interest and other financial payments -168 -90 -78
Taxes paid 1 -559 -509 -50
Cash flows before working capital changes
from continuing operations 3 507 3 078 429
Payments out of provisions and other
net cash movements in non-current liabilities -251 -302 51
Change in net current assets
and other operating cash flow items 1 467 1 186 281
Cash flows from operating activities
from continuing operations 4 723 3 962 761
Cash flows from operating activities
from discontinuing operations 1 482 488 -6
Total cash flows from operating activities 5 205 4 450 755
Purchase of property, plant & equipment -830 -1 048 218
Purchase of intangible, financial
and other non-current assets -304 -218 -86
Proceeds from sales of property, plant & equipment,
intangible, financial and other non-current assets 366 179 187
Acquisitions of businesses -350 -350
Change in marketable securities, commodities
and net divestment proceeds of associated companies 331 -1 524 1 855
Cash flows used in investing activities
from continuing operations -787 -2 611 1 824
Cash flows used in investing activities
from discontinuing operations 1 -132 -44 -88
Total cash flows used in investing activities -919 -2 655 1 736
Change in current and non-current financial debts 1 157 -746 1 903
Treasury share transactions, net -1 899 -707 -1 192
Other financing cash flows -65 65
Cash flows used in financing activities -742 -1 518 776
Net translation effect on cash and cash equivalents -162 47 -209
Change in cash and cash equivalents 3 382 324 3 058
Cash and cash equivalents at October 1 9 641 6 363 3 278
Cash and cash equivalents at December 31 13 023 6 687 6 336
1 In Q4 2014, total Group tax payments amounted to USD 692 million when also taking into account payments of USD 19 million and USD 114 million, included in the cash flows from operating activities and investing activities, respectively, of discontinuing operations.

39/87
Condensed consolidated cash flow statements
Full year (audited) FY 2014 FY 2013 Change
USD m USD m USD m
Net income from continuing operations 10 727 9 309 1 418
Reversal of non-cash items
Taxes 1 545 1 498 47
Depreciation, amortization and impairments 4 751 4 462 289
Change in provisions and other non-current liabilities 1 490 736 754
Income from associated companies -1 918 -599 -1 319
Net financial income 735 775 -40
Other 122 307 -185
Net income adjusted for non-cash items 17 452 16 488 964
Interest and other financial receipts 1 067 539 528
Interest and other financial payments -692 -631 -61
Taxes paid 1 -2 179 -2 054 -125
Cash flows before working capital changes
from continuing operations 15 648 14 342 1 306
Payments out of provisions and other
net cash movements in non-current liabilities -1 125 -947 -178
Change in net current assets
and other operating cash flow items -625 -778 153
Cash flows from operating activities
from continuing operations 13 898 12 617 1 281
Cash flows used in/from operating activities
from discontinuing operations 1 -1 557 -558
Total cash flows from operating activities 13 897 13 174 723
Purchase of property, plant & equipment -2 624 -2 903 279
Purchase of intangible, financial
and other non-current assets -1 079 -665 -414
Proceeds from sales of property, plant & equipment,
intangible, financial and other non-current assets 739 472 267
Acquisitions of businesses -331 -42 -289
Change in marketable securities, commodities
and net divestment proceeds of associated companies 3 287 -81 3 368
Cash flows used in investing activities
from continuing operations -8 -3 219 3 211
Cash flows from/used in investing activities
from discontinuing operations 1 889 -133 1 022
Total cash flows from/used in investing activities 881 -3 352 4 233
Dividends related to shareholders of Novartis AG -6 810 -6 100 -710
Change in current and non-current financial debts 3 318 -1 333 4 651
Treasury share transactions, net -4 515 -1 237 -3 278
Impact of change in ownership
of consolidated enities 4 -4
Other financing cash flows -140 -103 -37
Cash flows used in financing activities -8 147 -8 769 622
Net translation effect on cash and cash equivalents -295 82 -377
Change in cash and cash equivalents 6 336 1 135 5 201
Cash and cash equivalents at January 1 6 687 5 552 1 135
Cash and cash equivalents at December 31 13 023 6 687 6 336
1 In FY 2014, total Group tax payments amounted to USD 2.6 billion when also taking into account payments of USD 7 million and USD 459 million, included in the cash flows from operating activities and investing activities, respectively, of discontinuing operations.

40/87
Notes to the Condensed Interim Consolidated Financial Statements for the three- and twelve-month periods ended December 31, 2014 (audited)
1. Basis of preparation
These Condensed Interim Consolidated Financial Statements for the three- and twelve-month periods ended December 31, 2014, were prepared in accordance with International Accounting Standard 34 Interim Financial Reporting and accounting policies set out in the 2014 Annual Report published on January 27, 2015.
2. Selected critical accounting policies
The Group’s principal accounting policies are set out in note 1 to the Consolidated Financial Statements in the 2014 Annual Report and conform with International Financial Reporting Standards (IFRS) as issued by the International Accounting Standards Board. The presentation of financial statements requires management to make subjective and complex judgments that affect the reported amounts. Because of the inherent uncertainties, actual outcomes and results may differ from management’s assumptions and estimates. In particular, as discussed in note 11 of the 2014 Annual Report, goodwill, Alcon brand name and acquired In-Process Research & Development projects are reviewed for impairment at least annually and these, as well as all other investments in intangible assets, are reviewed for impairment whenever an event or decision occurs that raises concern about their balance sheet carrying value. The amount of goodwill and other intangible assets on the Group’s consolidated balance sheet has risen significantly in recent years, primarily from acquisitions. Impairment testing under IFRS may lead to potentially significant impairment charges in the future that could have a materially adverse impact on the Group’s financial results.
The determination of the contingent consideration in respect of acquisitions also requires management to make assumptions on the probability and amount of potential payments due to previous owners. If actual payments are different to the estimated amounts recorded for contingent consideration there could be a significant impact, either positive or negative, on the Group’s financial results.
3. Significant transactions
Vaccines – Divestment of blood transfusion diagnostics unitOn January 9, 2014, Novartis completed the divestment of its blood transfusion diagnostics unit to the Spanish company Grifols S.A., for USD 1.7 billion in cash. The pre-tax gain on this transaction was approximately USD 0.9 billion and was recorded in operating income from discontinuing operations.
Pharmaceuticals – Acquisition of CoStim Pharmaceuticals, Inc.On February 17, 2014, Novartis acquired all of the outstanding shares of CoStim Pharmaceuticals, Inc., a Cambridge, Massachusetts, US-based, privately held biotechnology company focused on harnessing the immune system to eliminate immune-blocking signals from cancer, for a total purchase consideration of USD 248 million (excluding cash acquired). This amount consists of an initial cash payment and the net present value of contingent consideration of USD 153 million due to previous CoStim’s shareholders, which they are eligible to receive upon the achievement of specified development and commercialization milestones. The purchase price allocation resulted in net identified assets of USD 152 million (excluding cash acquired) and goodwill of USD 96 million. Results of operations since the acquisition were not material.
Pharmaceuticals – Divestment of Idenix Pharmaceuticals, Inc. (Idenix) shareholdingOn August 5, 2014, Merck & Co., USA completed a tender offer for Idenix. As a result, Novartis divested its 22% shareholding in Idenix and realized a gain of approximately USD 0.8 billion which was recorded in income from associated companies.
Corporate – Divestment of LTS Lohmann Therapie-Systeme AG (LTS) shareholding On November 5, 2014, Novartis divested its 43% shareholding in LTS and realized a gain of approximately USD 0.4 billion which was recorded in income from associated companies.

41/87
Alcon – Acquisition of WaveTec Vision Systems, Inc. (WaveTec) On October 16, 2014, Alcon acquired all of the outstanding shares of WaveTec, a privately held company, for USD 350 million in cash. The purchase price allocation resulted in net identified assets of USD 180 million and goodwill of USD 170 million. Results of operations since the acquisition were not material.
Major pending transactions
Transaction with Eli Lilly and CompanyOn April 22, 2014, Novartis entered into an agreement with Eli Lilly and Company, USA (Lilly) to divest its Animal Health business to Lilly for approximately USD 5.4 billion in cash to be paid on closing. This transaction closed on January 1, 2015 and will result in a pre-tax gain of approximately USD 4.6 billion.
Transactions with GlaxoSmithKline plcOn April 22, 2014 (and as amended and restated on May 29, 2014), Novartis entered into the following agreements with GlaxoSmithKline plc, Great Britain (GSK). These transactions with GSK are inter-conditional and were approved by GSK shareholders in December 2014. They are still subject to other closing conditions, including regulatory approvals. The transactions are expected to close during the first half of 2015.
Pharmaceuticals – Acquisition of GSK oncology productsNovartis has agreed to acquire GSK’s oncology products for an aggregate cash consideration of USD 16 billion. Up to USD 1.5 billion of this cash consideration is contingent on certain development milestones. In addition, under the terms of the agreement, Novartis was granted a right of first negotiation over the co-development or commercialization to GSK’s current and future oncology R&D pipeline, excluding oncology vaccines. The right of first negotiation is for a period of 12.5 years, from the acquisition closing date.
Vaccines – DivestmentNovartis has agreed to divest its Vaccines business to GSK for up to USD 7.1 billion plus royalties. The USD 7.1 billion consists of USD 5.25 billion to be paid on closing and up to USD 1.8 billion in future milestone payments. Novartis’s Vaccines influenza business is excluded from the GSK Vaccines business acquisition. However, GSK has entered into a future option arrangement with Novartis in relation to the Vaccines influenza business, pursuant to which Novartis may unilaterally require GSK to acquire the entire or certain parts of its vaccines influenza business for consideration of up to USD 250 million (the Influenza Put Option) if the divestment to CSL Limited, Australia (CSL), discussed below, is not completed. The option period is 18 months, beginning the earlier of the GSK transaction closing date and October 22, 2015. Novartis paid GSK a fee of USD 5 million in consideration for the grant of the Influenza Put Option.
Consumer Health – Combination of Novartis OTC with GSK consumer healthcare in a joint ventureNovartis and GSK have agreed to create a combined consumer healthcare business through a joint venture between Novartis OTC and GSK consumer healthcare. Upon completion, Novartis will own a 36.5% share of the joint venture and will have four of eleven seats on the joint venture’s Board. Furthermore, Novartis will have customary minority rights and also exit rights at a pre-defined, market-based pricing mechanism. The investment will be accounted for using the equity method of accounting.
Transaction with CSLOn October 26, 2014 Novartis entered into a transaction with CSL to sell its Vaccines influenza business to CSL for USD 275 million. This transaction is expected to be completed in the second half of 2015, subject to all necessary regulatory approvals.
Entering into the separate divestment agreement with CSL resulted in the vaccine influenza business being a separate cash generating unit within the Vaccines Division, requiring the performance of a separate valuation of the influenza vaccines business net assets. This triggered the recognition of an exceptional impairment charge of approximately USD 1.1 billion (pre-tax), as the book value of the influenza vaccines business net assets was above the USD 275 million consideration to be paid by CSL.

42/87
Classification as discontinuing operationsThese major pending transactions, combined with the divestment of the blood transfusion diagnostics unit which closed on January 9, 2014, result from the portfolio review which commenced in mid-2013.
As a result, Novartis is required to separate the Group’s reported financial data for the current and prior year into “discontinuing” and “continuing” operations.
Discontinuing operations include the Animal Health Division, the OTC Division, and the Vaccines Division including the USD 0.9 billion pre-tax gain arising from the USD 1.7 billion divestment of the blood transfusion diagnostics unit to Grifols S.A., completed on January 9, 2014, and related prior-year results for this unit’s activity. Excluded from discontinuing operations are certain intellectual property rights and related other revenues of the Vaccines Division which are retained by Novartis and are now reported under Corporate activities. Also included in discontinuing operations, under Corporate, are certain transaction related expenses.
As required by IFRS, 2014 results exclude from the portfolio transformation announcement date any further depreciation and amortization related to discontinuing operations.
Continuing operations comprise all other activities of the Novartis Group, including the Pharmaceuticals, Alcon and Sandoz Divisions and the retained Corporate activities.
Continuing operations do not yet include the results from Oncology assets to be acquired from GSK on closing of the transaction or the results from the 36.5% interest in the GSK/Novartis consumer healthcare joint venture that will be created at the same time.
There were no significant acquisition or divestment transactions in 2013.

43/87
4. Summary of equity attributable to Novartis AG shareholders
Issued share capital and reserves Number of outstanding shares attributable to Novartis AG (in millions) shareholders FY 2014 FY 2013 Change
2014 2013 Change USD m USD m USD m
Balance at beginning of year 2 426.1 2 420.6 5.5 74 343 69 137 5 206
Shares acquired to be held
in Group Treasury -46.8 -33.3 -13.5 -4 057 -2 464 -1 593
Shares acquired to be cancelled -27.0 -2.2 -24.8 -2 396 -170 -2 226
Other share purchases -5.4 -4.8 -0.6 -473 -356 -117
Increase in equity from exercise of
options and employee transactions 41.4 34.3 7.1 2 400 1 691 709
Equity-based compensation 10.3 11.5 -1.2 1 143 1 077 66
Treasury share repurchase commitment
under a share buy-back trading plan -658 -658
Dividends -6 810 -6 100 -710
Net income of the period attributable to
shareholders of Novartis AG 10 210 9 175 1 035
Other comprehensive income attributable
to shareholders of Novartis AG -2 936 2 363 -5 299
Impact of change in ownership of
consolidated entities -10 10
Balance at December 31 2 398.6 2 426.1 -27.5 70 766 74 343 -3 577

44/87
5. Consolidated income statements – Segmentation – Fourth quarter
Total Total continuing discontinuing Group Pharmaceuticals Alcon Sandoz Corporate operations operations eliminations Total Group
Q4 2014 Q4 2013 Q4 2014 Q4 2013 Q4 2014 Q4 2013 Q4 2014 Q4 2013 Q4 2014 Q4 2013 Q4 2014 Q4 2013 Q4 2014 Q4 2013 Q4 2014 Q4 2013
USD m USD m USD m USD m USD m USD m USD m USD m USD m USD m USD m USD m USD m USD m USD m USD m
Net sales to third parties 7 860 8 323 2 703 2 655 2 512 2 411 13 075 13 389 1 558 1 689 14 633 15 078
Sales to other segments 61 35 11 10 70 77 -87 -71 55 51 14 14 -69 -65
Net sales 7 921 8 358 2 714 2 665 2 582 2 488 -87 -71 13 130 13 440 1 572 1 703 -69 -65 14 633 15 078
Other revenues 171 127 10 7 3 6 40 48 224 188 16 97 240 285
Cost of goods sold -1 709 -1 773 -1 320 -1 308 -1 527 -1 480 140 133 -4 416 -4 428 -1 022 -949 69 65 -5 369 -5 312
Gross profit 6 383 6 712 1 404 1 364 1 058 1 014 93 110 8 938 9 200 566 851 0 0 9 504 10 051
Marketing & Sales -2 157 -2 357 -641 -648 -431 -446 -3 229 -3 451 -447 -503 -3 676 -3 954
Research & Development -2 073 -1 990 -247 -287 -217 -209 -2 537 -2 486 -216 -211 -2 753 -2 697
General & Administration -294 -272 -162 -150 -102 -104 -178 -169 -736 -695 -108 -127 -844 -822
Other income 215 317 42 51 37 41 312 104 606 513 91 53 -8 -4 689 562
Other expense -463 -397 -31 -158 -55 -20 -142 -173 -691 -748 -1 065 -23 8 4 -1 748 -767
Operating income 1 611 2 013 365 172 290 276 85 -128 2 351 2 333 -1 179 40 0 0 1 172 2 373
as % of net sales 20.5% 24.2% 13.5% 6.5% 11.5% 11.4% 18.0% 17.4% -75.7% 2.4% 8.0% 15.7%
Income from associated companies 1 579 155 580 155 -1 -1 579 154
Interest expense -188 -163 -188 -163
Other financial income and expense 13 -42 13 -42
Income before taxes 2 756 2 283 -1 180 39 1 576 2 322
Taxes -308 -268 219 4 -89 -264
Net income 2 448 2 015 -961 43 1 487 2 058

45/87
Consolidated income statements – Segmentation – Full year
Total Total continuing discontinuing Group Pharmaceuticals Alcon Sandoz Corporate operations operations eliminations Total Group
FY 2014 FY 2013 FY 2014 FY 2013 FY 2014 FY 2013 FY 2014 FY 2013 FY 2014 FY 2013 FY 2014 FY 2013 FY 2014 FY 2013 FY 2014 FY 2013
USD m USD m USD m USD m USD m USD m USD m USD m USD m USD m USD m USD m USD m USD m USD m USD m
Net sales to third parties 31 791 32 214 10 827 10 496 9 562 9 159 52 180 51 869 5 816 6 051 57 996 57 920
Sales to other segments 262 202 49 50 286 294 -358 -325 239 221 78 72 -317 -293
Net sales 32 053 32 416 10 876 10 546 9 848 9 453 -358 -325 52 419 52 090 5 894 6 123 -317 -293 57 996 57 920
Other revenues 629 497 34 27 12 18 540 84 1 215 626 65 285 1 280 911
Cost of goods sold -6 889 -6 655 -5 193 -4 900 -5 751 -5 476 488 452 -17 345 -16 579 -3 073 -3 322 317 293 -20 101 -19 608
Gross profit 25 793 26 258 5 717 5 673 4 109 3 995 670 211 36 289 36 137 2 886 3 086 0 0 39 175 39 223
Marketing & Sales -8 178 -8 514 -2 474 -2 452 -1 725 -1 672 -12 377 -12 638 -1 812 -1 911 -14 189 -14 549
Research & Development -7 331 -7 242 -928 -1 042 -827 -787 -9 086 -9 071 -857 -781 -9 943 -9 852
General & Administration -1 009 -1 051 -613 -589 -376 -374 -618 -589 -2 616 -2 603 -431 -457 -3 047 -3 060
Other income 734 699 79 79 97 106 481 321 1 391 1 205 1 007 174 -18 -12 2 380 1 367
Other expense -1 538 -774 -184 -437 -190 -240 -600 -596 -2 512 -2 047 -1 146 -184 18 12 -3 640 -2 219
Operating income 8 471 9 376 1 597 1 232 1 088 1 028 -67 -653 11 089 10 983 -353 -73 0 0 10 736 10 910
as % of net sales 26.6% 29.1% 14.8% 11.7% 11.4% 11.2% 21.3% 21.2% -6.1% -1.2% 18.5% 18.8%
Income from associated companies 812 4 2 1 102 597 1 918 599 2 1 1 920 600
Interest expense -704 -683 -704 -683
Other financial income and expense -31 -92 -31 -92
Income before taxes 12 272 10 807 -351 -72 11 921 10 735
Taxes -1 545 -1 498 -96 55 -1 641 -1 443
Net income 10 727 9 309 -447 -17 10 280 9 292

46/87
Discontinuing operations – Segmentation – Fourth quarter
Vaccines Corporate
as previously Transfers to (including Discontinuing published 1 Consumer Health continuing Corporate 2 eliminations) operations
Q4 2014 Q4 2013 Q4 2014 Q4 2013 Q4 2014 Q4 2013 Q4 2014 Q4 2013 Q4 2014 Q4 2013
USD m USD m USD m USD m USD m USD m USD m USD m USD m USD m
Net sales to third parties of discontinuing operations 494 655 1 064 1 034 1 558 1 689
Sales to other segments 19 11 -5 3 14 14
Net sales of discontinuing operations 513 666 1 059 1 037 1 572 1 703
Other revenues 8 135 8 10 -48 16 97
Cost of goods sold -584 -511 -438 -442 4 -1 022 -949
Gross profit of discontinuing operations -63 290 629 605 -44 566 851
Marketing & Sales -74 -91 -373 -412 -447 -503
Research & Development -141 -132 -75 -79 -216 -211
General & Administration -32 -38 -76 -87 -2 -108 -127
Other income 10 24 83 22 -2 7 91 53
Other expense -784 -11 -16 -1 1 -265 -12 -1 065 -23
Operating loss/income of discontinuing operations -1 084 42 172 48 -43 -267 -7 -1 179 40
as % of net sales -219.4% 6.4% 16.2% 4.6% -75.7% 2.4%
Income from associated companies -1 -1 -1 -1
Loss/income before taxes of discontinuing operations -1 180 39
Taxes 219 4
Net loss/income of discontinuing operations -961 43
1 2013 includes the divested blood transfusion diagnostics unit2 Other revenue contains royalties and out-licensing revenues of Vaccines which are to be retained by Novartis.

47/87
Discontinuing operations – Segmentation – Full year
Vaccines Corporate
as previously Transfers to (including Discontinuing published 1 Consumer Health continuing Corporate 2 eliminations) operations
FY 2014 FY 2013 FY 2014 FY 2013 FY 2014 FY 2013 FY 2014 FY 2013 FY 2014 FY 2013
USD m USD m USD m USD m USD m USD m USD m USD m USD m USD m
Net sales to third parties of discontinuing operations 1 537 1 987 4 279 4 064 5 816 6 051
Sales to other segments 65 61 13 11 78 72
Net sales of discontinuing operations 1 602 2 048 4 292 4 075 5 894 6 123
Other revenues 32 333 33 36 -84 65 285
Cost of goods sold -1 336 -1 578 -1 737 -1 751 7 -3 073 -3 322
Gross profit of discontinuing operations 298 803 2 588 2 360 -77 2 886 3 086
Marketing & Sales -280 -334 -1 532 -1 577 -1 812 -1 911
Research & Development -545 -476 -312 -305 -857 -781
General & Administration -118 -140 -313 -316 -1 -431 -457
Other income 905 70 99 79 3 25 1 007 174
Other expense -812 -88 -60 -63 4 -274 -37 -1 146 -184
Operating loss of discontinuing operations -552 -165 470 178 -73 -271 -13 -353 -73
as % of net sales -35.9% -8.3% 11.0% 4.4% -6.1% -1.2%
Income from associated companies 2 1 2 1
Loss before taxes of discontinuing operations -351 -72
Taxes -96 55
Net loss of discontinuing operations -447 -17 1 2013 includes the divested blood transfusion diagnostics unit2 Other revenue contains royalties and out-licensing revenues of Vaccines which are to be retained by Novartis.

48/87
Discontinuing operations – Condensed balance sheet (audited)
Dec 31, Dec 31, 2014 2013
USD m USD m
Assets
Property, plant & equipment 1 411 145
Goodwill and other intangible assets 2 462 358
Financial and other non-current assets 352 10
Inventories 1 155 87
Trade receivables and other current assets 1 421 159
Total assets related to discontinuing operations and held for sale 6 801 759
Liabilities
Other non-current liabilities 706
Trade payables and other current liabilities 1 712 50
Total liabilities related to discontinuing operations and held for sale 2 418 50

49/87
6. Financial instrumentsThe following table illustrates the three hierarchical levels for valuing financial instruments at fair value and also those measured at amortized cost or at cost as of December 31, 2014 and December 31, 2013. For additional information on the hierarchies and other matters, please refer to the Consolidated Financial Statements in the 2014 Annual Report, published on January 27, 2015. Valued at amortized Level 1 Level 2 Level 3 cost or cost Total
Dec 31, Dec 31, Dec 31, Dec 31, Dec 31, Dec 31, Dec 31, Dec 31, Dec 31, Dec 31,
2014 2013 2014 2013 2014 2013 2014 2013 2014 2013
(audited) (audited) (audited) (audited) (audited) (audited) (audited) (audited) (audited) (audited)
USD m USD m USD m USD m USD m USD m USD m USD m USD m USD m
Debt securities 301 294 26 29 327 323
Equity securities 15 21 26 15 47
Fund investments 29 6 11 35 11
Total available-for-sale marketable securities 345 315 26 29 6 37 377 381
Time deposits with original maturity more than 90 days 6 1 931 6 1 931
Derivative financial instruments 356 121 356 121
Accrued interest on debt securities 3 5 3 5
Total marketable securities, time deposits and derivative financial instruments 345 315 382 150 6 37 9 1 936 742 2 438
Available-for-sale financial investments 605 458 332 366 937 824
Fund investments 71 52 71 52
Long-term loans and receivables, advances, security deposits 712 647 712 647
Financial investments and long-term loans 605 458 403 418 712 647 1 720 1 523
Associated companies 66 168 234
Total associated companies at fair value through profit or loss 66 168 234
Contingent consideration -756 -572 -756 -572
Derivative financial instruments -52 -103 -52 -103
Total financial liabilities at fair value -52 -103 -756 -572 -808 -675
With effect from January 1, 2014, in order to have consistent valuation methods for all venture capital fund investments, the Group has commenced valuing its fund investments with a voting share interest in excess of 20%, at fair value instead of using the equity method of accounting. For reasons of materiality this new accounting policy is applied prospectively. Apart from this change, there were no other changes in the full year to the valuation techniques used for financial instruments nor significant transfers from one level to the other nor significant transactions associated with level 3 financial instruments.
The fair value of straight bonds amounted to USD 17.0 billion at December 31, 2014 (USD 13.5 billion at December 31, 2013) compared to the balance sheet value of USD 16.0 billion (USD 12.9 billion at December 31, 2013). For all other financial assets and liabilities, the carrying amount is a reasonable approximation of the fair value. The carrying amount of financial assets included in the line financial and other non-current assets amounted to USD 1.7 billion at December 31, 2014 (USD 1.5 billion at December 31, 2013).
The Group’s exposure to financial risks has not changed significantly during the period and there have been no major changes to the risk management department or in any risk management policies.
50/87
7. Legal proceedings update
A number of Novartis companies are, and will likely continue to be, subject to various legal proceedings, including litigations, arbitrations and governmental investigations, that arise from time to time. Legal proceedings are inherently unpredictable. As a result, the Group may become subject to substantial liabilities that may not be covered by insurance and may in the future incur judgments or enter into settlements of claims that could have a material adverse effect on its results of operations or cash flow. Note 20 to the consolidated financial statements contained in our annual report for the year ended December 31, 2013 contains a summary as of the date of that report of significant legal proceedings to which Novartis or its subsidiaries were a party. The following is a summary as of January 26, 2015 of potentially significant developments in those proceedings, as well as any new potentially significant proceedings commenced since the date of the last annual report. Reference is also made to note 20 to the consolidated financial statements contained in our annual report for the year ended December 31, 2014 for a summary of significant legal proceedings.
Investigations and related litigationsSouthern District of New York (SDNY) marketing practices investigation and litigationIn April 2013, the US government filed a civil complaint in intervention to an individual qui tam action against Novartis Pharmaceuticals Corporation (NPC) in the United States District Court (USDC) for the SDNY involving several of NPC’s cardiovascular medications. The suit is related to a previously disclosed 2011 investigation of the United States Attorney’s Office (USAO) for the SDNY relating to marketing practices, including the remuneration of healthcare providers, in connection with three NPC products (Lotrel, Starlix and Valturna). The complaint, as subsequently amended, asserts federal False Claims Act and common law claims with respect to speaker programs for NPC’s cardiovascular medications allegedly serving as mechanisms to provide kickbacks to healthcare professionals. It seeks unspecified damages, which according to the complaint are “substantial”, including treble damages and maximum civil penalties per claim, as well as disgorgement of Novartis profits from the alleged unlawful conduct. In August 2013, New York State filed a civil complaint in intervention asserting similar claims. Neither government complaint in intervention adopted the individual relator’s claims with respect to off-label promotion of Valturna, which were subsequently dismissed with prejudice by the court. NPC vigorously contests the SDNY, New York State and individual claims, both as to alleged liability and amount of damages and penalties.
SDNY specialty pharmacies investigation and litigationIn April 2013, the US government filed a civil complaint in intervention to a qui tam action against NPC in the USDC for the SDNY. The suit is related to a previously disclosed 2012 investigation of the USAO for the SDNY into NPC’s interactions with certain specialty pharmacies concerning in particular Myfortic, Exjade, Gleevec, Tasigna and TOBI. The complaint, as subsequently amended, asserts federal False Claims Act and state law claims related to alleged unlawful contractual discounts and rebates to specialty pharmacies in connection with Myfortic, and alleged unlawful contractual discounts, rebates and patient referrals to one specialty pharmacy in connection with Exjade. The US government seeks unspecified damages, which according to the complaint are “substantial”, including treble damages and maximum civil penalties per claim. In January 2014, eleven states filed three complaints in intervention asserting similar claims related to Exjade; and the qui tam relator served on NPC an amended complaint also asserting similar claims with respect to Myfortic and Exjade, as well as claims involving Tasigna, Gleevec and TOBI that the federal and various state governments declined to pursue. NPC vigorously contests all government and relator claims, both as to alleged liability and amount of damages and penalties.
District of New Jersey (DNJ) investigationIn late September 2014, Alcon Laboratories, Inc. (ALI) received a subpoena from the USAO for the DNJ relating to an investigation of Alcon sales practices. ALI is cooperating with this investigation.
New York state investigationIn November 2014, ALI received a civil subpoena from the New York state attorney general relating to an investigation into a unilateral pricing policy program. ALI is at the outset of assessing the facts and is cooperating with this investigation.

51/87
Lucentis/Avastin® matters in Italy and FranceIn 2013, the Italian Competition Authority (ICA) opened an investigation to assess whether Novartis Farma S.p.A., Novartis AG, F. Hoffmann-La Roche AG, Genentech Inc. and Roche S.p.A. colluded to artificially differentiate Avastin® and Lucentis in order to avoid the erosion of the sales of Lucentis by off-label Avastin® with the aim of preserving the market position of Lucentis in Italy. In March 2014, the ICA imposed a fine equivalent to USD 125 million on Novartis AG and Novartis Farma S.p.A. and a fine on F. Hoffmann-La Roche AG and Roche S.p.A. equivalent to USD 122 million. Novartis appealed the ICA decision and, as required by Italian law, has paid the ICA fine, subject to the right to later claim recoupment. In December 2014, the Tribunale amministrativo regionale (TAR) del Lazio published a decision rejecting all appeals. Novartis intends to appeal the decision of the TAR Lazio. In October 2014, Novartis also appealed the resolution of the Italian Medicines Agency to include Avastin® in a list of drugs to be reimbursed off-label. The Italian Ministry of Health (MoH) has indicated in a letter that it intended to seek a total equivalent of approximately USD 1.4 billion in damages from Novartis and Roche entities based on the above allegations, and the Lombardia region has sent a payment request equivalent to approximately USD 71 million. Novartis vigorously contests the MoH and Lombardia claims.
The French Competition Authority carried out an inspection in April 2014 on the premises of Novartis Groupe France and Roche with respect to the French market for anti-vascular endothelial growth factor (VEGF) products indicated for the treatment of wet age-related macular degeneration.
Japan investigationsNovartis Pharma K.K. (NPKK) has completed a comprehensive investigation with external specialists launched in April 2013 which identified that two former employees of NPKK were not appropriately identified as NPKK employees in the trial publications for five post-registration investigator initiated trials (IITs) regarding valsartan. In October 2013, the Japanese Ministry of Health, Labor and Welfare (MHLW) published an interim report in which it required further actions, including investigations by the government into allegations of exaggerated advertising. None of the trials/publications were used for registration purposes. In July 2014, the Tokyo District Public Prosecutor Office indicted a former NPKK employee, and also NPKK under the dual liability concept in Japanese law, in two counts for alleged manipulation of data in sub-analysis publications of the Kyoto Heart Study regarding valsartan. The charges against NPKK are subject to a maximum total fine of JPY 4 million. Novartis is cooperating fully with the authorities.
Also in January 2014, allegations of inappropriate involvement of NPKK representatives in a nilotinib IIT being conducted by the University of Tokyo Hospital were raised in the media. In February 2014, NPKK established an External Investigation Committee (EIC) to clarify the actual involvement in the IIT as well as the root cause and provide a proposal for preventing recurrence. In March 2014, the EIC issued a final report finding various instances of improper conduct, including improper handling of confidential patient information, document destruction and failure to report adverse events. The MHLW issued a business improvement order in July 2014, following NPKK’s disclosure of its failure to report adverse events. Novartis is implementing a business improvement plan and has notified all competent health authorities worldwide about the adverse events reporting issue, and several have requested additional information and clarification from Novartis. In addition to taking remedial action, Novartis also conducted a comprehensive review of NPKK’s conduct and business practices related to IITs and the other above issues in Japan, and has released new global guidelines for IITs.
The MHLW plans to issue new guidelines governing the conduct of IITs in Japan, and it is in the process of determining any additional sanctions against NPKK for the above conduct which could potentially include a temporary suspension of certain business activities.
Italy investigationsIn January 2014, the ICA opened an investigation to assess whether Novartis Farma S.p.A. and Italfarmaco S.p.A. colluded on the supply of octreotide acetate (Sandostatin LAR and Longastatina® LAR, respectively) to prevent competition in tenders issued by the regions of Emilia Romagna, Veneto and Lombardia.
In June 2014, the public prosecutor of Siena initiated a criminal investigation of Novartis Vaccines and Diagnostics S.r.l. with respect to allegations that the transfer price of the adjuvant MF59 was unlawfully marked up. The investigation concerns whether the Focetria and Fluad vaccines sold to the government

52/87
were over-priced and whether the Italian Ministry of Health paid an inflated amount in a dispute settlement relating to the supply of Focetria during the 2009 pandemic.
Product liability mattersZometa/Aredia product liability litigationNPC is a defendant in approximately 525 remaining cases brought in US courts, in which plaintiffs claim to have experienced osteonecrosis of the jaw or atypical femur fracture after treatment with Zometa or Aredia, which are used to treat patients whose cancer has spread to the bones. From the outset of the litigation, approximately 332 cases have been dismissed on pre-trial summary judgment or other dismissal, of which 16 remain on appeal.
Through the end of the fourth quarter of 2014, judgment has been entered in favor of NPC in nine jury trials, seven of which are final, and plaintiffs have obtained one verdict outside the centralized proceedings and six verdicts in the centralized litigation. In the centralized proceedings, juries awarded compensatory damages (averaging approximately USD 0.7 million in each case), no punitive damages in four cases, and punitive damages (as capped by applicable state and federal laws) totaling approximately USD 1.8 million in the remaining two. Four of the verdicts in favor of plaintiffs in the centralized litigation are not final given remaining post-trial and appeal options in each. In the one plaintiff’s verdict outside the centralized proceedings, the jury awarded USD 2.65 million in compensatory damages and no punitive damages.
Further trials are scheduled. Individual case results, which can depend on the particular facts of a given case, may not necessarily be predictive for other cases. The cases are being vigorously defended.
ArbitrationFanapt® arbitration: ConcludedIn May 2014, Vanda Pharmaceuticals Inc. commenced an arbitration against Novartis Pharma AG relating to the licensing of Fanapt®. The case was resolved in the fourth quarter of 2014 for an amount that is not material to Novartis.
Other MattersAverage Wholesale Price (AWP) litigationClaims have been brought by various US state governmental entities against various pharmaceutical companies, including certain Sandoz entities and NPC, alleging that they fraudulently overstated the AWP that is or has been used by payors, including state Medicaid agencies, to calculate reimbursements to healthcare providers. In the second quarter of 2014, Sandoz reached a settlement of the Illinois claims against it for USD 63 million. Further settlements have been obtained in the cases brought by the states of Kansas and Utah against NPC, each for amounts that are not material to Novartis. Actions brought by the states of Illinois, Mississippi, Utah and Wisconsin remain pending against one or more Novartis companies. At least one trial is scheduled for 2015. NPC is also a defendant in a putative class action brought by private payors in New Jersey. The cases are being vigorously defended.
Qui tam actionIn 2006, NPC received a subpoena from the US government seeking certain information regarding the marketing and promotion of Xolair. The investigation, which was previously disclosed, was prompted by a qui tam complaint filed in the District of Massachusetts (D. Mass.) in 2006, asserting various federal False Claims Act and state claims relating to certain alleged improper marketing practices involving Xolair. In addition to the 2006 suit, relator complaints were filed in D. Mass. in 2010 and 2012 against various Novartis, Genentech and Roche entities, containing allegations similar to those in the 2006 complaint. In 2011, the US and various state governments declined to intervene in the relators’ actions, and closed the investigation. In June 2014, the relator in the 2010 action voluntarily dismissed his claims in that complaint with prejudice; the US and various states subsequently consented to the dismissal. The relator complaints in combination claim more than USD 1.5 billion in alleged treble damages, civil penalties and disgorgement of profits. Novartis denies the allegations both as to the merits and the monetary claims and is vigorously contesting these actions.
Consumer class actionsNovartis companies have been the subject of various consumer lawsuits that are brought as proposed class actions but in which class certification has not been decided. For example, four putative class actions were brought in December 2013 and January 2014 against Novartis and its consumer health

53/87
unit. They generally claim that it was a deceptive practice to sell Excedrin Migraine at a higher price than Excedrin Extra Strength when the two have the same active ingredients, even though the products have different labels and clearly disclose their active ingredients. In 2014, three of the four putative class actions were dismissed; the remaining one is pending in the DNJ.
Since November 2012, six putative consumer fraud class action litigations were commenced against Alcon (and in four cases Sandoz) in federal courts in the Southern Districts of Illinois (S.D. Ill.) and Florida and the Districts of Missouri, Massachusetts and New Jersey. They claim that Alcon’s, Sandoz’s and many other manufacturers defendants’ eye drop products were deceptively designed so that the drop dosage is more than necessary to be absorbed in the eye or there is too much solution in each bottle for the course of the treatment, leading to wastage and higher costs to patient consumers. Three cases remain pending in the S.D. Ill., D. Mass. and DNJ. Novartis is vigorously defending the remaining cases, both on the merits and with respect to class certification.
In addition to the matters described above, there have been other developments in the other legal matters described in Note 20 to the consolidated financial statements contained in our annual report for the year ended December 31, 2013. These do not significantly affect the assessment of management concerning the adequacy of the total provisions recorded for legal proceedings.
8. Subsequent event
Divestment of Animal Health businessOn January 1, 2015, Novartis completed the divestment of its Animal Health division to Eli Lilly and Company, USA, for approximately USD 5.4 billion. This will result in a pre-tax gain of approximately USD 4.6 billion.

54/87
SUPPLEMENTARY INFORMATION (unaudited)
Non-IFRS disclosures
Core results
The Group’s core results – including core operating income, core net income and core earnings per share – exclude the amortization of intangible assets, impairment charges, expenses relating to the integration of acquisitions as well as other income and expense items that are, or are expected to accumulate within the year to be, over a USD 25 million threshold that management deems exceptional.
Novartis believes that investor understanding of the Group’s performance is enhanced by disclosing core measures of performance because, since they exclude these items which can vary significantly from year to year, the core measures enable better comparison across years. For this same reason, Novartis uses these core measures in addition to IFRS and other measures as important factors in assessing the Group’s performance.
The following are examples of how these core measures are utilized:
• InadditiontomonthlyreportscontainingfinancialinformationpreparedunderInternationalFinancial Reporting Standards (IFRS), senior management receives a monthly analysis incorporating these core measures.
• AnnualbudgetsarepreparedthatincludetargetsforbothIFRSandcoremeasures.
Despite the use of these measures by management in setting goals and measuring the Group’s performance, these are non-IFRS measures that have no standardized meaning prescribed by IFRS. As a result, such measures have limits in usefulness to investors.
Because of their non-standardized definitions, the core measures (unlike IFRS measures) may not be comparable to the calculation of similar measures of other companies. These core measures are presented solely to permit investors to more fully understand how the Group’s management assesses underlying performance. These core measures are not, and should not be viewed as, a substitute for IFRS measures.
As an internal measure of Group performance, these core measures have limitations, and the performance management process is not solely restricted to these metrics. A limitation of the core measures is that they provide a view of the Group’s operations without including all events during a period, such as the effects of an acquisition or amortization of purchased intangible assets.
2013 results excluding Diagnostics unit
On January 9, 2014, Novartis completed the divestment to Grifols S.A. of our former blood transfusion diagnostics unit, which had been included in our former Vaccines and Diagnostics Division. Because the divestment occurred near the beginning of 2014, Novartis believes that investor understanding of the Group’s performance would be enhanced by disclosing a comparison of the Novartis 2014 results against 2013 results that exclude the results of the divested business, since it will assist investors in evaluating the Group’s performance on a more comparable basis from year to year. For this reason, management has used this comparison, in addition to IFRS and other measures, in its assessments of the Group’s performance.
Constant currencies
Changes in the relative values of non-US currencies to the US dollar can affect the Group’s financial results and financial position. To provide additional information that may be useful to investors, including changes in sales volume, we present information about our net sales and various values relating to operating and net income that are adjusted for such foreign currency effects.
Constant currency calculations have the goal of eliminating two exchange rate effects so that an estimate can be made of underlying changes in the consolidated income statement excluding the impact of fluctuations in exchanges rates:

55/87
• theimpactoftranslatingtheincomestatementsofconsolidatedentitiesfromtheirnon-USDfunctional currencies to USD; and
• theimpactofexchangeratemovementsonthemajortransactionsofconsolidatedentitiesperformed in currencies other than their functional currency.
We calculate constant currency measures by translating the current year’s foreign currency values of the sales and earnings into USD using the average exchange rates from the prior year and comparing them to the prior year values in USD.
We use these constant currency measures in evaluating the Group’s performance, since they may assist us in evaluating our ongoing performance from year to year. However, in performing our evaluation, we also consider equivalent measures of performance which are not affected by changes in the relative value of currencies.
Growth rate calculation
For ease of understanding, Novartis uses a sign convention for its growth rates such that a reduction in operating expenses or losses compared to the prior year is shown as a positive growth.
Net debt and free cash flow
Net debt and free cash flow are non-IFRS financial measures, which means they should not be interpreted as measures determined under IFRS. Net debt is presented as additional information because management believes it is a useful supplemental indicator of the Group’s ability to pay dividends, to meet financial commitments and to invest in new strategic opportunities, including strengthening its balance sheet. Free cash flow is presented as additional information because management believes it is a useful supplemental indicator of the Group’s ability to operate without reliance on additional borrowing or usage of existing cash. Free cash flow is a measure of the net cash generated that is available for debt repayment, investment in strategic opportunities and for returning to shareholders. Novartis uses free cash flow in internal comparisons of results from the Group’s divisions. Free cash flow of the divisions uses the same definition as for the Group. No tax or financial receipts or payments are included in the division calculations. The definition of free cash flow used by Novartis does not include amounts related to changes in investments in associated companies nor related to acquisitions or divestments of subsidiaries. Free cash flow is not intended to be a substitute measure for cash flow from operating activities as determined under IFRS.

56/87
CORE RESULTS – Reconciliation from IFRS results to core results – Group – Fourth quarter Total Corporate Total continuing discontinuing Pharmaceuticals Alcon Sandoz continuing operations operations operations Total
Q4 2014 Q4 2013 Q4 2014 Q4 2013 Q4 2014 Q4 2013 Q4 2014 Q4 2013 Q4 2014 Q4 2013 Q4 2014 Q4 2013 Q4 2014 Q4 2013
USD m USD m USD m USD m USD m USD m USD m USD m USD m USD m USD m USD m USD m USD m
IFRS Operating income 1 611 2 013 365 172 290 276 85 -128 2 351 2 333 -1 179 40 1 172 2 373
Adjustment for divested blood transfusion
diagnostics unit -95 -95
Operating income excl. Diagnostics 1 611 2 013 365 172 290 276 85 -128 2 351 2 333 -1 179 -55 1 172 2 278
Amortization of intangible assets 67 70 522 517 96 105 1 686 692 57 686 749
Impairments
Intangible assets 155 19 12 167 19 405 572 19
Property, plant & equipment related to the
Group-wide rationalization of manufacturing sites 2 -1 1 1 2
Other property, plant & equipment -6 53 5 1 1 17 71 737 1 737 72
Financial assets 6 14 1 43 6 50 20 50 20
Total impairment charges 157 86 -1 18 1 44 23 218 110 1 143 1 1 361 111
Acquisition or divestment related items
- Income 4 4
- Expense 26 121 26 121 196 222 121
Total acquisition or divestment
related items, net 26 121 26 121 200 226 121
Other exceptional items
Exceptional divestment gains -34 -125 -248 -282 -125 -282 -125
Restructuring items
- Income -13 -28 -11 -24 -28 1 -23 -28
- Expense 220 85 21 41 12 253 126 2 -3 255 123
Legal-related items
- Expense 5 -10 30 30 -5 30 -5
Additional exceptional income -59 -34 -29 -44 -4 -1 -88 -83 -81 1 -169 -82
Additional exceptional expense 2 61 28 44 5 29 39 59 149 7 2 66 151
Total other exceptional items 116 -36 9 41 12 -9 -189 38 -52 34 -71 -123 34
Total adjustments 366 120 530 679 126 97 -144 61 878 957 1 272 58 2 150 1 015
Core operating income 1 977 2 133 895 851 416 373 -59 -67 3 229 3 290 93 3 3 322 3 293
as % of net sales 25.2% 25.6% 33.1% 32.1% 16.6% 15.5% 24.7% 24.6% 6.0% 0.2% 22.7% 22.1%
Income from associated companies 1 579 155 580 155 -1 -1 579 154
Core adjustments to income from associated
companies, net of tax -370 44 -370 44 -370 44
Interest expense -188 -163 -188 -163
Other financial income and expense 13 -42 13 -42
Taxes (adjusted for above items) -407 -418 -35 24 -442 -394
Core net income 2 857 2 866 57 26 2 914 2 892
Core net income attributable to shareholders 2 860 2 836 58 27 2 918 2 863
Core EPS (USD) 1.19 1.17 0.02 0.01 1.21 1.18

57/87
CORE RESULTS – Reconciliation from IFRS results to core results – Group – Full year Total Corporate Total continuing discontinuing Pharmaceuticals Alcon Sandoz continuing operations operations operations Total
FY 2014 FY 2013 FY 2014 FY 2013 FY 2014 FY 2013 FY 2014 FY 2013 FY 2014 FY 2013 FY 2014 FY 2013 FY 2014 FY 2013
USD m USD m USD m USD m USD m USD m USD m USD m USD m USD m USD m USD m USD m USD m
IFRS Operating income 8 471 9 376 1 597 1 232 1 088 1 028 -67 -653 11 089 10 983 -353 -73 10 736 10 910
Adjustment for divested blood transfusion
diagnostics unit -239 -239
Operating income excl. Diagnostics 8 471 9 376 1 597 1 232 1 088 1 028 -67 -653 11 089 10 983 -353 -312 10 736 10 671
Amortization of intangible assets 276 278 2 064 1 989 400 409 3 4 2 743 2 680 73 220 2 816 2 900
Impairments
Intangible assets 231 29 7 57 39 20 277 106 405 8 682 114
Property, plant & equipment related to the
Group-wide rationalization of manufacturing sites 23 1 23 1 -1 33 22 34
Other property, plant & equipment -8 28 -1 4 7 -3 23 17 21 46 737 758 46
Financial assets 20 16 1 91 41 112 57 8 112 65
Total impairment charges 266 74 6 61 47 17 114 58 433 210 1 141 49 1 574 259
Acquisition or divestment related items
- Income -876 -876
- Expense 33 330 1 33 331 196 229 331
Total acquisition or divestment
related items, net 33 330 1 33 331 -680 -647 331
Other exceptional items
Exceptional divestment gains -237 -313 -294 -531 -313 -531 -313
Restructuring items
- Income -56 -40 -24 -3 -83 -40 -7 -90 -40
- Expense 632 122 95 77 21 2 1 749 201 28 25 777 226
Legal-related items
- Income -2 -2
- Expense 125 33 85 30 155 118 155 118
Additional exceptional income -158 -70 -29 -56 -4 -315 -75 -502 -205 -81 -583 -205
Additional exceptional expense 162 63 102 61 18 4 105 114 387 242 24 2 411 244
Total other exceptional items 468 -205 144 82 36 87 -473 39 175 3 -38 27 137 30
Total adjustments 1 043 147 2 214 2 462 483 513 -356 102 3 384 3 224 496 296 3 880 3 520
Core operating income 9 514 9 523 3 811 3 694 1 571 1 541 -423 -551 14 473 14 207 143 -16 14 616 14 191
as % of net sales 29.9% 29.6% 35.2% 35.2% 16.4% 16.8% 27.7% 27.4% 2.5% -0.3% 25.2% 24.7%
Income from associated companies 812 4 2 1 102 597 1 918 599 2 1 1 920 600
Core adjustments to income from associated
companies, net of tax -812 -163 277 -975 277 -975 277
Interest expense -704 -683 -704 -683
Other financial income and expense 1 -31 -48 -31 -48
Taxes (adjusted for above items) -2 028 -2 057 -43 71 -2 071 -1 986
Core net income 12 653 12 295 102 56 12 755 12 351
Core net income attributable to shareholders 12 580 12 175 105 59 12 685 12 234
Core EPS (USD) 5.19 4.99 0.04 0.02 5.23 5.01
1 2013 adjusted for USD 44 million devaluation loss.

58/87
CORE RESULTS – Reconciliation from IFRS results to core results – Group – Fourth quarter
Acquisition or
divestment related
items, including Q4 2013
restructuring Other Core results
Q4 2014 Amortization of and integration exceptional Q4 2014 excluding
IFRS results intangible assets 1 Impairments 2 charges 3 items 4 Core results Diagnostics 5
USD millions USD millions USD millions USD millions USD millions USD millions USD millions
Gross profit 9 504 672 254 47 10 477 10 671
Operating income 1 172 686 1 361 226 -123 3 322 3 293
Income before taxes 1 576 736 1 362 226 -544 3 356 3 286
Taxes 6 -89 -442 -394
Net income 1 487 2 914 2 892
EPS (USD) 7 0.62 1.21 1.18
The following are adjustments to arrive at Core Gross Profit
Cost of goods sold -5 369 672 254 47 -4 396 -4 462
The following are adjustments to arrive at Core Operating Income
Marketing & Sales -3 676 7 -3 669 -3 913
Research & Development -2 753 13 215 -6 -2 531 -2 601
General & Administration -844 23 -821 -807
Other income 689 -9 4 -476 208 315
Other expense -1 748 1 901 222 282 -342 -372
The following are adjustments to arrive at Core Income before taxes
Income from associated companies 579 50 1 -421 209 198
1 Amortization of intangible assets: Cost of goods sold includes recurring amortization of acquired rights to in-market products and other production-related intangible assets; Research & Development includes the recurring amortization of acquired rights for technology platforms; Other expense includes amortization of intangible assets; Income from associated companies includes USD 50 million for the Novartis share of the estimated Roche core items.
2 Impairments: Cost of goods sold, Research & Development, Other income and Other expense include principally net impairment charges or reversals related to intangible assets, property, plant and equipment and financial assets; Cost of goods sold and Other expense include the USD 1.1 billion impairment charge as a result of the proposed sale of the influenza vaccines business; Other expense also includes an additional impairment charge incurred in Corporate, for an in-process project which is pending divestment as a result of the proposed portfolio transformation transactions.
3 Acquisition or divestment related items, including restructuring and integration charges: Other income includes an adjustment to the gain on the disposal of the blood transfusion diagnostics unit on January 9, 2014; Other expense includes costs related to the planned acquisition of GSK oncology assets as well as professional service fees related to the portfolio transformation divestment activities.
4 Other exceptional items: Cost of goods sold includes charges for the Group-wide rationalization of manufacturing sites; Marketing & Sales, Research & Development and General & Administration include charges for transforming IT and finance processes; Other income includes manufacturing sites rationalization gains, product related divestment gains and gains in the Novartis Venture Fund, and the impact from a post-retirement medical plan amendment; Other expense also includes restructuring provision charges, charges for transforming IT, and a write-off of a receivable as a result of the proposed portfolio transformation transactions; Income from associated companies includes the gain from the divestment of the Lohmann shareholding.
5 2013 figures exclude the blood transfusion diagnostics unit which was divested on January 9, 2014.6 Taxes on the adjustments between IFRS and core results take into account, for each individual item included in the adjustment, the tax rate that will finally be applicable to the item based on the jurisdiction where the
adjustment will finally have a tax impact. Generally, this results in amortization and impairment of intangible assets and acquisition-related restructuring and integration items having a full tax impact. There is usually a tax impact on exceptional items although this is not the case for items arising from criminal settlements in certain jurisdictions. Adjustments related to income from associated companies are recorded net of any related tax effect. Due to these factors and the differing effective tax rates in the various jurisdictions, the tax on the total adjustments of USD 1.8 billion to arrive at the core results before tax amounts to USD 353 million. The average tax rate on the adjustments is 19.8% due to the adjustment required in the quarter by applying the estimated full year tax charge to the year-to-date pre-tax income of the period.
7 Earnings per share (EPS) is calculated on the amount of net income attributable to shareholders of Novartis AG.

59/87
CORE RESULTS – Reconciliation from IFRS results to core results – Group – Full year
Acquisition or
divestment related
items, including FY 2013
restructuring Other Core results
FY 2014 Amortization of and integration exceptional FY 2014 excluding
IFRS results intangible assets 1 Impairments 2 charges 3 items 4 Core results Diagnostics 5
USD millions USD millions USD millions USD millions USD millions USD millions USD millions
Gross profit 39 175 2 757 281 -120 42 093 41 763
Operating income 10 736 2 816 1 574 -647 137 14 616 14 191
Income before taxes 11 921 3 073 1 575 -647 -1 096 14 826 14 337
Taxes 6 -1 641 -2 071 -1 986
Net income 10 280 12 755 12 351
EPS (USD) 7 4.21 5.23 5.01
The following are adjustments to arrive at Core Gross Profit
Other revenues 1 280 -302 978 699
Cost of goods sold -20 101 2 757 281 182 -16 881 -16 291
The following are adjustments to arrive at Core Operating Income
Marketing & Sales -14 189 22 -14 167 -14 477
Research & Development -9 943 56 298 17 -9 572 -9 613
General & Administration -3 047 64 -2 983 -3 014
Other income 2 380 -16 -876 -902 586 799
Other expense -3 640 3 1 011 229 1 056 -1 341 -1 267
The following are adjustments to arrive at Core Income before taxes
Income from associated companies 1 920 257 1 -1 233 945 877
1 Amortization of intangible assets: Cost of goods sold includes recurring amortization of acquired rights to in-market products and other production-related intangible assets; Research & Development includes the recurring amortization of acquired rights for technology platforms; Other expense includes amortization of intangible assets; Income from associated companies includes USD 257 million for the Novartis share of the estimated Roche core items.
2 Impairments: Cost of goods sold, Research & Development, Other income and Other expense consist principally of net impairment charges or reversals related to intangible assets, property, plant and equipment and financial assets; Cost of goods sold and Other expense also include the USD 1.1 billion impairment charge as a result of the proposed sale of the influenza vaccines business; Other expense also includes an additional impairment charge incurred in Corporate, for an in-process project which is pending divestment as a result of the proposed portfolio transformation transactions.
3 Acquisition or divestment related items, including restructuring and integration charges: Other income includes the gain on the disposal of the blood transfusion diagnostics unit on January 9, 2014; Other expense includes costs related to the planned acquisition of GSK oncology assets as well as professional service fees related to the portfolio transformation divestment activities.
4 Other exceptional items: Other revenues includes an amount for a commercial settlement; Cost of goods sold includes charges for the Group-wide rationalization of manufacturing sites; Marketing & Sales, Research & Development and General & Administration include charges for transforming IT and finance processes; Other income includes product related divestment gains and gains in the Novartis Venture Fund, an insurance recovery net of a deferred amount, a partial reversal of a legal expense provision, a reduction in restructuring provisions, and the impact from a post-retirement medical plan amendment; Other expense includes restructuring provision charges, charges for transforming IT and finance processes, an expense related to Lucentis in Italy, the expense of USD 204 million related to the advancement of the timing of recording the US Healthcare Fee liability as a result of final regulations, and a write-off of a receivable as a result of the proposed portfolio transformation transactions; Income from associated companies includes gains from the divestment of Idenix and Lohmann shareholdings.
5 2013 figures exclude the blood transfusion diagnostics unit which was divested on January 9, 2014.6 Taxes on the adjustments between IFRS and core results take into account, for each individual item included in the adjustment, the tax rate that will finally be applicable to the item based on the jurisdiction where the
adjustment will finally have a tax impact. Generally, this results in amortization and impairment of intangible assets and acquisition-related restructuring and integration items having a full tax impact. There is usually a tax impact on exceptional items although this is not the case for items arising from criminal settlements in certain jurisdictions. Adjustments related to income from associated companies are recorded net of any related tax effect. Due to these factors and the differing effective tax rates in the various jurisdictions, the tax on the total adjustments of USD 2.9 billion to arrive at the core results before tax amounts to USD 430 million. The average tax rate on the adjustments is 14.8 % since the estimated full year tax charge has been applied to the pre-tax income of the period.
7 Earnings per share (EPS) is calculated on the amount of net income attributable to shareholders of Novartis AG.

60/87
CORE RESULTS – Reconciliation from IFRS results to core results – Pharmaceuticals – Fourth quarter
Acquisition or
divestment related
items, including
restructuring Other
Q4 2014 Amortization of and integration exceptional Q4 2014 Q4 2013
IFRS results intangible assets 1 Impairments 2 charges 3 items 4 Core results Core results
USD millions USD millions USD millions USD millions USD millions USD millions USD millions
Gross profit 6 383 59 -58 31 6 415 6 773
Operating income 1 611 67 157 26 116 1 977 2 133
The following are adjustments to arrive at Core Gross Profit
Cost of goods sold -1 709 59 -58 31 -1 677 -1 712
The following are adjustments to arrive at Core Operating Income
Marketing & Sales -2 157 2 -2 155 -2 330
Research & Development -2 073 8 213 -16 -1 868 -1 958
Other income 215 -10 -108 97 118
Other expense -463 12 26 207 -218 -198
1 Amortization of intangible assets: Cost of goods sold includes recurring amortization of acquired rights to in-market products and other production-related intangible assets; Research & Development includes the recurring amortization of acquired rights for technology platforms.
2 Impairments: Cost of good sold includes partial reversal of previously impaired production assets, partly offset by the impairment of intangible assets related to a marketed product; Research & Development includes impairment charges for in process projects and termination of collaboration and license agreements; Other income relates to impairment reversals of property, plant and equipment; Other expense includes impairment charges related to property, plant and equipment and financial assets.
3 Acquisition or divestment related items, including restructuring and integration charges: Other expense includes costs related to the planned acquisition of GSK oncology assets.4 Other exceptional items: Cost of goods sold and Research & Development include net restructuring charges related to the Group-wide rationalization of manufacturing sites; Other income includes gains related to the
rationalization of manufacturing sites, the impact from a post-retirement medical plan amendment, as well as additional gains from divestments announced in prior periods; Other expense includes mostly restructuring charges.

61/87
CORE RESULTS – Reconciliation from IFRS results to core results – Pharmaceuticals – Full year
Acquisition or
divestment related
items, including
restructuring Other
FY 2014 Amortization of and integration exceptional FY 2014 FY 2013
IFRS results intangible assets 1 Impairments 2 charges 3 items 4 Core results Core results
USD millions USD millions USD millions USD millions USD millions USD millions USD millions
Gross profit 25 793 238 -58 127 26 100 26 492
Operating income 8 471 276 266 33 468 9 514 9 523
The following are adjustments to arrive at Core Gross Profit
Cost of goods sold -6 889 238 -58 127 -6 582 -6 421
The following are adjustments to arrive at Core Operating Income
Marketing & Sales -8 178 2 -8 176 -8 487
Research & Development -7 331 38 289 7 -6 997 -7 161
General & Administration -1 009 1 -1 008 -1 051
Other income 734 -13 -451 270 263
Other expense -1 538 48 33 782 -675 -533
1 Amortization of intangible assets: Cost of goods sold includes recurring amortization of acquired rights to in-market products and other production-related intangible assets; Research & Development includes the recurring amortization of acquired rights for technology platforms.
2 Impairments: Cost of good sold includes partial reversal of previously impaired production assets, partly offset by the impairment of intangible assets related to a marketed product; Research & Development includes impairment charges for in process projects and termination of collaboration and license agreements; Other income relates to impairment reversals of property, plant and equipment; Other expense includes impairment charges related to property, plant and equipment and financial assets.
3 Acquisition or divestment related items, including restructuring and integration charges: Other expense includes costs related to the planned acquisition of GSK oncology assets.4 Other exceptional items: Cost of goods sold, Research & Development and Marketing & Sales include net restructuring charges related to the Group-wide rationalization of manufacturing sites; Other income includes
an insurance recovery from Corporate related to exchange risks, gains related to the rationalization of manufacturing sites, the impact from a post-retirement medical plan amendment, as well as additional gains from divestments announced in prior periods; Other expense include restructuring charges, an expense related to Lucentis in Italy and an expense of USD 157 million related to the advancement of the timing of recording the US Healthcare Fee liability as a result of final regulations.

62/87
CORE RESULTS – Reconciliation from IFRS results to core results – Alcon – Fourth quarter
Acquisition or
divestment related
items, including
restructuring Other
Q4 2014 Amortization of and integration exceptional Q4 2014 Q4 2013
IFRS results intangible assets 1 Impairments 2 charges items 3 Core results Core results
USD millions USD millions USD millions USD millions USD millions USD millions USD millions
Gross profit 1 404 517 3 1 924 1 880
Operating income 365 522 -1 9 895 851
The following are adjustments to arrive at Core Gross Profit
Cost of goods sold -1 320 517 3 -800 -792
The following are adjustments to arrive at Core Operating Income
Marketing & Sales -641 5 -636 -648
Research & Development -247 5 10 -232 -236
General & Administration -162 14 -148 -142
Other income 42 -39 3 11
Other expense -31 -1 16 -16 -14
1 Amortization of intangible assets: Cost of goods sold includes recurring amortization of acquired rights to in-market products and other production-related intangible assets; Research & Development includes the recurring amortization of acquired rights for technology platforms.
2 Impairments: Other expense includes the reversal of impairment charges related to property, plant and equipment.3 Other exceptional items: Cost of goods sold and Other expense include net restructuring charges related to the Group-wide rationalization of manufacturing sites; Marketing & Sales and General & Administration
include charges for transforming IT and finance processes; Research & Development includes a net increase of contingent consideration liabilities related to acquisitions; Other income includes the reversal of restructuring charges related to the Group-wide rationalization of manufacturing sites and the impact from a post-retirement medical plan amendment.

63/87
CORE RESULTS – Reconciliation from IFRS results to core results – Alcon – Full year
Acquisition or
divestment related
items, including
restructuring Other
FY 2014 Amortization of and integration exceptional FY 2014 FY 2013
IFRS results intangible assets 1 Impairments 2 charges items 3 Core results Core results
USD millions USD millions USD millions USD millions USD millions USD millions USD millions
Gross profit 5 717 2 056 26 7 799 7 665
Operating income 1 597 2 064 6 144 3 811 3 694
The following are adjustments to arrive at Core Gross Profit
Cost of goods sold -5 193 2 056 26 -3 111 -2 908
The following are adjustments to arrive at Core Operating Income
Marketing & Sales -2 474 20 -2 454 -2 452
Research & Development -928 8 7 10 -903 -939
General & Administration -613 45 -568 -564
Other income 79 -1 -52 26 39
Other expense -184 95 -89 -55
1 Amortization of intangible assets: Cost of goods sold includes recurring amortization of acquired rights to in-market products and other production-related intangible assets; Research & Development includes the recurring amortization of acquired rights for technology platforms.
2 Impairments: Research & Development includes impairment charges for in process projects; Other income includes a reversal of impairment charges related to property, plant and equipment.3 Other exceptional items: Cost of goods sold and Other expense include net restructuring charges related to the Group-wide rationalization of manufacturing sites; Marketing & Sales and General & Administration
include charges for transforming IT and finance processes; Research & Development includes a net increase of contingent consideration liabilities related to acquisitions; Other income includes the reversal of restructuring charges related to the Group-wide rationalization of manufacturing sites, as well as the impact from a post-retirement medical plan amendment; Other expense also includes an expense of USD 29 million related to the advancement of the timing of recording the US Healthcare Fee liability as a result of final regulations.

64/87
CORE RESULTS – Reconciliation from IFRS results to core results – Sandoz – Fourth quarter
Acquisition or
divestment related
items, including
restructuring Other
Q4 2014 Amortization of and integration exceptional Q4 2014 Q4 2013
IFRS results intangible assets 1 Impairments 2 charges items 3 Core results Core results
USD millions USD millions USD millions USD millions USD millions USD millions USD millions
Gross profit 1 058 96 10 5 1 169 1 119
Operating income 290 96 18 12 416 373
The following are adjustments to arrive at Core Gross Profit
Cost of goods sold -1 527 96 10 5 -1 416 -1 375
The following are adjustments to arrive at Core Operating Income
Research & Development -217 2 -215 -208
Other expense -55 6 7 -42 -29
1 Amortization of intangible assets: Cost of goods sold includes recurring amortization of acquired rights to in-market products and other production-related intangible assets.2 Impairments: Cost of goods sold and Research & Development include charges related to impairment of intangible assets; Other expense includes impairment charges related to property, plant and equipment and
financial assets.3 Other exceptional items: Cost of goods sold and Other expense relates to restructuring charges.

65/87
CORE RESULTS – Reconciliation from IFRS results to core results – Sandoz – Full year
Acquisition or
divestment related
items, including
restructuring Other
FY 2014 Amortization of and integration exceptional FY 2014 FY 2013
IFRS results intangible assets 1 Impairments 2 charges items 3 Core results Core results
USD millions USD millions USD millions USD millions USD millions USD millions USD millions
Gross profit 4 109 398 37 10 4 554 4 424
Operating income 1 088 400 47 36 1 571 1 541
The following are adjustments to arrive at Core Gross Profit
Cost of goods sold -5 751 398 37 10 -5 306 -5 047
The following are adjustments to arrive at Core Operating Income
Research & Development -827 2 2 -823 -785
Other income 97 -1 -3 93 100
Other expense -190 9 29 -152 -152
1 Amortization of intangible assets: Cost of goods sold includes recurring amortization of acquired rights to in-market products and other production-related intangible assets; Research & Development includes the recurring amortization of acquired rights for technology platforms.
2 Impairments: Cost of goods sold and Research & Development include charges related to impairment of intangible assets; Other income includes a reversal of impairment charges related to property, plant and equipment; Other expense includes impairment charges related to property, plant and equipment and financial assets.
3 Other exceptional items: Cost of goods sold and Other expense include net restructuring charges; Other income includes the reversal of restructuring charges; Other expense also includes an expense of USD 18 million related to the advancement of the timing of recording the US Healthcare Fee liability as a result of final regulations.

66/87
CORE RESULTS – Reconciliation from IFRS results to core results – Corporate continuing – Fourth quarter
Acquisition or
divestment related
items, including
restructuring Other
Q4 2014 Amortization of and integration exceptional Q4 2014 Q4 2013
IFRS results intangible assets 1 Impairments 2 charges items 3 Core results Core results
USD millions USD millions USD millions USD millions USD millions USD millions USD millions
Gross profit 93 93 110
Operating loss 85 1 44 -189 -59 -67
The following are adjustments to arrive at Core Operating Loss
General & Administration -178 9 -169 -169
Other income 312 -248 64 104
Other expense -142 1 44 50 -47 -112
1 Amortization of intangible assets: Other expense includes amortization of intangible assets.2 Impairments: Other expense includes impairment charges related to property, plant and equipment and financial assets.3 Other exceptional items: General & Administration includes expenses related to setup costs for Novartis Business Services; Other income relates to gains in the Novartis Venture Fund; Other expense includes
charges for transforming IT and finance processes, as well as a provision for a legal settlement.

67/87
CORE RESULTS – Reconciliation from IFRS results to core results – Corporate continuing – Full year
Acquisition or
divestment related
items, including
restructuring Other
FY 2014 Amortization of and integration exceptional FY 2014 FY 2013
IFRS results intangible assets 1 Impairments 2 charges items 3 Core results Core results
USD millions USD millions USD millions USD millions USD millions USD millions USD millions
Gross profit 670 -302 368 211
Operating loss -67 3 114 -473 -423 -551
The following are adjustments to arrive at Core Gross Profit
Other revenues 540 -302 238 84
The following are adjustments to arrive at Core Operating Loss
General & Administration -618 18 -600 -589
Other income 481 -307 174 246
Other expense -600 3 114 118 -365 -419
1 Amortization of intangible assets: Other expense includes amortization of intangible assets.2 Impairments: Other expense includes impairment charges related to property, plant and equipment and financial assets.3 Other exceptional items: Other revenues includes an amount for a commercial settlement; General & Administration includes expenses related to setup costs for Novartis Business Services; Other income includes an
insurance recovery transferred to Pharmaceuticals net of a deferred amount and gains in the Novartis Venture Fund; Other expense includes charges for transforming IT and finance processes, as well as a provision for a legal settlement.

68/87
CORE RESULTS – Reconciliation from IFRS results to core results – Discontinuing operations – Fourth quarter
Acquisition or
divestment related
items, including Q4 2013
restructuring Other Core results
Q4 2014 Amortization of and integration exceptional Q4 2014 excluding
IFRS results intangible assets Impairments 1 charges 2 items 3 Core results Diagnostics 4
USD millions USD millions USD millions USD millions USD millions USD millions USD millions
Gross profit 566 302 8 876 789
Operating income -1 179 1 143 200 -71 93 3
The following are adjustments to arrive at Core Gross Profit
Cost of goods sold -1 022 302 8 -712 -779
The following are adjustments to arrive at Core Operating IncomeOther income 91 1 4 -81 15 45
Other expense -1 065 840 196 2 -27 -23
1 Impairments: Cost of goods sold and Other expense include the USD 1.1 billion impairment charge as a result of the proposed sale of the influenza vaccines business; Other income includes a revision to a reversal of an impairment charge for property, plant and equipment; Other expense relates to an additional impairment charge incurred in Corporate, for an in-process project which is pending divestment as a result of the proposed portfolio transformation transactions.
2 Acquisition or divestment related items, including restructuring and integration charges: Other income includes an adjustment to the gain on the disposal of the blood transfusion diagnostics unit on January 9, 2014; Other expense includes professional service fees related to the portfolio transformation divestment activities.
3 Other exceptional items: Cost of goods sold and Other expense include net restructuring charges related to the Group-wide rationalization of manufacturing sites; Other income includes the reversal of restructuring charges related to the Group-wide rationalization of manufacturing sites, and the gain on the sale of a divested product, which was sold as a result of the proposed portfolio transformation transactions; Other expense includes the write-off of a receivable as a result of the proposed portfolio transformation transactions, partially offset by prior period professional service fees which have been reclassed as acquisition related items.
4 2013 figures exclude the blood transfusion diagnostics unit which was divested on January 9, 2014.

69/87
CORE RESULTS – Reconciliation from IFRS results to core results – Discontinuing operations – Full year
Acquisition or
divestment related
items, including FY 2013
restructuring Other Core results
FY 2014 Amortization of and integration exceptional FY 2014 excluding
IFRS results intangible assets 1 Impairments 2 charges 3 items 4 Core results Diagnostics 5
USD millions USD millions USD millions USD millions USD millions USD millions USD millions
Gross profit 2 886 65 302 19 3 272 2 971
Operating income -353 73 1 141 -680 -38 143 -16
The following are adjustments to arrive at Core Gross Profit
Cost of goods sold -3 073 65 302 19 -2 687 -2 650
The following are adjustments to arrive at Core Operating Income
Research & Development -857 8 -849 -728
Other income 1 007 -1 -876 -89 41 163
Other expense -1 146 840 196 32 -78 -120
1 Amortization of intangible assets: Cost of goods sold includes recurring amortization of acquired rights to in-market products and other production-related intangible assets up to the portfolio transformation annoucement date; Research & Development includes the recurring amortization of acquired rights for technology platforms up to the portfolio transformation annoucement date.
2 Impairments: Cost of goods sold and Other expense include the USD 1.1 billion impairment charge as a result of the proposed sale of the influenza vaccines business; Other income includes a reduction of an impairment charge for property, plant and equipment; Other expense relates to an additional impairment charge in Corporate, for an in-process project which is pending divestment as a result of the proposed portfolio transformation transactions.
3 Acquisition or divestment related items, including restructuring and integration charges: Other income includes the gain on the disposal of the blood transfusion diagnostics unit on January 9, 2014; Other expense includes professional service fees related to the portfolio transformation divestment activities.
4 Other exceptional items: Cost of goods sold and Other expense include restructuring charges related to the Group-wide rationalization of manufacturing sites; Other income includes the gain on the sale of a divested product, which was sold as a result of the proposed portfolio transformation transaction, the reversal of restructuring charges related to the Group-wide rationalization of manufacturing sites, the partial reversal of a legal expense provision, and the impact from a post-retirement medical plan amendment; Other expense also includes the write-off of a receivable as a result of the proposed portfolio transformation transactions.
5 2013 figures exclude the blood transfusion diagnostics unit which was divested on January 9, 2014.

70/87
CORE RESULTS – Reconciliation from IFRS results to core results – Vaccines – Fourth quarter
Acquisition or
divestment related
items, including Q4 2013
restructuring Other Core results
Q4 2014 Amortization of and integration exceptional Q4 2014 excluding
IFRS results intangible assets Impairments 1 charges 2 items 3 Core results Diagnostics 4
USD millions USD millions USD millions USD millions USD millions USD millions USD millions
Gross profit -63 302 1 240 167
Operating loss -1 084 1 071 18 -11 -6 -52
The following are adjustments to arrive at Core Gross Profit
Cost of goods sold -584 302 1 -281 -354
The following are adjustments to arrive at Core Operating Loss
Other income 10 4 14 17
Other expense -784 769 14 -12 -13 -8
1 Impairments: Cost of goods sold and Other expense include the USD 1.1 billion impairment charge as a result of the proposed sale of the influenza vaccines business.2 Acquisition or divestment related items, including restructuring and integration charges: Other income includes an adjustment to the gain on the disposal of the blood transfusion diagnostics unit on January 9, 2014;
Other expense includes professional service fees related to the portfolio transformation divestment activities.3 Other exceptional items: Cost of goods sold relates to restructuring charges; Other expense includes prior period professional service fees which have been reclassed as acquisition related items, as well as an
adjustment to a restructuring charge.4 2013 figures exclude the blood transfusion diagnostics unit which was divested on January 9, 2014.

71/87
CORE RESULTS – Reconciliation from IFRS results to core results – Vaccines – Full year
Acquisition or
divestment related
items, including FY 2013
restructuring Other Core results
FY 2014 Amortization of and integration exceptional FY 2014 excluding
IFRS results intangible assets 1 Impairments 2 charges 3 items 4 Core results Diagnostics 5
USD millions USD millions USD millions USD millions USD millions USD millions USD millions
Gross profit 298 49 302 1 650 529
Operating loss -552 57 1 071 -862 -4 -290 -302
The following are adjustments to arrive at Core Gross Profit
Cost of goods sold -1 336 49 302 1 -984 -981
The following are adjustments to arrive at Core Operating Loss
Research & Development -545 8 -537 -423
Other income 905 -876 29 61
Other expense -812 769 14 -5 -34 -61
1 Amortization of intangible assets: Cost of goods sold includes recurring amortization of acquired rights to in-market products and other production-related intangible assets up to the portfolio transformation announcement date; Research & Development includes the recurring amortization of acquired rights for technology platforms up to the portfolio transformation announcement date.
2 Impairments: Cost of goods sold and Other expense include the USD 1.1 billion impairment charge as a result of the proposed sale of the influenza vaccines business.3 Acquisition or divestment related items, including restructuring and integration charges: Other income includes the gain on the disposal of the blood transfusion diagnostics unit on January 9, 2014; Other expense
includes professional service fees related to the portfolio transformation divestment activities.4 Other exceptional items: Cost of goods sold relates to restructuring charges; Other expense includes an adjustment to a restructuring charge.5 2013 figures exclude the blood transfusion diagnostics unit which was divested on January 9, 2014.

72/87
CORE RESULTS – Reconciliation from IFRS results to core results – Consumer Health – Fourth quarter
Acquisition or
divestment related
items, including
restructuring Other
Q4 2014 Amortization of and integration exceptional Q4 2014 Q4 2013
IFRS results intangible assets Impairments 1 charges 2 items 3 Core results Core results
USD millions USD millions USD millions USD millions USD millions USD millions USD millions
Gross profit 629 7 636 622
Operating income 172 1 23 -81 115 60
The following are adjustments to arrive at Core Gross Profit
Cost of goods sold -438 7 -431 -425
The following are adjustments to arrive at Core Operating Income
Other income 83 1 -81 3 21
Other expense -16 23 -7 -5
1 Impairments: Other income includes an adjustment to an impairment charge reversal for property, plant and equipment.2 Acquisition or divestment related items, including restructuring and integration charges: Other expense also includes professional service fees related to the portfolio transformation divestment activities.3 Other exceptional items: Cost of goods sold and Other expense include restructuring charges related to the Group-wide rationalization of manufacturing sites; Other income includes the gain on the sale of a divested
product, which was sold as a result of the proposed portfolio transformation transaction, as well as the reversal of restructuring charges related to the Group-wide rationalization of manufacturing sites; Other expense includes prior period professional service fees which have been reclassed as acquisition related items.

73/87
CORE RESULTS – Reconciliation from IFRS results to core results – Consumer Health – Full year
Acquisition or
divestment related
items, including
restructuring Other
FY 2014 Amortization of and integration exceptional FY 2014 FY 2013
IFRS results intangible assets 1 Impairments 2 charges 3 items 4 Core results Core results
USD millions USD millions USD millions USD millions USD millions USD millions USD millions
Gross profit 2 588 16 18 2 622 2 442
Operating income 470 16 -1 23 -56 452 298
The following are adjustments to arrive at Core Gross Profit
Cost of goods sold -1 737 16 18 -1 703 -1 669
The following are adjustments to arrive at Core Operating Income
Other income 99 -1 -89 9 77
Other expense -60 23 15 -22 -23
1 Amortization of intangible assets: Cost of goods sold includes recurring amortization of acquired rights to in-market products and other production-related intangible assets up to the portfolio transformation announcement date.
2 Impairments: Other income includes a reduction of an impairment charge for property, plant and equipment.3 Acquisition or divestment related items, including restructuring and integration charges: Other expense includes professional service fees related to the portfolio transformation divestment activities.4 Other exceptional items: Cost of goods sold and Other expense include net restructuring charges related to the Group-wide rationalization of manufacturing sites; Other income includes the gain on the sale of a
divested product, which was sold as a result of the proposed portfolio transformation transaction, the reversal of restructuring charges related to the Group-wide rationalization of manufacturing sites, the partial reversal of a legal expense provision, and the impact from a post-retirement medical plan amendment.

74/87
CORE RESULTS – Reconciliation from IFRS results to core results – Corporate discontinuing – Fourth quarter
Acquisition or
divestment related
items, including
restructuring Other
Q4 2014 Amortization of and integration exceptional Q4 2014 Q4 2013
IFRS results intangible assets Impairments 1 charges 2 items 3 Core results Core results
USD millions USD millions USD millions USD millions USD millions USD millions USD millions
Gross profit 0 0 0
Operating loss -267 71 159 21 -16 -5
The following are adjustments to arrive at Core Operating LossOther expense -265 71 159 21 -14 -10
1 Impairments: Other expense relates to an impairment charge incurred for an in-process project which is pending divestment as a result of the proposed portfolio transformation transactions.2 Acquisition or divestment related items, including restructuring and integration charges: Other expense includes professional service fees related to the portfolio transformation divestment activities.3 Other exceptional items: Other expense relates to a write-off of a receivable as a result of the proposed portfolio transformation transactions.

75/87
CORE RESULTS – Reconciliation from IFRS results to core results – Corporate discontinuing – Full year
Acquisition or
divestment related
items, including
restructuring Other
FY 2014 Amortization of and integration exceptional FY 2014 FY 2013
IFRS results intangible assets Impairments 1 charges 2 items 3 Core results Core results
USD millions USD millions USD millions USD millions USD millions USD millions USD millions
Gross profit 0 0 0
Operating loss -271 71 159 22 -19 -12
The following are adjustments to arrive at Core Operating Loss
Other expense -274 71 159 22 -22 -36
1 Impairments: Other expense relates to an impairment charge incurred for an in-process project which is pending divestment as a result of the proposed portfolio transformation transactions.2 Acquisition or divestment related items, including restructuring and integration charges: Other expense includes professional service fees related to the portfolio transformation divestment activities.3 Other exceptional items: Other expense relates to a write-off of a receivable as a result of the proposed portfolio transformation transactions.

76/87
Condensed consolidated changes in net debt
Fourth quarter Q4 2014 Q4 2013
USD m USD m
Change in cash and cash equivalents 3 382 324
Change in marketable securities, commodities,
financial debt and financial derivatives -751 2 316
Reduction in net debt 2 631 2 640
Net debt at October 1 -9 180 -11 436
Net debt at December 31 -6 549 -8 796
Full year FY 2014 FY 2013
USD m USD m
Change in cash and cash equivalents 6 336 1 135
Change in marketable securities, commodities,
financial debt and financial derivatives -4 089 1 676
Reduction in net debt 2 247 2 811
Net debt at January 1 -8 796 -11 607
Net debt at December 31 -6 549 -8 796
Components of net debt Dec 31, Dec 31, 2014 2013
USD m USD m
Current financial debts and derivative
financial instruments -6 612 -6 776
Non-current financial debts -13 799 -11 242
Less liquidity:
Cash and cash equivalents 13 023 6 687
Marketable securities, commodities
and derivative financial instruments 839 2 535
Net debt at December 31 -6 549 -8 796
Share information Dec 31, Dec 31, 2014 2013
Number of shares outstanding 2 398 626 257 2 426 084 308
Registered share price (CHF) 92.35 71.20
ADR price (USD) 92.66 80.38
Market capitalization (USD billion) 223.7 194.2
Market capitalization (CHF billion) 221.5 172.7

77/87
Free cash flow
Fourth quarter Q4 2014 Q4 2013 Change
USD m USD m USD m
Operating income from continuing operations 2 351 2 333 18
Reversal of non-cash items
Depreciation, amortization and impairments 1 291 1 211 80
Change in provisions and other non-current liabilities 316 204 112
Other -118 -6 -112
Operating income adjusted for non-cash items 3 840 3 742 98
Interest and other financial receipts 394 -65 459
Interest and other financial payments -168 -90 -78
Taxes paid -559 -509 -50
Payments out of provisions and other
net cash movements in non-current liabilities -251 -302 51
Change in inventory and trade
receivables less trade payables 1 422 1 332 90
Change in other net current assets and
other operating cash flow items 45 -146 191
Cash flows from operating activities from continuing operations 4 723 3 962 761
Purchase of property, plant & equipment -830 -1 048 218
Purchase of intangible, financial
and other non-current assets -304 -218 -86
Proceeds from sales of property, plant & equipment,
intangible, financial and other non-current assets 366 179 187
Free cash flow from continuing operations 3 955 2 875 1 080
Free cash flow from discontinuing operations 464 444 20
Total free cash flow 4 419 3 319 1 100
Full year FY 2014 FY 2013 Change
USD m USD m USD m
Operating income from continuing operations 11 089 10 983 106
Reversal of non-cash items
Depreciation, amortization and impairments 4 751 4 462 289
Change in provisions and other non-current liabilities 1 490 736 754
Other 122 307 -185
Operating income adjusted for non-cash items 17 452 16 488 964
Interest and other financial receipts 1 067 539 528
Interest and other financial payments -692 -631 -61
Taxes paid -2 179 -2 054 -125
Payments out of provisions and other
net cash movements in non-current liabilities -1 125 -947 -178
Change in inventory and trade
receivables less trade payables -731 -588 -143
Change in other net current assets and
other operating cash flow items 106 -190 296
Cash flows from operating activities from continuing operations 13 898 12 617 1 281
Purchase of property, plant & equipment -2 624 -2 903 279
Purchase of intangible, financial
and other non-current assets -1 079 -665 -414
Proceeds from sales of property, plant & equipment,
intangible, financial and other non-current assets 739 472 267
Free cash flow from continuing operations 10 934 9 521 1 413
Free cash flow from discontinuing operations -172 424 -596
Total free cash flow 10 762 9 945 817

78/87
Supplementary tables: Fourth quarter– Net sales of the top 20 pharmaceutical products in 2014
US Rest of world Total
% change % change % change in constant in constant % change in constant
Brands Business Franchise Indication USD m currencies USD m currencies USD m in USD currencies
Chronic myeloid
Gleevec/Glivec Oncology leukemia 624 12 613 -1 1 237 1 5
Relapsing multiple
Gilenya Neuroscience sclerosis 325 29 341 36 666 26 32
Age-related
Lucentis Ophthalmics macular degeneration 588 1 588 -7 1
Diovan/Co–Diovan Primary Care Hypertension 83 -78 296 -31 379 -55 -53
Sandostatin Oncology Acromegaly 198 7 218 3 416 5
Afinitor/Votubia Oncology Breast cancer 224 24 202 23 426 18 24
Chronic myeloid
Tasigna Oncology leukemia 152 32 276 29 428 22 30
Exforge Primary Care Hypertension 20 -77 278 6 298 -20 -14
Galvus Primary Care Diabetes 295 -1 295 -10 -1
Exelon/Exelon Patch Neuroscience Alzheimer’s disease 120 12 120 -9 240 -4 0
Exjade Oncology Iron chelator 81 14 162 2 243 0 5
Xolair 1 Primary Care Asthma 200 25 200 16 25
Neoral/Sandimmun Integrated Hospital Care Transplantation 14 8 150 -10 164 -16 -9
Voltaren
(excl. other divisions) Established medicines Inflammation/pain 172 4 172 -2 4
Myfortic Integrated Hospital Care Transplantation 34 -55 97 32 131 -18 -10
Attention deficit/
Ritalin/Focalin Established medicines hyperactivity disorder 86 -27 42 9 128 -20 -18
Femara Oncology Breast cancer 9 80 89 3 98 -2 6
Comtan/Stalevo Neuroscience Parkinson’s disease 2 -78 87 2 89 -14 -5
Tegretol Established medicines Epilepsy 19 6 67 2 86 -4 2
Zortress/Certican Integrated Hospital Care Transplantation 18 80 67 40 85 35 45
Top 20 products total 2 009 -8 4 360 4 6 369 -6 0
Rest of portfolio 365 -5 1 126 3 1 491 -4 1
Total Division sales 2 374 -8 5 486 3 7 860 -6 0
1 Net sales reflect Xolair sales for all indications (i.e. Xolair SAA and Xolair CSU, which are managed by the Integrated Hospital Care franchise).

79/87
Supplementary tables: Full year – Net sales of the top 20 pharmaceutical products in 2014
US Rest of world Total
% change % change % change in constant in constant % change in constant
Brands Business Franchise Indication USD m currencies USD m currencies USD m in USD currencies
Chronic myeloid
Gleevec/Glivec Oncology leukemia 2 170 12 2 576 -5 4 746 1 2
Relapsing multiple
Gilenya Neuroscience sclerosis 1 190 16 1 287 45 2 477 28 30
Age-related
Lucentis Ophthalmics macular degeneration 2 441 5 2 441 2 5
Diovan/Co–Diovan Primary Care Hypertension 960 -43 1 385 -22 2 345 -33 -32
Sandostatin Oncology Acromegaly 751 6 899 6 1 650 4 6
Afinitor/Votubia Oncology Breast cancer 805 16 770 29 1 575 20 22
Chronic myeloid
Tasigna Oncology leukemia 540 26 989 23 1 529 21 24
Exforge Primary Care Hypertension 284 -20 1 112 4 1 396 -4 -2
Galvus Primary Care Diabetes 1 224 6 1 224 2 6
Exelon/Exelon Patch Neuroscience Alzheimer’s disease 485 6 524 -6 1 009 -2 -1
Exjade Oncology Iron chelator 307 16 619 1 926 4 6
Xolair 1 Primary Care Asthma 777 30 777 27 30
Neoral/Sandimmun Integrated Hospital Care Transplantation 55 -2 629 -6 684 -9 -6
Voltaren
(excl. other divisions) Established medicines Inflammation/pain 632 -3 632 -6 -3
Myfortic Integrated Hospital Care Transplantation 149 -45 394 14 543 -15 -11
Attention deficit/
Ritalin/Focalin Established medicines hyperactivity disorder 327 -25 165 8 492 -17 -16
Femara Oncology Breast cancer 27 42 353 0 380 -1 2
Comtan/Stalevo Neuroscience Parkinson’s disease 19 -42 352 -1 371 -7 -4
Tegretol Established medicines Epilepsy 82 19 264 1 346 1 4
Zortress/Certican Integrated Hospital Care Transplantation 60 88 267 28 327 31 36
Top 20 products total 8 211 -3 17 659 4 25 870 0 2
Rest of portfolio 1 561 -13 4 360 0 5 921 -6 -4
Total Division sales 9 772 -5 22 019 3 31 791 -1 1
1 Net sales reflect Xolair sales for all indications (i.e. Xolair SAA and Xolair CSU, which are managed by the Integrated Hospital Care franchise).

80/87
Pharmaceuticals net sales by business franchise – Fourth quarter Q4 2014 Q4 2013 % change % change
USD m USD m USD cc
Primary Care
Onbrez Breezhaler/Arcapta Neohaler 56 53 6 15
Seebri Breezhaler 42 25 68 88
Ultibro Breezhaler 51 6 nm nm
Subtotal COPD1 portfolio 149 84 77 94
Galvus 295 328 -10 -1
Xolair 2 200 173 16 25
TOBI 65 88 -26 -23
Other 8 10 -20 2
Total strategic franchise products 717 683 5 14
Diovan 379 843 -55 -53
Exforge 298 372 -20 -14
Tekturna/Rasilez 47 59 -20 -15
Other 274 352 -22 -16
Total Established medicines 998 1 626 -39 -34
Total Primary Care products 1 715 2 309 -26 -20
Oncology
Gleevec/Glivec 1 237 1 227 1 5
Tasigna 428 352 22 30
Subtotal Bcr-Abl franchise 1 665 1 579 5 10
Sandostatin 416 416 0 5
Afinitor/Votubia 426 361 18 24
Exjade 243 244 0 5
Femara 98 100 -2 6
Jakavi 84 47 79 91
Zometa 57 94 -39 -34
Proleukin 15 26 -42 -42
Zykadia 12 0 nm nm
Other 66 60 10 11
Total Oncology products 3 082 2 927 5 10
Specialty – Neuroscience
Gilenya 666 527 26 32
Exelon/Exelon Patch 240 250 -4 0
Comtan/Stalevo 89 103 -14 -5
Extavia 43 37 16 20
Other 16 21 -24 -24
Total strategic franchise products 1 054 938 12 18
Established medicines 100 112 -11 -2
Total Neuroscience products 1 154 1 050 10 16
Specialty – Ophthalmics
Lucentis 588 630 -7 1
Other 13 14 -7 -4
Total Opthalmics products 601 644 -7 1
Specialty – Integrated Hospital Care (IHC)
Neoral/Sandimmun 164 195 -16 -9
Myfortic 131 159 -18 -10
Zortress/Certican 85 63 35 45
Ilaris 54 37 46 54
Other 45 43 5 9
Total strategic franchise products 479 497 -4 4
Everolimus stent drug 62 46 35 46
Established medicines 224 259 -14 -9
Total IHC products 765 802 -5 2
Established medicines – additional products
Voltaren (excl. other divisions) 172 176 -2 4
Ritalin/Focalin 128 161 -20 -18
Tegretol 86 90 -4 2
Trileptal 59 69 -14 -10
Foradil 43 55 -22 -12
Other 55 40 38 39
Total additional products 543 591 -8 -3
Total strategic franchise products 5 933 5 689 4 11
Total established medicines and additional products 1 927 2 634 -27 -22
Total Division net sales 7 860 8 323 -6 0
1 Chronic Obstructive Pulmonary Disease2 Net sales reflect Xolair sales for all indications (i.e. Xolair SAA and Xolair CSU, which are managed by the Integrated Hospital Care
franchise).nm = not meaningful

81/87
Pharmaceuticals net sales by business franchise – Full year FY 2014 FY 2013 % change % change
USD m USD m USD cc
Primary Care
Onbrez Breezhaler/Arcapta Neohaler 220 192 15 17
Seebri Breezhaler 146 58 152 159
Ultibro Breezhaler 118 6 nm nm
Subtotal COPD1 portfolio 484 256 89 93
Galvus 1 224 1 200 2 6
Xolair 2 777 613 27 30
TOBI 281 387 -27 -26
Other 46 40 15 20
Total strategic franchise products 2 812 2 496 13 16
Diovan 2 345 3 524 -33 -32
Exforge 1 396 1 456 -4 -2
Tekturna/Rasilez 207 290 -29 -27
Other 1 201 1 312 -8 -6
Total Established medicines 5 149 6 582 -22 -20
Total Primary Care products 7 961 9 078 -12 -10
Oncology
Gleevec/Glivec 4 746 4 693 1 2
Tasigna 1 529 1 266 21 24
Subtotal Bcr-Abl franchise 6 275 5 959 5 7
Sandostatin 1 650 1 589 4 6
Afinitor/Votubia 1 575 1 309 20 22
Exjade 926 893 4 6
Femara 380 384 -1 2
Jakavi 279 163 71 72
Zometa 264 600 -56 -55
Proleukin 74 91 -19 -19
Zykadia 31 0 nm nm
Other 249 228 9 10
Total Oncology products 11 703 11 216 4 6
Specialty – Neuroscience
Gilenya 2 477 1 934 28 30
Exelon/Exelon Patch 1 009 1 032 -2 -1
Comtan/Stalevo 371 401 -7 -4
Extavia 177 159 11 11
Other 66 78 -15 -15
Total strategic franchise products 4 100 3 604 14 15
Established medicines 409 444 -8 -3
Total Neuroscience products 4 509 4 048 11 13
Specialty – Ophthalmics
Lucentis 2 441 2 383 2 5
Other 63 61 3 5
Total Opthalmics products 2 504 2 444 2 5
Specialty – Integrated Hospital Care (IHC)
Neoral/Sandimmun 684 750 -9 -6
Myfortic 543 637 -15 -11
Zortress/Certican 327 249 31 36
Ilaris 199 119 67 69
Other 173 169 2 4
Total strategic franchise products 1 926 1 924 0 3
Everolimus stent drug 205 247 -17 -18
Established medicines 981 1 112 -12 -10
Total IHC products 3 112 3 283 -5 -3
Established medicines – additional products
Voltaren (excl. other divisions) 632 675 -6 -3
Ritalin/Focalin 492 594 -17 -16
Tegretol 346 342 1 4
Trileptal 265 257 3 6
Foradil 175 205 -15 -10
Other 92 72 28 29
Total additional products 2 002 2 145 -7 -4
Total strategic franchise products 23 045 21 684 6 8
Total established medicines and additional products 8 746 10 530 -17 -15
Total Division net sales 31 791 32 214 -1 1
1 Chronic Obstructive Pulmonary Disease2 Net sales reflect Xolair sales for all indications (i.e. Xolair SAA and Xolair CSU, which are managed by the Integrated Hospital Care
franchise).nm = not meaningful

82/87
Net sales by region1 – Fourth quarter Q4 2014 Q4 2013 % change Q4 2014 Q4 2013
USD m USD m USD cc % of total % of total Pharmaceuticals
Europe 2 733 2 847 -4 5 35 34
US 2 374 2 572 -8 -8 30 31
Asia/Africa/Australasia 1 880 2 105 -11 -5 24 25
Canada and Latin America 873 799 9 19 11 10
Total 7 860 8 323 -6 0 100 100
Of which in Established Markets 5 687 6 256 -9 -4 72 75
Of which in Emerging Growth Markets 2 173 2 067 5 13 28 25
Alcon
Europe 695 749 -7 4 26 28
US 1 108 1 028 8 8 41 39
Asia/Africa/Australasia 610 597 2 9 23 22
Canada and Latin America 290 281 3 12 10 11
Total 2 703 2 655 2 7 100 100
Of which in Established Markets 1 995 1 994 0 4 74 75
Of which in Emerging Growth Markets 708 661 7 17 26 25
Sandoz
Europe 1 111 1 207 -8 3 44 50
US 935 737 27 27 37 31
Asia/Africa/Australasia 308 316 -3 2 12 13
Canada and Latin America 158 151 5 16 7 6
Total 2 512 2 411 4 11 100 100
Of which in Established Markets 1 877 1 735 8 13 75 72
Of which in Emerging Growth Markets 635 676 -6 6 25 28
Continuing operations
Europe 4 539 4 803 -5 4 35 36
US 4 417 4 337 2 2 34 32
Asia/Africa/Australasia 2 798 3 018 -7 -1 21 23
Canada and Latin America 1 321 1 231 7 17 10 9
Total 13 075 13 389 -2 3 100 100
Of which in Established Markets 9 559 9 985 -4 0 73 75
Of which in Emerging Growth Markets 3 516 3 404 3 12 27 25
Vaccines 2
Europe 198 165 20 29 40 33
US 128 171 -25 -25 26 34
Asia/Africa/Australasia 81 95 -15 -12 16 19
Canada and Latin America 87 73 19 39 18 14
Total 494 504 -2 4 100 100
Of which in Established Markets 340 352 -3 2 69 70
Of which in Emerging Growth Markets 154 152 1 10 31 30
Consumer Health
Europe 465 506 -8 4 44 49
US 247 210 18 18 23 20
Asia/Africa/Australasia 224 202 11 16 21 20
Canada and Latin America 128 116 10 17 12 11
Total 1 064 1 034 3 11 100 100
Of which in Established Markets 682 663 3 8 64 64
Of which in Emerging Growth Markets 382 371 3 15 36 36
Total
Europe 5 202 5 474 -5 5 36 37
US 4 792 4 718 2 2 33 32
Asia/Africa/Australasia 3 103 3 315 -6 -1 21 22
Canada and Latin America 1 536 1 420 8 18 10 9
Total
(excluding divested blood transfusion
diagnostics unit sales) 14 633 14 927 -2 4 100 100
Of which in Established Markets 10 581 11 000 -4 1 72 74
Of which in Emerging Growth Markets 4 052 3 927 3 12 28 26
Divested blood transfusion
diagnostics unit sales 152
Total Group 14 633 15 079 -3 3
1 Net sales from operations by location of third party customer. Emerging Growth Markets comprise all markets other than the Established Markets of the US, Canada, Western Europe, Japan, Australia and New Zealand.
2 2013 figures for Vaccines exclude the blood transfusion diagnostics unit that was divested on January 9, 2014.

83/87
Net sales by region1 – Full year FY 2014 FY 2013 2 % change FY 2014 FY 2013
USD m USD m USD cc % of total % of total Pharmaceuticals
Europe 11 245 10 993 2 3 35 34
US 9 772 10 256 -5 -5 31 32
Asia/Africa/Australasia 7 655 7 947 -4 0 24 25
Canada and Latin America 3 119 3 018 3 13 10 9
Total 31 791 32 214 -1 1 100 100
Of which in Established Markets 23 653 24 493 -3 -2 74 76
Of which in Emerging Growth Markets 8 138 7 721 5 11 26 24
Alcon
Europe 2 872 2 831 1 4 27 27
US 4 349 4 179 4 4 40 40
Asia/Africa/Australasia 2 449 2 378 3 8 23 23
Canada and Latin America 1 157 1 108 4 12 10 10
Total 10 827 10 496 3 6 100 100
Of which in Established Markets 8 049 7 918 2 3 74 75
Of which in Emerging Growth Markets 2 778 2 578 8 14 26 25
Sandoz
Europe 4 573 4 596 -1 2 48 50
US 3 215 2 821 14 14 34 31
Asia/Africa/Australasia 1 168 1 139 3 6 12 12
Canada and Latin America 606 603 0 8 6 7
Total 9 562 9 159 4 7 100 100
Of which in Established Markets 7 035 6 625 6 7 74 72
Of which in Emerging Growth Markets 2 527 2 534 0 6 26 28
Continuing operations
Europe 18 690 18 420 1 3 36 36
US 17 336 17 256 0 0 33 33
Asia/Africa/Australasia 11 272 11 464 -2 2 22 22
Canada and Latin America 4 882 4 729 3 12 9 9
Total 52 180 51 869 1 3 100 100
Of which in Established Markets 38 737 39 036 -1 0 74 75
Of which in Emerging Growth Markets 13 443 12 833 5 10 26 25
Vaccines 2
Europe 549 484 13 15 36 34
US 516 521 -1 -1 34 37
Asia/Africa/Australasia 248 242 2 3 16 17
Canada and Latin America 224 176 27 42 14 12
Total 1 537 1 423 8 10 100 100
Of which in Established Markets 1 112 1 035 7 8 72 73
Of which in Emerging Growth Markets 425 388 10 15 28 27
Consumer Health
Europe 2 059 2 004 3 6 48 49
US 940 847 11 11 22 21
Asia/Africa/Australasia 834 793 5 8 19 20
Canada and Latin America 446 420 6 14 11 10
Total 4 279 4 064 5 8 100 100
Of which in Established Markets 2 798 2 636 6 7 65 65
Of which in Emerging Growth Markets 1 481 1 428 4 11 35 35
Total
Europe 21 298 20 908 2 3 37 36
US 18 792 18 624 1 1 32 32
Asia/Africa/Australasia 12 354 12 499 -1 3 21 22
Canada and Latin America 5 552 5 325 4 13 10 10
Total
(excluding divested blood transfusion
diagnostics unit sales) 57 996 57 356 1 3 100 100
Of which in Established Markets 42 647 42 707 0 1 74 74
Of which in Emerging Growth Markets 15 349 14 649 5 11 26 26
Divested blood transfusion
diagnostics unit sales 565
Total Group 57 996 57 921 0 2
1 Net sales from operations by location of third party customer. Emerging Growth Markets comprise all markets other than the Established Markets of the US, Canada, Western Europe, Japan, Australia and New Zealand.
2 2013 figures for Vaccines exclude the blood transfusion diagnostics unit that was divested on January 9, 2014.

84/87
Principal currency translation rates
Fourth quarter Period-end Period-end Average Average rates rates rates rates Dec 31, Dec 31, Q4 2014 Q4 2013 2014 2013
USD USD USD USD
1 CHF 1.037 1.107 1.010 1.124
1 EUR 1.249 1.361 1.215 1.378
1 GBP 1.583 1.619 1.556 1.653
100 JPY 0.875 0.997 0.836 0.952
100 RUB 2.125 3.071 1.722 3.044
Full year Period-end Period-end Average Average rates rates rates rates Dec 31, Dec 31, FY 2014 FY 2013 2014 2013
USD USD USD USD
1 CHF 1.094 1.079 1.010 1.124
1 EUR 1.329 1.328 1.215 1.378
1 GBP 1.648 1.564 1.556 1.653
100 JPY 0.947 1.026 0.836 0.952
100 RUB 2.649 3.142 1.722 3.044
Income from associated companies
Q4 2014 Q4 2013 FY 2014 FY 2013
USD m USD m USD m USD m
Share of estimated Roche reported net income 191 207 813 817
Prior-year adjustment -56 -59
Amortization of additional intangible assets recognized
by Novartis on initial accounting for the equity interest -38 -39 -158 -154
Net income effect from Roche 153 168 599 604
LTS Lohmann Therapie-Systeme AG 421 7 436 31
Idenix Pharmaceuticals Inc. 812
Income from other associated companies related to
continuing operations 6 -20 71 -36
Income from associated companies related to
continuing operations 580 155 1 918 599
Income from other associated companies related to
discontinuing operations -1 -1 2 1
Total income from associated companies 579 154 1 920 600

85/87
Vaccines segment – 2013 comparative information
The following reconciles previously published results for the Vaccines segment to the revised presentation:
Vaccines – Fourth quarter and full year 2013 Divested blood Vaccines Vaccines transfusion Vaccines Core result as previously Transfers to Reported diagnostics excluding Core excluding published 1 continuing Corporate 2 Vaccines unit Diagnostics adjustments Diagnostics Q4 2013 FY 2013 Q4 2013 FY 2013 Q4 2013 FY 2013 Q4 2013 FY 2013 Q4 2013 FY 2013 Q4 2013 FY 2013 Q4 2013 FY 2013
USD m USD m USD m USD m USD m USD m USD m USD m USD m USD m USD m USD m USD m USD m
Net sales to third parties 655 1 987 655 1 987 -152 -565 503 1 422 503 1 422
Sales to other segment 11 61 11 61 -2 -10 9 51 9 51
Net sales of segment 666 2 048 666 2 048 -154 -575 512 1 473 512 1 473
Other revenues 135 333 -48 -84 87 249 -78 -212 9 37 9 37
Cost of goods sold -511 -1 578 4 7 -507 -1 571 115 447 -392 -1 124 38 143 -354 -981
Gross profit 290 803 -44 -77 246 726 -117 -340 129 386 38 143 167 529
Marketing & Sales -91 -334 -91 -334 14 45 -77 -289 -77 -289
Research & Development -132 -476 -132 -476 6 29 -126 -447 6 24 -120 -423
General & Administration -38 -140 -38 -140 7 21 -31 -119 -31 -119
Other income 24 70 24 70 -7 -9 17 61 17 61
Other expense -11 -88 1 4 -10 -84 2 15 -8 -69 8 -8 -61
Operating income/loss 42 -165 -43 -73 -1 -238 -95 -239 -96 -477 44 175 -52 -302
as % of net sales 6.4% -8.3% -0.2% -12.0% 62.5% 42.3% -19.1% -33.5% -10.3% -21.2%
Income from associated
companies -1 1 -1 1 -1 1 -1 1
1 Including the divested blood transfusion diagnostics unit.2 Other revenue contains royalties and out-licensing revenues of Vaccines which are to be retained by Novartis.

86/87
Disclaimer The foregoing release contains forward-looking statements that can be identified by words such as “pipeline,” “will,” “momentum,” “recommended,” “on track,” “ongoing,” “outlook,” “expected,” “confident,” “positioned,” “pending,” “to be acquired,” “strategy,” “launches,” “launched,” “launch,” “focus,” “positive opinions,” “could,” “initiated,” “to evaluate,” “moves towards,” “designed,” “in the future,” “expects,” “expect,” “would,” “committed,” or similar terms, or by express or implied discussions regarding potential new products, potential new indications for existing products, or regarding potential future revenues from any such products; potential shareholder returns or credit ratings; or regarding the potential completion of the announced transactions with GSK and CSL, or regarding potential future sales or earnings of any of the businesses involved in the transactions with GSK, Lilly or CSL, and regarding any potential strategic benefits, synergies or opportunities as a result of these transactions; or regarding potential future sales or earnings of the Novartis Group or any of its divisions; or by discussions of strategy, plans, expectations or intentions. You should not place undue reliance on these statements. Such forward-looking statements are based on the current beliefs and expectations of management regarding future events, and are subject to significant known and unknown risks and uncertainties. Should one or more of these risks or uncertainties materialize, or should underlying assumptions prove incorrect, actual results may vary materially from those set forth in the forward-looking statements. There can be no guarantee that any new products will be approved for sale in any market, or that any new indications will be approved for any existing products in any market, or that any approvals which are obtained will be obtained at any particular time, or that any such products will achieve any particular revenue levels. Nor can there be any guarantee that the announced transactions with GSK and CSL will be completed in the expected form or within the expected time frame or at all. Neither can there be any guarantee that Novartis will be able to realize any of the potential strategic benefits, synergies or opportunities as a result of the transactions with GSK, Lilly or CSL. Neither can there be any guarantee that Novartis or any of the businesses involved in the transactions will achieve any particular financial results in the future. Nor can there be any guarantee that shareholders will achieve any particular level of shareholder returns. Neither can there be any guarantee that the Novartis Group, or any of its divisions, will be commercially successful in the future, or achieve any particular credit rating. In particular, management's expectations could be affected by, among other things, unexpected regulatory actions or delays or government regulation generally, including an unexpected failure to obtain necessary government approvals for the transactions, or unexpected delays in obtaining such approvals; the potential that the strategic benefits, synergies or opportunities expected from the announced transactions, including the divestment of our former Animal Health Division to Lilly, may not be realized or may take longer to realize than expected; the inherent uncertainties involved in predicting shareholder returns or credit ratings; the uncertainties inherent in research and development, including unexpected clinical trial results and additional analysis of existing clinical data; the Company’s ability to obtain or maintain proprietary intellectual property protection, including the ultimate extent of the impact on the Company of the loss of patent protection and exclusivity on key products which commenced in prior years and will continue this year; unexpected manufacturing or quality issues; global trends toward health care cost containment, including ongoing pricing pressures; uncertainties regarding actual or potential legal proceedings, including, among others, actual or potential product liability litigation, litigation and investigations regarding sales and marketing practices, government investigations and intellectual property disputes; general economic and industry conditions, including uncertainties regarding the effects of the persistently weak economic and financial environment in many countries; uncertainties regarding future global exchange rates, including as a result of recent changes in monetary policy by the Swiss National Bank; uncertainties regarding future demand for our products; uncertainties involved in the development of new healthcare products; uncertainties regarding potential significant breaches of data security or disruptions of the Company’s information technology systems; and other risks and factors referred to in Novartis AG's current Form 20-F on file with the US Securities and Exchange Commission. Novartis is providing the information in this press release as of this date and does not undertake any obligation to update any forward-looking statements as a result of new information, future events or otherwise. All product names appearing in italics are trademarks owned by or licensed to Novartis Group Companies. Neupogen® is a registered trademark of Amgen Inc. Stelara® is a registered trademark of Janssen Biotech, Inc. Jakafi® is a registered trademark of Incyte Corporation. About Novartis Novartis provides innovative healthcare solutions that address the evolving needs of patients and societies. Headquartered in Basel, Switzerland, Novartis offers a diversified portfolio to best meet these needs: innovative medicines, eye care, cost-saving generic pharmaceuticals, preventive vaccines, over-the-counter and animal health products. Novartis is the only global company with leading positions in these areas. In 2014, the Group achieved net sales of USD 58.0 billion, while R&D throughout the Group amounted to approximately USD 9.9 billion (USD 9.6 billion excluding impairment and amortization charges). Novartis Group companies employ approximately 130,000 full-time-equivalent associates and sell products in more than 150 countries around the world. For more information, please visit http://www.novartis.com. Novartis issued its 2014 Annual Report today, and it is available on its website at www.novartis.com. Novartis will also today file its 2014 Annual Report on Form 20-F with the US Securities and Exchange Commission, and will post this document on www.novartis.com. Novartis shareholders may receive a hard copy of either of these documents, each of which contain our complete audited financial statements, free of charge, upon request.

87/87
Important dates February 27, 2015 Annual General Meeting April 23, 2015 First quarter results 2015 June 17-18, 2015 Novartis investor event in Boston, US July 21, 2015 Second quarter results 2015 October 27, 2015 Third quarter results 2015


![SUPPLEMENTARY INFORMATION I. A BRIEF INTRODUCTION …...exciting developments of topological band theory and the discovery of topological insulators in condensed matter physics [4].](https://static.fdocuments.in/doc/165x107/5f33d84439828c360c6a464a/supplementary-information-i-a-brief-introduction-exciting-developments-of-topological.jpg)
