+8.5 288 277 29 . si2.6 363 40/2 0 573, 122 280, 32 1000 m ...

U.S. Department of the InteriorU.S. Geological Survey
Open File Report 2011–1297
Prepared in cooperation with the National Park Service, Whiskeytown National Recreation Area and the Burned Area Response Program
Concentrations of Mercury and other Metals in Black Bass (Micropterus spp.) from Whiskeytown Lake, Shasta County, California, 2005


Concentrations of Mercury and other Metals in Black Bass (Micropterus spp.) from Whiskeytown Lake, Shasta County, California, 2005
By Jason T. May, Roger L. Hothem, Marissa L. Bauer, and Larry R. Brown
Prepared in cooperation with the National Park Service, Whiskeytown National Recreation Area and the Burned Area Response Program
Open-File Report 2011–1297
U.S. Department of the InteriorU.S. Geological Survey

U.S. Department of the InteriorKEN SALAZAR, Secretary
U.S. Geological SurveyMarcia K. McNutt, Director
U.S. Geological Survey, Reston, Virginia: 2012
For more information on the USGS—the Federal source for science about the Earth, its natural and living resources, natural hazards, and the environment, visit http://www.usgs.gov or call 1–888–ASK–USGS.
For an overview of USGS information products, including maps, imagery, and publications, visit http://www.usgs.gov/pubprod
To order this and other USGS information products, visit http://store.usgs.gov
Any use of trade, product, or firm names is for descriptive purposes only and does not imply endorsement by the U.S. Government.
Although this report is in the public domain, permission must be secured from the individual copyright owners to
reproduce any copyrighted materials contained within this report.
Suggested citation:May, J.T., Hothem, R.L., Bauer, M.L., and Brown, L.R., 2012, Concentrations of mercury and other metals in black bass (Micropterus spp.) from Whiskeytown Lake, Shasta County, California, 2005: U.S. Geological Survey, Open-File Report 2011–1297, 16 p.

iii
Contents
Abstract ...........................................................................................................................................................1Introduction.....................................................................................................................................................1Purpose and Scope .......................................................................................................................................5Field Methods and Sample Preservation Techniques .............................................................................5Laboratory Methods of Chemical Analysis ...............................................................................................5Quality Assurance and Quality Control ......................................................................................................6Results and Discussion .................................................................................................................................7Acknowledgements .....................................................................................................................................15References ....................................................................................................................................................15
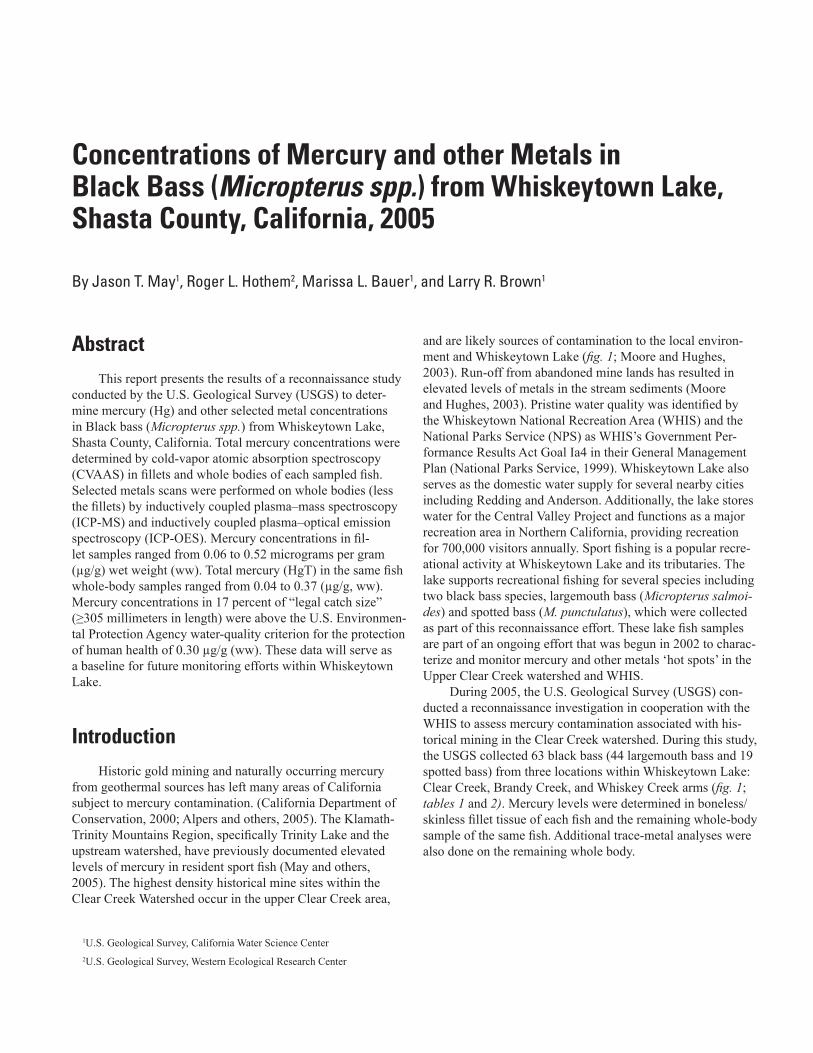
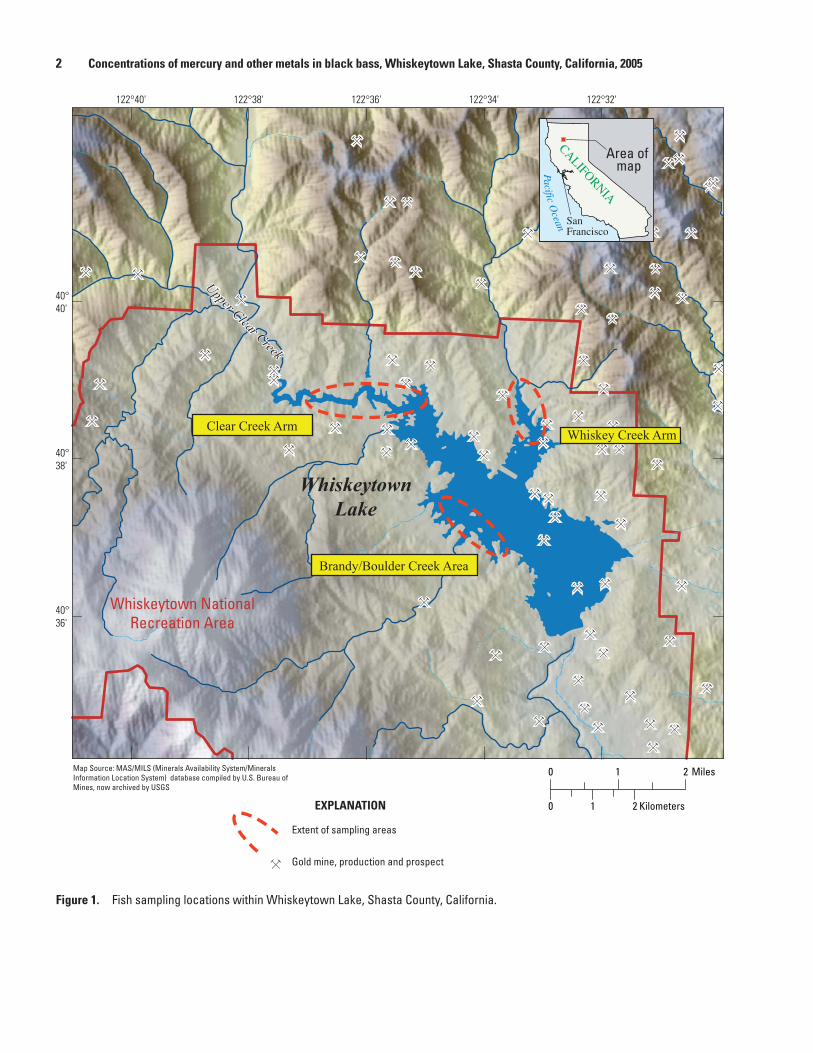
Figures 1. Map showing fish sampling locations within Whiskeytown Lake, Shasta County,
California ........................................................................................................................................2 2. Graph showing mercury concentration for all bass (Micropterus spp.) samples
collected from Whiskeytown Lake, California, 2005, in relation to total length ...............14 3. Correlation plot of mercury concentration in fillet samples in relation to
whole-body samples for for all bass (Micropterus spp.) samples collected from Whiskeytown Lake, California, 2005 ........................................................................................15
Tables 1. Sites within Whiskeytown Lake, California, sampled during 2005 .......................................3 2. Total mercury concentrations in fillet and whole-body samples of largemouth
bass (Micropterus salmoides) and spotted bass (M. punctulatus) collected from Whiskeytown Lake, California, June 7–9, 2005 ........................................................................3
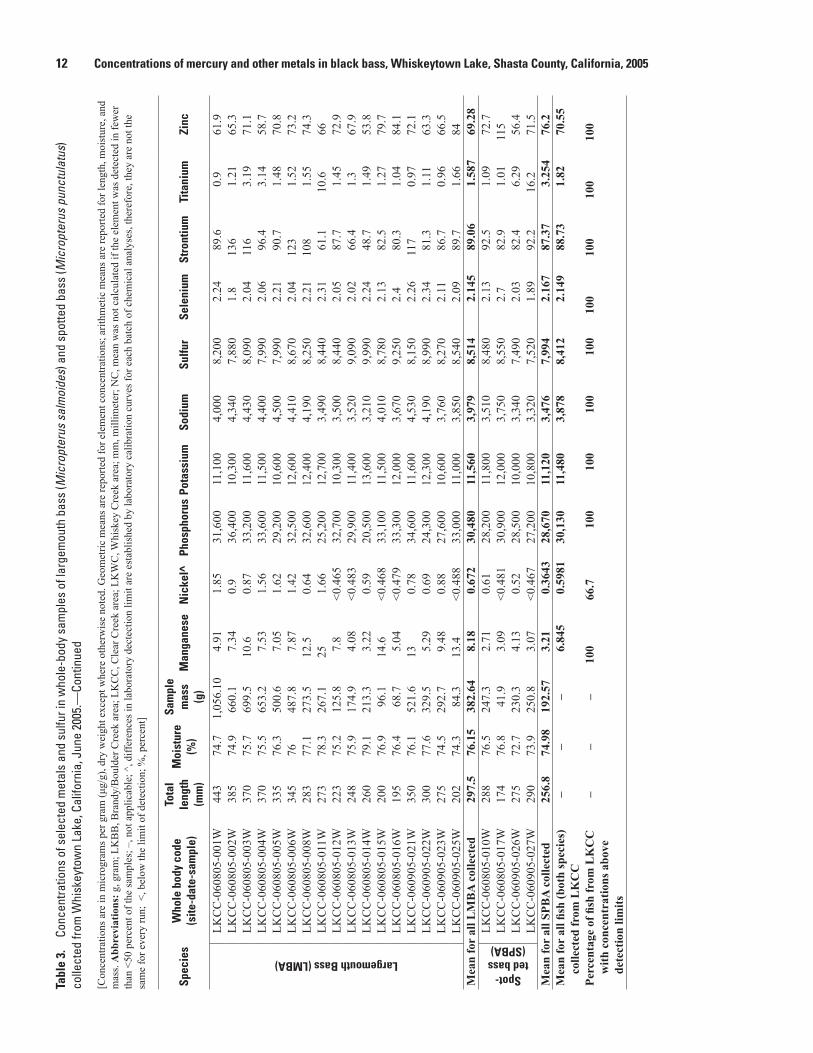
3. Concentrations of selected metals and sulfur in whole-body samples of largemouth bass (Micropterus salmoides) and spotted bass (Micropterus punctulatus) collected from Whiskeytown Lake, California, June 2005 ..............................8

iv
Multiply By To obtainLength
millimeter (mm) 0.03937 inch (in)Mass
microgram (μg) 0.000000035 ounce, avoirdupois (oz)milligram (mg) 0.000035 ounce, avoirdupois (oz)gram (g) ounce, avoirdupois (oz)kilogram (kg) 2.205 pound avoirdupois (lb)
Temperature in degrees Celsius (°C) may be converted to degrees Fahrenheit (°F) as follows:
°F=(1.8×°C)+32
Horizontal coordinate information is referenced to the “North American Datum of 1983 (NAD 83)”
Concentrations of chemical constituents in water are given either in milligrams per liter (mg/L) or micrograms per liter (μg/L).
Conversion Factors, Horizontal Datum, Acronym and Abbreviations, and Chemical Elements
Conversion Factors
Si to Inch/Pound
Acronyms, Abbreviations, and Chemical Notation (additional information given in parentheses)
CRV certified reference valueCVAAS cold vapor atomic-absorption spectroscopyCVAFS cold vapor atomic-fluorescence spectrometrydw dry weightICP-MS coupled plasma–mass spectroscopyICP-OES inductively coupled plasma–optical emission spectroscopyLOD limit of detectionMDL method detection limitMOhm megaohmNPS National Parks ServiceNRA National Recreation AreaNRCC National Research Council of CanadaOEHHA Office of Environmental Health Hazard AssessmentQA quality assuranceQC quality control

v
RPD relative percent differenceSRM standard reference materialSV screening valueTERL Trace Element Research Laboratory (College Station, Texas)USEPA U.S. Environmental Protection AgencyUSGS U.S. Geological SurveyWHIS Whiskeytown National Recreation Areav/v The formula for volume percent (v/v) is: [Volume of solute (mL)/
Volume of solution (mL)] x 100ww wet weightHgT total mercuryHg2+ divalent mercuryppm part per million (μg/g)spp. species (plural)WHIS Whiskeytown National Recreation Area
Chemical ElementsAl aluminumAs arsenicAg silverB boronBa bariumBe berylliumCa calciumCd cadmiumCo cobaltCr chromiumCu copperFe ironHg mercuryK potassiumMg magnesiumMn manganeseMo molybdenumNa sodiumNi nickelP phosphorusPb leadS sulfurSe selenium

vi
Sr strontiumTi titaniumV vanadiumZn zinc
Chemical Compounds, Isotopes,and other Chemical NotationCH3 methyl radicalCH4 methaneCH2Cl2 methylene chlorideCuSO4 copper sulfateFe(II) ferrous (divalent) ironFe(III) ferric (trivalent) ironHCl hydrochloric acidHF hydrofluoric acidHNO3 nitric acidHg0 elemental mercuryHg+ mercurous ionHg2+ mercuric ionHg(II) divalent mercuryHgCl2 mercuric chlorideHgT total mercury
203Hg(II) mercury-203 radiotracer divalent inorganic mercuryKBr potassium bromideMeHg methylmercury (monomethylmercury)N2 nitrogen gasNaBEt4 sodium tetra-ethyl borateO2 oxygen gasSiO2 silicon dioxide, or silicaSnCl2 stannous chloride
AbstractThis report presents the results of a reconnaissance study
conducted by the U.S. Geological Survey (USGS) to deter-mine mercury (Hg) and other selected metal concentrations in Black bass (Micropterus spp.) from Whiskeytown Lake, Shasta County, California. Total mercury concentrations were determined by cold-vapor atomic absorption spectroscopy (CVAAS) in fillets and whole bodies of each sampled fish. Selected metals scans were performed on whole bodies (less the fillets) by inductively coupled plasma–mass spectroscopy (ICP-MS) and inductively coupled plasma–optical emission spectroscopy (ICP-OES). Mercury concentrations in fil-let samples ranged from 0.06 to 0.52 micrograms per gram (µg/g) wet weight (ww). Total mercury (HgT) in the same fish whole-body samples ranged from 0.04 to 0.37 (µg/g, ww). Mercury concentrations in 17 percent of “legal catch size” (≥305 millimeters in length) were above the U.S. Environmen-tal Protection Agency water-quality criterion for the protection of human health of 0.30 µg/g (ww). These data will serve as a baseline for future monitoring efforts within Whiskeytown Lake.
IntroductionHistoric gold mining and naturally occurring mercury
from geothermal sources has left many areas of California subject to mercury contamination. (California Department of Conservation, 2000; Alpers and others, 2005). The Klamath-Trinity Mountains Region, specifically Trinity Lake and the upstream watershed, have previously documented elevated levels of mercury in resident sport fish (May and others, 2005). The highest density historical mine sites within the Clear Creek Watershed occur in the upper Clear Creek area,
and are likely sources of contamination to the local environ-ment and Whiskeytown Lake (fig. 1; Moore and Hughes, 2003). Run-off from abandoned mine lands has resulted in elevated levels of metals in the stream sediments (Moore and Hughes, 2003). Pristine water quality was identified by the Whiskeytown National Recreation Area (WHIS) and the National Parks Service (NPS) as WHIS’s Government Per-formance Results Act Goal Ia4 in their General Management Plan (National Parks Service, 1999). Whiskeytown Lake also serves as the domestic water supply for several nearby cities including Redding and Anderson. Additionally, the lake stores water for the Central Valley Project and functions as a major recreation area in Northern California, providing recreation for 700,000 visitors annually. Sport fishing is a popular recre-ational activity at Whiskeytown Lake and its tributaries. The lake supports recreational fishing for several species including two black bass species, largemouth bass (Micropterus salmoi-des) and spotted bass (M. punctulatus), which were collected as part of this reconnaissance effort. These lake fish samples are part of an ongoing effort that was begun in 2002 to charac-terize and monitor mercury and other metals ‘hot spots’ in the Upper Clear Creek watershed and WHIS.
During 2005, the U.S. Geological Survey (USGS) con-ducted a reconnaissance investigation in cooperation with the WHIS to assess mercury contamination associated with his-torical mining in the Clear Creek watershed. During this study, the USGS collected 63 black bass (44 largemouth bass and 19 spotted bass) from three locations within Whiskeytown Lake: Clear Creek, Brandy Creek, and Whiskey Creek arms (fig. 1; tables 1 and 2). Mercury levels were determined in boneless/skinless fillet tissue of each fish and the remaining whole-body sample of the same fish. Additional trace-metal analyses were also done on the remaining whole body.
Concentrations of Mercury and other Metals in Black Bass (Micropterus spp.) from Whiskeytown Lake, Shasta County, California, 2005
By Jason T. May1, Roger L. Hothem2, Marissa L. Bauer1, and Larry R. Brown1
1U.S. Geological Survey, California Water Science Center2U.S. Geological Survey, Western Ecological Research Center
2 Concentrations of mercury and other metals in black bass, Whiskeytown Lake, Shasta County, California, 2005
Whiskeytown NationalRecreation Area
Extent of sampling areas
EXPLANATION
Gold mine, production and prospect
Map Source: MAS/MILS (Minerals Availability System/Minerals Information Location System) database compiled by U.S. Bureau of Mines, now archived by USGS
Upper Clear Creek
Clear Creek ArmWhiskey Creek Arm
WhiskeytownLake
0
0 1 2
1 2 Miles
Kilometers
Brandy/Boulder Creek Area
CALIFORNIA
Area of mapPacific O
cean
SanFrancisco
Figure 1. Fish sampling locations within Whiskeytown Lake, Shasta County, California.

3
Table 1. Sites within Whiskeytown Lake, California, sampled during 2005.
[USGS, U.S. Geological Survey; °, degree; ʹ, minutes; N, north; W, west]
Official site nameShort name code
USGS site codeRange of collection areas
Upper latitude
Upper longitude
Lower latitude
Lower longitude
Whiskeytown Lake at Brandy Creek Arm near Whiskeytown, California
LKBB 403710122341501 40° 37.544' N 122° 35.046' W 40° 36.971' N 122° 33.469' W
Whiskeytown Lake at Clear Creek Arm near Whiskeytown, California
LKCC 403854122354801 40° 38.836' N 122° 36.232ʹ W 40° 38.806' N 122° 35.394' W
Whiskeytown Lake at Whiskey Creek Arm near Whiskeytown, California
LKWC 403859122332301 40° 39.174' N 122° 33.393' W 40° 38.875' N 122° 33.358' W
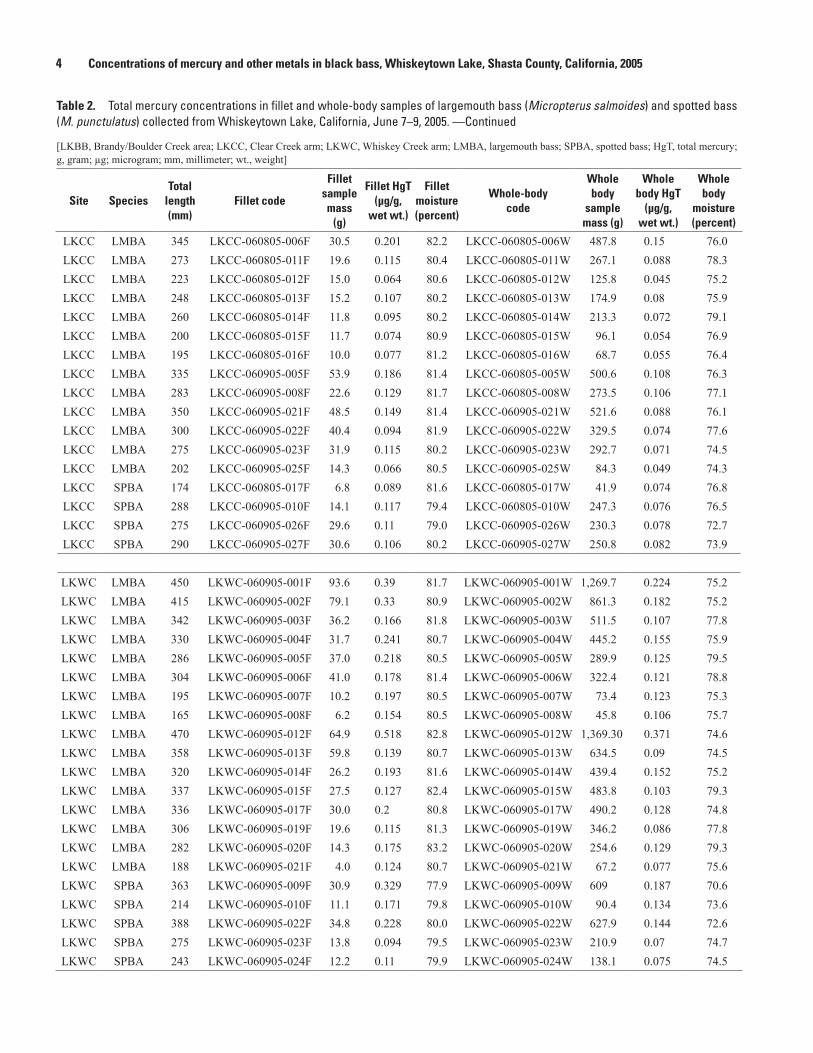
Table 2. Total mercury concentrations in fillet and whole-body samples of largemouth bass (Micropterus salmoides) and spotted bass (M. punctulatus) collected from Whiskeytown Lake, California, June 7–9, 2005. —Continued
[LKBB, Brandy/Boulder Creek area; LKCC, Clear Creek arm; LKWC, Whiskey Creek arm; LMBA, largemouth bass; SPBA, spotted bass; HgT, total mercury; g, gram; µg; microgram; mm, millimeter; wt., weight]
Site SpeciesTotal
length (mm)
Fillet code
Fillet sample mass
(g)
Fillet HgT (µg/g,
wet wt.)
Fillet moisture (percent)
Whole-body code
Whole body
sample mass (g)
Whole body HgT
(µg/g, wet wt.)
Whole body
moisture (percent)
LKBB LMBA 360 LKBB-060705-001F 63.7 0.119 81.8 LKBB-060705-001W 644.1 0.088 76.7LKBB LMBA 382 LKBB-060705-002F 76.7 0.157 82.6 LKBB-060705-002W 684.0 0.108 77.6LKBB LMBA 403 LKBB-060705-003F 114.5 0.343 80.4 LKBB-060705-003W 878.6 0.219 73.3LKBB LMBA 345 LKBB-060705-006F 47.0 0.137 81.9 LKBB-060705-006W 474.3 0.083 76.8LKBB LMBA 325 LKBB-060705-007F 62.3 0.214 81.4 LKBB-060705-007W 405.4 0.146 76.6LKBB LMBA 330 LKBB-060705-008F 53.5 0.198 81.3 LKBB-060705-008W 432.1 0.123 75.4LKBB LMBA 315 LKBB-060705-009F 43.7 0.169 81.7 LKBB-060705-009W 279.6 0.132 77.1LKBB LMBA 318 LKBB-060705-011F 34.8 0.084 81.7 LKBB-060705-011W 390.2 0.052 77.4LKBB LMBA 210 LKBB-060705-022F 7.8 0.096 81.3 LKBB-060705-022W 109.8 0.073 76.4LKBB LMBA 180 LKBB-060705-023F 10.8 0.069 81.7 LKBB-060705-023W 62.0 0.054 76.8LKBB LMBA 176 LKBB-060705-025F 4.8 0.135 82.9 LKBB-060705-025W 48.2 0.089 76.6LKBB SPBA 385 LKBB-060705-005F 76.1 0.233 79.7 LKBB-060705-005W 708.6 0.167 73.1LKBB SPBA 327 LKBB-060705-012F 28.5 0.209 82 LKBB-060705-012W 334.1 0.173 76.3LKBB SPBA 293 LKBB-060705-013F 15.7 0.091 81.1 LKBB-060705-013W 261.2 0.069 75.5LKBB SPBA 311 LKBB-060705-014F 28.1 0.267 80.9 LKBB-060705-014W 337.7 0.192 76.5LKBB SPBA 249 LKBB-060705-017F 23.7 0.104 79.5 LKBB-060705-017W 152.2 0.073 75.6LKBB SPBA 238 LKBB-060705-018F 18.6 0.118 79.8 LKBB-060705-018W 148.4 0.085 74.3LKBB SPBA 235 LKBB-060705-019F 12.7 0.148 81.6 LKBB-060705-019W 98.3 0.11 75.9LKBB SPBA 212 LKBB-060705-020F 13.0 0.096 79.3 LKBB-060705-020W 82.6 0.062 73.8LKBB SPBA 173 LKBB-060705-026F 6.1 0.092 82.4 LKBB-060705-026W 44.8 0.064 77.1LKBB SPBA 145 LKBB-060705-027F 3.3 0.074 81.4 LKBB-060705-027W 26.9 0.048 77.0
LKCC LMBA 443 LKCC-060805-001F 93.3 0.469 81.3 LKCC-060805-001W 1,056.10 0.258 74.7LKCC LMBA 385 LKCC-060805-002F 73.3 0.252 80.5 LKCC-060805-002W 660.1 0.138 74.9LKCC LMBA 370 LKCC-060805-003F 77.5 0.240 81.1 LKCC-060805-003W 699.5 0.134 75.7LKCC LMBA 370 LKCC-060805-004F 68.4 0.21 80.7 LKCC-060805-004W 653.2 0.127 75.5
Table 2. Total mercury concentrations in fillet and whole-body samples of largemouth bass (Micropterus salmoides) and spotted bass (M. punctulatus) collected from Whiskeytown Lake, California, June 7–9, 2005.
[LKBB, Brandy/Boulder Creek area; LKCC, Clear Creek arm; LKWC, Whiskey Creek arm; LMBA, largemouth bass; SPBA, spotted bass; HgT, total mer-cury; g, gram; µg; microgram; mm, millimeter; wt., weight]
4 Concentrations of mercury and other metals in black bass, Whiskeytown Lake, Shasta County, California, 2005
Table 2. Total mercury concentrations in fillet and whole-body samples of largemouth bass (Micropterus salmoides) and spotted bass (M. punctulatus) collected from Whiskeytown Lake, California, June 7–9, 2005. —Continued
[LKBB, Brandy/Boulder Creek area; LKCC, Clear Creek arm; LKWC, Whiskey Creek arm; LMBA, largemouth bass; SPBA, spotted bass; HgT, total mercury; g, gram; µg; microgram; mm, millimeter; wt., weight]
Site SpeciesTotal
length (mm)
Fillet code
Fillet sample mass
(g)
Fillet HgT (µg/g,
wet wt.)
Fillet moisture (percent)
Whole-body code
Whole body
sample mass (g)
Whole body HgT
(µg/g, wet wt.)
Whole body
moisture (percent)
LKCC LMBA 345 LKCC-060805-006F 30.5 0.201 82.2 LKCC-060805-006W 487.8 0.15 76.0LKCC LMBA 273 LKCC-060805-011F 19.6 0.115 80.4 LKCC-060805-011W 267.1 0.088 78.3LKCC LMBA 223 LKCC-060805-012F 15.0 0.064 80.6 LKCC-060805-012W 125.8 0.045 75.2LKCC LMBA 248 LKCC-060805-013F 15.2 0.107 80.2 LKCC-060805-013W 174.9 0.08 75.9LKCC LMBA 260 LKCC-060805-014F 11.8 0.095 80.2 LKCC-060805-014W 213.3 0.072 79.1LKCC LMBA 200 LKCC-060805-015F 11.7 0.074 80.9 LKCC-060805-015W 96.1 0.054 76.9LKCC LMBA 195 LKCC-060805-016F 10.0 0.077 81.2 LKCC-060805-016W 68.7 0.055 76.4LKCC LMBA 335 LKCC-060905-005F 53.9 0.186 81.4 LKCC-060805-005W 500.6 0.108 76.3LKCC LMBA 283 LKCC-060905-008F 22.6 0.129 81.7 LKCC-060805-008W 273.5 0.106 77.1LKCC LMBA 350 LKCC-060905-021F 48.5 0.149 81.4 LKCC-060905-021W 521.6 0.088 76.1LKCC LMBA 300 LKCC-060905-022F 40.4 0.094 81.9 LKCC-060905-022W 329.5 0.074 77.6LKCC LMBA 275 LKCC-060905-023F 31.9 0.115 80.2 LKCC-060905-023W 292.7 0.071 74.5LKCC LMBA 202 LKCC-060905-025F 14.3 0.066 80.5 LKCC-060905-025W 84.3 0.049 74.3LKCC SPBA 174 LKCC-060805-017F 6.8 0.089 81.6 LKCC-060805-017W 41.9 0.074 76.8LKCC SPBA 288 LKCC-060905-010F 14.1 0.117 79.4 LKCC-060805-010W 247.3 0.076 76.5LKCC SPBA 275 LKCC-060905-026F 29.6 0.11 79.0 LKCC-060905-026W 230.3 0.078 72.7LKCC SPBA 290 LKCC-060905-027F 30.6 0.106 80.2 LKCC-060905-027W 250.8 0.082 73.9
LKWC LMBA 450 LKWC-060905-001F 93.6 0.39 81.7 LKWC-060905-001W 1,269.7 0.224 75.2LKWC LMBA 415 LKWC-060905-002F 79.1 0.33 80.9 LKWC-060905-002W 861.3 0.182 75.2LKWC LMBA 342 LKWC-060905-003F 36.2 0.166 81.8 LKWC-060905-003W 511.5 0.107 77.8LKWC LMBA 330 LKWC-060905-004F 31.7 0.241 80.7 LKWC-060905-004W 445.2 0.155 75.9LKWC LMBA 286 LKWC-060905-005F 37.0 0.218 80.5 LKWC-060905-005W 289.9 0.125 79.5LKWC LMBA 304 LKWC-060905-006F 41.0 0.178 81.4 LKWC-060905-006W 322.4 0.121 78.8LKWC LMBA 195 LKWC-060905-007F 10.2 0.197 80.5 LKWC-060905-007W 73.4 0.123 75.3LKWC LMBA 165 LKWC-060905-008F 6.2 0.154 80.5 LKWC-060905-008W 45.8 0.106 75.7LKWC LMBA 470 LKWC-060905-012F 64.9 0.518 82.8 LKWC-060905-012W 1,369.30 0.371 74.6LKWC LMBA 358 LKWC-060905-013F 59.8 0.139 80.7 LKWC-060905-013W 634.5 0.09 74.5LKWC LMBA 320 LKWC-060905-014F 26.2 0.193 81.6 LKWC-060905-014W 439.4 0.152 75.2LKWC LMBA 337 LKWC-060905-015F 27.5 0.127 82.4 LKWC-060905-015W 483.8 0.103 79.3LKWC LMBA 336 LKWC-060905-017F 30.0 0.2 80.8 LKWC-060905-017W 490.2 0.128 74.8LKWC LMBA 306 LKWC-060905-019F 19.6 0.115 81.3 LKWC-060905-019W 346.2 0.086 77.8LKWC LMBA 282 LKWC-060905-020F 14.3 0.175 83.2 LKWC-060905-020W 254.6 0.129 79.3LKWC LMBA 188 LKWC-060905-021F 4.0 0.124 80.7 LKWC-060905-021W 67.2 0.077 75.6LKWC SPBA 363 LKWC-060905-009F 30.9 0.329 77.9 LKWC-060905-009W 609 0.187 70.6LKWC SPBA 214 LKWC-060905-010F 11.1 0.171 79.8 LKWC-060905-010W 90.4 0.134 73.6LKWC SPBA 388 LKWC-060905-022F 34.8 0.228 80.0 LKWC-060905-022W 627.9 0.144 72.6LKWC SPBA 275 LKWC-060905-023F 13.8 0.094 79.5 LKWC-060905-023W 210.9 0.07 74.7LKWC SPBA 243 LKWC-060905-024F 12.2 0.11 79.9 LKWC-060905-024W 138.1 0.075 74.5

Laboratory Methods of Chemical Analysis 5
Purpose and ScopeThe purpose of this report is to present information
regarding the concentration of metals in sport fish from the Whiskeytown Lake. Data were collected by USGS person-nel. In addition, this data report adds to the limited number of studies for metal concentration in sport fish for this lake. The data from this report will be of use to scientists, managers, and other persons concerned with the metals concentrations in sport fish from Whiskeytown Lake and regional sport fisheries.
Field Methods and Sample Preservation Techniques
Field and laboratory preparatory methods were similar to those used by May and others (2000, 2005). All fish were collected by using electrofishing equipment and dip nets. Fish were held in clean containers with ambient water until they were weighed, to the nearest gram, and measured for standard and total length, in millimeters. After recording the length and mass, spines or scales were removed from each fish for future age determination. Each fish was then wrapped in clean, heavy-duty aluminum foil, labeled, placed in a plastic bag on wet ice and held for less than 8 hours. The fish were then taken to the USGS Dixon Field Station laboratory, where they were stored frozen until they were processed and sent to the contract laboratory for chemical analyses.
The processing of fish followed standard procedures (U.S. Environmental Protection Agency, 1995). Fish were handled with powder-free latex gloves, and dissections were performed on a new sheet of heavy-duty aluminum foil for each fish. High-quality stainless steel instruments and dispos-able scalpel blades were used in the processing of the fish samples. Scalpel blades were changed and instruments were cleaned thoroughly between samples. Cleaning the instru-ments involved washing with deionized water and laboratory detergent, acid washing, and finally rinsing with deionized water before and after dissection of each fish specimen.
Larger fish were thawed and scaled before dissection. Boneless and skinless fillet portions were taken from the left upper medial-axial region of the fish in an approximately rectangular shape. Excised tissues were placed directly into labeled, chemically cleaned borosilicate-glass jars on a pre-tared balance. The sample mass was recorded, and a Teflon-lined lid was screwed atop each jar and sealed with Parafilm.
Fish tissue samples were stored frozen in sealed sample jars until they were packed in coolers with dry ice and shipped to the contract analytical laboratory at Texas A&M University in College Station, Texas. The remaining whole-body of each fish was packaged into jars with Teflon-lined lids and analyzed for total metals.
Laboratory Methods of Chemical Analysis
Analysis of mercury (Hg) in fish samples was done at the Trace Element Research Laboratory (TERL) at Texas A&M University in College Station, Texas, under the direc-tion of Dr. Robert Taylor. Samples were received frozen and were assigned unique identification numbers upon arrival at the laboratory. Tissue samples were transferred to labeled, tared polyethylene zip-lock bags, weighed, and lyophilized in a Labconco Freezone 12L freeze dryer. Moisture content was determined by weight loss following freeze drying for both fillet and whole-body samples.
Procedures that require tissue samples to be freeze-dried to determine mercury concentrations result in removal of the original moisture in the sample. Additionally, tissue mois-ture is a relative measure of the quality of the tissue sample. Moisture content was determined by weight loss upon freeze drying and is expressed as weight percentage of the origi-nal wet sample. Depending on sample size, either the whole sample or a representative aliquot was frozen and then dried under vacuum until a constant weight was attained. Samples were prepared and dried using plastic materials to minimize potential contamination artifacts.
Both fillet and whole-body tissue samples were prepared for analysis by powdering freeze dried tissue in a Spex 6800 cryomill. Samples were transferred to polycarbonate contain-ers, chilled to liquid nitrogen temperatures, and ground to a fine powder with a stainless steel impacter in the cryomill. Homogenized samples were stored in zip-lock bags until ana-lyzed. Aliquots of dry, powdered tissue samples were weighed to the nearest 0.0001 g and transferred to polypropylene diges-tion vessels. Samples were digested at a temperature of 95°C with nitric and hydrochloric acids and hydrogen peroxide (3, 1, and 2 mL milliliters, respectively) in a CPI graphite block digester. Digest solutions were made to volume with Milli-Q 18 MOhm (megaohm) deionized water and were stored in polyethylene bottles until analyzed.

6 Concentrations of mercury and other metals in black bass, Whiskeytown Lake, Shasta County, California, 2005
Three methods were used to determine metal concentra-tions in fish tissue: cold-vapor atomic absorption spectros-copy (CVAAS) for HgT in filets and whole body; inductively coupled plasma–mass spectroscopy (ICPMS); and, inductively coupled plasma–optical emission spectroscopy (ICP-OES) for other trace metals in the whole body.
Before samples were analyzed for Hg by CVAAS, the Hg was converted to the divalent mercury (Hg2+) form. Mercury was digested using a modified version of U.S. Environmental Protection Agency (USEPA) methods 245.5 and 245.6 (U.S. Environmental Protection Agency, 1991, 1995, 2001, 2003). Tissue samples were homogenized in the original sample con-tainers by using a Tekmar Tissumizer, and then subsampled. Tissue subsamples were digested with nitric acid, sulfuric acid, potassium permanganate, and potassium persulfate in polypropylene tubes in a water bath at 90 to 95 degrees Cel-sius (°C). Before analysis, hydroxylamine hydrochloride was added to reduce excess permanganate, and the samples were brought to volume using distilled-deionized water.
In the CVAAS procedure for determination of Hg, divalent mercury (Hg2+) in aqueous samples (digests of tissue samples) is reduced to the elemental state (Hg0) by a strong reducing agent (stannous chloride). Gaseous Hg0 enters the sweep gas and is introduced into an atomic absorption cell, where light produced by a mercury-vapor lamp is absorbed by the free Hg0 atoms. Mercury concentration in the sample is determined by comparing light absorption of the sample with that of external calibration standards. The range limit of detection (LOD) for these analyses was 0.01 to 0.06 μg/g, dry weight (dw).
Inductively coupled plasma–mass spectroscopy was used during the metals scan to determine arsenic (As), cadmium (Cd), lead (Pb), and selenium (Se). Tissue digests were diluted with Milli-Q 18 MOhm deionized water as necessary to reduce their nitric acid concentrations to no greater than 2 per-cent v/v (volume by volume )and were then analyzed in pulse mode on a Perkin Elmer/Sciex DRC 2 ICP-MS instrument equipped with a dynamic reaction cell to eliminate molecular ion interferences on several elements (For example: As, Se, Cr, and V). Elemental concentrations were determined using
internal standards to compensate for slight matrix effects and instrumental performance changes.
Inductively coupled plasma–optical emission spectros-copy was used to determine aluminum (Al), barium (Ba), cal-cium (Ca), chromium (Cr), copper (Cu), iron (Fe), potassium (K), magnesium (Mg), manganese (Mn), sodium (Na), nickel (Ni), phosphorus (P), sulfur (S), strontium (Sr), titanium (Ti), and zinc (Zn) in fish samples. Digest solutions were analyzed undiluted on an axial Spectro CirOs instrument, using internal standards to compensate for matrix effects and instrument drift. Final calculations utilized off-peak background correc-tion and inter-element correction equations.
Quality Assurance and Quality ControlAs part of normal quality-assurance (QA) and quality-
control (QC) procedures, a standard number of procedural blanks, laboratory duplicate samples, spiked samples, and standard reference materials were analyzed at the TERL dur-ing 2005–2006 for each set of fish samples from Whiskeytown Lake.
Procedural blanks were analyzed to quantify the amount of total mercury and other metals that may have been added inadvertently during sample processing. A total of 4 proce-dural blanks were analyzed. All QA/QC results were within acceptable limits for TERL standards for all the samples.
Laboratory replicate samples were analyzed to provide a measure of the precision of the methods used for analysis. Fifteen of the 63 samples were used as laboratory replicates. After the sample was homogenized, two separate subsamples were taken and analyzed. Replicates had to meet certain criteria to fall within the 95 percent confidence interval. If the sample concentration was within 2 to 10 times the limit of detection (LOD), the replicate had to be within 20 percent of the original value. If the sample concentration was greater than 10 times the LOD, the replicate sample had to be within 10 percent of the original value.

Results and Discussion 7
Relative percentage difference (RPD) is another measure of precision for replicate samples. It is computed as 100 times the absolute value of the difference between two replicate analyses divided by their mean. Values of RPD ranged from 0.24 to 9.17 percent, well within acceptable limits are set by TERL.
Spiked samples were analyzed to provide a measure of the accuracy of the methods used for analysis. Subsamples from 18 of the 63 fish were used as spiked samples and were evaluated for spike recovery. After the sample was homoge-nized, two separate subsamples were taken, one was processed as a sample, and the other spiked with a known quantity of analyte. Spike recovery was calculated as the measured con-centration from the spiked sample minus the measured con-centration from the unspiked sample, divided by the expected concentration in the spiked sample, and multiplied by 100 per-cent. Spike recoveries were determined to be between 93.5 to 107 percent. Spike recoveries were considered acceptable if the average recovery was 85 to 115 percent (Robert Taylor, Trace Element Researach Laboratory, College Station, Texas, written commun., 2011).
Standard reference material (SRM) was analyzed to provide an estimate of range in accuracy of the laboratory instrument used for the determination of total mercury con-centration and to ensure that this method produced results that were comparable to those obtained by an independent organi-zation. The SRM used by the TERL was dogfish (Squalus sp.) muscle (DORM-2), certified by the National Research Council Canada (NRCC) as having a certified reference value (CRV) of 4.64 μg/g mercury (dry). The percentage recovery for the 18 analyses of DORM-2 in the three sample sets ranged from 82.7 to 107 percent, which is within acceptable limits (Robert Taylor, Trace Element Research Laboratory, College Station, Texas, written commun., 2011).
Results and DiscussionA total of 63 black bass (largemouth and spotted bass)
were collected and processed for total mercury in fillet and whole-body samples (table 2). Whole-body samples were also analyzed for total metals (table 3). Total mercury in fil-let samples ranged from 0.06 to 0.52 μg/g ww (wet weight) and 0.04 to 0.37 μg/g ww in whole-body samples. Mercury concentrations in 5 of the 30 black bass fillet samples that were of legal catch size (≥305 millimeters in length) exceeded the USEPA water-quality criterion for the protection of human health (0.3 μg/g ww), (U.S. Environmental Protection Agency, 2001). Black bass collected from Whiskeytown Lake show a general trend of increasing mercury concentration with increasing size (figure 2) and similar concentrations of total mercury in fillet and whole-body samples (r2 = 0.937) (figure 3).
Each whole-body sample was processed for total metals scan. The following metals of ecological importance are reported alphabetically in μg/g dry weight with mean μg/g, range μg/g, and percent of non-detects (percent nd) in parentheses: arsenic (1.1μg/g , 1.82–0.746 μg/g), cadmium (1.11 μg/g , 1.35–0.024 μg/g, 2 percent nd), copper (2.18 μg/g , 9.54–0.89 μg/g), mercury (0.466 μg/g, 1.46–0.18 μg/g), nickel (5.83 μg/g, 172.0–0.46 μg/g, 24 percent nd), lead (0.088 μg/g, 0.205–0.047 μg/g, 90 percent nd), selenium (2.4 μg/g, 3.83–1.8 μg/g), and zinc (75.39 μg/g, 121.0–48.4 μg/g). Visual comparisons of the ranges of data from metal scans indicated that there is no substantial difference between collection area or species for any metal.

8 Concentrations of mercury and other metals in black bass, Whiskeytown Lake, Shasta County, California, 2005Ta
ble
3.
Conc
entra
tions
of s
elec
ted
met
als
and
sulfu
r in
who
le-b
ody
sam
ples
of l
arge
mou
th b
ass
(Mic
ropt
erus
sal
moi
des)
and
spo
tted
bass
(Mic
ropt
erus
pun
ctul
atus
) co
llect
ed fr
om W
hisk
eyto
wn
Lake
, Cal
iforn
ia, J
une
2005
. —Co
ntin
ued
[Con
cent
ratio
ns a
re in
mic
rogr
ams p
er g
ram
(μg/
g), d
ry w
eigh
t exc
ept w
here
oth
erw
ise
note
d. G
eom
etric
mea
ns a
re re
porte
d fo
r ele
men
t con
cent
ratio
ns; a
rithm
etic
mea
ns a
re re
porte
d fo
r len
gth,
moi
stur
e, a
nd
mas
s. A
bbre
viat
ions
: g, g
ram
; LK
BB
, Bra
ndy/
Bou
lder
Cre
ek a
rea;
LK
CC
, Cle
ar C
reek
are
a; L
KW
C, W
hisk
ey C
reek
are
a; m
m, m
illim
eter
; NC
, mea
n w
as n
ot c
alcu
late
d if
the
elem
ent w
as d
etec
ted
in fe
wer
th
an <
50 p
erce
nt o
f the
sam
ples
; –, n
ot a
pplic
able
; ^, d
iffer
ence
s in
labo
rato
ry d
ecte
ctio
n lim
it ar
e es
tabl
ishe
d by
labo
rato
ry c
alib
ratio
n cu
rves
for e
ach
batc
h of
che
mic
al a
naly
ses,
ther
efor
e, th
ey a
re n
ot th
e sa
me
for e
very
run;
<, b
elow
the
limit
of d
etec
tion;
%, p
erce
nt]
Spec
ies
Who
le b
ody
code
(s
ite-d
ate-
sam
ple)
Tota
l le
ngth
(m
m)
Moi
stur
e (%
)
Sam
ple
mas
s (g
)A
lum
inum
^A
rsen
icB
ariu
mCa
dmiu
mCa
lciu
mCh
rom
ium
Co
pper
Ir
on
Mer
cury
M
agne
sium
Largemouth Bass (LMBA)
LKB
B-0
6070
5-00
1W36
076
.764
4.1
140
0.93
10.9
1.35
60,7
0011
.32.
928
00.
377
1,65
0LK
BB
-060
705-
002W
382
77.6
684
66.6
1.16
9.25
0.07
75,9
0021
.92.
4125
40.
481
1,95
0LK
BB
-060
705-
003W
403
73.3
878.
6<4
.64
1.27
5.09
0.11
63,0
0036
54.
741,
900
0.82
11,
650
LKB
B-0
6070
5-00
6W34
576
.847
4.3
9.94
1.01
10.9
0.05
68,3
0035
2.52
288
0.35
91,
700
LKB
B-0
6070
5-00
7W32
576
.640
5.4
9.66
1.04
5.53
0.05
58,5
008.
921.
3214
60.
626
1,65
0LK
BB
-060
705-
008W
330
75.4
432.
18.
610.
995.
640.
0555
,400
5.62
3.51
111
0.5
1,59
0LK
BB
-060
705-
009W
315
77.1
279.
6<4
.66
0.89
4.27
0.05
46,8
004.
361.
610
80.
578
1,56
0LK
BB
-060
705-
011W
318
77.4
390.
25.
460.
97.
070.
0246
,600
3.55
1.45
98.9
0.23
21,
530
LKB
B-0
6070
5-02
2W21
076
.410
9.8
6.7
1.2
7.52
0.06
69,7
00<0
.47
1.41
52.7
0.31
11,
860
LKB
B-0
6070
5-02
3W18
076
.862
6.6
1.29
7.86
0.05
62,1
003.
142.
5271
.70.
232
1,84
0LK
BB
-060
705-
025W
176
76.6
48.2
12.7
1.82
6.13
0.06
92,7
002.
881.
8789
.60.
382,
010
Mea
n fo
r al
l LM
BA
col
lect
ed
304
76.4
400
10.2
1.11
6.9
0.07
62,4
407.
645
2.20
416
3.8
0.41
421,
720
Spotted bass (SPBA)
LKB
B-0
6070
5-00
5W38
573
.170
8.6
6.4
0.85
4.93
0.05
58,8
0079
.61.
9771
00.
619
1,57
0LK
BB
-060
705-
012W
327
76.3
334.
111
.31.
074.
46<0
.02
56,8
002.
771.
2272
.30.
729
1,63
0LK
BB
-060
705-
013W
293
75.5
261.
215
.10.
986.
040.
0455
,700
2.72
0.89
81.4
0.28
31,
750
LKB
B-0
6070
5-01
4W31
176
.533
7.7
8.08
0.9
4.91
0.03
48,0
000.
551.
2966
.30.
819
1,57
0LK
BB
-060
705-
017W
249
75.6
152.
214
.20.
753.
230.
0640
,000
2.5
1.49
96.5
0.30
11,
410
LKB
B-0
6070
5-01
8W23
874
.314
8.4
6.01
1.27
6.06
0.05
54,8
001.
061.
449
0.33
11,
660
LKB
B-0
6070
5-01
9W23
575
.998
.313
.91.
136.
640.
0666
,700
1.04
1.34
61.1
0.45
71,
850
LKB
B-0
6070
5-02
0W21
273
.882
.6<4
.74
1.44
5.87
0.02
58,0
001.
681.
0140
.70.
235
1,65
0LK
BB
-060
705-
026W
173
77.1
44.8
<6.8
21.
375.
20.
0567
,500
2.05
1.83
65.4
0.27
81,
750
LKB
B-0
6070
5-02
7W14
577
26.9
13.6
1.17
7.02
0.09
68,7
001.
711.
9779
.30.
208
1,82
0M
ean
for
all S
PBA
col
lect
ed
257
75.5
219
81.
075.
320.
0456
,800
2.35
81.
396
83.7
10.
3812
1,66
1M
ean
for
all fi
sh (b
oth
spec
ies)
fr
om L
KB
B–
––
9.12
71.
092
6.13
20.
0559
,700
4.36
71.
773
119
0.39
811,
692
Perc
enta
ge o
f fish
from
LK
BB
w
ith c
once
ntra
tions
abo
ve
dete
ctio
n lim
its
––
–85
.710
010
095
.210
095
.210
010
010
010
0
Tabl
e 3.
Co
ncen
tratio
ns o
f sel
ecte
d m
etal
s an
d su
lfur i
n w
hole
-bod
y sa
mpl
es o
f lar
gem
outh
bas
s (M
icro
pter
us s
alm
oide
s) a
nd s
potte
d ba
ss (M
icro
pter
us p
unct
ulat
us)
colle
cted
from
Whi
skey
tow
n La
ke, C
alifo
rnia
, Jun
e 20
05.
[Con
cent
ratio
ns a
re in
mic
rogr
ams p
er g
ram
(μg/
g), d
ry w
eigh
t exc
ept w
here
oth
erw
ise
note
d. G
eom
etric
mea
ns a
re re
porte
d fo
r ele
men
t con
cent
ratio
ns; a
rithm
etic
mea
ns a
re re
porte
d fo
r len
gth,
moi
stur
e, a
nd
mas
s. A
bbre
viat
ions
: g, g
ram
; LK
BB
, Bra
ndy/
Bou
lder
Cre
ek a
rea;
LK
CC
, Cle
ar C
reek
are
a; L
KW
C, W
hisk
ey C
reek
are
a; m
m, m
illim
eter
; NC
, mea
n w
as n
ot c
alcu
late
d if
the
elem
ent w
as d
etec
ted
in fe
wer
th
an <
50 p
erce
nt o
f the
sam
ples
; –, n
ot a
pplic
able
; ^, d
iffer
ence
s in
labo
rato
ry d
ecte
ctio
n lim
it ar
e es
tabl
ishe
d by
labo
rato
ry c
alib
ratio
n cu
rves
for e
ach
batc
h of
che
mic
al a
naly
ses,
ther
efor
e, th
ey a
re n
ot th
e sa
me
for e
very
run;
<, b
elow
the
limit
of d
etec
tion;
%, p
erce
nt]

Results and Discussion 9Ta
ble
3.
Conc
entra
tions
of s
elec
ted
met
als
and
sulfu
r in
who
le-b
ody
sam
ples
of l
arge
mou
th b
ass
(Mic
ropt
erus
sal
moi
des)
and
spo
tted
bass
(Mic
ropt
erus
pun
ctul
atus
) co
llect
ed fr
om W
hisk
eyto
wn
Lake
, Cal
iforn
ia, J
une
2005
. —Co
ntin
ued
[Con
cent
ratio
ns a
re in
mic
rogr
ams p
er g
ram
(μg/
g), d
ry w
eigh
t exc
ept w
here
oth
erw
ise
note
d. G
eom
etric
mea
ns a
re re
porte
d fo
r ele
men
t con
cent
ratio
ns; a
rithm
etic
mea
ns a
re re
porte
d fo
r len
gth,
moi
stur
e, a
nd
mas
s. A
bbre
viat
ions
: g, g
ram
; LK
BB
, Bra
ndy/
Bou
lder
Cre
ek a
rea;
LK
CC
, Cle
ar C
reek
are
a; L
KW
C, W
hisk
ey C
reek
are
a; m
m, m
illim
eter
; NC
, mea
n w
as n
ot c
alcu
late
d if
the
elem
ent w
as d
etec
ted
in fe
wer
th
an <
50 p
erce
nt o
f the
sam
ples
; –, n
ot a
pplic
able
; ^, d
iffer
ence
s in
labo
rato
ry d
ecte
ctio
n lim
it ar
e es
tabl
ishe
d by
labo
rato
ry c
alib
ratio
n cu
rves
for e
ach
batc
h of
che
mic
al a
naly
ses,
ther
efor
e, th
ey a
re n
ot th
e sa
me
for e
very
run;
<, b
elow
the
limit
of d
etec
tion;
%, p
erce
nt]
Spec
ies
Who
le b
ody
code
(s
ite-d
ate-
sam
ple)
Tota
l le
ngth
(m
m)
Moi
stur
e (%
)
Sam
ple
mas
s (g
)A
lum
inum
^A
rsen
icB
ariu
mCa
dmiu
mCa
lciu
mCh
rom
ium
Co
pper
Ir
on
Mer
cury
M
agne
sium
Largemouth Bass (LMBA)
LKC
C-0
6080
5-00
1W44
374
.71,
056.
10<4
.88
13.
60.
1257
,400
4.11
1.78
90.7
1.02
1,55
0LK
CC
-060
805-
002W
385
74.9
660.
18.
451.
138.
390.
1171
,200
1.91
5.34
86.4
0.54
81,
700
LKC
C-0
6080
5-00
3W37
075
.769
9.5
78.2
1.12
7.32
0.12
60,5
001.
652.
217
30.
551
1,63
0LK
CC
-060
805-
004W
370
75.5
653.
255
.51.
076.
020.
0561
,900
3.02
2.15
136
0.51
71,
700
LKC
C-0
6080
5-00
5W33
576
.350
0.6
14.1
0.94
8.24
0.14
53,3
004.
019.
5491
.50.
456
1,45
0LK
CC
-060
805-
006W
345
7648
7.8
21.3
1.18
10.3
0.08
60,0
003.
324.
3416
20.
626
1,80
0LK
CC
-060
805-
008W
283
77.1
273.
511
.90.
987.
250.
0957
,900
1.91
1.36
102
0.46
51,
670
LKC
C-0
6080
5-01
1W27
378
.326
7.1
322
1.51
6.55
0.1
39,1
002.
672.
8664
10.
405
1,55
0LK
CC
-060
805-
012W
223
75.2
125.
815
.31.
183.
590.
0359
,000
0.91
1.3
57.4
0.18
1,57
0LK
CC
-060
805-
013W
248
75.9
174.
911
.50.
942.
550.
0451
,000
0.86
0.99
51.8
0.33
31,
560
LKC
C-0
6080
5-01
4W26
079
.121
3.3
14.7
0.78
3.4
0.04
28,4
002.
221.
2397
.20.
343
1,39
0LK
CC
-060
805-
015W
200
76.9
96.1
131.
294.
240.
0658
,800
0.87
1.88
590.
232
1,62
0LK
CC
-060
805-
016W
195
76.4
68.7
5.25
1.11
3.34
0.03
57,9
000.
611.
1243
0.23
51,
660
LKC
C-0
6090
5-02
1W35
076
.152
1.6
<4.6
81.
137.
640.
0565
,400
1.76
1.13
84.6
0.36
81,
730
LKC
C-0
6090
5-02
2W30
077
.632
9.5
16.9
0.97
6.09
0.05
39,5
001.
054.
4590
0.33
11,
440
LKC
C-0
6090
5-02
3W27
574
.529
2.7
8.17
1.08
6.4
0.05
48,1
001.
694.
1586
.30.
278
1,41
0LK
CC
-060
905-
025W
202
74.3
84.3
22.8
1.19
5.6
0.07
58,6
000.
962.
5976
.30.
189
1,61
0M
ean
for
all L
MB
A c
olle
cted
29
7.5
76.1
538
2.64
15.2
71.
083
5.50
70.
064
53,4
201.
687
2.28
997
.56
0.37
651,
586
Spotted bass (SPBA)
LKC
C-0
6080
5-01
0W28
876
.524
7.3
110.
984.
750.
0446
,900
1.01
0.98
68.2
0.32
51,
560
LKC
C-0
6080
5-01
7W17
476
.841
.97.
241.
183.
070.
0751
,900
0.81
1.03
50.5
0.31
71,
700
LKC
C-0
6090
5-02
6W27
572
.723
0.3
<4.6
60.
995.
470.
149
,800
4.36
114
60.
284
1,38
0LK
CC
-060
905-
027W
290
73.9
250.
810
.30.
915.
130.
0846
,700
3.49
1.44
117
0.31
31,
450
Mea
n fo
r al
l SPB
A c
olle
cted
256.
874
.98
192.
576.
612
1.01
14.
498
0.06
748
,780
1.87
51.
098
87.5
80.
3094
1,51
8M
ean
for
all fi
sh (b
oth
spec
ies)
co
llect
ed fr
om L
KC
C–
––
13.0
21.
065.
290.
064
52,5
001.
721
1.99
95.5
70.
3627
1,57
3
Perc
enta
ge o
f fish
from
LK
CC
w
ith c
once
ntra
tions
abo
ve
dete
ctio
n lim
its
––
–85
.710
010
010
010
010
010
010
010
010
0

10 Concentrations of mercury and other metals in black bass, Whiskeytown Lake, Shasta County, California, 2005Ta
ble
3.
Conc
entra
tions
of s
elec
ted
met
als
and
sulfu
r in
who
le-b
ody
sam
ples
of l
arge
mou
th b
ass
(Mic
ropt
erus
sal
moi
des)
and
spo
tted
bass
(Mic
ropt
erus
pun
ctul
atus
) co
llect
ed fr
om W
hisk
eyto
wn
Lake
, Cal
iforn
ia, J
une
2005
. —Co
ntin
ued
[Con
cent
ratio
ns a
re in
mic
rogr
ams p
er g
ram
(μg/
g), d
ry w
eigh
t exc
ept w
here
oth
erw
ise
note
d. G
eom
etric
mea
ns a
re re
porte
d fo
r ele
men
t con
cent
ratio
ns; a
rithm
etic
mea
ns a
re re
porte
d fo
r len
gth,
moi
stur
e, a
nd
mas
s. A
bbre
viat
ions
: g, g
ram
; LK
BB
, Bra
ndy/
Bou
lder
Cre
ek a
rea;
LK
CC
, Cle
ar C
reek
are
a; L
KW
C, W
hisk
ey C
reek
are
a; m
m, m
illim
eter
; NC
, mea
n w
as n
ot c
alcu
late
d if
the
elem
ent w
as d
etec
ted
in fe
wer
th
an <
50 p
erce
nt o
f the
sam
ples
; –, n
ot a
pplic
able
; ^, d
iffer
ence
s in
labo
rato
ry d
ecte
ctio
n lim
it ar
e es
tabl
ishe
d by
labo
rato
ry c
alib
ratio
n cu
rves
for e
ach
batc
h of
che
mic
al a
naly
ses,
ther
efor
e, th
ey a
re n
ot th
e sa
me
for e
very
run;
<, b
elow
the
limit
of d
etec
tion;
%, p
erce
nt]
Spec
ies
Who
le b
ody
code
(s
ite-d
ate-
sam
ple)
Tota
l le
ngth
(m
m)
Moi
stur
e (%
)
Sam
ple
mas
s (g
)A
lum
inum
^A
rsen
icB
ariu
mCa
dmiu
mCa
lciu
mCh
rom
ium
Co
pper
Ir
on
Mer
cury
M
agne
sium
Largemouth Bass (LMBA)
LKW
C-0
6090
5-00
1W45
075
.21,
269.
7<4
.38
0.94
7.06
0.17
58,0
001.
072.
7778
.10.
902
1,50
0LK
WC
-060
905-
002W
415
75.2
861.
34.
751.
129.
840.
1259
,400
1.64
2.25
101
0.73
51,
570
LKW
C-0
6090
5-00
3W34
277
.851
1.5
106
1.27
9.53
0.11
67,4
002.
961.
8619
50.
484
1,84
0LK
WC
-060
905-
004W
330
75.9
445.
211
.40.
957.
590.
1241
,100
3.72
2.67
177
0.64
31,
380
LKW
C-0
6090
5-00
5W28
679
.528
9.9
141.
2515
.31.
0457
,000
0.80
64.
4612
30.
611,
700
LKW
C-0
6090
5-00
6W30
478
.832
2.4
13.5
0.93
7.33
0.28
45,5
002.
824.
9713
50.
573
1,60
0LK
WC
-060
905-
007W
195
75.3
73.4
10.2
1.39
4.35
0.06
258
,100
1.25
2.01
69.4
0.49
71,
790
LKW
C-0
6090
5-00
8W16
575
.745
.817
.71.
524.
930.
112
59,2
002.
112.
2180
.70.
438
1,73
0LK
WC
-060
905-
012W
470
74.6
1,36
9.3
<4.5
41.
084.
320.
1752
,200
3.82
1.02
83.7
1.46
1,49
0LK
WC
-060
905-
013W
358
74.5
634.
54.
550.
996.
860.
0745
,600
1.84
1.33
920.
354
1,42
0LK
WC
-060
905-
014W
320
75.2
439.
4<4
.38
0.96
2.31
0.08
34,4
002.
511.
3164
.80.
611
1,28
0LK
WC
-060
905-
015W
337
79.3
483.
826
.80.
927.
620.
0539
,800
1.47
1.63
84.1
0.49
91,
430
LKW
C-0
6090
5-01
7W33
674
.849
0.2
<4.3
81.
244.
950.
0550
,900
4.36
1.59
81.6
0.50
91,
450
LKW
C-0
6090
5-01
9W30
677
.834
6.2
8.57
1.04
7.01
0.07
46,1
001.
472.
5690
.90.
386
1,60
0LK
WC
-060
905-
020W
282
79.3
254.
6<4
.74
0.89
5.26
0.09
45,7
001.
521.
5779
.50.
625
1,50
0LK
WC
-060
905-
021W
188
75.6
67.2
9.33
1.1
4.64
0.14
59,1
001.
312.
8751
.10.
314
1,65
0M
ean
for
all L
MB
A c
olle
cted
3
17.8
76.5
349
4.03
7.53
31.
085
6.24
40.
115
50,4
501.
934
2.11
693
.13
0.56
071,
551
Spotted bass (SPBA)
LKW
C-0
6090
5-00
9W36
370
.660
9<4
.70
0.86
1.94
0.07
30,4
001.
971.
2767
.50.
636
1,15
0LK
WC
-060
905-
010W
214
73.6
90.4
<4.7
21.
076.
540.
6450
,300
1.01
1.25
40.6
0.50
81,
690
LKW
C-0
6090
5-02
2W38
872
.662
7.9
<4.6
61.
15.
990.
0354
,800
1.84
1.02
59.1
0.52
41,
590
LKW
C-0
6090
5-02
3W27
574
.721
0.9
7.79
1.68
4.71
0.06
54,2
000.
602
1.84
43.5
0.27
71,
700
LKW
C-0
6090
5-02
4W24
374
.513
8.1
4.54
1.51
3.83
0.06
50,2
000.
648
1.51
45.7
0.29
51,
640
Mea
n fo
r al
l SPB
A c
olle
cted
29
6.6
73.2
335.
27N
C1.
207
4.24
46,9
501.
074
1.35
150
.30.
4248
1,53
8M
ean
for
all fi
sh (b
oth
spec
ies)
co
llect
ed fo
r L
KW
C–
––
6.23
51.
113
5.69
0.11
49,5
901.
681
1.90
280
.42
0.52
481,
548
Perc
enta
ge o
f fish
from
LK
WC
w
ith c
once
ntra
tions
abo
ve
dete
ctio
n lim
its
––
–61
.910
010
010
010
010
010
010
010
010
0
Mea
n fo
r al
l fish
(bot
h sp
ecie
s)
colle
cted
from
site
s–
––
9.05
1.09
5.69
0.07
53,7
702.
329
1.88
697
.07
0.42
321,
603

Results and Discussion 11Ta
ble
3.
Conc
entra
tions
of s
elec
ted
met
als
and
sulfu
r in
who
le-b
ody
sam
ples
of l
arge
mou
th b
ass
(Mic
ropt
erus
sal
moi
des)
and
spo
tted
bass
(Mic
ropt
erus
pun
ctul
atus
) co
llect
ed fr
om W
hisk
eyto
wn
Lake
, Cal
iforn
ia, J
une
2005
. —Co
ntin
ued
[Con
cent
ratio
ns a
re in
mic
rogr
ams p
er g
ram
(μg/
g), d
ry w
eigh
t exc
ept w
here
oth
erw
ise
note
d. G
eom
etric
mea
ns a
re re
porte
d fo
r ele
men
t con
cent
ratio
ns; a
rithm
etic
mea
ns a
re re
porte
d fo
r len
gth,
moi
stur
e, a
nd
mas
s. A
bbre
viat
ions
: g, g
ram
; LK
BB
, Bra
ndy/
Bou
lder
Cre
ek a
rea;
LK
CC
, Cle
ar C
reek
are
a; L
KW
C, W
hisk
ey C
reek
are
a; m
m, m
illim
eter
; NC
, mea
n w
as n
ot c
alcu
late
d if
the
elem
ent w
as d
etec
ted
in fe
wer
th
an <
50 p
erce
nt o
f the
sam
ples
; –, n
ot a
pplic
able
; ^, d
iffer
ence
s in
labo
rato
ry d
ecte
ctio
n lim
it ar
e es
tabl
ishe
d by
labo
rato
ry c
alib
ratio
n cu
rves
for e
ach
batc
h of
che
mic
al a
naly
ses,
ther
efor
e, th
ey a
re n
ot th
e sa
me
for e
very
run;
<, b
elow
the
limit
of d
etec
tion;
%, p
erce
nt]
Spec
ies
Who
le b
ody
code
(s
ite-d
ate-
sam
ple)
Tota
l le
ngth
(m
m)
Moi
stur
e (%
)
Sam
ple
mas
s (g
)M
anga
nese
N
icke
l^Ph
osph
orus
Pota
ssiu
mSo
dium
Sulfu
r Se
leni
umSt
ront
ium
Tita
nium
Zinc
Largemouth Bass (LMBA)
LKB
B-0
6070
5-00
1W36
076
.764
4.1
35.3
4.91
32,7
0011
,900
4,77
08,
360
2.42
125
5.43
81.7
LKB
B-0
6070
5-00
2W38
277
.668
419
.610
.538
,500
11,7
005,
140
7,85
02.
1113
03.
9161
.7LK
BB
-060
705-
003W
403
73.3
878.
633
.817
232
,900
10,5
004,
140
8,12
01.
9698
.11.
2660
.8LK
BB
-060
705-
006W
345
76.8
474.
315
.514
.335
,400
11,7
005,
120
8,40
02.
3513
31.
1464
.2LK
BB
-060
705-
007W
325
76.6
405.
45.
462.
7132
,200
11,9
004,
350
9,05
02.
3111
61.
3466
.1LK
BB
-060
705-
008W
330
75.4
432.
15.
842.
5730
,400
11,2
004,
160
8,99
02.
1687
0.93
67.2
LKB
B-0
6070
5-00
9W31
577
.127
9.6
6.55
2.18
27,9
0012
,600
4,02
09,
820
2.59
75.9
0.78
70.1
LKB
B-0
6070
5-01
1W31
877
.439
0.2
3.05
1.62
27,2
0012
,400
4,39
08,
760
2.41
94.2
0.86
60.9
LKB
B-0
6070
5-02
2W21
076
.410
9.8
10.3
<0.4
6937
,400
10,9
003,
870
7,86
02.
3610
51.
3476
.4LK
BB
-060
705-
023W
180
76.8
6215
.71.
3434
,600
11,1
004,
000
8,42
02.
5810
51.
0692
.8LK
BB
-060
705-
025W
176
76.6
48.2
8.4
1.25
44,7
0010
,100
5,12
08,
090
2.28
146
2.41
121
Mea
n fo
r al
l LM
BA
col
lect
ed
304
76.4
400
11.1
3.57
733
,670
11,4
304,
438
8,50
22.
314
108.
51.
501
73.1
3
Spotted bass (SPBA)
LKB
B-0
6070
5-00
5W38
573
.170
8.6
10.9
30.4
31,6
0010
,700
4,04
08,
040
1.92
92.7
0.93
59.9
LKB
B-0
6070
5-01
2W32
776
.333
4.1
2.03
0.89
31,9
0012
,300
4,24
08,
760
2.44
981.
1582
.4LK
BB
-060
705-
013W
293
75.5
261.
23.
010.
831
,900
13,5
004,
130
8,95
02.
111
01.
2871
LKB
B-0
6070
5-01
4W31
176
.533
7.7
2.08
<0.4
6128
,600
13,0
003,
640
8,50
02.
2485
.30.
9262
.8LK
BB
-060
705-
017W
249
75.6
152.
28.
090.
9625
,400
12,1
003,
200
7,73
01.
9572
.63.
6256
.5LK
BB
-060
705-
018W
238
74.3
148.
43.
940.
5531
,100
11,5
003,
860
7,75
02.
0898
.91.
0891
.5LK
BB
-060
705-
019W
235
75.9
98.3
2.69
<0.4
7735
,800
11,1
003,
150
8,15
02.
3412
61.
392
.3LK
BB
-060
705-
020W
212
73.8
82.6
3.68
0.69
32,6
0010
,500
3,67
07,
330
1.85
108
0.94
97.1
LKB
B-0
6070
5-02
6W17
377
.144
.84.
341.
1737
,800
11,2
004,
310
9,09
02.
4611
41.
1711
6LK
BB
-060
705-
027W
145
7726
.913
.30.
7437
,300
11,9
004,
110
9,11
02.
7411
11.
6711
3M
ean
for
all S
PBA
col
lect
ed
257
75.5
219
4.36
70.
9065
32,1
9011
,740
3,81
48,
319
2.19
610
0.5
1.28
81.7
7M
ean
for
all fi
sh (b
oth
spec
ies)
fr
om L
KB
B–
––
7.11
71.
8632
,960
11,5
804,
129
8,41
42.
257
104.
61.
391
77.1
3
Perc
enta
ge o
f fish
from
LK
BB
w
ith c
once
ntra
tions
abo
ve
dete
ctio
n lim
its
––
–10
085
.710
010
010
010
010
010
010
010
0
12 Concentrations of mercury and other metals in black bass, Whiskeytown Lake, Shasta County, California, 2005Ta
ble
3.
Conc
entra
tions
of s
elec
ted
met
als
and
sulfu
r in
who
le-b
ody
sam
ples
of l
arge
mou
th b
ass
(Mic
ropt
erus
sal
moi
des)
and
spo
tted
bass
(Mic
ropt
erus
pun
ctul
atus
) co
llect
ed fr
om W
hisk
eyto
wn
Lake
, Cal
iforn
ia, J
une
2005
. —Co
ntin
ued
[Con
cent
ratio
ns a
re in
mic
rogr
ams p
er g
ram
(μg/
g), d
ry w
eigh
t exc
ept w
here
oth
erw
ise
note
d. G
eom
etric
mea
ns a
re re
porte
d fo
r ele
men
t con
cent
ratio
ns; a
rithm
etic
mea
ns a
re re
porte
d fo
r len
gth,
moi
stur
e, a
nd
mas
s. A
bbre
viat
ions
: g, g
ram
; LK
BB
, Bra
ndy/
Bou
lder
Cre
ek a
rea;
LK
CC
, Cle
ar C
reek
are
a; L
KW
C, W
hisk
ey C
reek
are
a; m
m, m
illim
eter
; NC
, mea
n w
as n
ot c
alcu
late
d if
the
elem
ent w
as d
etec
ted
in fe
wer
th
an <
50 p
erce
nt o
f the
sam
ples
; –, n
ot a
pplic
able
; ^, d
iffer
ence
s in
labo
rato
ry d
ecte
ctio
n lim
it ar
e es
tabl
ishe
d by
labo
rato
ry c
alib
ratio
n cu
rves
for e
ach
batc
h of
che
mic
al a
naly
ses,
ther
efor
e, th
ey a
re n
ot th
e sa
me
for e
very
run;
<, b
elow
the
limit
of d
etec
tion;
%, p
erce
nt]
Spec
ies
Who
le b
ody
code
(s
ite-d
ate-
sam
ple)
Tota
l le
ngth
(m
m)
Moi
stur
e (%
)
Sam
ple
mas
s (g
)M
anga
nese
N
icke
l^Ph
osph
orus
Pota
ssiu
mSo
dium
Sulfu
r Se
leni
umSt
ront
ium
Tita
nium
Zinc
Largemouth Bass (LMBA)
LKC
C-0
6080
5-00
1W44
374
.71,
056.
104.
911.
8531
,600
11,1
004,
000
8,20
02.
2489
.60.
961
.9LK
CC
-060
805-
002W
385
74.9
660.
17.
340.
936
,400
10,3
004,
340
7,88
01.
813
61.
2165
.3LK
CC
-060
805-
003W
370
75.7
699.
510
.60.
8733
,200
11,6
004,
430
8,09
02.
0411
63.
1971
.1LK
CC
-060
805-
004W
370
75.5
653.
27.
531.
5633
,600
11,5
004,
400
7,99
02.
0696
.43.
1458
.7LK
CC
-060
805-
005W
335
76.3
500.
67.
051.
6229
,200
10,6
004,
500
7,99
02.
2190
.71.
4870
.8LK
CC
-060
805-
006W
345
7648
7.8
7.87
1.42
32,5
0012
,600
4,41
08,
670
2.04
123
1.52
73.2
LKC
C-0
6080
5-00
8W28
377
.127
3.5
12.5
0.64
32,6
0012
,400
4,19
08,
250
2.21
108
1.55
74.3
LKC
C-0
6080
5-01
1W27
378
.326
7.1
251.
6625
,200
12,7
003,
490
8,44
02.
3161
.110
.666
LKC
C-0
6080
5-01
2W22
375
.212
5.8
7.8
<0.4
6532
,700
10,3
003,
500
8,44
02.
0587
.71.
4572
.9LK
CC
-060
805-
013W
248
75.9
174.
94.
08<0
.483
29,9
0011
,400
3,52
09,
090
2.02
66.4
1.3
67.9
LKC
C-0
6080
5-01
4W26
079
.121
3.3
3.22
0.59
20,5
0013
,600
3,21
09,
990
2.24
48.7
1.49
53.8
LKC
C-0
6080
5-01
5W20
076
.996
.114
.6<0
.468
33,1
0011
,500
4,01
08,
780
2.13
82.5
1.27
79.7
LKC
C-0
6080
5-01
6W19
576
.468
.75.
04<0
.479
33,3
0012
,000
3,67
09,
250
2.4
80.3
1.04
84.1
LKC
C-0
6090
5-02
1W35
076
.152
1.6
130.
7834
,600
11,6
004,
530
8,15
02.
2611
70.
9772
.1LK
CC
-060
905-
022W
300
77.6
329.
55.
290.
6924
,300
12,3
004,
190
8,99
02.
3481
.31.
1163
.3LK
CC
-060
905-
023W
275
74.5
292.
79.
480.
8827
,600
10,6
003,
760
8,27
02.
1186
.70.
9666
.5LK
CC
-060
905-
025W
202
74.3
84.3
13.4
<0.4
8833
,000
11,0
003,
850
8,54
02.
0989
.71.
6684
Mea
n fo
r al
l LM
BA
col
lect
ed
297.
576
.15
382.
648.
180.
672
30,4
8011
,560
3,97
98,
514
2.14
589
.06
1.58
769
.28
Spot-ted bass (SPBA)
LKC
C-0
6080
5-01
0W28
876
.524
7.3
2.71
0.61
28,2
0011
,800
3,51
08,
480
2.13
92.5
1.09
72.7
LKC
C-0
6080
5-01
7W17
476
.841
.93.
09<0
.481
30,9
0012
,000
3,75
08,
550
2.7
82.9
1.01
115
LKC
C-0
6090
5-02
6W27
572
.723
0.3
4.13
0.52
28,5
0010
,000
3,34
07,
490
2.03
82.4
6.29
56.4
LKC
C-0
6090
5-02
7W29
073
.925
0.8
3.07
<0.4
6727
,200
10,8
003,
320
7,52
01.
8992
.216
.271
.5M
ean
for
all S
PBA
col
lect
ed25
6.8
74.9
819
2.57
3.21
0.36
4328
,670
11,1
203,
476
7,99
42.
167
87.3
73.
254
76.2
Mea
n fo
r al
l fish
(bot
h sp
ecie
s)
colle
cted
from
LK
CC
––
–6.
845
0.59
8130
,130
11,4
803,
878
8,41
22.
149
88.7
31.
8270
.55
Perc
enta
ge o
f fish
from
LK
CC
w
ith c
once
ntra
tions
abo
ve
dete
ctio
n lim
its
––
–10
066
.710
010
010
010
010
010
010
010
0
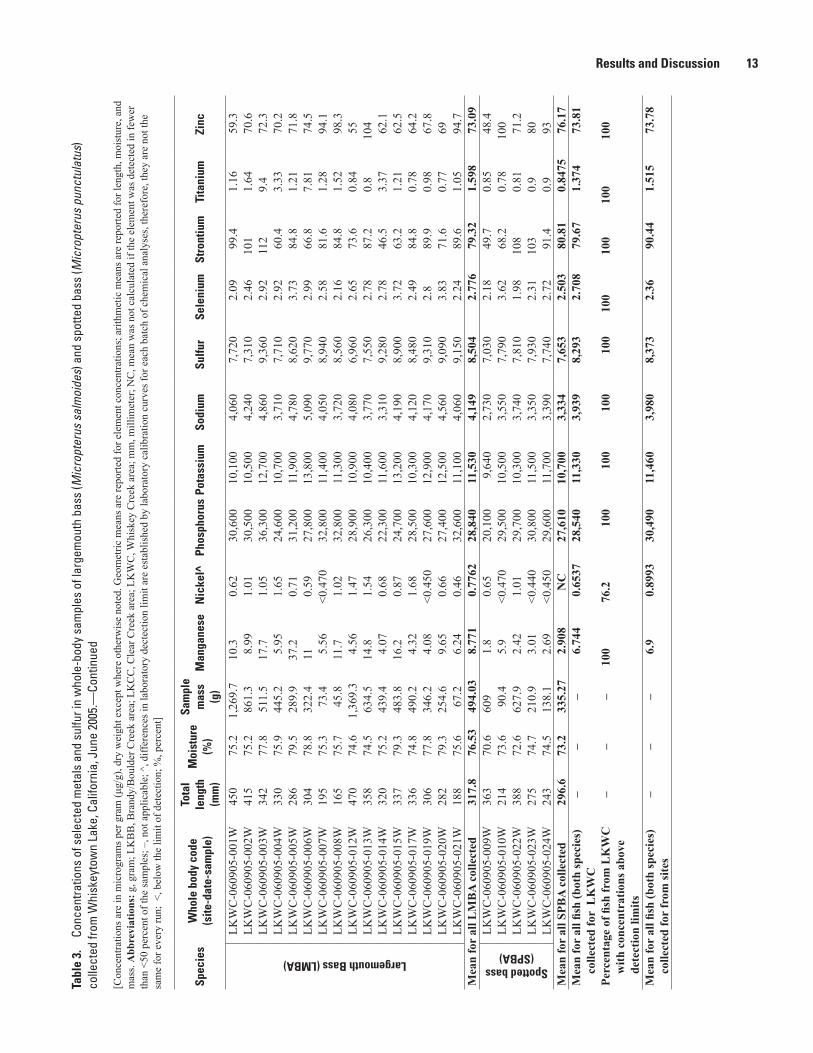
Results and Discussion 13Ta
ble
3.
Conc
entra
tions
of s
elec
ted
met
als
and
sulfu
r in
who
le-b
ody
sam
ples
of l
arge
mou
th b
ass
(Mic
ropt
erus
sal
moi
des)
and
spo
tted
bass
(Mic
ropt
erus
pun
ctul
atus
) co
llect
ed fr
om W
hisk
eyto
wn
Lake
, Cal
iforn
ia, J
une
2005
. —Co
ntin
ued
[Con
cent
ratio
ns a
re in
mic
rogr
ams p
er g
ram
(μg/
g), d
ry w
eigh
t exc
ept w
here
oth
erw
ise
note
d. G
eom
etric
mea
ns a
re re
porte
d fo
r ele
men
t con
cent
ratio
ns; a
rithm
etic
mea
ns a
re re
porte
d fo
r len
gth,
moi
stur
e, a
nd
mas
s. A
bbre
viat
ions
: g, g
ram
; LK
BB
, Bra
ndy/
Bou
lder
Cre
ek a
rea;
LK
CC
, Cle
ar C
reek
are
a; L
KW
C, W
hisk
ey C
reek
are
a; m
m, m
illim
eter
; NC
, mea
n w
as n
ot c
alcu
late
d if
the
elem
ent w
as d
etec
ted
in fe
wer
th
an <
50 p
erce
nt o
f the
sam
ples
; –, n
ot a
pplic
able
; ^, d
iffer
ence
s in
labo
rato
ry d
ecte
ctio
n lim
it ar
e es
tabl
ishe
d by
labo
rato
ry c
alib
ratio
n cu
rves
for e
ach
batc
h of
che
mic
al a
naly
ses,
ther
efor
e, th
ey a
re n
ot th
e sa
me
for e
very
run;
<, b
elow
the
limit
of d
etec
tion;
%, p
erce
nt]
Spec
ies
Who
le b
ody
code
(s
ite-d
ate-
sam
ple)
Tota
l le
ngth
(m
m)
Moi
stur
e (%
)
Sam
ple
mas
s (g
)M
anga
nese
N
icke
l^Ph
osph
orus
Pota
ssiu
mSo
dium
Sulfu
r Se
leni
umSt
ront
ium
Tita
nium
Zinc
Largemouth Bass (LMBA)
LKW
C-0
6090
5-00
1W45
075
.21,
269.
710
.30.
6230
,600
10,1
004,
060
7,72
02.
0999
.41.
1659
.3LK
WC
-060
905-
002W
415
75.2
861.
38.
991.
0130
,500
10,5
004,
240
7,31
02.
4610
11.
6470
.6LK
WC
-060
905-
003W
342
77.8
511.
517
.71.
0536
,300
12,7
004,
860
9,36
02.
9211
29.
472
.3LK
WC
-060
905-
004W
330
75.9
445.
25.
951.
6524
,600
10,7
003,
710
7,71
02.
9260
.43.
3370
.2LK
WC
-060
905-
005W
286
79.5
289.
937
.20.
7131
,200
11,9
004,
780
8,62
03.
7384
.81.
2171
.8LK
WC
-060
905-
006W
304
78.8
322.
411
0.59
27,8
0013
,800
5,09
09,
770
2.99
66.8
7.81
74.5
LKW
C-0
6090
5-00
7W19
575
.373
.45.
56<0
.470
32,8
0011
,400
4,05
08,
940
2.58
81.6
1.28
94.1
LKW
C-0
6090
5-00
8W16
575
.745
.811
.71.
0232
,800
11,3
003,
720
8,56
02.
1684
.81.
5298
.3LK
WC
-060
905-
012W
470
74.6
1,36
9.3
4.56
1.47
28,9
0010
,900
4,08
06,
960
2.65
73.6
0.84
55LK
WC
-060
905-
013W
358
74.5
634.
514
.81.
5426
,300
10,4
003,
770
7,55
02.
7887
.20.
810
4LK
WC
-060
905-
014W
320
75.2
439.
44.
070.
6822
,300
11,6
003,
310
9,28
02.
7846
.53.
3762
.1LK
WC
-060
905-
015W
337
79.3
483.
816
.20.
8724
,700
13,2
004,
190
8,90
03.
7263
.21.
2162
.5LK
WC
-060
905-
017W
336
74.8
490.
24.
321.
6828
,500
10,3
004,
120
8,48
02.
4984
.80.
7864
.2LK
WC
-060
905-
019W
306
77.8
346.
24.
08<0
.450
27,6
0012
,900
4,17
09,
310
2.8
89.9
0.98
67.8
LKW
C-0
6090
5-02
0W28
279
.325
4.6
9.65
0.66
27,4
0012
,500
4,56
09,
090
3.83
71.6
0.77
69LK
WC
-060
905-
021W
188
75.6
67.2
6.24
0.46
32,6
0011
,100
4,06
09,
150
2.24
89.6
1.05
94.7
Mea
n fo
r al
l LM
BA
col
lect
ed
317.
876
.53
494.
038.
771
0.77
6228
,840
11,5
304,
149
8,50
42.
776
79.3
21.
598
73.0
9
Spotted bass (SPBA)
LKW
C-0
6090
5-00
9W36
370
.660
91.
80.
6520
,100
9,64
02,
730
7,03
02.
1849
.70.
8548
.4LK
WC
-060
905-
010W
214
73.6
90.4
5.9
<0.4
7029
,500
10,5
003,
550
7,79
03.
6268
.20.
7810
0LK
WC
-060
905-
022W
388
72.6
627.
92.
421.
0129
,700
10,3
003,
740
7,81
01.
9810
80.
8171
.2LK
WC
-060
905-
023W
275
74.7
210.
93.
01<0
.440
30,8
0011
,500
3,35
07,
930
2.31
103
0.9
80LK
WC
-060
905-
024W
243
74.5
138.
12.
69<0
.450
29,6
0011
,700
3,39
07,
740
2.72
91.4
0.9
93M
ean
for
all S
PBA
col
lect
ed
296.
673
.233
5.27
2.90
8N
C27
,610
10,7
003,
334
7,65
32.
503
80.8
10.
8475
76.1
7M
ean
for
all fi
sh (b
oth
spec
ies)
co
llect
ed fo
r L
KW
C–
––
6.74
40.
6537
28,5
4011
,330
3,93
98,
293
2.70
879
.67
1.37
473
.81
Perc
enta
ge o
f fish
from
LK
WC
w
ith c
once
ntra
tions
abo
ve
dete
ctio
n lim
its
––
–10
076
.210
010
010
010
010
010
010
010
0
Mea
n fo
r al
l fish
(bot
h sp
ecie
s)
colle
cted
for
from
site
s–
––
6.9
0.89
9330
,490
11,4
603,
980
8,37
32.
3690
.44
1.51
573
.78

14 Concentrations of mercury and other metals in black bass, Whiskeytown Lake, Shasta County, California, 2005
Whiskey Creek Arm
Brandy/Boulder Creek Area
TOTA
L M
ERCU
RY IN
FIL
LET,
IN M
ICRO
GRAM
S PE
R GR
AM O
F W
ET W
EIGH
T
100 200 300 400 500
TOTAL LENGTH, IN MILLIMETERS
EXPLANATION
0.0
0.1
0.2
0.3
0.4
0.5
0.6
Largemouth bass (LMBA) Spotted bass (SPBA)
Clear Creek Arm
Whiskey Creek Arm
Brandy/Boulder Creek Area
Clear Creek Arm
Figure 2. Mercury concentration for all bass (Micropterus spp.) samples collected from Whiskeytown Lake, California, 2005 in relation to total length.
from Whiskeytown Lake are not as elevated as values from fish in the adjacent Trinity Lake and watershed (May and others 2005), it is evident that more samples are needed to thoroughly evaluate the potential risk these fish may pose to human and wildlife consumers.
The data presented in this report represent a baseline for future monitoring efforts. Black bass in Whiskeytown Lake have elevated concentrations of total mercury and show a bioaccumulation effect of increasing mercury with increasing size. While mercury values from fish collected

References 15
y = 0.5894x + 0.0135
R2 = 0.937
0.1
0.0
0.2
0.3
0.4
0.5
0.6
TOTA
L M
ERCU
RY IN
WHO
LE B
ODY,
IN M
ICRO
GRAM
S PE
R GR
AM O
F W
ET W
EIGH
T
TOTAL MERCURY IN FILLET, IN MICROGRAMS PER GRAM OF WET WEIGHT
0.0 0.1 0.2 0.3 0.4 0.5 0.6
Figure 3. Correlation plot of mercury concentration in fillet samples in relation to whole-body samples for for all bass (Micropterus spp.) samples collected from Whiskeytown Lake, California, 2005.
AcknowledgementsFunding for this study was provided by the USGS–NPS
Water Quality Cooperative Program, and the U.S. Department of Interior Burned Area Rehabilitation Program. We thank Jennifer Gibson, Russ Weatherbee, and Brian Rasmussen of the Whiskeytown National Recreation Area, who helped with procuring funding for these analyses and assisted with logis-tics associated with the collection. Skylar Feltman of USGS Biological Resources Discipline helped with processing fish samples.
References
Alpers, C.N., Hunerlach, M.P., May, J.T., and Hothem, R.L., 2005, Mercury contamination from historic gold mining in California: U.S. Geological Survey Fact Sheet 2005–3014, 2nd ed., 6 p. Available at http://pubs.usgs.gov/fs/2005/3014/fs2005_3014_v1.1.pdf
California Department of Conservation, 2000, California’s Abandoned mine lands: Chapter 3.3 Clear Creek Watershed, p. 41–47,Volume II: A report on the magnitude and Scope of the issue in the State: California Department of Conserva-tion, Abandoned Mines Unit, Sacramento, California, 137 p.
May, J.T., Hothem, R.L., Alpers, C.N., and Law, M.A., 2000, Mercury bioaccumulation in fish in a region affected by his-toric gold mining: The South Yuba River, Deer Creek, and Bear River Watersheds, California, 1999: U.S. Geological Survey, Open-File Report 00-367, 35 p. Available at http://pubs.usgs.gov/of/2000/0367/report.pdf
May, J.T., Hothem, R.L, and Alpers, C.N., 2005, Mercury Concentrations in fishes from select water bodies in Trinity County, California, 2000–2002: U.S. Geological Survey Open-File Report 2005–1321, 14 p. Available at http://pubs.usgs.gov/of/2005/1321/USGS_2005-1321.pdf
Moore, J.N., and Hughes, D., 2003, Trace metals in sediments of a mine impacted river basin: Clear Creek, California Project, Final Report: Department of Geology, University of Montana, Missoula, masters thesis, December 30, 2003, 136 p.

16 Concentrations of mercury and other metals in black bass, Whiskeytown Lake, Shasta County, California, 2005
National Park Service, 1999, General Management Plan and Environmental Impact Statement Whiskeytown Unit Shasta County, California, 117 p., accessed June, 2008 at http://www.nps.gov/whis/parkmgmt/upload/GMPfinal.pdf
U.S. Environmental Protection Agency, 1991, Methods for the determination of metals in environmental samples: U.S. Environmental Protection Agency, Office of Research and Development, Environmental Monitoring Systems Labora-tory, EPA- PA/600 4-91-010, 293 p.
U.S. Environmental Protection Agency, 1995, Guidance for assessing chemical contaminant data for use in fish advi-sories, Volume 1, Fish sampling and analysis (2nd ed.): U.S. Environmental Protection Agency, Office of Water, EPA823-R-95-007, variously paged.
U.S. Environmental Protection Agency, 2001, Water quality criterion for protection of human health—Methylmercury: U.S. Environmental Protection Agency, Office of Water, EPA-823-R-01-001, 269 p.
U.S. Environmental Protection Agency, 2003, Draft update IVA of SW-846, 7000 series, Method 7473, Mercury in sol-ids and solutions by thermal decomposition, amalgamation, and atomic absorption spectrophotometry: U.S. Environ-mental Protection Agency, Office of Water, accessed July, 2005 at http://www.epa.gov/epaoswer/hazwaste/test/up4a.htm#7_series

May and others—
Concentrations of Mercury and other M
etals in Black B
ass (Micropterus spp.) from
Whiskeytow
n Lake, Shasta County, California, 2005—Open File Report 2011–1297
Printed on recycled paper
![[XLS]peppol.eupeppol.eu/wp-content/uploads/2018/01/PEPPOL-BIS... · Web view2 14 16. 78 44 122. 40 40. 80 58 40 178. BR-1 An Invoice shall have a Specification identification. BR-2](https://static.fdocuments.in/doc/165x107/5ae624c67f8b9acc268d00f4/xls-view2-14-16-78-44-122-40-40-80-58-40-178-br-1-an-invoice-shall-have-a.jpg)