Computer-Aided Diagnosis System for Retinal Diseases … · Computer-Aided Diagnosis System for...
13
Computer-Aided Diagnosis System for Retinal Diseases in Medical Imaging MARIUS CRISTIAN LUCULESCU, SIMONA LACHE Precision Mechanics and Mechatronics Department Transilvania University of Bra$ov Bd. Eroilor 29, 500036 Bra$ov ROMANIA [email protected] , [email protected] http://www.unitbv.ro Abstract — Bordering on important domains – engineering, medicine and informatics, involving not only knowledge regarding the biosystems structure and functionality, but also knowledge and skills from technical and IT systems, the paper presents the results of some researches on biological human visual structures concerning the diagnosis of visual diseases, namely the macular ones. This highly important transdisciplinary topic combines aspects from biosystems (human visual system), image acquisition and processing (medical imaging), artificial intelligence techniques (neural networks) and information management (databases). Starting from classical or digital retina images, using neural networks image recognition algorithms, the Computer-Aided Diagnosis (CADx) system identifies macular diseases with high precision. Images are stored in databases together with patient personal details and treatments and diagnosis information. The software includes image processing modules, databases and artificial neural networks that can be trained for recognizing images of new diseases or for improving sensitivity and specificity of the system. The Computer-Aided Diagnosis reduces the doctor’s level of incertitude regarding some diseases, improves the initial and evolutional identification precision of disease, allows monitoring the health status of the patient during new treatment methods, stores images in digital format and generates diagnoses databases that can be explored in research, medical practice and specialized teaching. Using such a system increases the quality and accessibility of medical services. Key-Words: — computer-aided diagnosis, neural networks, image processing, ophthalmology, macula, retina 1 Introduction During last years, the diagnosis of human visual system diseases had an amazing progress, especially due to technological innovations and exponential development in the IT domain. Taking into account the diversity and complexity of the eye functions, a huge number of equipments, devices, methods and algorithms for diagnosis were developed. Sometimes the doctor can identify certain diseases after a visual analysis of an image representing the affected area. However, in a large number of cases, the diagnosis is not successful, due to different factors as, for example, reduced experience, fatigue, diversity of shapes and texture, similarity, poor image quality and so on. In these situations, a second opinion, coming from another expert or better from a computer-aided diagnosis system, is very important and useful. From the multitude of the human visual system diseases, those that affect the inside back nervous layer of the eye, namely retina, can be identified by image recognition in a so-called retinal diseases medical imaging process. From the retinal diseases, the macular ones are of the worst. Macula is a biological structure from the human visual system, responsible for high acuity vision, color vision and central vision. Consisting from a small sensitive area in the central part of retina, macula allows focusing central vision in the eye and controls people ability to read, drive a car, recognize faces or colors and see objects in fine detail [1]. There are different eye conditions in which macula can be damaged, often causing loss of central vision (Fig.1). Macular diseases, especially AMD (Age-Related Macular Degeneration) are an increasing problem worldwide, because they are irreversible, so it is very important that the process to be early identified and stopped. Macular degeneration is caused by the deterioration of the central portion of the retina, the inside back layer of the eye that records the images we see and sends them via the optic nerve from the eye to the brain. WSEAS TRANSACTIONS on SYSTEMS Marius Cristian Luculescu and Simona Lache ISSN: 1109-2777 264 Issue 3, Volume 7, March 2008
Transcript of Computer-Aided Diagnosis System for Retinal Diseases … · Computer-Aided Diagnosis System for...
Computer-Aided Diagnosis System for Retinal Diseases in Medical Imaging
MARIUS CRISTIAN LUCULESCU, SIMONA LACHE
Precision Mechanics and Mechatronics Department Transilvania University of Braşov
Bd. Eroilor 29, 500036 BraşovROMANIA
[email protected] , [email protected] http://www.unitbv.ro
Abstract — Bordering on important domains – engineering, medicine and informatics, involving not only knowledge regarding the biosystems structure and functionality, but also knowledge and skills from technical and IT systems, the paper presents the results of some researches on biological human visual structures concerning the diagnosis of visual diseases, namely the macular ones. This highly important transdisciplinary topic combines aspects from biosystems (human visual system), image acquisition and processing (medical imaging), artificial intelligence techniques (neural networks) and information management (databases). Starting from classical or digital retina images, using neural networks image recognition algorithms, the Computer-Aided Diagnosis (CADx) system identifies macular diseases with high precision. Images are stored in databases together with patient personal details and treatments and diagnosis information. The software includes image processing modules, databases and artificial neural networks that can be trained for recognizing images of new diseases or for improving sensitivity and specificity of the system. The Computer-Aided Diagnosis reduces the doctor’s level of incertitude regarding some diseases, improves the initial and evolutional identification precision of disease, allows monitoring the health status of the patient during new treatment methods, stores images in digital format and generates diagnoses databases that can be explored in research, medical practice and specialized teaching. Using such a system increases the quality and accessibility of medical services. Key-Words: — computer-aided diagnosis, neural networks, image processing, ophthalmology, macula, retina
1 Introduction During last years, the diagnosis of human visual
system diseases had an amazing progress, especially due to technological innovations and exponential development in the IT domain. Taking into account the diversity and complexity of the eye functions, a huge number of equipments, devices, methods and algorithms for diagnosis were developed. Sometimes the doctor can identify certain diseases after a visual analysis of an image representing the affected area. However, in a large number of cases, the diagnosis is not successful, due to different factors as, for example, reduced experience, fatigue, diversity of shapes and texture, similarity, poor image quality and so on. In these situations, a second opinion, coming from another expert or better from a computer-aided diagnosis system, is very important and useful.
From the multitude of the human visual system diseases, those that affect the inside back nervous layer of the eye, namely retina, can be identified by
image recognition in a so-called retinal diseases medical imaging process. From the retinal diseases, the macular ones are of the worst.
Macula is a biological structure from the human visual system, responsible for high acuity vision, color vision and central vision. Consisting from a small sensitive area in the central part of retina, macula allows focusing central vision in the eye and controls people ability to read, drive a car, recognize faces or colors and see objects in fine detail [1].
There are different eye conditions in which macula can be damaged, often causing loss of central vision (Fig.1). Macular diseases, especially AMD (Age-Related Macular Degeneration) are an increasing problem worldwide, because they are irreversible, so it is very important that the process to be early identified and stopped. Macular degeneration is caused by the deterioration of the central portion of the retina, the inside back layer of the eye that records the images we see and sends them via the optic nerve from the eye to the brain.
WSEAS TRANSACTIONS on SYSTEMS
Marius Cristian Luculescu and Simona Lache
ISSN: 1109-2777264
Issue 3, Volume 7, March 2008
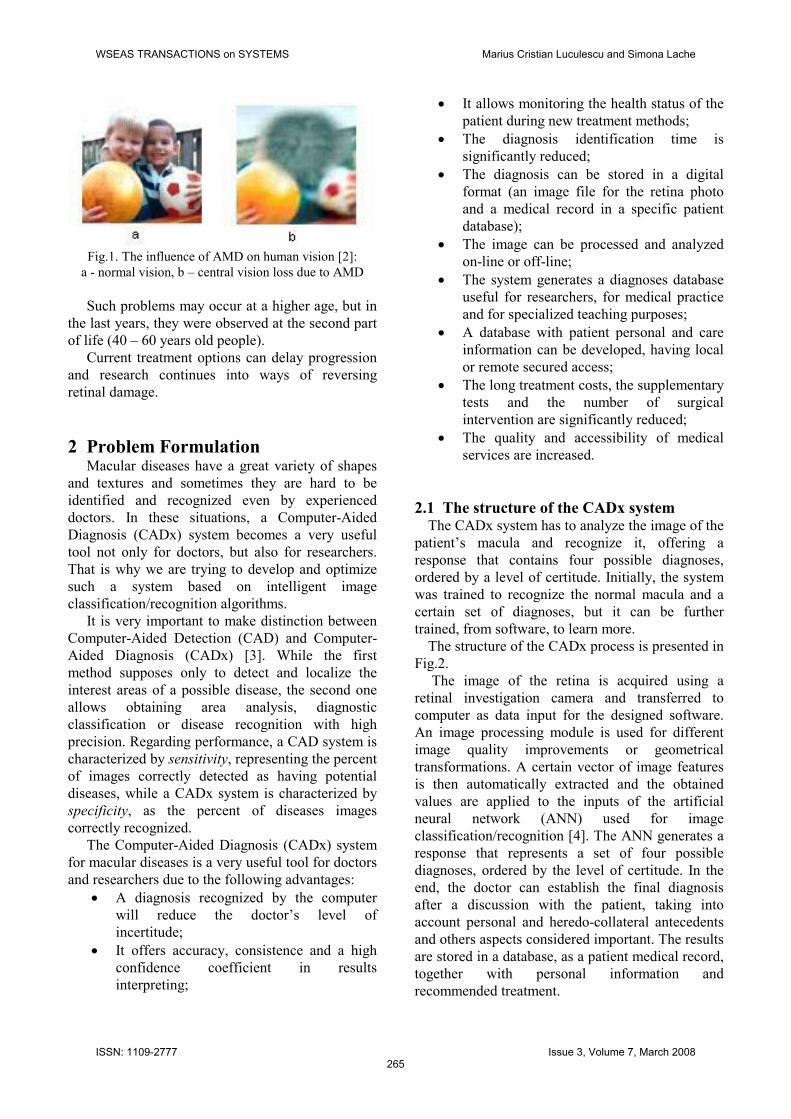
Fig.1. The influence of AMD on human vision [2]: a - normal vision, b – central vision loss due to AMD
Such problems may occur at a higher age, but in
the last years, they were observed at the second part of life (40 – 60 years old people).
Current treatment options can delay progression and research continues into ways of reversing retinal damage.
2 Problem Formulation Macular diseases have a great variety of shapes
and textures and sometimes they are hard to be identified and recognized even by experienced doctors. In these situations, a Computer-Aided Diagnosis (CADx) system becomes a very useful tool not only for doctors, but also for researchers. That is why we are trying to develop and optimize such a system based on intelligent image classification/recognition algorithms.
It is very important to make distinction between Computer-Aided Detection (CAD) and Computer-Aided Diagnosis (CADx) [3]. While the first method supposes only to detect and localize the interest areas of a possible disease, the second one allows obtaining area analysis, diagnostic classification or disease recognition with high precision. Regarding performance, a CAD system is characterized by sensitivity, representing the percent of images correctly detected as having potential diseases, while a CADx system is characterized by specificity, as the percent of diseases images correctly recognized.
The Computer-Aided Diagnosis (CADx) system for macular diseases is a very useful tool for doctors and researchers due to the following advantages:
• A diagnosis recognized by the computer will reduce the doctor’s level of incertitude;
• It offers accuracy, consistence and a high confidence coefficient in results interpreting;
• It allows monitoring the health status of the patient during new treatment methods;
• The diagnosis identification time is significantly reduced;
• The diagnosis can be stored in a digital format (an image file for the retina photo and a medical record in a specific patient database);
• The image can be processed and analyzed on-line or off-line;
• The system generates a diagnoses database useful for researchers, for medical practice and for specialized teaching purposes;
• A database with patient personal and care information can be developed, having local or remote secured access;
• The long treatment costs, the supplementary tests and the number of surgical intervention are significantly reduced;
• The quality and accessibility of medical services are increased.
2.1 The structure of the CADx system The CADx system has to analyze the image of the
patient’s macula and recognize it, offering a response that contains four possible diagnoses, ordered by a level of certitude. Initially, the system was trained to recognize the normal macula and a certain set of diagnoses, but it can be further trained, from software, to learn more.
The structure of the CADx process is presented in Fig.2.
The image of the retina is acquired using a retinal investigation camera and transferred to computer as data input for the designed software. An image processing module is used for different image quality improvements or geometrical transformations. A certain vector of image features is then automatically extracted and the obtained values are applied to the inputs of the artificial neural network (ANN) used for image classification/recognition [4]. The ANN generates a response that represents a set of four possible diagnoses, ordered by the level of certitude. In the end, the doctor can establish the final diagnosis after a discussion with the patient, taking into account personal and heredo-collateral antecedents and others aspects considered important. The results are stored in a database, as a patient medical record, together with personal information and recommended treatment.
WSEAS TRANSACTIONS on SYSTEMS Marius Cristian Luculescu and Simona Lache
ISSN: 1109-2777265
Issue 3, Volume 7, March 2008

Fig.2. The structure of the CADx process
2.2 The knowledge stage in the domain At the international level, the analysis of the
present stage showed an extremely important interest, the computer-aided diagnosis based o image recognition being one of the major research topics within the framework of the medical imaging [3], [5]. This interest is motivated by the care shown towards the people’s health state, together with the advantages of CADx mentioned above. A minute analysis of the specialty literature stated the following:
• In the field of medical imaging, there have been carried out numberless research studies concerning the computer-aided diagnosis of breast cancer [6], of the pulmonary nodules from breast X-ray pictures [7] and CAT SCANs [8], [9], of the cerebral aneurysms [10], [11], some areas being better covered, other areas less covered, just like the case of retinal imaging;
• In the field of retinal imaging, there is a series of achievements, but because of the great range of diagnosis diversity, the solved issues have in view only a selective treatment of their identification [12]. There are research studies concerning the glaucoma diagnosis in the eye fundus images [13], iris recognition, white spots identification and intensive bleedings at the
retina level, automated detection of diabetic retinopathy damaging [14], but there are no final results having in view a group of diseases;
• The image processing and analysis in this field has generally in view the use of image segmentation operations (of the optical disc, of the macula, vascular arch, macular drusen deposits, microaneurysms and exudates in diabetic retinopathy) [15], contrast enhancement [16], filter application [17];
• The frequently used images classification/recognition methods and techniques use linear or superior order classifiers [18], decision trees, machine learning [19] and most frequently neural networks [20], [21], [22], [23].
3 Problem Solution In order to solve the computer-aided diagnosis
problem for macular diseases and for optimizing the solution, a software package has been designed. Specific image processing module, database module and neural networks module were developed in Matlab®.
A description of the system components is presented forwards, focusing on the most important aspects from the diagnosis process.
3.1 Image acquisition Retina’s image can be acquired directly from a
retinal investigation camera that offers a digital image or a classical one on color-reversal film. These last types of pictures have to be processed on a photo processing machine and then digitized using a scanner. The system is ready to work with any image of the retina, in digital format. The file format of the image used for recognition, in this software release, has to be a jpg one.
3.2 Image processing Having the images on the computer screen, the
doctor can observe details and process them, in order to emphasize the elements that may identify the diagnosis.
For doing this, a Graphical User Interface (GUI) developed in Matlab by the authors, offers access to an image processing module. It contains options for processing one image at a time (Fig.3) or for
WSEAS TRANSACTIONS on SYSTEMS Marius Cristian Luculescu and Simona Lache
ISSN: 1109-2777266
Issue 3, Volume 7, March 2008

comparing two images, representing for example two stages of a disease of the same patient.
Fig.3. Main window for the image processing module
Comparison can be made from a visual point, as well as from a mathematical point of view – histograms and values of the image features.
Different options are available for user (Fig.3): opening a file, saving it in the same or other format, viewing the original image, the Red (R), Green (G) and Blue (B) components, transforming from RGB to Gray. Histograms for R, G and B components can be computed and plotted for a number of maximum 255 bins. User can zoom, pan and rotate the image. Image details are examined using Image Tools facility (Fig.4). Options as Vertical Zoom, Horizontal Zoom, Unconstrained Zoom, Vertical Pan, Horizontal Pan, Unconstrained Pan and Reset to Original View are available. The image can be horizontal or vertical mirrored.
The contrast can be enhanced using histogram equalization. Doctor can select and crop an interest area of image and save it.
Fig.4. Image Tools option
All of these tools are available for emphasizing some image characteristics so that the diagnostic to be easily recognized.
The possibilities for viewing and editing an image are very useful for user, especially for doctor, but they were very important in the design phase of the Computer-Aided Diagnosis system. They gave the possibility to generate a database with images of diagnoses used for training an artificial neural network in the image recognition process. Another database was used for testing the network.
In the design phase of the system, it was possible, having all these tools, to prepare images so that to see if a rotated image or a mirrored one can be correctly recognized, if it is better to use gray images or RGB images or contrast enhanced images for neural network inputs.
Another important option available in the image processing module is the “Two Images Comparison”.
Two image files can be opened and analyzed together, visual or using normalized histograms or values that represent features. User can zoom and pan images and plotted histograms.
3.3 Image analysis and features extraction Macular diseases images are characterized by a
large diversity of shapes and structures, so it is more helpful to use for image classification/recognition, texture descriptors instead of shape or boundary descriptors. That is why a set of six values that describe a region by quantifying its texture content were used as image features [24]. The six descriptors are based on statistical properties of the intensity histogram, namely on statistical moments and they are: mean – a measure of average intensity, standard deviation – a measure of average contrast, smoothness of the intensity in that region, third moment – a measure of skewness of a histogram, uniformity and entropy.
The system has to recognize images even if they are rotated, mirrored or scaled. Regarding this aspect, a set of seven 2D moment invariants, insensitive to translation, scale, mirroring and rotation were used.
Special user functions were developed in Matlab for automatically computing the values above [25], [26]. The set of seven 2D moment invariants are computed using the equations below.
For a digital image having a f(x,y) intensity distribution, the two dimensional moment of order p+q is defined as [24]
WSEAS TRANSACTIONS on SYSTEMS Marius Cristian Luculescu and Simona Lache
ISSN: 1109-2777267
Issue 3, Volume 7, March 2008

( )∑∑=x y
qppq yxfyxm , , (1)
for p, q = 0, 1, 2,... and x, y are the values of image coordinates.
These moments in general are not invariant to
any distortions and therefore the corresponding central moments are defined as
( ) ( ) ( )∑∑ −−=x y
qppq yxfyyxx ,µ , (2)
where we denoted
00
10
mm
x = and 00
01
mm
y = . (3)
The central moments are known to be invariant
under translation. It can be demonstrated that the first four orders of central moments from equation (2) can be expressed in terms of the ordinary moments defined in equation (1).
0000 m=µ ,
00110 == µµ ,
00
01101111 m
mmm −=µ ,
00
210
2020 mmm −=µ ,
00
201
0202 mmm −=µ , (4)
21011021212 22 ymymxmm +−−=µ ,
20111202121 22 xmxmymm +−−=µ ,
201020303 23 ymymm +−=µ ,
210203030 23 xmxmm +−=µ .
Often it is desirable to normalize the moments with respect to size. This may be accomplished by using the area, µ00.
The normalized central moment of order (p + q) is defined as
γµµ
η00
pqpq = , (5)
for p, q = 0, 1, 2, … and
12
++
=qpγ , (6)
for p + q = 2, 3, … .
From above equations, a set of seven 2Dmoment invariants, insensitive to translation, change, scale, mirroring and rotation can be derived:
02201ηηφ += ,
( ) 211
202202 4ηηηφ +−= ,
( ) ( )203212
12303 33 ηηηηφ −+−= ,( ) ( )20321
212304 ηηηηφ +++= , (7)
( )( )( ) ( )[ ]
( )( )( ) ( )[ ]2
03212
1230
03210321
20321
21230
123012305
3
33
3
ηηηη
ηηηηηηηη
ηηηηφ
+−+⋅
⋅+−+++−+⋅
⋅+−=
,
( ) ( ) ( )[ ]( )( )0321123011
20321
2123002206
4 ηηηηηηηηηηηφ
+++++−+−= ,
( )( )( ) ( )[ ]( )( )( ) ( )[ ]2
03212
1230
03213012
20321
21230
123003217
3
33
3
ηηηη
ηηηηηηηη
ηηηηφ
+−+⋅
⋅+−+++−+⋅
⋅+−=
.
The other six values representing image’s features are also computed with the GUI [26]. An important approach for describing a region is to quantify its texture content. A frequently used method for texture analysis is based on statistical properties of the intensity histogram.
Let us consider zi a discrete random variable that corresponds to the intensity levels of an image and let us denote p(zi) the corresponding normalized histogram, with i = 0, 1, 2, … , L-1 and L – the number of possible intensity values.
One of the principal approaches for describing the shape of a histogram is via its central moments (also called moments about the mean) [24], which are defined as
( )∑−
=
−=1
0)(
L
ii
nin zpmzµ , (8)
where n is the moment order and m is the mean:
( )i
L
ii zpzm ∑
−
=
=1
0. (9)
WSEAS TRANSACTIONS on SYSTEMS Marius Cristian Luculescu and Simona Lache
ISSN: 1109-2777268
Issue 3, Volume 7, March 2008

The mean (m), a measure of average intensity, is the first image feature in a vector of such values. Because the histogram is assumed to be normalized, the sum of its all components is 1.
The second moment is called the variance,
( )∑−
=
−=1
0
22 )(
L
iii zpmzµ . (10)
Standard deviation (σ), a measure of average
contrast, is used also as an image feature,
( ) 22 σµσ == z . (11)
The third image feature is the smoothness (R). It
measures the relative smoothness of the intensity in a region. In practice, the variance is normalized to the range [0, 1] by dividing it by (L-1)2,
( )21/11 σ+−=R . (12) The fourth image feature is the third order
moment (µ3). It measures the skewness of a histogram. If the histogram is symmetric than µ3 = 0, if it is skewed to the right of the mean than µ3 > 0, and if it is skewed to the left of the mean than µ3 < 0. Values of this measure are brought into a range of values comparable to the other five measures by dividing µ3 by (L-1)2,
∑−
=
−=1
0
33 )()(
L
iii zpmzµ . (13)
The fifth image feature is uniformity (U). It is
maximum when all the gray levels are equal (maximally uniform) and decreases from there,
( )∑−
=
=1
0
2L
iizpU . (14)
The last value in our vector of features is
entropy (e), a measure of randomness,
( ) ( )i
L
ii zpzpe 2
1
0log∑
−
=
= . (15)
All of these values are computed in Matlab®
with a user-defined function. In the image processing module of the Graphical User Interface developed for diagnostic recognition, the option “Two Images Comparison” allows computing and
comparing them. The computed values are scaled by the vector [1 1 10000 10000 10000 1], so that to work with appropriate ranges.
Using the GUI, it was made a comparison between images using R, G, B components, gray image and the corresponding multidimensional one [26]. It was observed that differences between 2D moment invariants values are not significant, excepting the multidimensional image. It is normal because the multidimensional image is obtained by concatenating the 3 two dimensional arrays (of RGB image) in a 2D array. The rotated multidimensional image is made by 3 two dimensional images rotated before, not by rotating directly the entire multidimensional image. So it is better to use the RGB image or the gray one when extracting features, instead of multidimensional images.
3.4 Artificial neural network for image recognition
An image is made by pixels. Depending on the image format and knowing that each pixel has associated a certain number of values, the total number of values can be a huge one. It is impossible to associate a neuron for each value in the neural network structure. It is almost impossible to find two identical retina images at the pixel level. That is why for the image recognition with artificial neural networks we have to use at inputs a vector of values extracted from image features.
A total connected multilayer perceptron network was chosen for diagnosis recognition, knowing that it offers good results in such type of applications [27]. Steps as configuring, training, testing and optimizing ANN, were followed in the design phase of CADx system (Fig.5), but they are also available in the final version of the software, in a so called administrator mode, for improving the system performance. All these steps are executed using another GUI designed also in Matlab® [28].
For training the ANN, it is necessary to have a training set consisting in different images of macular diseases (including also multiple different images of the same diagnosis). A special database module was developed, useful not only for storing images, but for storing features of the images [29].
The name and path of the image file, the name, number and associated vector for diagnosis, histograms computed for a certain number of bins, features values for the 2D moment invariants and texture descriptors for each of the R, G, B color
WSEAS TRANSACTIONS on SYSTEMS Marius Cristian Luculescu and Simona Lache
ISSN: 1109-2777269
Issue 3, Volume 7, March 2008

components or for gray type images, are information stored in the fields of the database (Fig.6).
Fig.5. Image recognition process using ANN All these values can be computed for each image
at a time or automatically for the entire database. New records can be appended and the existing ones can be deleted or modified (Fig.7). Images can be browsed one by one. If an image is an area cropped from another one, it is possible to store in the database information about both of them (very useful option because only macular area is examined by the system, while it is important to see the global image of retina to which the part was associated).
The training set is generated from such a database that contains information about macular diseases images [29].
Fig.6. The structure of a record from the diagnoses database used for ANN training
Fig.7. Main window for the diagnoses database
The number of values representing features will determine the number of inputs in the neural network and it can be selected from the main window of the neural network module (Fig.8). Using RGB images and seven 2D moment invariants plus six texture descriptors, the number of inputs was 39 (13 for each color component).
The number of diagnostics from the database will determine the number of outputs. The structure of the network can be modified by selecting one or two hidden layers and choosing the number of neurons in each layer. The transfer function can be selected from a list that contains tansig - hyperbolic tangent sigmoid transfer function, logsig - log sigmoid transfer function and purelin - linear transfer function.
Fig.8. Main window for ANN configuring, training, testing and optimizing
Because the teacher output vector is composed from 0 and 1 values (1 for marking the correct diagnostic), logsig and tansig functions will be
WSEAS TRANSACTIONS on SYSTEMS Marius Cristian Luculescu and Simona Lache
ISSN: 1109-2777270
Issue 3, Volume 7, March 2008

preferred considering the interval in which they are taking values.
The training parameters and the stopping conditions can be also modified. Learning is a supervised one.
After a large number of successful tests, the optimization stage of the recognition process was started. We have to find out what structure of the neural network, training algorithms and parameters offer the best results.
Optimization criteria take into account three elements: maximizing the number of classified images (first priority – main objective), minimizing the training time (second priority) and minimizing the square mean error (third priority).
Restrictions refer to: the ANN type - total connected feedforward multilayer perceptron network; image database (training set) - 25 RGB images, representing 15 diagnostics; ANN architecture - 39–X–15 with 3 layers of neurons, where X is the variable number of neurons in the hidden layer; training process - 15 cycles with 30.000 epochs each, results being stored at each 1000 epochs.
Three optimization parameters were taken into account: the training function, the transfer function and the ANN architecture, namely the number of neurons in the hidden layer.
Twelve training functions were pretested, six of them being finally used for analysis: traingd - Gradient descent backpropagation, traingdm - Gradient descent with momentum backpropagation, traingda - Gradient descent with adaptive learning rate backpropagation, traingdx - Gradient descent with momentum and adaptive learning rate backpropagation, trainrp - Resilient backpropagation and trainscg - Scaled conjugate gradient backpropagation.
Three transfer function were tested: tansig – bipolar sigmoid, logsig – unipolar sigmoid, purelin – linear function.
Regarding network architecture, three different structures were used, with 10, 39, 78 neurons in the hidden layer.
The analysis can be done manually, gradually, choosing a certain network structure, initializing weights, storing initial weights for using the same values for all the training functions, starting the training process for a certain learning algorithm, storing results during and at the end of the training process, going back to train the network with other function and other structure and so on. This type of analysis is not so easy to be done because of long training time and long processing time of the
results. That is why we have developed specific commands for automatically training, storing and processing of the results for each training strategy. Finally, the results are averaged for the number of training cycles.
In Table 1 is presented, for example, the average square mean error for an ANN with a 39-78-15 structure, trained with three different algorithms.
Regarding the training function, best results were obtained for the trainscg - scaled conjugate gradient backpropagation algorithm [30]. Taking into account the restrictions mentioned above, after 10.000 training epochs, all 25 images from the database with 15 diagnostics were classified and square mean error is the smallest (Fig.9, Fig.10 - graphs are automatically generated from the software).
Even the training time for this function was higher than those obtained for the other tested functions, there are some methods to eliminate this disadvantage (cumulative training [29]).
All the tests for the training algorithm counted more than 200 training cycles, each of them having 30.000 to 80.000 epochs.
Table 1. The average square mean error
Epochs [x103]
Training function traingd traingdm trainscg
1 0.091106 0.095071 0.0448642 0.075433 0.077289 0.0290863 0.065253 0.070717 0.0198044 0.057608 0.063157 0.0138275 0.052207 0.059571 0.0105796 0.048520 0.057414 0.0079577 0.046636 0.055822 0.0051698 0.044688 0.054163 0.0037889 0.043009 0.052996 0.002778
10 0.041746 0.052050 0.00202211 0.040647 0.051241 0.00149812 0.039635 0.050446 0.00112113 0.038733 0.049565 0.00085714 0.037951 0.048906 0.00064115 0.037280 0.048252 0.00048416 0.036765 0.047672 0.00037117 0.036307 0.047196 0.00028718 0.036205 0.046791 0.00022719 0.035512 0.046402 0.00018020 0.034884 0.046031 0.00014521 0.035085 0.045602 0.00011622 0.034276 0.045203 0.00009023 0.033810 0.044834 0.00007224 0.033245 0.044472 0.00005825 0.032845 0.044129 0.00004726 0.032403 0.043726 0.00003827 0.031804 0.040679 0.00003028 0.031161 0.039840 0.00002529 0.030698 0.039499 0.00002030 0.030339 0.039221 0.000016
WSEAS TRANSACTIONS on SYSTEMS Marius Cristian Luculescu and Simona Lache
ISSN: 1109-2777271
Issue 3, Volume 7, March 2008

Fig.9. Square mean error distribution for 15 training cycles, for 3 training functions
Regarding the transfer function, best results were obtained for the tansig - hyperbolic tangent sigmoid transfer function, even the square mean error is not the smallest. There were no significant differences at the training time for the tested transfer functions, but the mean number of classified images was better for tansig and for a bigger number of neurons in the hidden layer (Fig.11).
From the structure of the network point of view, three different configuration were tested, with 10, 39, 78 neurons in the hidden layer. The higher the number of neurons, the higher the time for a training cycle, but the diagnostics should be classified in fewer cycles. Best results for the square mean error and number of classified diagnostics were obtained with a 39-78-15 architecture (39 neurons in the input layer, 78 in the hidden layer and 15 in the output layer), even the training time is higher (Tab. 2, Tab. 3, Fig.12).
.
Fig.10. Average square errors and average number of classified diagnostics for different training functions
Fig.11. Average square errors and average number of classified diagnostics for different transfer functions
WSEAS TRANSACTIONS on SYSTEMS Marius Cristian Luculescu and Simona Lache
ISSN: 1109-2777272
Issue 3, Volume 7, March 2008
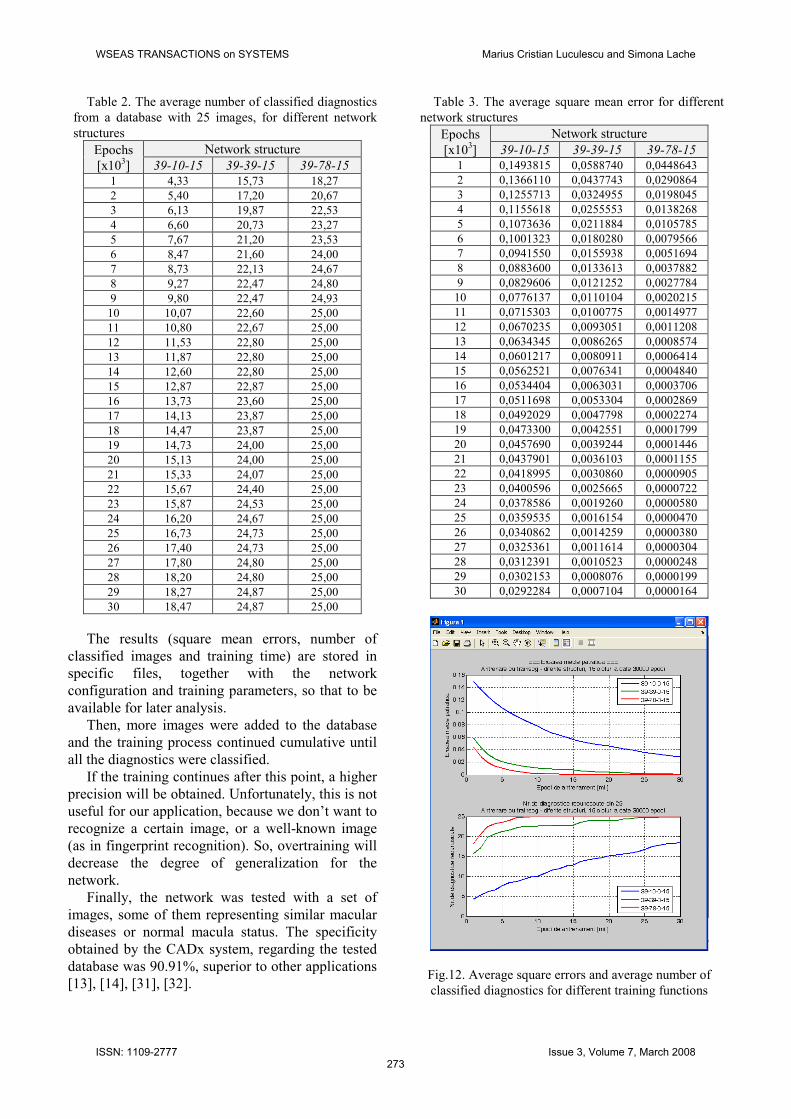
Table 2. The average number of classified diagnostics from a database with 25 images, for different network structures
Epochs [x103]
Network structure 39-10-15 39-39-15 39-78-15
1 4,33 15,73 18,27 2 5,40 17,20 20,67 3 6,13 19,87 22,53 4 6,60 20,73 23,27 5 7,67 21,20 23,53 6 8,47 21,60 24,00 7 8,73 22,13 24,67 8 9,27 22,47 24,80 9 9,80 22,47 24,93
10 10,07 22,60 25,00 11 10,80 22,67 25,00 12 11,53 22,80 25,00 13 11,87 22,80 25,00 14 12,60 22,80 25,00 15 12,87 22,87 25,00 16 13,73 23,60 25,00 17 14,13 23,87 25,00 18 14,47 23,87 25,00 19 14,73 24,00 25,00 20 15,13 24,00 25,00 21 15,33 24,07 25,00 22 15,67 24,40 25,00 23 15,87 24,53 25,00 24 16,20 24,67 25,00 25 16,73 24,73 25,00 26 17,40 24,73 25,00 27 17,80 24,80 25,00 28 18,20 24,80 25,00 29 18,27 24,87 25,00 30 18,47 24,87 25,00
The results (square mean errors, number of classified images and training time) are stored in specific files, together with the network configuration and training parameters, so that to be available for later analysis.
Then, more images were added to the database and the training process continued cumulative until all the diagnostics were classified.
If the training continues after this point, a higher precision will be obtained. Unfortunately, this is not useful for our application, because we don’t want to recognize a certain image, or a well-known image (as in fingerprint recognition). So, overtraining will decrease the degree of generalization for the network.
Finally, the network was tested with a set of images, some of them representing similar macular diseases or normal macula status. The specificity obtained by the CADx system, regarding the tested database was 90.91%, superior to other applications [13], [14], [31], [32].
Table 3. The average square mean error for different network structures
Epochs [x103]
Network structure 39-10-15 39-39-15 39-78-15
1 0,1493815 0,0588740 0,0448643 2 0,1366110 0,0437743 0,0290864 3 0,1255713 0,0324955 0,0198045 4 0,1155618 0,0255553 0,0138268 5 0,1073636 0,0211884 0,0105785 6 0,1001323 0,0180280 0,0079566 7 0,0941550 0,0155938 0,0051694 8 0,0883600 0,0133613 0,0037882 9 0,0829606 0,0121252 0,0027784
10 0,0776137 0,0110104 0,0020215 11 0,0715303 0,0100775 0,0014977 12 0,0670235 0,0093051 0,0011208 13 0,0634345 0,0086265 0,0008574 14 0,0601217 0,0080911 0,0006414 15 0,0562521 0,0076341 0,0004840 16 0,0534404 0,0063031 0,0003706 17 0,0511698 0,0053304 0,0002869 18 0,0492029 0,0047798 0,0002274 19 0,0473300 0,0042551 0,0001799 20 0,0457690 0,0039244 0,0001446 21 0,0437901 0,0036103 0,0001155 22 0,0418995 0,0030860 0,0000905 23 0,0400596 0,0025665 0,0000722 24 0,0378586 0,0019260 0,0000580 25 0,0359535 0,0016154 0,0000470 26 0,0340862 0,0014259 0,0000380 27 0,0325361 0,0011614 0,0000304 28 0,0312391 0,0010523 0,0000248 29 0,0302153 0,0008076 0,0000199 30 0,0292284 0,0007104 0,0000164
Fig.12. Average square errors and average number of classified diagnostics for different training functions
WSEAS TRANSACTIONS on SYSTEMS Marius Cristian Luculescu and Simona Lache
ISSN: 1109-2777273
Issue 3, Volume 7, March 2008

Fig.13. Image recognition using ANN, from the image processing module
Image recognition can be run from inside the
image processing module and inside the diagnosis database module (Fig.13).
The entire image or a certain selected area can be recognized after choosing the proper trained neural network.
A list of four possible diagnostics, ordered by a certitude coefficient, is displayed.
3.5 Patients’ database The doctor receives the decision from the
Computer-Aided Diagnosis system and after a discussion with the patient about pathological personal and heredo-collateral antecedents, different medical treatments, establishes the final diagnosis. This can be stored in the patients’ database.
Patient’s record contains the following information: name of the patient, patient’s ID which is used for uniquely identification of the same person, if it is male or female, patient’s age, working domain, the date when the record was added or diagnosis date, name and full path of the image file, what the diagnosis is about, a history of patient health status or past diagnosis, the treatment recommended for him and some special remarks [33].
Because of the size of the database, we considered that it is more useful to store only the path and the name of the retina image file. All the image files can be stored in a separate folder on the hard disk for example. It is an advantage because these images can be viewed, analyzed or transferred independently of the database itself, instead of embedding them into the database.
From the patients’ database, a diagnoses database can be extracted and different types of queries and reports can be generated.
Data have additional value beyond supporting the care of specific patients. For example, subsets of individual patient care data can be used for research purposes, quality assurance purposes, developing and assessing patient care treatment paths (planned sequences of medical services to be implemented after the diagnoses and treatment choices have been made), assessments of treatment strategies across a range of choices, and assessments of medical technologies in use.
The software package is supplied in executable format, so it can be installed on every computer without having to install Matlab®.
4 Conclusion Entire software for this Computer-Aided
Diagnosis system was developed by the authors. The doctor will use the program in a so-called user mode, that does not contain all the facilities above, and that can be chosen from the Settings menu option. The system is an open one, allowing to create new databases with diagnoses images, new neural networks, to train and optimize them, by an administrator which will have access to all the facilities (administrator mode), so that having the possibility to recognize new diagnoses and to continue the training process for improving system performance.
The graphical interface is a user-friendly one. Starting from classical or digital retina images,
using neural networks image recognition algorithms, the Computer-Aided Diagnosis (CADx) system identifies macular diseases with high precision. Images are stored in databases together with patient personal details and treatments and diagnosis information. The software includes image processing modules, databases and neural networks that can be trained for recognizing images of new diseases. The Computer-Aided Diagnosis reduces the doctor’s level of incertitude regarding similar diseases, improves the initial and evolutional identification precision of disease, allows monitoring the health status of the patient during new treatment methods, stores images in digital format and generates diagnoses databases that can be used in research, medical practice and specialized teaching.
New development directions for the system will focus on:
WSEAS TRANSACTIONS on SYSTEMS Marius Cristian Luculescu and Simona Lache
ISSN: 1109-2777274
Issue 3, Volume 7, March 2008

• Embedding the system so that to be implemented in a retinal digital investigation camera. This supposes a hardware implementation of the neural network, together with image processing functions;
• On-line retina image analysis on the computer. It will be possible only with a digital retinal investigation camera;
• Integration in a database server for different types of diagnosis, with remote secured access for researchers, doctors, teachers and students. This database will be developed in an important research project called “Researches Concerning the Imaging and Computer-Aided Diagnosis of Human Visual System Diseases”, financed by the Romanian Council for Research in Higher Education;
• Adapting the system for using it to recognize images from other domains (industrial for example);
• Improving the system by adding new image features that can be used as inputs in the neural network and testing it on databases containing other images than the retinal ones, in the medical imaging domain;
• The possibility to compare more than two images, for better observing the evolution of a disease, side by side or superposed, using transparency;
• Training neural networks for classification of certain diseases (one network for one type of disease), improving specificity and adapting the CADx software to use multiple networks for recognizing of a large range of diseases.
References: [1] American Macular Degeneration Foundation
www.macular.org , 2008. [2] National Eye Institute, National Institutes of
Health, www.nei.nih.gov/health/maculardegen/2008.
[3] B.J. Erickson, B. Bartholmai, Computer-Aided Detection and Diagnosis at the Start of the Third Millennium, Journal of Digital Imaging,nr. 15, pag. 59–68, 2002.
[4] M. Luculescu, S. Lache, MaculaTEST – Computer-Aided Diagnosis System for Macular Diseases, The 6th WSEAS International Conference on
COMPUTATIONAL INTELLIGENCE, MAN-MACHINE SYSTEMS and CYBERNETICS (CIMMACS '07), Puerto De La Cruz, Tenerife, Canary Islands, Spain, December 14-16, 2007, pp.77-82.
[5] R.M. Summers, Road Maps for Advancement of Radiologic Computer-Aided Detection in The 21st Century, Radiology, nr. 229, 2003, pp. 11–13.
[6] F. M. Hall, Breast Imaging and Computer-Aided Detection, The New England Journal of Medicine, vol. 356, 2007, pp. 1464-1466.
[7] J. Shiraishi, et al., Computer-Aided Diagnosis for Distinction between Benign and Malignant Solitary Pulmonary Nodules in Chest Radiographs: ROC Analysis of Radiologists’ Performance, Radiology nr. 227, 2003, pp. 469–474.
[8] L.P. Lawler, et al., Computer Assisted Detection of Pulmonary Nodules: Preliminary Observations Using a Prototype System with Multidetector Row CT Data Sets, Journal of Digital Imaging nr. 16, 2003, pp. 251–261.
[9] C.C. McCulloch, et al., Model-based Detection of Lung Nodules in Computed Tomography Exams, Academia Radiol. nr. 11, 2004, pp. 258–266.
[10] S. Kobashi, et al., Computer-Aided Diagnosis of Intracranial Aneurysms in MRA Images with Case-Based Reasoning, IEICE Transactions on Information and Systems, nr. E89-D, 2006, pp. 340-350.
[11] R. Yokoyama, et al., Development of an Automated Method for the Detection of Chronic Lacunar Infarct Regions in Brain MR Images, IEICE Trans. on Inf. and Systems nr. E90-D, 2007, pp. 943-954.
[12] J.C. Brown, et al., Detection of Diabetic Foveal Edema, Arch. Ophthalm., nr.122, 2004, pp.330–335.
[13] T. Hatanaka, et al., Development of Computer-Aided Diagnosis System for Fundus Images, The 8th International Conference on Medical Image Computing and Computer Assisted Intervention, Palm Springs, California, USA, 2005.
[14] M. Larsen, et al., Automated Detection of Fundus Photographic Red Lesions in Diabetic Retinopathy, Investigative Ophthalmology & Visual Science, vol. 44, No.2, 2003, pp. 761-766.
[15] M. Niemeijer, et al., Segmentation of the Optic Disc, Macula and Vascular Arch in Fundus
WSEAS TRANSACTIONS on SYSTEMS Marius Cristian Luculescu and Simona Lache
ISSN: 1109-2777275
Issue 3, Volume 7, March 2008
Photographs, IEEE Trans. Med. Imaging, nr. 26(1), 2007, pp. 116-127.
[16] L. Carnimeo, A. Giaquint, Contrast Enhancement of Diabetic Retinal Images via a Hybrid Neurofuzzy System, WSEAS TRANSACTIONS on SYSTEMS, Issue 7, Volume 5, July 2006, pp.1595-1600.
[17] S. Yamamoto, Image Processing Algorithm of Computer-Aided Diagnosis In Lung Cancer Screening By CT, Systems and Computers in Japan, vol. 36, 2005, pp. 40–53.
[18] M. Burroni, et al., Melanoma Computer-Aided Diagnosis: Reliability and Feasibility Study, Clinical Cancer Research, vol. 10, 2004, pp. 1881–1886.
[19] M. Niemeijer, et al., Automated Detection and Differentiation of Drusen, Exudates, and Cotton-Wool Spots in Digital Color Fundus Photographs for Diabetic Retinopathy Diagnosis, Investigative Ophthalmology and Visual Science, nr. 48(5), 2007, pp. 2260-2267.
[20] Osman M. K., Mashor M. Y., Arshad M. R., 3D Object Recognition Using Multiple Views, Affine Moment Invariants and Multilayered Perceptron Network, WSEAS TRANSACTIONS on SYSTEMS Journal, Issue 10, Volume 3, December 2004, pp. 3065-3069.
[21] F. Ahmed, Artificial Neural Networks for Diagnosis and Survival Prediction in Colon Cancer, Molecular Cancer nr. 4, 2005, pp. 29.
[22] S. H. Muhammad, et. Al, Image Texture Classification using Projection and Neural Network, WSEAS TRANSACTIONS on SYSTEMS Journal, Issue 4, Volume 3, June 2004, pp. 1825-1830.
[23] V. S. Kodogiannis, M. Boulougoura, E. Wadge, Improved Neural Network-Based Interpretation of Capsule Endoscopic Images, WSEAS TRANSACTIONS on SYSTEMS Journal, Issue 9, Volume 4, September 2005, pp. 1499-1507.
[24] R. Gonzales, R. Woods, S. Eddins, Digital Image Processing using Matlab, Pearson Prentice Hall, 2004.
[25] M. Luculescu, S. Lache, D. Barbu, I. Barbu, Feature Extraction Methods Used for Images of Macular Diseases – Part I, The 1st International Conference on Computational Mechanics and Virtual Engineering – COMEC 2005, Braşov, Vol. II, 2005, pp. 48-54.
[26] M. Luculescu, S. Lache, D. Barbu, I. Barbu, Feature Extraction Methods Used for Images of Macular Diseases – Part II, The 1st International Conference on Computational Mechanics and Virtual Engineering – COMEC 2005, Braşov, Vol. II, 2005, pp. 55-60.
[27] S. Y. Kung, Digital Neural Networks, Prentice Hall, 1993.
[28] M. Luculescu, Macular Diseases Recognition Using Neural Networks, The First National Conference of Optometry and Medical Engineering – COPTOMIM 2006, Braşov, 2006, pp. 155-158.
[29] Luculescu M, Researches on Biological Human Visual Structures Concerning the Diagnosis of Macular Diseases, PhD Thesis, 2007.
[30] M.F. Moller, A Scaled Conjugate Gradient Algorithm for Fast Supervised Learning, Neural Networks, Vol. 6, 1993, pp. 525-533.
[31] J. I. Hayashi, et al., A Development of Computer-Aided Diagnosis System using Fundus Images, The Seventh International Conference on Virtual Systems and Multimedia (VSMM'01), 2001, pp. 429-438.
[32] E. Tzanakou-Micheli E., Supervised and Unsupervised Pattern Recognition, CRC Press, 2000.
[33] M. Luculescu, C. Enache, Patients’ Management Software For Ophthalmologic Office, The First National Conference of Optometry and Medical Engineering – COPTOMIM 2006, Braşov, 2006, pp. 159-162.
WSEAS TRANSACTIONS on SYSTEMS Marius Cristian Luculescu and Simona Lache
ISSN: 1109-2777276
Issue 3, Volume 7, March 2008