Computer-aided Diagnosis in Diagnostic Mammography...
14
205 Computer-aided Diagnosis in Diagnostic Mammography and Multimodality Breast Imaging 1 Maryellen L. Giger, PhD RSNA Categorical Course in Diagnostic Radiology Physics: Advances in Breast Imaging—Physics, Technology, and Clinical Applications 2004; pp 205–217. 1 From the Department of Radiology, University of Chicago, MC 2026, 5841 S Maryland Ave, Chicago, IL 60637 (e-mail: [email protected]). Supported in part by U.S. Public Health Service grants CA89452 and T32 CA09649 and by U.S. Army Medical Research and Materiel Command grant DAMD 97-2445. M.L.G. is a shareholder in R2 Technology, Inc, Sunnyvale, Calif. It is the policy of the University of Chicago that investigators disclose publicly actual or potential significant financial interests that may appear to be affected by the research activities. Useful interpretation in mammography depends on the quality of the mammographic images and the ability of the radiologists who interpret them. Improvements in radio- graphic technique, as well as mandatory accreditation programs, have made the early signs of breast cancer more apparent on mammograms. However, radiologists still sometimes miss cancer on a mammogram. One approach to improving performance is replicated interpretations, in which more than one observer reviews the images. For ex- ample, investigators have shown that detection of early breast cancer can be increased with double reading by two radiologists (1). In addition, results of studies have shown that interpretation performance varies greatly among radiologists (2–4). An alternate approach is to use a computer as the second reader. Use of output from a computerized analysis of an image by radiologists may help them in the tasks of de- tection or diagnosis and potentially improve the overall interpretation of breast images and the subsequent patient care. Many factors motivate the attempts to aid or auto- mate radiologic diagnosis. Inadequacies in interpretation performance may be due to the presence of image noise or normal anatomic structures, as well as to known limita- tions in the human search and perception process. Ultimately, computer-aided diagno- sis (CAD) may become an integrated tool in the diagnostic work-up of suspect breast lesions by using multimodality images. This chapter reviews various CAD methods in breast imaging (mammography, ultra- sound [US], and magnetic resonance [MR] imaging), which are focused on the charac- terization of lesions and the estimation of the probability of malignancy for use in the diagnostic work-up of suspect lesions. CAD systems in diagnostic work-up usually in- volve having the computer extract the margin of the lesion from the surrounding pa- renchyma, extract characteristics (features) of the lesions, merge these computer-ex- tracted features into an estimate of the probability of malignancy, and, as an option, automatically retrieve similar lesions from an online reference library. The aim of CAD in diagnostic work-up is to increase classification sensitivity and specificity, as well as to reduce intra- and interobserver variability. Various reviews have been written about CAD in breast imaging (5–11).
Transcript of Computer-aided Diagnosis in Diagnostic Mammography...

205
Computer-aided Diagnosis inDiagnostic Mammography
and MultimodalityBreast Imaging1
Maryellen L. Giger, PhD
RSNA Categorical Course in Diagnostic Radiology Physics: Advances in Breast Imaging—Physics, Technology,and Clinical Applications 2004; pp 205–217.
1From the Department of Radiology, University of Chicago, MC 2026, 5841 S Maryland Ave, Chicago, IL 60637 (e-mail:[email protected]).
Supported in part by U.S. Public Health Service grants CA89452 and T32 CA09649 and by U.S. Army Medical Researchand Materiel Command grant DAMD 97-2445.
M.L.G. is a shareholder in R2 Technology, Inc, Sunnyvale, Calif. It is the policy of the University of Chicago that investigatorsdisclose publicly actual or potential significant financial interests that may appear to be affected by the research activities.
Useful interpretation in mammography depends on the quality of the mammographicimages and the ability of the radiologists who interpret them. Improvements in radio-graphic technique, as well as mandatory accreditation programs, have made the earlysigns of breast cancer more apparent on mammograms. However, radiologists stillsometimes miss cancer on a mammogram. One approach to improving performance isreplicated interpretations, in which more than one observer reviews the images. For ex-ample, investigators have shown that detection of early breast cancer can be increasedwith double reading by two radiologists (1). In addition, results of studies have shownthat interpretation performance varies greatly among radiologists (2–4).
An alternate approach is to use a computer as the second reader. Use of output froma computerized analysis of an image by radiologists may help them in the tasks of de-tection or diagnosis and potentially improve the overall interpretation of breast imagesand the subsequent patient care. Many factors motivate the attempts to aid or auto-mate radiologic diagnosis. Inadequacies in interpretation performance may be due tothe presence of image noise or normal anatomic structures, as well as to known limita-tions in the human search and perception process. Ultimately, computer-aided diagno-sis (CAD) may become an integrated tool in the diagnostic work-up of suspect breastlesions by using multimodality images.
This chapter reviews various CAD methods in breast imaging (mammography, ultra-sound [US], and magnetic resonance [MR] imaging), which are focused on the charac-terization of lesions and the estimation of the probability of malignancy for use in thediagnostic work-up of suspect lesions. CAD systems in diagnostic work-up usually in-volve having the computer extract the margin of the lesion from the surrounding pa-renchyma, extract characteristics (features) of the lesions, merge these computer-ex-tracted features into an estimate of the probability of malignancy, and, as an option,automatically retrieve similar lesions from an online reference library. The aim of CADin diagnostic work-up is to increase classification sensitivity and specificity, as well asto reduce intra- and interobserver variability. Various reviews have been written aboutCAD in breast imaging (5–11).
Gig
er
206
Computer-aided detection has already been incor-porated into clinical screening mammography, and itsstatus is reviewed elsewhere in this RSNA syllabus (seechapter by Chan et al). There are currently computer-aided detection systems approved by the Food andDrug Administration, with many insurance carriers,including Medicare, providing coverage for such tech-nology. Development of promising computer-aideddiagnosis prototypes is also underway, and aspects ofthese future systems are reviewed in this chapter.
The general techniques employed in the computeranalysis of images can be broadly categorized as com-puter vision and artificial intelligence (12,13). Com-puter vision involves having a computer extract from adigital image features that may or may not be other-wise perceived by a human reader. The developmentof computer vision schemes requires a priori informa-tion about the medical image (eg, the mammogram)and knowledge of various computer processing tech-niques and decision analysis methods. The requireda priori knowledge includes the physical imagingproperties of the digital image acquisition system andmorphologic information concerning the abnormality(eg, mass lesion or cluster of microcalcifications),along with its associated anatomic background. Thatis, a sufficient database is needed to cover the entirerange of abnormal and normal findings. Computer vi-sion techniques include, in general, image processing,image segmentation, and feature extraction (12,13).
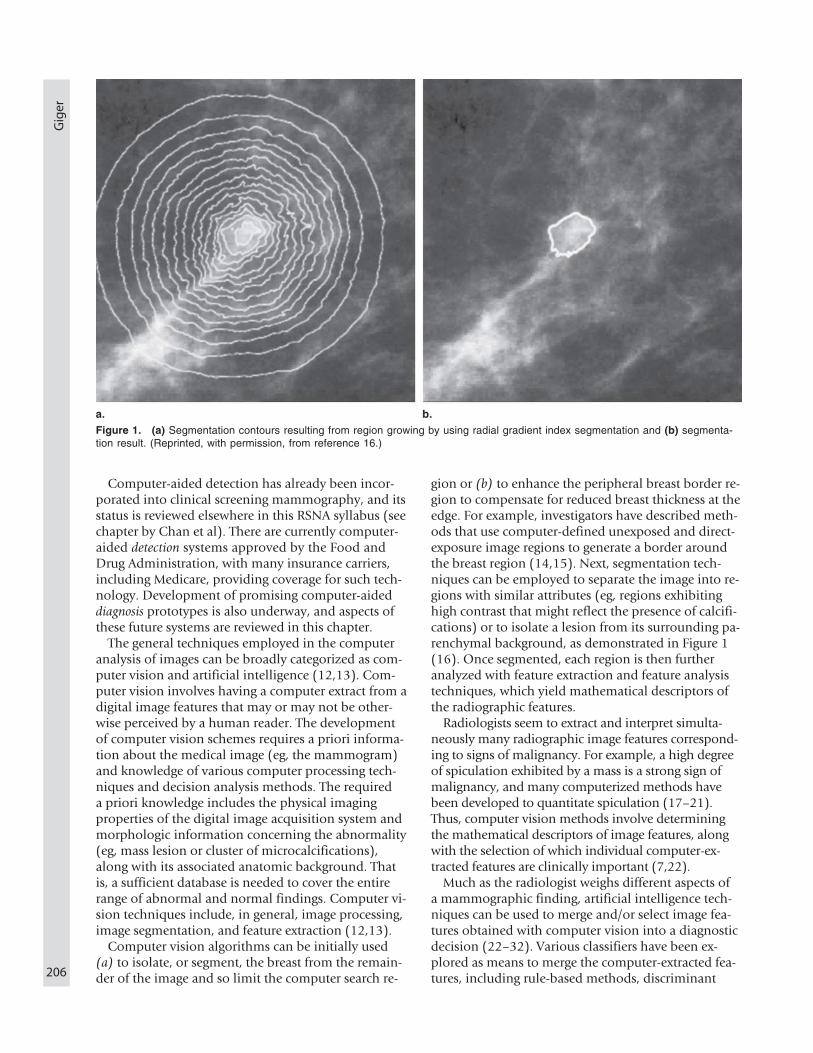
Computer vision algorithms can be initially used(a) to isolate, or segment, the breast from the remain-der of the image and so limit the computer search re-
gion or (b) to enhance the peripheral breast border re-gion to compensate for reduced breast thickness at theedge. For example, investigators have described meth-ods that use computer-defined unexposed and direct-exposure image regions to generate a border aroundthe breast region (14,15). Next, segmentation tech-niques can be employed to separate the image into re-gions with similar attributes (eg, regions exhibitinghigh contrast that might reflect the presence of calcifi-cations) or to isolate a lesion from its surrounding pa-renchymal background, as demonstrated in Figure 1(16). Once segmented, each region is then furtheranalyzed with feature extraction and feature analysistechniques, which yield mathematical descriptors ofthe radiographic features.
Radiologists seem to extract and interpret simulta-neously many radiographic image features correspond-ing to signs of malignancy. For example, a high degreeof spiculation exhibited by a mass is a strong sign ofmalignancy, and many computerized methods havebeen developed to quantitate spiculation (17–21).Thus, computer vision methods involve determiningthe mathematical descriptors of image features, alongwith the selection of which individual computer-ex-tracted features are clinically important (7,22).
Much as the radiologist weighs different aspects ofa mammographic finding, artificial intelligence tech-niques can be used to merge and/or select image fea-tures obtained with computer vision into a diagnosticdecision (22–32). Various classifiers have been ex-plored as means to merge the computer-extracted fea-tures, including rule-based methods, discriminant
Figure 1. (a) Segmentation contours resulting from region growing by using radial gradient index segmentation and (b) segmenta-tion result. (Reprinted, with permission, from reference 16.)

CA
D in
Diag
no
sis and
Mu
ltimo
dality Im
agin
g
207
analysis, artificial neural networks, Bayesian classifi-ers, fuzzy logic, and combination methods, and theseare summarized elsewhere (7). Analogous to radiolo-gist training, classifiers are “trained” on cases in whichthe actual disease status is known. This training deter-mines the setting internal to the computer algorithmin a way that provides output that reflects the possibledisease status most accurately.
It should be noted that some of the limitations ofthe human visual system that are based on imagequality would also limit computerized image analyses(33). One should not expect computer image analysissystems to “interpret” poor-quality mammogramshaving low signal levels or high noise levels. However,the analysis of mammograms by computers is expectedto improve if the mammograms are of high quality.
Validation ultimately requires assessment of theperformance of a computerized method for a specifictask on an independent set of cases. The assessed per-formance of a computer system can be based on thesystem’s performance alone, or it can be based on ra-diologists’ performances when they are using the com-puter output as an aid in their interpretations (34).
The output of the various detection and classifica-tion methods varies depending on the details of thespecific methods that are available, the database em-ployed to evaluate the computerized approach, andthe level of expertise of the human user. It is also im-portant to note that it is not possible to compare dif-ferent computerized methods because of the use ofdifferent databases. That is, it cannot be assumed thata computerized scheme that achieves a high sensitivitywith one database of mammograms will achieve asimilar performance level with another database orwith an actual patient population. In addition to thedatabase, the method of evaluation will influence per-formance and expectations of a specific computerizedscheme. Some of the computerized schemes havebeen tested, or merely demonstrated, with only a fewimages, whereas others have been tested with moder-ate-sized databases and statistical testing methods.Performance levels in the latter situations are usuallygiven for the detection schemes in terms of the sensi-tivity (true-positive rate) for detection and the numberof false-positive detections per image and are given forthe classification schemes in terms of the sensitivityfor classification and the specificity (ie, 1 − the false-positive fraction).
CAD IN SCREENING MAMMOGRAPHY:OVERVIEW
For completeness, CAD in screening mammographywill be briefly mentioned here. In screening mam-mography, radiologists are limited in their detectionability by quantum noise and the presence of overlap-ping structures, that is, “structured noise.” Although
mammography is currently the best method for thedetection of breast cancer, radiologists may still fail todetect cancer that is evident retrospectively. Themissed detections may be due to the subtle nature ofthe radiographic findings (ie, low conspicuity of thelesion), poor image quality, eye fatigue, or oversightby the radiologist. Humans also routinely incur over-sight errors because of nonsystematic search patternsand lapses in perception. Such oversight error is exac-erbated in mammographic screening, in which morethan 99.5% of the cases are normal.
In addition, it has been suggested that double read-ing (by two radiologists) may increase sensitivity (1).Thus, one aim of CAD is to increase the efficiency andeffectiveness of screening procedures by using a com-puter system, as a “second reader” (like a spell-checker), to aid radiologists by directing their atten-tion to regions on mammograms that the computerdeems to have features associated with cancer. Notethat the final decision regarding the likelihood of thepresence of a cancer and patient management is left tothe radiologist. Because mammography is a high-vol-ume x-ray procedure routinely interpreted by radiolo-gists and because radiologists do not detect all cancersthat are visible on images in retrospect, it is expectedthat the efficiency and effectiveness of screening willbe increased with CAD.
Computer detection systems identify locations ofsuspect abnormalities and convey this informationto radiologists by means of marks on display moni-tors, hard-copy film, or paper. The computer outputfor the detection of potential lesions indicates bothactual lesions and false-positive findings. During theyears, investigators have worked to increase detectionsensitivity while decreasing the number of falsemarks per image.
The ultimate test of a CAD system is its additivevalue, that is, the improved performance of radiolo-gists when the system is used in the clinical interpreta-tion process. The clinical usefulness of computer-aided detection for screening mammography has beenstudied with various laboratory observer studies (35–37), retrospective analysis of cases of “missed” lesions(38–41), and, more recently, actual prospective clini-cal usage of commercially available systems (42–44).Studies are also being conducted to determine thenecessary sensitivity and false mark rate for computer-ized detection methods to allow for improvement inradiologists’ performance levels (45). If the sensitivityis too low or if there are too many false marks per im-age, the computer aid may be either not useful or det-rimental to observer performance. Most recently, stud-ies are being performed to assess the performance ofcomputer detection methods for full-field digitalmammography systems, for which computer analysisbecomes a “push-button” implementation withoutthe need for film digitization.

Gig
er
208
CAD IN DIAGNOSTIC BREAST IMAGING:OVERVIEW
Once a possible abnormality is detected, its character-istics are simultaneously extracted and assessed by aradiologist to decide if the abnormality is likely to bemalignant or benign and to recommend the subse-quent patient management (eg, return to screening,short-term follow-up, additional images, biopsy). Al-though some lesions may show obvious signs of ma-lignancy or the lack thereof, many lesions present con-fusing findings. Many patients are referred for surgicalbiopsy on the basis of a radiographically detectedmass lesion or cluster of microcalcifications. Althoughthere are general rules for differentiating between be-nign and malignant breast lesions (46), radiologists’interpretations of lesions with current radiographictechniques vary considerably (47). Thus, an aim ofCAD is to extract and analyze objectively the charac-teristics of benign and malignant lesions seen on im-ages, aiding radiologists by increasing their diagnosticaccuracy and reducing false-positive diagnoses of ma-lignancies and thereby decreasing patient morbidity aswell as the number of surgical biopsies performed andtheir associated complications.
Characteristics of a lesion can also be assessed furtherwith multiple imaging techniques, including special-view mammography, US, and MR imaging. Incorrectmanagement decisions resulting from inaccurate imageinterpretation will typically decrease the positive pre-dictive value for biopsy recommendations. The adventof more multimodality analyses of the breast furthersthe role of CAD, both for computerized image analysisof the suspect lesion with different modalities and forthe merging of multimodality information.
CAD systems in diagnostic work-up are expected toextract the margin of the lesion from the surroundingparenchyma, extract characteristics (features) of the le-sions, merge these computer-extracted features into anestimate of the probability of malignancy, and, as anoption, retrieve similar lesions automatically from anonline reference library (7). The aim of CAD in diag-nostic work-up is to increase classification sensitivityand specificity and to reduce intra- and interobservervariability. It is important to restate that one of theaims of computerized classification is to reduce thenumber of benign cases sent for biopsy. Such a reduc-tion, however, will be clinically acceptable only if itdoes not result in malignant cases not being sent forbiopsy, because the “cost” of a missed cancer is muchgreater than misclassification of a benign case. Thus,computer classification schemes should be developedto improve specificity, but not at the loss of sensitivity.
Computerized image analysis schemes to aid in di-agnosis may use features that are extracted either bycomputers or by radiologists. The benefit of com-puter-extracted features is the objectivity and repro-
ducibility of the measurement of the specific feature.However, radiologists employ many radiographic im-age features, which they seem to extract and interpretsimultaneously and instantaneously. Thus, as dis-cussed earlier with computer detection methods, thedevelopment of computer diagnostic methods thatuse computer-extracted features requires both the de-termination of which individual features are clinicallyimportant and the computerized means for the extrac-tion of each such feature (22–32). Computer visionand artificial intelligence techniques are presently be-ing developed for the full range of modalities encoun-tered in diagnostic breast imaging: diagnostic mam-mography, US, and MR imaging.
CAD in Diagnostic Mammography
The initial investigations into the use of computersin diagnostic mammography involved artificial intel-ligence techniques to merge observations of imagefeatures made by radiologists into useful diagnosticpredictions (48–50). Such methods are dependent onthe subjective identification and interpretation of themammographic data by human observers. Recently,BI-RADS ratings provided by human readers havebeen analyzed by computers for lesion characteriza-tion (51). However, to eliminate the subjectivity ofhuman ratings and to automate lesion classificationmore fully, features extracted with computer visionhave been investigated as computerized diagnosticaids. Such mathematical descriptors may be based onthose visually used by radiologists, such as massspiculation or the spatial distribution of microcalcifi-cations, or they may be features that are not visuallyapparent to a human observer.
One of the earliest investigations into using com-puters to extract mammographic features and mergethem into a decision on malignancy was in 1972,when Ackerman and Gose (52) evaluated the use ofdigital xeroradiographs and the computer extractionof four measures of malignancy (calcification, spicula-tion, roughness, and shape) from radiologist-identi-fied suspicious regions. Calcification was character-ized by using a derivative histogram of the suspect re-gion. Spiculation was measured by examining thelines tangent to the edges of lesions. Roughness con-sisted of the sum of the absolute differences betweenpoints along a vertical line, whereas shape was deter-mined by using a perimeter-to-area ratio. The featureswere then merged into a decision on malignancy. Theresults, expressed in terms of receiver operating char-acteristic (ROC) curves, were obtained with a databaseof 60 images (30 having malignant and 30 having be-nign lesions) and indicated that the computer per-formed as well as an expert radiologist.
Various reviews of computer-extracted features ofmammographic lesions have been written elsewhere(5–11), and only some will be presented here for

CA
D in
Diag
no
sis and
Mu
ltimo
dality Im
agin
g
209
illustration. Various investigators have characterizedlesions by using mass features, such as size, degree ofspiculation, average gray level, contrast, smoothnessof the interior, and texture, and microcalcification fea-tures, such as the shape of individual calcificationsand their distribution within a cluster (7,17,18,53–66). These features were subsequently merged by us-ing discriminant functions to establish a probabilitythat a region contained malignant, benign, or normaltissue.
For example, in the late 1980s, a characterizationmethod was developed that was based on the degreeof spiculation exhibited by a mass, because malignantmasses often can be distinguished from benignmasses by their more spiculated appearance at mam-
mography (17,18). In the classification scheme formass lesions (18,53), the mass is first extracted fromthe anatomic background of the mammogram withautomatic region-growing techniques. Features ex-tracted are then obtained by using cumulative edge-gradient histogram analysis, in which the gradient isanalyzed relative to the radial angle. In the cumulativeedge-gradient analysis, the maximum gradient andangle of this gradient relative to the radial directionare calculated.
Figure 2 (18) illustrates the calculation of the fullwidth at half maximum from the cumulative gradi-ent orientation histogram for a smooth mass and aspiculated mass. Other features include gray-leveland geometric measures. In the associated classifier,
Figure 2. Examples of (a) a mammographic spiculated mass and its corresponding cumulated edge-gradient-orientation distributionand (b) a mammographic circular smooth mass and its corresponding cumulated edge-gradient-orientation distribution. FWHM = fullwidth at half maximum. (Reprinted, with permission, from reference 18.)

Gig
er
210
spiculation was shown to dominate the learning,thus leading to the use of a combined rule-based/ar-tificial-neural-network classifier (54). In addition,the effects of variations in both case mix and filmdigitization technique on the performance of themethod were assessed (55). Computer categorizationof lesions as malignant or benign achieved an Azvalue (area under the ROC curve) of 0.90 for a priortraining database (one commercial scanner’s digitiza-tion) in a round-robin evaluation and Az values of0.82 and 0.81 for an independent database analyzedwith two other commercial digitization formats. Inthe statistical comparison of these performances,however, the investigators failed to show a signifi-cant difference between the performances with thetraining database and the independent validation da-tabase (P > .10). Thus, the computer-based methodfor the classification of lesions on mammograms wasshown to be robust to variations in case mix andfilm digitization technique (55).
The analysis of robustness was extended when the in-vestigators applied their algorithm to special-view mam-mography, which resulted in a substantial improve-ment in computer performance, as demonstrated inFigure 3 (56). In a result that parallels human observerperformance, the investigators demonstrated improvedcomputer performance in diagnosing lesions on special-view mammograms compared with that on standardviews (craniocaudal and mediolateral oblique views).
In 1991, in one of the earliest investigations of com-puter characterization of microcalcifications, Patrick et
al (60) reported on a network of trained expert learn-ing systems. The network included three systems—onefor features of individual microcalcifications, one forfeatures of the clusters, and one for clinical presenta-tions—that classify clusters of calcifications as benignor malignant. Calculated geometric parameters in-cluded center of gravity, length, breadth, orientation,area, perimeter, moments, and convex perimeter. Fea-tures were then constructed from these measurements.With 25 clusters of calcifications that had been re-ferred for biopsy, the system had a classification sensi-tivity of 90% (nine of the 10 cancers were correctlyrecognized) and a specificity of 60% (nine of the 15benign cases were correctly recognized), for an overallclassification accuracy of 72%.
Various other methods for characterizing clusteredmicrocalcifications have been reviewed elsewhere (7).For example, in the mid-1990s, a computerized meth-od for classifying clustered microcalcifications was de-veloped; it involved extracting features that correlatequalitatively with radiologists’ experience (61,62). Thecomputerized classification system estimated the like-lihood of malignancy on the basis of the appearanceof clustered microcalcifications on mammograms. Thecomputer automatically extracted features of the mi-crocalcifications that were related to their size, shape,quantity, and spatial distribution and then used an ar-tificial neural network to merge the features to pro-duce an estimate of the likelihood of malignancy.This likelihood can then be used by a radiologist tohelp decide whether the microcalcifications are malig-
Figure 3. (a) Example of a malignant mass lesion, including the conventional mammograms (four-on-one view), the region of inter-est (ROI) for the craniocaudal (CC) view, the ROI for the mediolateral oblique (MLO) view, and the special-view ROI. (b) ROC curvesobtained for the computer analysis of single-view mammographic images, that is, the CC, MLO, and special views. (Reprinted, withpermission, from reference 56.)

CA
D in
Diag
no
sis and
Mu
ltimo
dality Im
agin
g
211
nant or benign. Further studies on the classifier usedin the computerized diagnosis method demonstratedthe variability in the outputs of multiple neural net-works that are trained and “optimized” from the sametraining set (63). This is demonstrated in Figure 4(63), which shows the standard deviation in the out-put of eight artificial neural networks as a function ofthe average artificial neural network output. Interest-ingly, the largest variations were when the case wasdifficult to interpret, as indicated by the midrange out-put.
In laboratory observer studies, computerized diag-nostic methods have been shown to aid radiologists indistinguishing between malignant and benign lesions(62,64,65). Use of a computer diagnostic aid thereforehas the potential to increase sensitivity, specificity, orboth in the work-up of breast lesions. Investigatorshave demonstrated that radiologists showed an in-crease in both sensitivity and specificity in the charac-terization of clustered microcalcifications and in the as-sociated recommendation for biopsy (62). In addition,it has been shown that improved performance can beobtained by both expert mammographers and commu-nity-based radiologists who use CAD information, withthe increase greater for the nonexperts (64). However,methods for combining radiologist interpretations andcomputer outputs are still being investigated, and thesemethods will depend on the performances of the com-puter and the radiologist alone, as well as on the meth-od by which the radiologist can incorporate computeroutput into his or her final decision-making process.However, early studies show the potential for usingcomputer output to reduce the variability between radi-ologists’ interpretations (66).
Future directions for CAD in diagnostic mammog-raphy include connecting the computerized image
analysis for diagnosis to the output of computerizedmammographic detection methods. Toward this end,Edwards et al (67) have investigated methods forthree-way classification to incorporate computer clas-sification methods with computer detection outputand thus distinguish between malignant lesions, be-nign lesions, and false-positive detections.
CAD in Breast Ultrasound
The diagnostic work-up of a suspected breast lesionmay also include imaging with multiple modalities,such as US and MR imaging. Breast US is used as animportant adjunct to diagnostic mammography andis typically performed to evaluate palpable and mam-mographically identified masses and determinewhether they are cystic or solid. Although US is usedby many radiologists to distinguish between solid le-sions and cysts, it is difficult to distinguish betweenbenign and cancerous solid lesions. Stavros et al (68)used various features to characterize masses as benign,indeterminate, and malignant. Their classificationscheme had a sensitivity of 98.4% and a negative pre-dictive value of 99.5%.
US is a digital modality that is amenable to the ap-plication of CAD techniques that ultimately could beused in a real time, at the time of examination, to im-prove diagnostic accuracy. Given that US interpreta-tion is a subjective process and that criteria have beendeveloped that may allow differentiation between be-nign and malignant solid breast masses, it is reason-able to assume that CAD techniques applied to USimages would improve radiologists’ performance,particularly when combined with correspondingmammographic data.
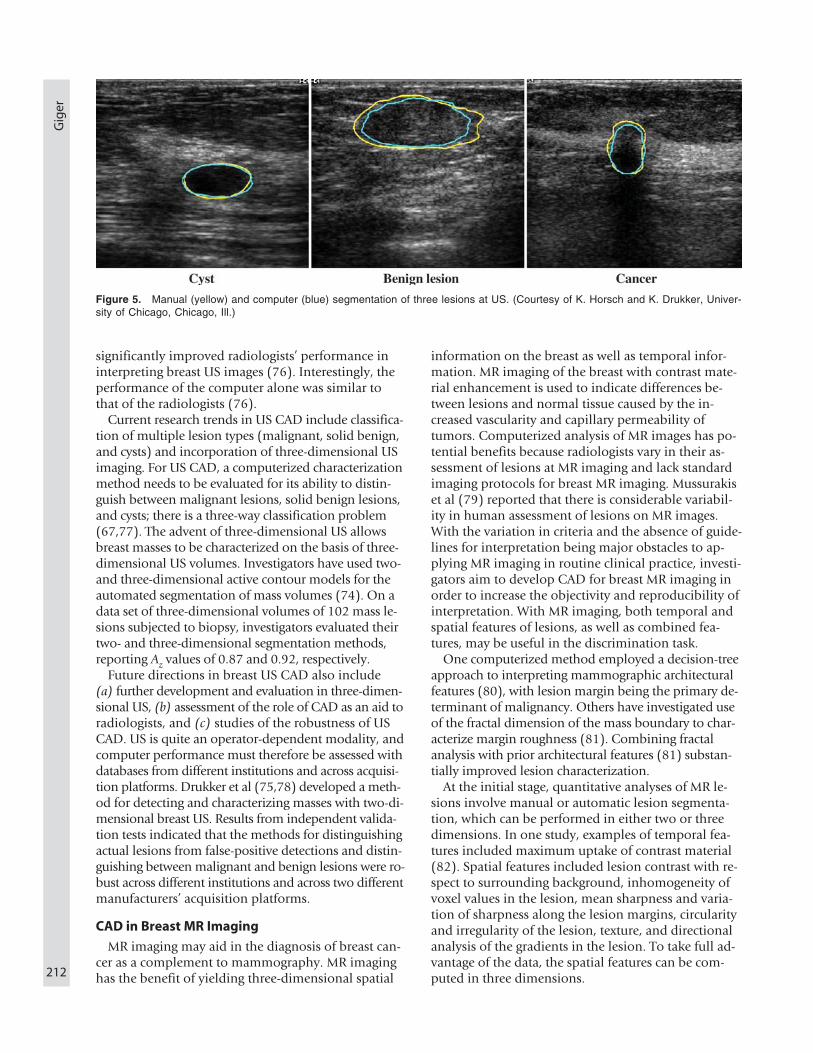
CAD methods in breast US are being explored byvarious researchers (69–74). As with mammographiclesions, the lesion is first extracted from the breast back-ground (72), and lesion features are then extracted.Figure 5 demonstrates lesions extracted from US imagesby means of gradient information (16,72,75). Assum-ing that lesions are roughly spherical, lesion extractionis possible even in the presence of acoustic shadowing.Mass lesions visible at US can be classified with a com-puter by using a variety of mathematical descriptors oftexture, margin, shape, and acoustic shadowing criteria(69–76).
As with CAD systems for mammography, the effecton radiologists’ performance must also be assessed todetermine the additive value of CAD systems for char-acterizing breast lesions at US. In one study, investiga-tors demonstrated that the use of computer classifica-tion schemes to distinguish between benign and ma-lignant masses helped inexperienced operators avoidmisdiagnosis (71). In another study, involving sixexpert mammographers and six community-basedradiologists, investigators demonstrated that the useof computer-estimated probabilities of malignancy
Figure 4. Standard deviation in the output of eight artificialneural networks (ANNs) as a function of the average ANN out-put. The ANNs were trained with a single training data set andidentical network parameters except for an arbitrary but differentseed value to a random number generator. (Reprinted, with per-mission, from reference 63.)
Gig
er
212
significantly improved radiologists’ performance ininterpreting breast US images (76). Interestingly, theperformance of the computer alone was similar tothat of the radiologists (76).
Current research trends in US CAD include classifica-tion of multiple lesion types (malignant, solid benign,and cysts) and incorporation of three-dimensional USimaging. For US CAD, a computerized characterizationmethod needs to be evaluated for its ability to distin-guish between malignant lesions, solid benign lesions,and cysts; there is a three-way classification problem(67,77). The advent of three-dimensional US allowsbreast masses to be characterized on the basis of three-dimensional US volumes. Investigators have used two-and three-dimensional active contour models for theautomated segmentation of mass volumes (74). On adata set of three-dimensional volumes of 102 mass le-sions subjected to biopsy, investigators evaluated theirtwo- and three-dimensional segmentation methods,reporting Az values of 0.87 and 0.92, respectively.
Future directions in breast US CAD also include(a) further development and evaluation in three-dimen-sional US, (b) assessment of the role of CAD as an aid toradiologists, and (c) studies of the robustness of USCAD. US is quite an operator-dependent modality, andcomputer performance must therefore be assessed withdatabases from different institutions and across acquisi-tion platforms. Drukker et al (75,78) developed a meth-od for detecting and characterizing masses with two-di-mensional breast US. Results from independent valida-tion tests indicated that the methods for distinguishingactual lesions from false-positive detections and distin-guishing between malignant and benign lesions were ro-bust across different institutions and across two differentmanufacturers’ acquisition platforms.
CAD in Breast MR Imaging
MR imaging may aid in the diagnosis of breast can-cer as a complement to mammography. MR imaginghas the benefit of yielding three-dimensional spatial
information on the breast as well as temporal infor-mation. MR imaging of the breast with contrast mate-rial enhancement is used to indicate differences be-tween lesions and normal tissue caused by the in-creased vascularity and capillary permeability oftumors. Computerized analysis of MR images has po-tential benefits because radiologists vary in their as-sessment of lesions at MR imaging and lack standardimaging protocols for breast MR imaging. Mussurakiset al (79) reported that there is considerable variabil-ity in human assessment of lesions on MR images.With the variation in criteria and the absence of guide-lines for interpretation being major obstacles to ap-plying MR imaging in routine clinical practice, investi-gators aim to develop CAD for breast MR imaging inorder to increase the objectivity and reproducibility ofinterpretation. With MR imaging, both temporal andspatial features of lesions, as well as combined fea-tures, may be useful in the discrimination task.
One computerized method employed a decision-treeapproach to interpreting mammographic architecturalfeatures (80), with lesion margin being the primary de-terminant of malignancy. Others have investigated useof the fractal dimension of the mass boundary to char-acterize margin roughness (81). Combining fractalanalysis with prior architectural features (81) substan-tially improved lesion characterization.
At the initial stage, quantitative analyses of MR le-sions involve manual or automatic lesion segmenta-tion, which can be performed in either two or threedimensions. In one study, examples of temporal fea-tures included maximum uptake of contrast material(82). Spatial features included lesion contrast with re-spect to surrounding background, inhomogeneity ofvoxel values in the lesion, mean sharpness and varia-tion of sharpness along the lesion margins, circularityand irregularity of the lesion, texture, and directionalanalysis of the gradients in the lesion. To take full ad-vantage of the data, the spatial features can be com-puted in three dimensions.
Figure 5. Manual (yellow) and computer (blue) segmentation of three lesions at US. (Courtesy of K. Horsch and K. Drukker, Univer-sity of Chicago, Chicago, Ill.)

CA
D in
Diag
no
sis and
Mu
ltimo
dality Im
agin
g
213
In an initial study, the performance of a radial gra-dient analysis and margin sharpness (combined bymeans of a linear discriminant function) were used todistinguish between malignant and benign lesions,yielding an Az of 0.96 in round-robin ROC analysis(83). Additional studies involved the investigation ofthree categories of features: morphology, enhance-ment kinetics, and variance dynamics over the lesion(84). In a database of 121 cases (77 malignant and 44benign), stepwise feature selection was employed toselect an effective subset of features. These were thencombined by means of linear discriminant analysisinto a discriminant score, which was related to thelikelihood of malignancy. With radiologist-delineatedlesion contours, stepwise feature selection yieldedfour features and an Az of 0.80 for the linear discrimi-nant analysis in leave-one-out cross-validation testing,compared with six features and an Az of 0.86 for auto-matically computer-segmented lesion volumes.
CAD in Multimodality Breast Imaging
Although some features encountered in breast imag-ing, such as margin sharpness, can be seen across mo-dalities, others are particular to the imaging modality,such as the computer characterization of the posterioracoustic behavior at US and the inhomogeneity ofcontrast material uptake in breast MR imaging. Radi-ologists, for example, rarely interpret a US imagewithout a corresponding mammogram, and thus it isimportant to assess the usefulness of CAD on multi-modality images in combination. Combining com-puter analyses from multiple views or modalities re-quires (a) additional computer intelligence to deter-mine the correspondence of lesions across views andmodalities (85) and (b) an efficient means of convey-ing multimodality information to the radiologist, asdiscussed in the next section.
Human-Computer Interface for CAD and Indexesof Similarity
For diagnostic output, a computer-determined esti-mate of the probability of malignancy for a specificcase can be given to the radiologist. This estimatedprobability could then be used by the radiologist indeciding on the next step in patient management.Swett and Miller (86) reported on an expert systemthat used a critiquing approach combined with an ex-pert system to control the image display. Sklansky etal (87) designed a mapped database diagnostic systemin which two-dimensional relation maps of knowncases are accessible for comparison to the feature val-ues of some unknown case. Giger et al (88,89) pre-sented a CAD system with output in the form in threemodes: a numerical mode giving values correspond-ing to the probability of malignancy, a pictorial modedisplaying similar images of known diagnoses, and agraphic mode that indicates on a distribution plot the
unknown lesion relative to all lesions in a known li-brary (an online atlas).
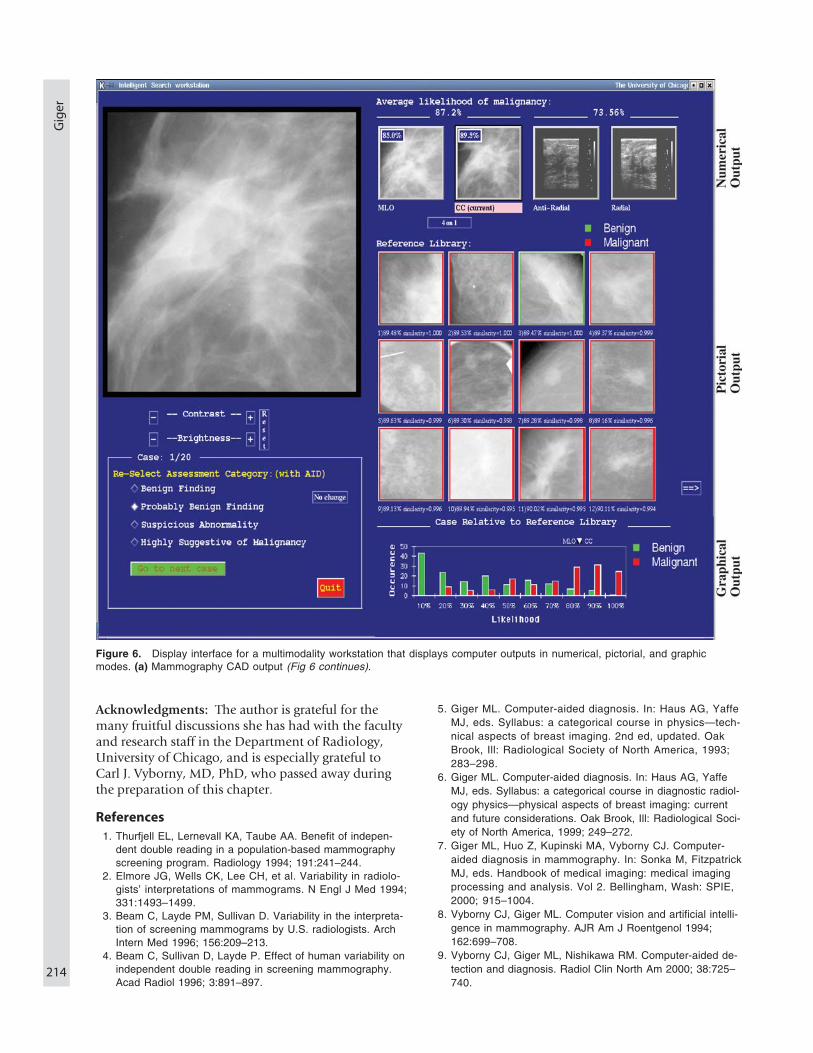
Output from multimodality computer image analy-ses parallels the interpretations of radiologists who in-terpret whole cases rather than individual images. Suchmultimodality output, however, requires effective andefficient displays to communicate the output to the ra-diologist. For example, Figure 6 shows an interface forthe output of a CAD system that is presented for differ-ent imaging modalities in terms of (a) computer-esti-mated probabilities of malignancy, (b) the display ofsimilar images of known diagnoses, and (c) a graphicrepresentation of the unknown lesion relative to all le-sions in a known database (an online atlas) (88–90).
A known image atlas can be searched according toindividual features or the likelihood of malignancy.The similarity index used in such a search can be se-lected by the radiologist from a variety of possibilities,such as the computer-estimated probability of malig-nancy or computer-extracted features (eg, margin defi-nition, spiculation, contrast). Note that in Figure 6,color coding is used to expedite the extraction of in-formation from the interface, with the malignant le-sions from the online reference library outlined in redand the benign lesions outlined in green. The similar-ity index used in the search can be chosen by the radi-ologist to be based on a single feature, multiple fea-tures, or the computer estimate of the likelihood ofmalignancy. The probability distributions of the ma-lignant and benign cases in the known database areshown along with the “location” of the unknown caserelative to the two distributions. The intelligent searchworkstation combines the benefit of CAD with priorknowledge obtained from confirmed cases. The po-tential of this interface has been demonstrated as anaid in the diagnostic interpretation of lesions by radi-ologists for both mammography alone (90) and com-bined display of mammography and US (91).
In summary, the potential for improved diagnosticperformance by radiologists in the task of interpretingmammograms provides strong motivation for CADmethods. The performance of computer algorithmscontinues to improve, and attention is now also di-rected to integrating computers in the clinical arena.Careful evaluation of system performance will require(a) comparisons of sensitivity and specificity acrosssimilar databases, (b) ultimate improvement in clini-cal practice, and (c) ease of integration into the breastimaging practices (92). Although the roles of comput-ers in mammographic detection and diagnosis are stillbeing clarified and validated, the ultimate effect onpractice may one day be both substantial and com-monplace. While the breadth and depth of CAD inbreast cancer imaging are increasing, continued andexpanded efforts are needed for establishing and con-firming databases and providing means for clinicalvalidation.
Gig
er
214
Acknowledgments: The author is grateful for themany fruitful discussions she has had with the facultyand research staff in the Department of Radiology,University of Chicago, and is especially grateful toCarl J. Vyborny, MD, PhD, who passed away duringthe preparation of this chapter.
References1. Thurfjell EL, Lernevall KA, Taube AA. Benefit of indepen-
dent double reading in a population-based mammographyscreening program. Radiology 1994; 191:241–244.
2. Elmore JG, Wells CK, Lee CH, et al. Variability in radiolo-gists’ interpretations of mammograms. N Engl J Med 1994;331:1493–1499.
3. Beam C, Layde PM, Sullivan D. Variability in the interpreta-tion of screening mammograms by U.S. radiologists. ArchIntern Med 1996; 156:209–213.
4. Beam C, Sullivan D, Layde P. Effect of human variability onindependent double reading in screening mammography.Acad Radiol 1996; 3:891–897.
5. Giger ML. Computer-aided diagnosis. In: Haus AG, YaffeMJ, eds. Syllabus: a categorical course in physics—tech-nical aspects of breast imaging. 2nd ed, updated. OakBrook, Ill: Radiological Society of North America, 1993;283–298.
6. Giger ML. Computer-aided diagnosis. In: Haus AG, YaffeMJ, eds. Syllabus: a categorical course in diagnostic radiol-ogy physics—physical aspects of breast imaging: currentand future considerations. Oak Brook, Ill: Radiological Soci-ety of North America, 1999; 249–272.
7. Giger ML, Huo Z, Kupinski MA, Vyborny CJ. Computer-aided diagnosis in mammography. In: Sonka M, FitzpatrickMJ, eds. Handbook of medical imaging: medical imagingprocessing and analysis. Vol 2. Bellingham, Wash: SPIE,2000; 915–1004.
8. Vyborny CJ, Giger ML. Computer vision and artificial intelli-gence in mammography. AJR Am J Roentgenol 1994;162:699–708.
9. Vyborny CJ, Giger ML, Nishikawa RM. Computer-aided de-tection and diagnosis. Radiol Clin North Am 2000; 38:725–740.
Figure 6. Display interface for a multimodality workstation that displays computer outputs in numerical, pictorial, and graphicmodes. (a) Mammography CAD output (Fig 6 continues).

CA
D in
Diag
no
sis and
Mu
ltimo
dality Im
agin
g
215
10. Jiang Y. Classification of breast lesions in mammograms.In: Bankman I, ed. Handbook of medical imaging: process-ing and analysis management. New York, NY: AcademicPress, 2000; 341–358.
11. Giger ML. Computerized image analysis in breast cancerdetection and diagnosis. Semin Breast Dis 2002; 5:199–210.
12. Ballard DH, Brown CM. Computer vision. Englewood Cliffs,NJ: Prentice-Hall, 1982.
13. Sonka M, Hlavac V, Boyle R. Image processing, analysis,and machine vision. Pacific Grove, Calif: Brooks/Cole,1999.
14. Bick U, Giger ML, Schmidt RA, Nishikawa RM, WolvertonDE, Doi K. Automated segmentation of digitized mammo-grams. Acad Radiol 1995; 2:1–9.
15. Mendez AJ, Tahoces PG, Lado MJ, Souto M, Correa JL,Vidal JJ. Automatic detection of breast border and nipple indigital mammograms. Comput Methods Programs Biomed1996; 49:253–262.
16. Kupinski MA, Giger ML. Automated seeded lesion segmen-tation on digital mammograms. IEEE Trans Med Imaging1998; 17:510–517.
17. Giger ML, Vyborny CJ, Schmidt RA. Computerized charac-terization of mammographic masses: analysis of spicula-tion. Cancer Lett 1994; 77:201–211.
18. Huo Z, Giger ML, Vyborny CJ, et al. Analysis of spiculationin the computerized classification of mammographicmasses. Med Phys 1995; 22:1569–1579.
19. Karssemeijer N, te Brake GM. Detection of stellate distortionsin mammograms. IEEE Trans Med Imaging 1996; 15:611.
20. Kegelmeyer WP Jr, Pruneda JM, Bourland PD, Hillis A,Riggs MW, Nipper ML. Computer-aided mammographicscreening for spiculated lesions. Radiology 1994; 191:331–337.
21. Sahiner B, Chan HP, Petrick N, Helvie MA, Goodsitt MM.Computerized characterization of masses on mammo-grams: the rubber band straightening transform and textureanalysis. Med Phys 1998; 25:516–526.
22. Kupinski MA, Giger ML. Feature selection with limiteddatasets. Med Phys 1999; 26:2176–2182.
23. Nishikawa RM, Giger ML, Doi K, Vyborny CJ, Schmidt RA.Computer-aided detection of clustered microcalcificationson digital mammograms. Med Biol Eng Comput 1995; 33:174–178.
Figure 6 (continued). (b) US CAD output.
Gig
er
216
24. Polakowski WE, Cournoyer DA, Rogers SK, et al. Computer-aided breast cancer detection and diagnosis of masses usingdifference of Gaussians and derivative-based feature sa-liency. IEEE Trans Med Imaging 1997; 16:811–819.
25. Bankman N, Christens-Barry WA, Kim DW, Weinberg IN,Gatewood OB, Brody WR. Automated recognition of microcal-cification clusters in mammograms. Proc SPIE 1993; 1905.
26. Kalman BL, Reinus WR, Kwasny SC, Laine A, Kotner L.Prescreening entire mammograms for masses with artificialneural networks: preliminary results. Acad Radiol 1997;4:405–414.
27. Kupinski MA, Giger ML. Investigation of regularized neuralnetworks for the computerized detection of mass lesions indigital mammograms. In: Proceedings of the IEEE Engineer-ing Medicine and Biology Conference. 1997; 1336–1339.
28. Nagel RH, Nishikawa RM, Doi K. Analysis of methods forreducing false positives in the automated detection of clus-tered microcalcifications in mammograms. Med Phys 1998;25:1502–1506.
29. Cheng HD, Lui YM, Freimanis RI. A novel approach to mi-crocalcification detection using fuzzy logic technique. IEEETrans Med Imaging 1998; 17:442–450.
30. Sahiner B, Chan HP, Petrick N, Helvie MA, Goodsitt MM.Design of a high-sensitivity classifier based on a genetic al-gorithm: application to computer-aided diagnosis. Phys MedBiol 1998; 43:2853–2871.
31. Anastasio MA, Yoshida H, Nagel R, Nishikawa RM, Doi K.A genetic algorithm-based method for optimizing the perfor-mance of a computer-aided diagnosis scheme for detectionof clustered microcalcifications in mammograms. Med Phys1998; 25:1613–1620.
32. Kupinski MA, Giger ML, Doi K. Optimization of neural net-work inputs with genetic algorithms. In: Doi K, Giger ML,Nishikawa RM, Schmidt RA, eds. Digital mammography 96.Amsterdam, the Netherlands: Elsevier, 1996; 401–404.
33. Vyborny CJ. Image and observer issues in mammography.Semin Breast Dis 2002; 5:190–198.
34. Nishikawa RM. Assessment of the performance of com-puter-aided diagnosis and computer-aided diagnosis sys-tems. Semin Breast Dis 2002; 5:217–222.
35. Kegelmeyer WP Jr, Pruneda JM, Bourland PD, et al. Com-puter-aided mammographic screening for spiculated le-sions. Radiology 1994; 191:331–337.
36. Chan HP, Doi K, Vyborny CJ, et al. Improvements inradiologist’s detection of clustered microcalcifications onmammograms: the potential of computer-aided diagnosis.Invest Radiol 1990; 25:1102.
37. Roehrig J, Doi T, Hasegawa A, et al. Clinical results with R2imagechecker system. In: Karssemeijer N, et al, eds. Digitalmammography 1998. Dordrecht, the Netherlands: KluwerAcademic, 1998; 395.
38. Schmidt RA, Nishikawa RM, Osnis RB, et al. Computerizeddetection of lesions missed by mammography. In: Doi K,Giger ML, Nishikawa RM, Schmidt RA, eds. Digital mam-mography 96. Amsterdam, the Netherlands: Elsevier Sci-ence, 1997; 105.
39. Warren Burhenne LJ, Wood SA, D’Orsi CJ, et al. Potentialcontribution of computer-aided detection to the sensitivity ofscreening mammography. Radiology 2000; 215:554–562.
40. Birdwell RL, Ikeda DM, O’Shaughnessy KF, Sickles EA.Mammographic characteristics of 115 missed carcinomaslater detected with screening mammography and the poten-tial utility of computer-aided detection. Radiology 2001; 219:192–202.
41. te Brake GM, Karssemeijer N, Hendriks JH. Automated de-tection of breast carcinomas not detected in a screeningprogram. Radiology 1998; 207:465–471.
42. Freer TW, Ulissey MJ. Screening mammography withcomputer-aided detection: prospective study of 12,860patients in a community breast center. Radiology 2001;220:781–786.
43. Gur D, Sumkin JH, Rockette HE, et al. Changes in breastcancer detection and mammography recall rates after theintroduction of a computer-aided detection system. J NatlCancer Inst 2004; 96:185–190.
44. Feig SA. Clinical evaluation of computer-aided detectionin breast cancer screening. Semin Breast Dis 2002; 5:223–230.
45. Zheng B, Ganott MA, Britton CA, et al. Soft-copy mammo-graphic readings with different computer-assisted detectioncuing environments: preliminary findings. Radiology 2001;221:633–640.
46. Tabar L, Dean PB. Teaching atlas of mammography. NewYork, NY: George Thieme, 1983.
47. Ciccone G, Vineis P, Frigerio A, Segnan N. Inter-observerand intra-observer variability of mammogram interpretation:a field study. Eur J Cancer 1992; 28A:1054–1058.
48. Ackerman LV, Mucciardi AN, Gose EE, et al. Classificationof benign and malignant breast tumors on the basis of 36radiographic properties. Cancer 1973; 31:342–352.
49. Getty DJ, Pickett RM, D’Orsi CJ, Swets JA. Enhanced inter-pretation of diagnostic images. Invest Radiol 1988; 23:240–252.
50. Wu Y, Giger ML, Doi K, Vyborny CJ, Schmidt RA, Metz CE.Artificial neural networks in mammography: application todecision making in the diagnosis of breast cancer. Radiol-ogy 1993; 187:81–87.
51. Baker JA, Kornguth PJ, Lo JY, Williford ME, Floyd CE Jr.Breast cancer: prediction with artificial neural networkbased on BI-RADS standardized lexicon. Radiology 1995;196:817–822.
52. Ackerman LV, Gose EE. Breast lesion classification by com-puter and xeroradiography. Cancer 1972; 30:1025–1035.
53. Huo Z, Giger ML, Vyborny CJ, Wolverton DE, Schmidt RA,Doi K. Automated computerized classification of malignantand benign mass lesions on digitized mammograms. AcadRadiol 1998; 5:155–168.
54. Huo Z, Giger ML, Metz CE. Effect of dominant features onneural network performance in the classification of mammo-graphic lesions. Phys Med Biol 1999; 44:2579–2595.
55. Huo Z, Giger ML, Vyborny CJ, Wolverton DE, Metz CE.Computerized classification of benign and malignantmasses on digitized mammograms: a study of robustness.Acad Radiol 2000; 7:1077–1084.
56. Huo Z, Giger ML, Vyborny CJ. Computerized analysis ofmultiple-mammographic views: potential usefulness of spe-cial view mammograms in computer-aided diagnosis. IEEETrans Med Imaging 2001; 20:1285–1292.
57. Chan HP, Wei D, Helvie MA, et al. Computer-aided classifi-cation of mammographic masses and normal tissue: lineardiscriminant analysis in texture feature space. Phys MedBiol 1995; 40:857–876.
58. Chan HP, Sahiner B, Lam KL, et al. Computerized analysisof mammographic microcalcifications in morphological andtexture feature spaces. Med Phys 1998; 25:2007–2019.
59. Sahiner B, Chan HP, Petrick N, Helvie MA, Goodsitt MM.Design of a high-sensitivity classifier based on a genetic al-gorithm: application to computer-aided diagnosis. Phys MedBiol 1998; 43:2853–2871.
60. Patrick EA, Moskowitz M, Mansukhani VT, Gruenstein EI.Expert learning system network for diagnosis of breast cal-cifications. Invest Radiol 1991; 26:534–539.
61. Jiang Y, Nishikawa RM, Wolverton DE, et al. Malignant andbenign clustered microcalcifications: automated featureanalysis and classification. Radiology 1996; 198:671–678.

CA
D in
Diag
no
sis and
Mu
ltimo
dality Im
agin
g
217
62. Jiang Y, Nishikawa RM, Schmidt RA, Metz CE, Giger ML,Doi K. Improving breast cancer diagnosis with computer-aided diagnosis. Acad Radiol 1999; 6:22–33.
63. Jiang Y. Uncertainty in the output of artificial neural net-works. IEEE Trans Med Imaging 2003; 22:913–921.
64. Huo Z, Giger ML, Vyborny CJ, Metz CE. Breast cancer: ef-fectiveness of computer-aided diagnosis—observer studywith independent database of mammograms. Radiology2002; 224:560–568.
65. Chan HP, Sahiner B, Helvie MA, et al. Improvement of radi-ologists’ characterization of mammographic masses by us-ing computer-aided diagnosis: an ROC study. Radiology1999; 212:817–827.
66. Jiang Y, Nishikawa RM, Schmidt RA, Toledano AY, Doi K.Potential of computer-aided diagnosis to reduce variabilityin radiologists’ interpretations of mammograms depictingmicrocalcifications. Radiology 2001; 220:787–794.
67. Edwards DC, Lan L, Metz CE, Giger ML, Nishikawa RM.Estimating three-class ideal observer decision variables forcomputerized detection and classification of mammographicmass lesions. Med Phys 2004; 31:81–90.
68. Stavros AT, Thickman D, Rapp CL, Dennis MA, Parker SH,Sisney GA. Solid breast nodules: use of sonography to dis-tinguish between benign and malignant lesions. Radiology1995; 196:123–134.
69. Garra BS, Krasner BH, Horii SC, Ascher S, Mun SK, ZemanRK. Improving the distinction between benign and malig-nant breast lesions: the value of sonographic texture analy-sis. Ultrason Imaging 1993; 15:267–285.
70. Giger ML, Al-Hallaq H, Huo Z, et al. Computerized analysisof lesions in US images of the breast. Acad Radiol 1999;6:665–674.
71. Chen DR, Chang RF, Huang YL. Computer-aided diagnosisapplied to US of solid breast nodules by using neural net-works. Radiology 1999; 213:407–412.
72. Horsch K, Giger ML, Venta LA, Vyborny CJ. Automatic seg-mentation of breast lesions on ultrasound. Med Phys 2001;28:1652–1659.
73. Horsch K, Giger ML, Venta LA, Vyborny CJ. Computerizeddiagnosis of breast lesions on ultrasound. Med Phys 2002;29:157–164.
74. Sahiner B, Chan HP, Roubidoux MA, et al. Computerizedcharacterization of breast masses using three-dimensionalultrasound volumes. Med Phys 2004; 31:744–754.
75. Drukker K, Giger ML, Horsch K, Kupinski MA, Vyborny CJ,Mendelson EB. Computerized lesion detection on breast ul-trasound. Med Phys 2002; 29:1438–1446.
76. Horsch K, Giger ML, Vyborny CJ, Huo Z, Venta LA. Perfor-mance of computer-aided diagnosis in the interpretation of le-sions on breast sonography. Acad Radiol 2004; 11:272–280.
77. Drukker K, Edwards DC, Giger ML, Metz CE. Computerized3-way classification of lesions using breast ultrasound andmammography. In: Pisano E, ed. Proceedings of Interna-tional Workshop on Digital Mammography (in press).
78. Drukker K, Giger ML, Vyborny CJ, Mendelson E. Computer-ized detection and classification of cancer on breast ultra-sound. Acad Radiol 2004; 11:526–535.
79. Mussurakis S, Buckley DL, Coady AM, Turnbull LW, Horse-man A. Observer variability in the interpretation of contrast en-hanced MRI of the breast. Br J Radiol 1996; 69:1009–1016.
80. Nunes LW, Schnall MD, Orel SG, et al. Breast MR imaging:interpretation model. Radiology 1997; 202:833–841.
81. Penn AI, Bolinger L, Schnall MD, Loew MH. Discriminationof MR images of breast masses with fractal-interpolationfunction models. Acad Radiol 1999; 6:156–163.
82. Gilhuijs KG, Giger ML, Bick U. Automated analysis ofbreast lesions in three dimensions using dynamic magneticresonance imaging. Med Phys 1998; 25:1647–1654.
83. Gilhuijs KG, Giger ML, Bick U. Automated feature extractionand classification of breast lesions in magnetic resonanceimages. Proc SPIE 1998; 3338:294–300.
84. Chen W, Giger ML, Lan L, Bick U. Computerized interpreta-tion of breast MRI: investigation of enhancement-variancedynamics. Med Phys 2004; 31:1076–1082.
85. Wen HH, Giger ML, Horsch K, Hendrick RE, Vyborny CJ,Lan L. Correlation of lesions from multiple images for CAD.Proc SPIE Med Imaging 2004; 5370:93–96.
86. Swett HA, Miller PA. ICON: a computer-based approach todifferential diagnosis in radiology. Radiology 1987; 163:555–558.
87. Sklansky J, Tao EY, Ornes C, Disher AC. A visualizedmammographic database in computer-aided diagnosis. In:Doi K, MacMahon H, Giger ML, Hoffmann KR, eds. Com-puter-aided diagnosis in medical imaging. Amsterdam, theNetherlands: Elsevier, 1999; 215.
88. Giger ML, Huo Z, Lan L, Vyborny CJ. Intelligent searchworkstation for computer-aided diagnosis. In: Lemke HU,Vannier MW, Inamura K, et al, eds. CARS 2000: computerassisted radiology and surgery. Amsterdam, the Nether-lands: Excerpta Medica, 2000; 822–827.
89. Giger ML, Huo Z, Vyborny CJ, et al. Intelligent CAD work-station for breast imaging using similarity to known lesionsand multiple visual prompt aids. Proc SPIE Med Imaging2002; 4684:768–773.
90. Giger ML, Hui Z, Vyborny CJ, Lan L, Nishikawa RM,Rosenbourgh I. Results of an observer study with an intelli-gent mammographic workstation for CAD. In: Peitgen HO,ed. Digital mammography IWDM 2002. Berlin, Germany:Springer, 2003; 297–303.
91. Giger ML, Horsch KJ, Vyborny CJ, Lan L. Performance ofmultimodality CAD for breast cancer diagnosis (abstr). Ra-diology 2003; 229(P):216.
92. Giger ML, Karssemeijer N, Armato SG III. Computer-aideddiagnosis in medical imaging. IEEE Trans Med Imaging2001; 20:1205–1208.

NO
TES