
Computational Investigation of Flow Separation over Naca...
7
International Journal of Science, Technology and Society 2015; 3(6): 315-321 Published online January 4, 2016 (http://www.sciencepublishinggroup.com/j/ijsts) doi: 10.11648/j.ijsts.20150306.17 ISSN: 2330-7412 (Print); ISSN: 2330-7420 (Online) Computational Investigation of Flow Separation over Naca 23024 Airfoil at 6 Million Free Stream Reynolds Number B. S. Anil Kumar 1 , Ramalingaiah 2 , S. Manjunath 3 , Rudresh Ganganna 4 1 Department of Mechanical Engineering, BNMIT, Visveswaraya Technological University, Bangalore, India 2 Department of Mechanical Engineering, PESCE, Visveswaraya Technological University, Mandya, India 3 Department of Mathematics, BNMIT, Visveswaraya Technological University, Bangalore, India 4 Niharika Institute of Computational Engineering (NICECFD), Bangalore, India Email address: [email protected] (B. S. A. Kumar), [email protected] (Ramalingaiah), [email protected] (S. Manjunath), [email protected] (R. Ganganna) To cite this article: B. S. Anil Kumar, Ramalingaiah, S. Manjunath, Rudresh Ganganna. Computational Investigation of Flow Separation over Naca 23024 Airfoil at 6 Million Free Stream Reynolds Number. International Journal of Science, Technology and Society. Vol. 3, No. 6, 2015, pp. 315-321. doi: 10.11648/j.ijsts.20150306.17 Abstract: The following work is the CFD analysis of NACA 23024 airfoil. The analysis is carried out for a free stream Reynolds number of 6 million for which the wind tunnel results are available. The CFD analysis is carried out using Ansys Fluent Solver. The analysis is carried out using Spalart Allmaras turbulence model, K-omega SST turbulence model with flow transition capabilities, Standard K-Epsilon Turbulence model and K-omega SST turbulence model.It is to be noted that each turbulence model employs different mathematical approach to model boundary layer. The analysis results are then compared with the wind tunnel results and the performance of the turbulence models are discussed. This study recommends an accurate methodology to conduct CFD analysis for external aerodynamic flows. Keywords: NACA 23024, Turbulence Models, Lift Curve, Drag Curve, Stalling 1. Introduction The CFD analysis on the chosen airfoil NACA 23024, where first digit when multiplied by 3/2 yields the design lift coefficient in tenths of chord, the next two digits when divided by 2 gives the position of the camber in tenths of chord and the final two digits indicate the maximum thickness in percentage of chord that is NACA 23024 airfoil has maximum thickness of 24%, a design lift coefficient of (2 X 3/2) 3 in tenths and maximum camber located (30/2) 15% back from the leading edge is carried out using the ANSYS package. ICEM CFD is used as a meshing tool where a mesh required for the analysis of the airfoils are developed. The mesh s adjusted to obtain a y-plus close to 30 so that the best approximation is achieved. In operating conditions, the wing section that is the airfoil of the aeroplane moves through the wind. However, for simulation and experimental purposes the airfoil is kept stationary and the working fluid is assumed to have motion over the airfoil. Hence, a circular far field is created to obtain the best approximation. The actual solving of the problem is done using the Fluent package which is a part of the ANSYS package. The case is analysed as an incompressible low regime problem. In the physics setup, the atmospheric pressure is input as absolute pressure. There are no temperature inputs as it is an incompressible flow. The input boundary condition is the velocity inlet boundary condition and the output boundary condition is the outflow type boundary condition. A good convergence criteria is set to make the results more accurate. 2. Experimental Methods v/s CFD The traditional approach of product design involves the fabrication of physical prototype, conducting experimental test on the prototype and modifying the design till it meets the requirements. Unfortunately, the traditional approach is time consuming and it is difficult to build physical Prototypes during the early stages of the design. The construction and testing of many prototypes is often needed to meet a stringent design requirement. This can turn into an expensive process with the potential to delay the entire development cycle. Another problem is that although
Transcript of Computational Investigation of Flow Separation over Naca...

International Journal of Science, Technology and Society 2015; 3(6): 315-321
Published online January 4, 2016 (http://www.sciencepublishinggroup.com/j/ijsts)
doi: 10.11648/j.ijsts.20150306.17
ISSN: 2330-7412 (Print); ISSN: 2330-7420 (Online)
Computational Investigation of Flow Separation over Naca 23024 Airfoil at 6 Million Free Stream Reynolds Number
B. S. Anil Kumar1, Ramalingaiah
2, S. Manjunath
3, Rudresh Ganganna
4
1Department of Mechanical Engineering, BNMIT, Visveswaraya Technological University, Bangalore, India 2Department of Mechanical Engineering, PESCE, Visveswaraya Technological University, Mandya, India 3Department of Mathematics, BNMIT, Visveswaraya Technological University, Bangalore, India 4Niharika Institute of Computational Engineering (NICECFD), Bangalore, India
Email address: [email protected] (B. S. A. Kumar), [email protected] (Ramalingaiah), [email protected] (S. Manjunath),
[email protected] (R. Ganganna)
To cite this article: B. S. Anil Kumar, Ramalingaiah, S. Manjunath, Rudresh Ganganna. Computational Investigation of Flow Separation over Naca 23024 Airfoil
at 6 Million Free Stream Reynolds Number. International Journal of Science, Technology and Society. Vol. 3, No. 6, 2015, pp. 315-321.
doi: 10.11648/j.ijsts.20150306.17
Abstract: The following work is the CFD analysis of NACA 23024 airfoil. The analysis is carried out for a free stream
Reynolds number of 6 million for which the wind tunnel results are available. The CFD analysis is carried out using Ansys Fluent
Solver. The analysis is carried out using Spalart Allmaras turbulence model, K-omega SST turbulence model with flow transition
capabilities, Standard K-Epsilon Turbulence model and K-omega SST turbulence model.It is to be noted that each turbulence
model employs different mathematical approach to model boundary layer. The analysis results are then compared with the wind
tunnel results and the performance of the turbulence models are discussed. This study recommends an accurate methodology to
conduct CFD analysis for external aerodynamic flows.
Keywords: NACA 23024, Turbulence Models, Lift Curve, Drag Curve, Stalling
1. Introduction
The CFD analysis on the chosen airfoil NACA 23024,
where first digit when multiplied by 3/2 yields the design lift
coefficient in tenths of chord, the next two digits when divided
by 2 gives the position of the camber in tenths of chord and the
final two digits indicate the maximum thickness in percentage
of chord that is NACA 23024 airfoil has maximum thickness
of 24%, a design lift coefficient of (2 X 3/2) 3 in tenths and
maximum camber located (30/2) 15% back from the leading
edge is carried out using the ANSYS package. ICEM CFD is
used as a meshing tool where a mesh required for the analysis
of the airfoils are developed. The mesh s adjusted to obtain a
y-plus close to 30 so that the best approximation is achieved.
In operating conditions, the wing section that is the airfoil of
the aeroplane moves through the wind. However, for
simulation and experimental purposes the airfoil is kept
stationary and the working fluid is assumed to have motion
over the airfoil. Hence, a circular far field is created to obtain
the best approximation.
The actual solving of the problem is done using the Fluent
package which is a part of the ANSYS package. The case is
analysed as an incompressible low regime problem. In the
physics setup, the atmospheric pressure is input as absolute
pressure. There are no temperature inputs as it is an
incompressible flow. The input boundary condition is the
velocity inlet boundary condition and the output boundary
condition is the outflow type boundary condition. A good
convergence criteria is set to make the results more accurate.
2. Experimental Methods v/s CFD
The traditional approach of product design involves the
fabrication of physical prototype, conducting experimental
test on the prototype and modifying the design till it meets
the requirements. Unfortunately, the traditional approach is
time consuming and it is difficult to build physical
Prototypes during the early stages of the design. The
construction and testing of many prototypes is often needed
to meet a stringent design requirement. This can turn into an
expensive process with the potential to delay the entire
development cycle. Another problem is that although

316 B. S. Anil Kumar et al.: Computational Investigation of Flow Separation over Naca 23024 Airfoil
at 6 Million Free Stream Reynolds Number
building and testing of prototypes can yield accurate
performance measurements, it sheds little light on the
internal flow conditions that determine why the design does
or does not work. As a result, engineers obtain very little
information from each test and have to proceed mainly on
instinct. In order to address these issues, engineers have been
using computer simulations for a number of years to create
virtual prototypes of their concept designs and evaluate their design without the time and expense required for physical
prototyping. Computational fluid dynamics (CFD) software
allows users to build models that simulate the flow
conditions, making it possible to evaluate virtual prototypes
on a computer. Virtual prototyping can be performed at a
much lower cost and in much less time than physical
prototyping, and has the additional advantage that engineers
can determine important flow variables, such as velocity,
pressure, and temperature at any point in the design, making
it easier to optimize the design.
Experimental techniques provide the most reliable
information regarding flow characteristics and performance of
any system. It is quite valuable in validating mathematical solutions of the governing equations of flow. Accurate data
can be obtained by conducting full scale testing at actual
operating conditions provided the measuring equipment has
good precision and accuracy. But in large complex systems
like combustor and turbo machines of aero-engines, tunnel
size and the difficulty in adequately simulating the prototype
flow field, makes experimental fluid mechanics an
impracticable means of obtaining flow fields for many
problems. On the other hand the total expense associated with
CFD capability is considerably lower than that of a high
quality experimental facility.
3. Geometry Creation and Mesh
Generation
1. The coordinates of the airfoil is obtained and is
imported into ANSYS ICEM-CFD software, which is
essentially a meshing tool. The curves option is
checked while importing the points into CFD which
draws splines between the points for the upper and
lower surface.
2. The coordinates obtained are for an open trailing edge
type airfoil and therefore, the two end points have to
be joined using the curve option.
3. An exact circular far field is created around the airfoil
equidistant from its chord in all the four directions.
4. After the far field has been generated, blocking is done.
Blocking is essentially done to capture the shape of
the far field of the airfoil and further splitting of the
block is done to achieve the capturing of the airfoil
5. Once the splitting of the block is complete, point to
point association of the main block is done along with
the edge to curve association.
6. An O-grid is a tool which is available in the blocking
option itself. This is created around the airfoil in order
to obtain the mesh exactly in the shape of the airfoil
surface around it.
7. An O-grid creates a localized block in an O shape
around the airfoil. Edge to curve association is carried
out in order to associate the O-grid with the airfoil.
The link edge command is made use of to make the
lines of the 0-grid take the shape of the airfoil surface.
8. After all the associations are done, the pre-mesh
parameters are applied to the edges. The selection of
the meshing law and the number of nodes along with
the ratios and spacing options play the most important
part in the meshing process as they decide the quality
of the mesh around the airfoil.
9. It is desirable to have more grid elements near the
airfoil surface to increase computational accuracy and
to have comparatively lesser number of grid elements
away from the airfoil in the far field in order to reduce
computational time and reduce the size of the output
file. To achieve this requirement, the exponential 2
mesh law is used.
10. The y-plus is checked for after the meshing is
complete and modified if necessary through the
spacing option in the pre-mesh parameters.
11. After the entire mesh generation and obtaining a quality
mesh, it is converted to unstructured mesh to make it
possible to be read in Fluent. The file is saved in the
output option to obtain a file which is compatible with
Fluent. It is saved with the extension. msh.
Figure 1. NACA 23024 airfoil.

International Journal of Science, Technology and Society 2015; 3(6): 315-321 317
Figure 2. Mesh generation of NACA 23024 airfoil.
Figure 3. Mesh resolution in the boundary layer region.
Table 1. Comparison between CFD results vs. Wind tunnel test results.
CFD analysis results Wind tunnel test results
AOA CL CD AOA CL CD
0 0.11368 0.0096 0 0.1 0.0085
2 0.30205 0.0101 2 0.3 0.009
4 0.48780 0.0103 4 0.5 0.0095
6 0.67509 0.0126 6 0.7 0.011
8 0.87800 0.0139 8 0.9 0.012
10 1.02000 0.0148 10 1 0.013
12 1.16000 0.0169 12 1.18 0.015
13 1.16000 0.0186 14 1.3 0.016
14 1.12000 0.07169 16 1.15
15 1.10000 18 1.11
16 1.00000 20 1.05
17 0.96000 22 1
18 0.89000 24 0.98
19 0.84000
20 0.76000
The above table indicate the analysis carried out on NACA
23024 airfoil for a Reynolds number of 6 million using wind
tunnel test results and CFD. The wind tunnel results are
obtained from verified and published data. ( Theory of wing
section by Abott)
CFD analysis is carried out using Ansys package and CL
and CD values are directly obtained by the post processor. The
airfoil is tested at 00 to 20
0 angle of attack (AOA) and the plot
of CL V/S AOA and CD V/S AOA are obtained
It is clear from above two tables that the CFD results are very good
agreement with the wind tunnel test data as a result of superior mesh
quality.
4. CFD Analysis in FLUENT Software
1. The ANSYS fluent is opened and the option is set to
2D and double precision.
2. Import the mesh by selecting read mesh option. Scale
the mesh to the suitable unit. The check command
may be used to check for the quality of the mesh.
3. Fluent software used not only for aerodynamic studies
but also used in heat transfer problems, acoustic
problems etc. therefore, it is important to select the
correct set of equation for the required analysis.
4. After the turbulence model is selected for the analysis,
air is selected as the material and the corresponding
material properties are input and saved.
5. For the cell zone boundary condition, the far field is
selected to be a fluid and the material properties which
were previously input are associated with the far field
cell zones.
6. Input of the boundary condition is the most important
part in the physics setup. Since it is an incompressible
flow, the input boundary condition is the velocity type
boundary condition where the magnitude of the free
stream velocity is directly input. The outlet boundary
condition is the outflow type boundary condition as
the airfoil functions in atmosphere and there is no
external pressurization.
7. The far field is set to the pressure far field boundary
condition where the pressure is input as the
atmospheric pressure at the location.
8. The solution method is set to simple. The monitors are
activated by selecting the coefficient of lift,
coefficient of drag.
9. The solution initialization is done by setting it to
hybrid initialization and the residual monitors are
edited to have convergence criteria to obtain more
accurate results.
10. The run calculation command is selected and 2000
iterations are allowed. The calculation is run and it
terminates automatically depending on the input
convergence criteria or it may be manually interrupted
in case the coefficient of lift and coefficient of drag
become constant all the remaining iterations.
11. The required plots such as the Cp plot and required
contours such as pressure and velocity vectors are
obtained as the post processor results.
5. Results and Discussions
Figure 4 and 5 shows the lift and drag coefficients
respectively for 6 million Reynolds number, plotted along

318 B. S. Anil Kumar et al.: Computational Investigation of Flow Separation over Naca 23024 Airfoil
at 6 Million Free Stream Reynolds Number
with wind tunnel results.
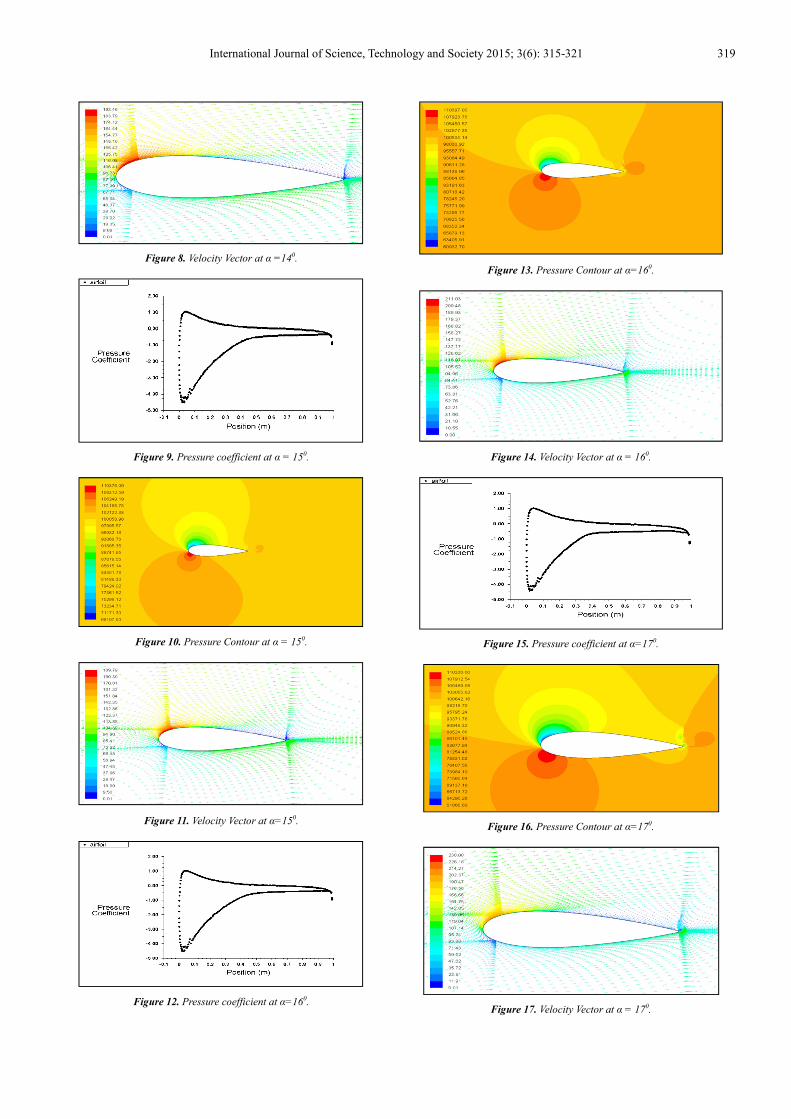
Figure 9 shows the pressure coefficient plot for angle of
attack 15 degree with Spalart allmaras turbulence model.
Stalling is clearly seen.
Spalart allmaras turbulence model does not employ any
approximations in the boundary layer region. The boundary
layer region need to be resolved with very fine layer of mesh
elements (10 to 15 layers). All the three regions of the
turbulent boundary layer will be actually captured on the fine
mesh near the wall, which is more realistic.
Figure 4. Lift curve.
Figure 5. Drag curve.
Figure 6. Pressure coefficient at α=140.
Figure 7. Pressure Contour at α=140.
International Journal of Science, Technology and Society 2015; 3(6): 315-321 319
Figure 8. Velocity Vector at α =140.
Figure 9. Pressure coefficient at α = 150.
Figure 10. Pressure Contour at α = 150.
Figure 11. Velocity Vector at α=150.
Figure 12. Pressure coefficient at α=160.
Figure 13. Pressure Contour at α=160.
Figure 14. Velocity Vector at α = 160.
Figure 15. Pressure coefficient at α=170.
Figure 16. Pressure Contour at α=170.
Figure 17. Velocity Vector at α = 170.

320 B. S. Anil Kumar et al.: Computational Investigation of Flow Separation over Naca 23024 Airfoil
at 6 Million Free Stream Reynolds Number
Figure 18. Pressure coefficient at α=180.
Figure 19. Pressure Contour at α=180.
Figure 20. Velocity Vector at α=180.
6. Conclusions
� All turbulence models yield similar results in the pre stall
region and the CFD analysis results are providing a good
match with wind tunnel test results.
� In the post stall region approximation of boundary layer
regions with wall functions as in the case of K-epsilon
turbulence model with standard wall functions, leads to
delayed prediction of stalling and hence lift forces are
over approximated.
� Capturing of all the three regions of the turbulent
boundary layer with a very fine mesh layers will provide
accurate CFD analysis results and trend same as that of
wind tunnel test results.
� Prediction of both laminar and turbulent boundary layer
regions with transition turbulence model provides most
accurate CFD analysis results, and these results are very
close to wind tunnel measurements.
Acknowledgements
Authors would like to express sincere gratitude to “Niharika
Institute of Computational Engineering (NICECFD),
Bangalore. (www.nicecfd.com) for all the technical guidance
and licensed version of ANSYS ICEMCFD meshing software
and ANSYS FLUENT CFD analysis software
References
[1] David Hartwanger et.al “3 D modeling of a Wind Turbine using CFD” NAFEMS Conference, United Kingdom, 2008.
[2] Frank Bertagnolio et.al “Wind Turbine airfoil catalogue” RISOE National Laboratories, Denmark, 2001.
[3] H. Gao et.al “Computational study of unsteady flows around dragonfly and smooth airfoils at low Reynolds number” 46th AIAA Aerospace sciences meeting and exhibit, Reno, Navada, 2008.
[4] Vance Dippold, III, “Investigation of Wall Function and Turbulence Model Performance within the Wind Code”, 43rd AIAA Aerospace Sciences Meeting and Exhibit, 10 - 13 January 2005, Reno, Nevada.
[5] S. Sarada, M. Shiva Shankar and Rudresh Ganganna “Numerical simulation of Viscous, incompressible flow around NACA 64618 subsonic airfoil using Computational Fluid Dynamics”, Proceedings of National conference on advances in Mechanical Engineering, Allied Publishers Pvt Ltd, 2012.
[6] Menter, F. R., “Two-Equation Eddy-Viscosity Turbulence Models for Engineering Applications” AIAA Journal, Vol. 32, No. 8, August 1994, pp. 1598-1605 (http://turbmodels.larc.nasa.gov/sst.html).
[7] Abbott. I.H, “Theory of wing section, including a summary of airfoil data”, Dover book on Physics, 1995.
[8] Menter FR, 1994, Two Equation Eddy-viscosity turbulence model for Engineering Applications, AIAA journal, USA, Volume 32, No.8, pp. 1598-1605.
[9] Drishtysingh Ramdenee, H. Ibrahim, N. Barka, A. Ilinca, 2013, Modeling of aerodynamic flutter on a naca 4412 airfoil wind blade, International Journal of Simulation and Process Modelling, Inderscience Publishers, Canada, Volume 8, No. 1 , pp. 79-87.
[10] Douvi C. Eleni, Tsavalos I. Athanasios and Margaris P. Dionissios, Evaluation of the turbulence models for the simulation of the flow over a National Advisory Committee for Aeronautics (NACA) 0012 airfoil, Department of Mechanical Laboratory, University of Patras, 26500 Patras, Greece, Journal of Mechanical Engineering Research Vol 4(3), pp. 100-111, March 2012 ISSN 2141-2383.
[11] Bacha WA, Ghaly WS (2006). Drag Prediction in Transitional Flow over Two-Dimensional Airfoils, Proceedings of the 44th AIAA Aerospace Sciences Meeting and Exhibit, Reno, NV.
[12] Menter FR (1994). Two-Equation Eddy-Viscosity Turbulence Models for Engineering Applications. AIAA J., 32: 1598-1605.
[13] Spalart, PR, Allmaras SR (1992). A One-Equation Turbulence Model for Aerodynamic Flows. AIAA Paper, pp. 92-439.

International Journal of Science, Technology and Society 2015; 3(6): 315-321 321
[14] Michealamitay, Douglas R Smith, Valdis Kibens, David E. Parekh and Ali Glezer. “Aerodynamic flow control over unconventional airfoil using synthetic jet actuators”. AIAA journal. V39, no1, march 2001.
[15] Gaurav Saxena, Mahendra Agarwal. “Aerodynamic analysis of NACA 4412 airfoil using CFD”. International journal of emerging trends in engineering and development. Issue 3, vol 4, july 2013.


