Computational Crowd Camera: Enabling Remote-Vision via ...
63
Computational Crowd Camera: Enabling Remote-Vision via Sparse Collective Plenoptic Sampling A by Aydin Arpa Submitted to the Program in Media Arts and Sciences, School of Architecture and Planning in partial fulfillment of the requirements for the degree of Master of Science in Media Arts and Sciences MASSACHUSETTS INST E OF TECHNOLOGY JUL 19 2013 LIBRARIES at the MASSACHUSETTS INSTITUTE OF TECHNOLOGY June 2013 @ 2013, DLF Aydin Arpa, All rights reserved. The author hereby grants to MIT and The Charles Stark Draper Laboratory, Inc. permission to reproduce and to distribute publicly paper and electronic copies of this thesis document in whole or in any part medium now known or hereafter created. A uthor .......................................... ... . .... ...... Program in Media Arts and Sciences n ~-%May lp,,2013 Certified by ............. Ceifiedbh Ramesh Raskar Associate Professor of Media Arts and Sciences yf Thepis Supervisor .Y -* **1 . . . . Accepted by ...... ..................... Robin M. A. Dawson Principal Member of Technical Staff, Draper Laboratory hesis Supervisor ... . . . . . . . . . . . . .. . . Patricia Maes Associate Academic Head Program in Media Arts and Sciences
Transcript of Computational Crowd Camera: Enabling Remote-Vision via ...
Computational Crowd Camera: Enabling Remote-Vision
via Sparse Collective Plenoptic Sampling A
byAydin Arpa
Submitted to the Program in Media Arts and Sciences,School of Architecture and Planning
in partial fulfillment of the requirements for the degree of
Master of Science in Media Arts and Sciences
MASSACHUSETTS INST EOF TECHNOLOGY
JUL 19 2013
LIBRARIES
at the
MASSACHUSETTS INSTITUTE OF TECHNOLOGY
June 2013@ 2013, DLF Aydin Arpa, All rights reserved.
The author hereby grants to MIT and The Charles Stark Draper Laboratory,Inc. permission to reproduce and to distribute publicly paper and electroniccopies of this thesis document in whole or in any part medium now known
or hereafter created.
A uthor .......................................... ... . .... ......Program in Media Arts and Sciences
n ~-%May lp,,2013
Certified by .............
Ceifiedbh
Ramesh RaskarAssociate Professor of Media Arts and Sciences
yf Thepis Supervisor
.Y -* **1. . . .
Accepted by ......
.....................
Robin M. A. DawsonPrincipal Member of Technical Staff, Draper Laboratory
hesis Supervisor
. . . . .. . . . . . . . . . .. . .Patricia Maes
Associate Academic HeadProgram in Media Arts and Sciences

2

Computational Crowd Camera: Enabling Remote-Vision via Sparse
Collective Plenoptic Sampling
by
Aydin Arpa
Submitted to the Program in Media Arts and Sciences,School of Architecture and Planning
on May 10, 2013, in partial fulfillment of therequirements for the degree of
Master of Science in Media Arts and Sciences
Abstract
In this thesis, I present a near real-time algorithm for interactively exploring a collectivelycaptured moment without explicit 3D reconstruction. This system favors immediacy andlocal coherency to global consistency. It is common to represent photos as vertices of a
weighted graph, where edge weights measure similarity or distance between pairs of pho-tos. I introduce Angled Graphs as a new data structure to organize collections of photos in a
way that enables the construction of visually smooth paths. Weighted angled graphs extendweighted graphs with angles and angle weights which penalize turning along paths. As a
result, locally straight paths can be computed by specifying a photo and a direction. The
weighted angled graphs of photos used in this paper can be regarded as the result of dis-cretizing the Riemannian geometry of the high dimensional manifold of all possible photos.Ultimately, this system enables everyday people to take advantage of each others' perspec-tives in order to create on-the-spot spatiotemporal visual experiences similar to the popularbullet-time sequence. I believe that this type of application will greatly enhance sharedhuman experiences spanning from events as personal as parents watching their children'sfootball game to highly publicized red carpet galas. In addition, security applications can
greatly benefit from such a system by quickly making sense of a large collection of visualdata.
Thesis Supervisor: Ramesh RaskarTitle: Associate Professor of Media Arts and Sciences
Thesis Supervisor: Robin M. A. DawsonTitle: Principal Member of Technical Staff, Draper Laboratory
3

4

Computational Crowd Camera: Enabling Remote-Vision via Sparse
Collective Plenoptic Sampling
by
Aydin Arpa
The following people served as readers for this thesis:
Thesis Reader .....................
Thesis Reader...........
......-... aPatricia Maes
Professor of Media TechnologyProgram in Media Arts and Sciences
.. ... .......-...... . . . . . . - - - - -Sep Kamvar
Associate Professor of Media Arts and SciencesProgram in Media Arts and Sciences
5

6

Acknowledgments
Many people have contributed to this work. Their help, critique, understanding, and friend-
ship were invaluable in shaping this thesis and the thoughts that precipitated it. Therefore,
I would like to acknowledge:
First and foremost, my advisor Ramesh Raskar, for giving me the opportunity to work
in his group, and suggesting me to work on this problem.
Besides my advisor, I would like to thank the rest of my thesis committee: Pattie Maes,
Sep Kamvar, for their encouragement, insightful comments, and hard questions.
A special thanks to J.P. Laine, Robin Dawson, and Draper Labs for providing me sup-
port during my program.
Marc Pollefeys and Gabriel Taubin, for sharing their deep insights and thoughts and
for providing constructive criticism about my work.
Rahul Sukhtankar and Antonio Torralba, for sharing their expertise in computer vi-
sion and its applications.
Luca Ballan and Otkrist Gupta, for their friendship and support; for our stimulating
brain storming sessions.
Halil Kiper, Yadid Ayzenberg, Chunglin Wen, Hayato Ikoma, Kshitij Marwah, Pe-
ter Skvarenina, Tom Cuypers and Caroline Cochran-DeWitte for helping in various
parts of the system.
Linda Peterson, for working her magic and taking care of us through all administrative
matters.
7

My friends and colleagues at the Media Lab, a community of incredible people.
My parents, Kizim and Mfirvet Arpa, for providing constant source of emotional sup-
port.
My girlfriend, Sophia Powe, for always being my pillar, my joy and my guiding light.
Thank you!
8

Contents
1 Introduction
1.1 C ontributions . . . . . . . . . . . . . . . . . . . . . . . . . . . . . . . . .
2 Related Work
2.1 Large Collections of Images: . . . . . . . . . . . . . . . . . . . . . . . . .
2.2 Computing Shortest Paths: . . . . . . . . . . . . . . . . . . . . . . . . . .
2.3 Organizing Images: . . . . . . . . . . . . . . . . . . . . . . . . . . . . . .
3 Algorithm Overview
4 Coarse Spatiotemporal Sorting
5 Efficiently Finding Neighbours with Visual Dictionaries
6 Weighted Angled Graph
6.1 Angles as Navigation Parameters . . . . . . . . . . .
6.2 Computing Global Smoothest Paths . . . . . . . . .
6.3 Defining Image-Space Distance & Angle Measures .
6.4 Defining The Angle Weights S . . . . . . . . . . . .
6.5 Preventing Cycles . . . . . . . . . . . . . . . . . . .
31
. . . . . . . . . 32
. . . . . . . . . 33
. . . . . . . . . 35
. . . . . . . . . 36
. . . . . . . . . 37
7 Semi-Automatic View Stabilization and Collaborative Segmentation
8 Implementation
8.1 Overall Architecture . . .. . . . . . . . . . . . . . . . . . . . . . . . .
9
15
17
19
19
20
20
23
25
29
39
41
41
8.2 Mobile Framework . . . . . . ... ... ....... . . . . . . . . . . . .. 41
8.3 Server Architecture . . . . . . ... . . . .. .. . . . . . . . . . . . . . . 42
8.4 N avigation . . . . . . . . . . . . . . . . . . . . . . . . . . . . . . . . . . . 43
8.5 View Interpolation . . . . . . .. .. . . . .. .. . . . . . .. . . . . . .. 44
9 Results 45
9.1 Time Performance. . . . . . . . . . . . . . . . . . . . . . . . . . . . . . . 48
9.2 Comparison to prior approaches . . . . . . . . . . . . . . . . . . . . . . . 48
10 Conclusions 51
10.1 Lim itations . . . . . . . . . . . . . . . . . . . . . . . . . . . . . . . . . . 52
10.2 Future W ork . . . . . . . . . . . . . . . . . . . . . . . . . . . . . . . . . . 52
A Details on the Angle Weights S 55
B Publications and Presentations 57
C Supplementary Media 59
10

List of Figures
1-1 Imagine you are at a concert or sports event and, along with the rest of the
crowd, you are taking photos (a). Thanks to other spectators, you poten-
tially have all possible perspectives available to you via your smart phone
(b). Now, almost instantly, you have access to a very unique spatiotemporal
experience (c) . . . . . . . . . . . . . . . . . . . . . . . . . . . . . . . . . 15
2-1 Comparing leading alternatives to CrowdCam in terms of major features. . 21
3-1 A set of input images (I) are converted to a set of SIFT features (F). In case
of a large number of the images, a visual dictionary (D) is employed to
represent every image via a high dimensional vector (C). Nearest Neigh-
bours (NN) are found for each image, and sparse feature flow (FF) vectors
are extracted. If there is a object of interest, and few users have manually
entered its region, this input is used to stabilize (S) the views. A graph
(G) is generated where nodes are images and edges represent distances. In
this graph, angles are present but only on triplets. The graph (G) is then
projected to a dual graph (G*), where edges have both distance and angle
costs. Then given the desired Navigation (N) mode from user, the system
creates the smoothest path (P), and generates a rendering (R). Please note
that boxes with * on the top right corner are optional. . . . . . . . . . . . . 24
4-1 GUI showing photos that are within specified spatio-temporal distance. . . . 25
11

4-2 GPS information can be quite unreliable. Below is a depiction of GPS loca-
tion and orientation of all photo positions and orientations taken around the
Alchemist sculpture( http://web.mit.edu/newsoffice/2010/plensa-installed.html
) in MIT. Ideally points should correspond to a full circle. . . . . . . . . . . 26
4-3 Same as Figure 4-2, but this time, position information is overwritten using
only orientation and centre of rotation information. Although this is much
more improved than previous state, some of the positions are swapped due
to noisy orientation output from the sensors. . . . . . . . . . . . . . . . . . 27
5-1 Sample graph showing view similarities based on visual dictionaries. You
see 6 photos taken in different perspectives, and on each edge, you see a
distance measure. Notice that the largest distance is between nodes 2 and
5, since these are the end points of the arc formed by the spectator positions. 30
6-1 The angled graph is converted to a weighted graph in order to simplify the
computation of the global shortest path. . . . . . . . . . . . . . . . . . . . 33
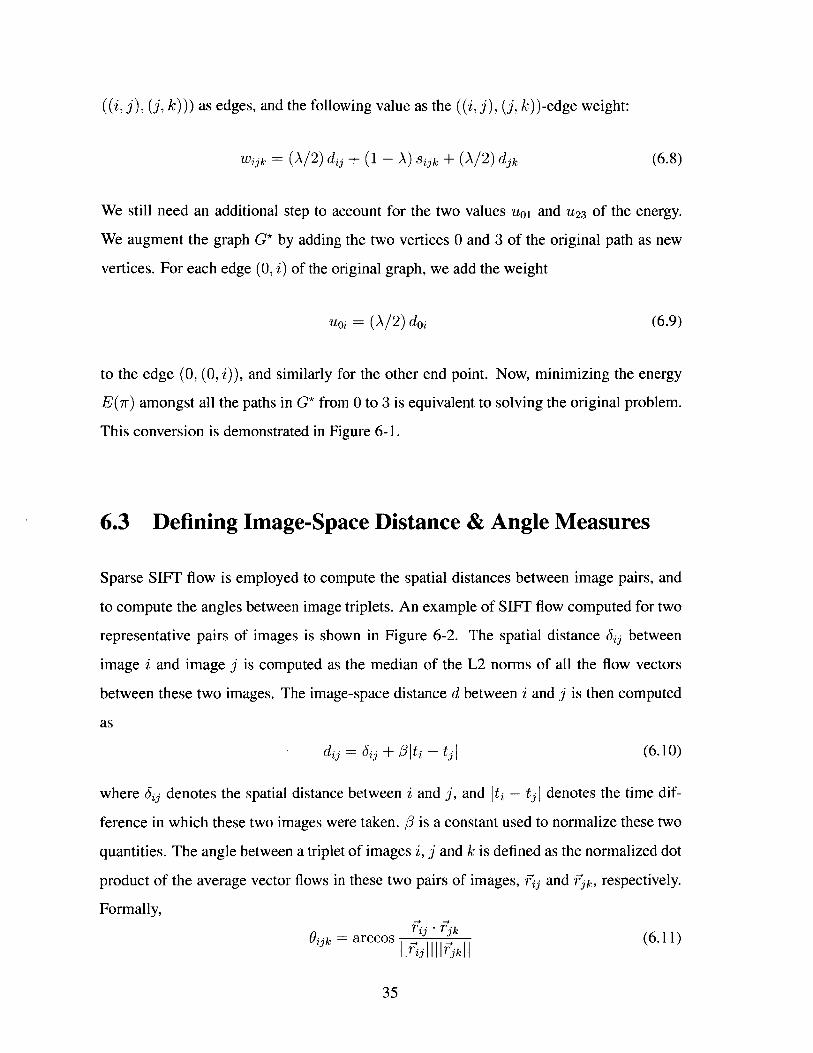
6-2 (Top) Three neigbouring images A, B and C. (Middle) Feature flows com-
puted between the images A, B and C after being stabilized with respect to
the object of interest in the scene (the person with blue T-shirt). (Bottom)
Zoom of the image AB. . . . . . . . . . . . . . . . . . . . . . . . . . . . . 36
7-1 (Left) User indicates the object of interest by drawing a stroke on it. (Right)
Showing perfect segmentation of object of interest in a different perspective
via feature propogation and graph cut techniques. . . . . . . . . . . . . . . 40
8-1 High level diagram showcasing information flow, and platform agnostic
architecture. Sensor information, such as geolocation, orientation, time,
context and visual data is sent to cloud framework and shared amongst
participating devices. . . . . . . . . . . . . . . . . . . . . . . . . . . . . . 42
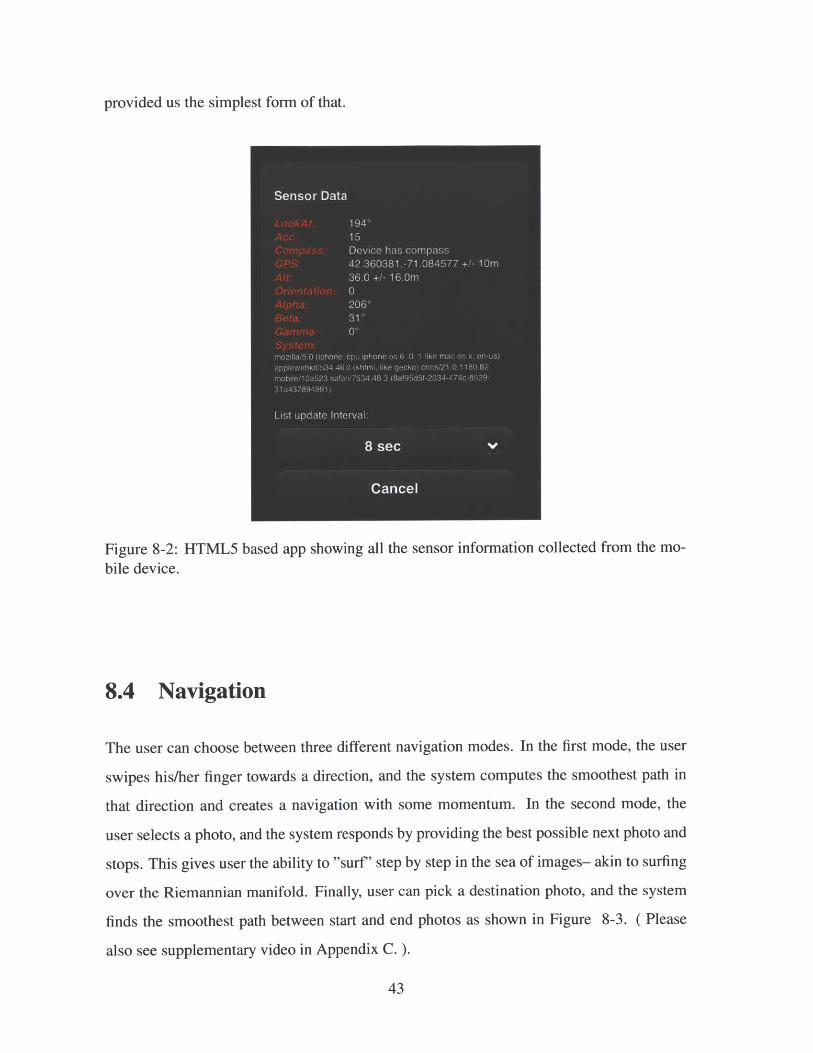
8-2 HTML5 based app showing all the sensor information collected from the
m obile device. . . . . . . . . . . . . . . . . . . . . . . . . . . . . . . . . 43
12

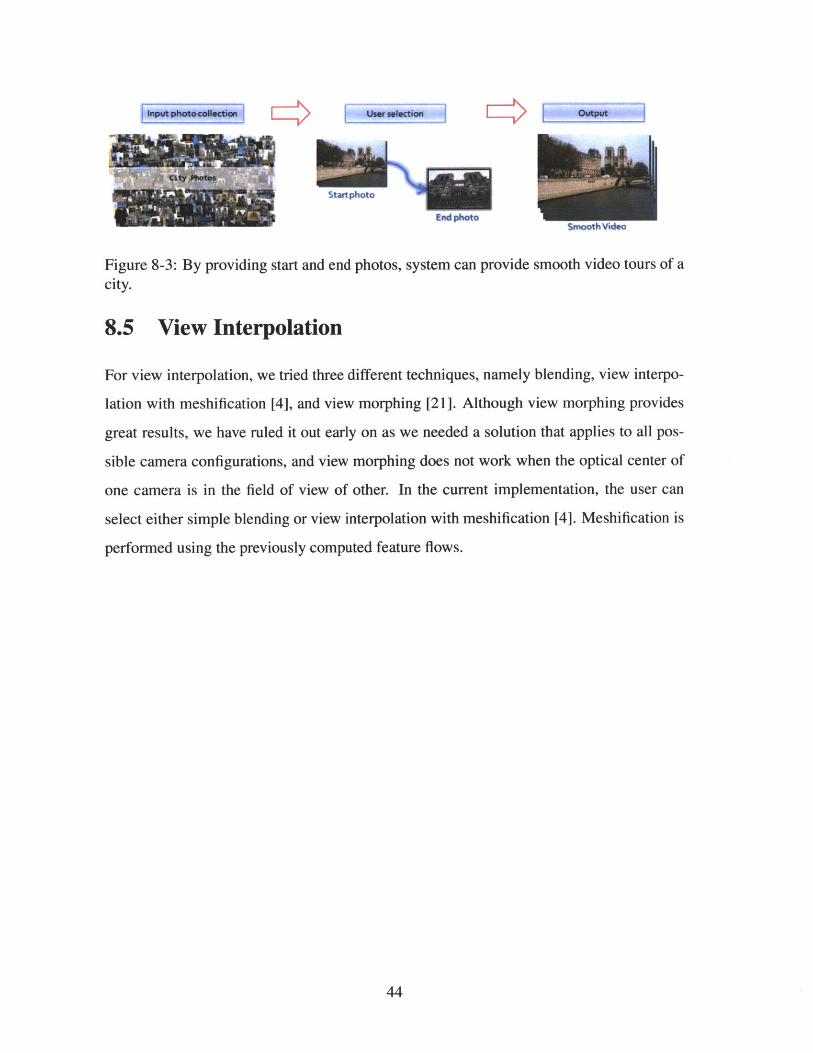
8-3 By providing start and end photos, system can provide smooth video tours
of a city. . . . . . . . . . . . . . . . . . . . . . . . . . . . . . . . . . .. 44
9-1 (Left) Four neighbouring images. (Right) Same images stabilized in scale
and position with respect to the object of interest in the scene (red rectan-
gles). . . . . . . . . . . . . . . . . . . . . . . . . . . . . . . . . . . . . . 46
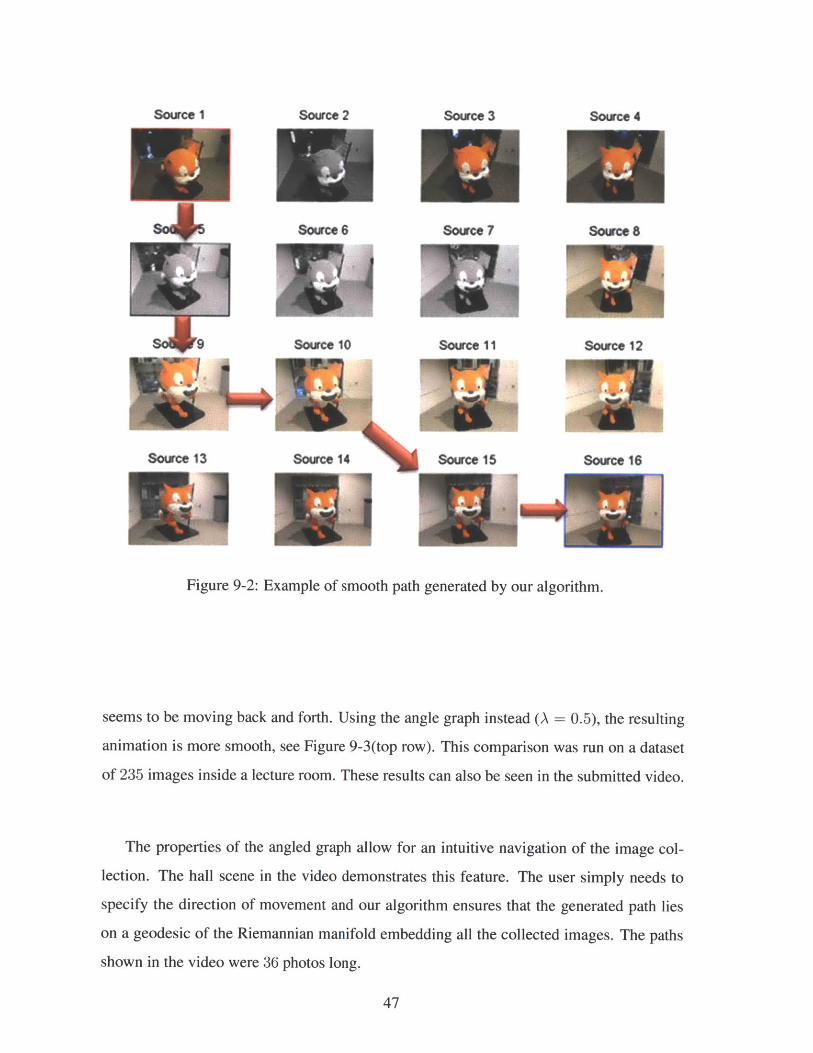
9-2 Example of smooth path generated by our algorithm. . . . . . . . . . . . . 47
9-3 (Top row) Transition obtained using our approach. (Bottom row) Transition
obtained using a simpler approach accounting only for image similarities
w ithout angles. . . . . . . . . . . . . . . . . . . . . . . . . . . . . . . . . 48
A- I The curve 7 is subdivided into Bezier curved segments -Y1, each related to a
triplet of type (ii1, il, i,+1 ) .. . . . . . . . . . . . . . . . . . . . . . . . . . 56
13

14

Chapter 1
Introduction
All of us like going to public events to see our favourite stars in action, our favourite sports
team playing or our beloved singer performing. Attending these events in first person at
the stadium, or at the concert venue, provides a great experience which is not comparable
to watching the same event on television.
While television typically provides the best viewpoint available to see each moment
of the event (decided by a director), when experiencing the event in first person at the
stadium, the viewpoint of the observer is restricted to the seat assigned by the ticket, or
his/her visibility is constrained by the crowds gathered all around the performer, trying to
get a better view of the event.
Figure 1-1: Imagine you are at a concert or sports event and, along with the rest of thecrowd, you are taking photos (a). Thanks to other spectators, you potentially have allpossible perspectives available to you via your smart phone (b). Now, almost instantly, youhave access to a very unique spatiotemporal experience (c).
15

In this work, we describe a solution to this problem by providing the user with the
possibility of using his/her cellphone or tablet to navigate specific salient moments of an
event right after they happened, generating bullet time experiences of these moments, or
interactive visual tours. To do so, we exploit the known fact that, important moments of an
event are densely photographed by its audience using mobile devices. All of these photos
are collected on a centralized server, which sorts them spatiotemporally, and sends back
results for a pleasant navigation on mobile devices (See Figure 1-1).
To promote immediacy, and interactivity, our system needs to provide a robust, lightweight
solution to the organization of all the visual data collected at a specific moment in time.
Today's tools that address spatiotemporal organization mostly start with a Structure From
Motion (SFM) operation [14], and largely assumes accurate camera poses. However this
assumption becomes an overkill when immediacy and experience is more important than
the accuracy on these estimations. Furthermore, SFM is a computationally heavy operation,
and does not work in a number of scenarios including non-Lambertian environments.
Our solution instead focuses on immediacy and local coherency, as opposed to the
global consistency provided by full 3D reconstruction. We propose to exploit sparse fea-
ture flows in-between neighbouring images, and create graphs of photos using distances
and angles. Specifically, we build Weighted Angled Graphs on these images, where edge
weights describe similarity between pairs of images, and angle weights penalize turning
on angles while traversing paths in the subjacent graph. In scenarios where the number of
images is large, computational complexity of finding neighbours is reduced by employing
visual dictionaries. If the event of interest has a focal object, we let the users enter this re-
gion of interest via simple gestures. Afterwards, we propagate features from user provided
regions to all nodes in the graph, and stabilize all flows that has the target object. In order
to globally calculate optimum smoothest paths, we project our graph to a dual space where
triplets become pairs, and angle costs are projected to edge costs and therefore can simply
be calculated via shortest path algorithms.
16

1.1 Contributions
In this work, my contributions are as follows:
" Novel way to collaboratively capture and interactively generate spatiotemporal expe-
riences of events using mobile devices
" Novel way to organize captured images on an Angled Graph by exploiting the intrin-
sic Riemannian structure
" A way to compute the geodesics and the globally smoothest paths in an angled graph
" An optional object based view stabilization via collaborative segmentation
17

18
Chapter 2
Related Work
2.1 Large Collections of Images
There is an ever-increasing number of images on the internet, as well as research pur-
suing storage [7] and uses for these images. However, in contrast with exploring online
collections, we focus on transient events where the images are shared in time and space.
Photo Tourism [24] uses online image collections in combination with structure from mo-
tion and planar proxies to generate an intuitively and browsable image collection. We
instead do not aim at reconstructing any structure, shape, or geometry of the scene. All
the processing is image based. [23, 22, 19] achieved smooth navigation between distant
images by extracting paths through the camera poses estimated on the scene. Similar tech-
niques were used to create tourist maps [10], photo tours [14], and interactive exploration
of videos [2, 26]. Along with the same line of research, we also present, in this work, how
to navigate between the images. In contrast to prior work however, we do not require ex-
pensive pre-processing steps for scene reconstruction. The relationship between images is
calculated in near-real time. Other works using large image collections to solve computer
vision problems include scene recognition [20, 27] and image completion [12].
19

2.2 Computing Shortest Paths
Finding the shortest path between two points in a continuous curved space is a global
problem which can be solved by writing the equation for the length of a parameterized
curve over a fixed one dimensional interval, and then minimizing this length using the
calculus of variations.
Computing a shortest path connecting two different vertices of a weighted graph is a
well studied problem in graph theory which can be regarded as the discrete analog of this
global continuous optimization problem.
A shortest path is a path between the two given vertices such that the sum of of the
weights of its constituent edges is minimized. In a finite graph a shortest path always
exists, but it may not be unique.
A classical example is finding the quickest way to get from one location to another on
a road map, where the vertices represent locations, and the edges represent segments of
roads weighted by the time needed to travel them.
Many algorithms have been proposed to find shortest paths. The best known algo-
rithms for solving this problem are: Dijkstra's algorithm [8], which solves the single-pair,
single-source, and single-destination shortest path problems; the A* search algorithm [11],
which solves for single pair shortest path using heuristics to try to speed up the search;
Floyd-Warshall algorithm [9], which solves for all pairs shortest paths; and Johnson's al-
gorithm [13], which solves all pairs shortest paths, and may be faster than Floyd-Warshall
on sparse graphs.
2.3 Organizing Images
Existing techniques use similarity-based methods to cluster digital photos by time and im-
age content [5], or other available image metadata [28, 17]. For image based matching,
several features have been proposed in literature, namely, KLT [25], SIFT [15], GIST [18]
and SURF [3]. Each of these features have its own advantages and disadvantages with re-
spect to speed and robustness. In our method, we propose to use SIFT features, extracted
20

from each tile of the image, and to individually quantized them using a codebook in order
to generate a bag-of-words representation [6].
Collaborative Mobile Real-time RobustPhoto Tourism [24]
Photo Synthbad on Phto Tourism X
[24]Unstructured VBR [2] X
VideoScapes [26] X XPhoto Tours [14] X X
CrowdCam X X X X
Figure 2-1: Comparing leading alternatives to CrowdCam in terms of major features.
21


Chapter 3
Algorithm Overview
Our approach starts with users taking photos on their mobile devices using our web-app.
As soon these photos are taken, they are uploaded to a central server along with metadata
consisting of time and location, if available. Afterwards, applying a coarse spatiotempo-
ral filtering using this metadata provides us the initial "event" cluster to work on. Event
clusters are sets of images taken at similar time and location (Section 4).
Sparse feature flows within neighbouring images are then estimated. For large event
clusters, computational complexity of calculating feature flow for each pair of images is
drastically reduced by employing visual dictionaries (Section 5).
The computed feature flows are then used to build a Weighted Angled Graph on these
images (Section 6). Each acquired image is represented as a node in this graph. Edge
weights describe similarity or distance between pairs of photos, and angle weights penalize
turning on angles while traversing paths in the subjacent graph.
Once a user swipes his finger towards a direction, the system computes the smoothest
path in that direction and starts the navigation. This results in a bullet time experience of
the captured moment. Alternatively user can pick a destination photo, and the system finds
the smoothest path in between.
The algorithm ensures that the generated paths lie on a geodesic of the Riemannian
manifold of the collected images. This geodesic is uniquely identified by the initial photo
(taken by the user) and the finger swiping direction. To this end, Section 6.2 introduces
the novel concept of straightness and of minimal curvature in this space (Section 6.4), and
23
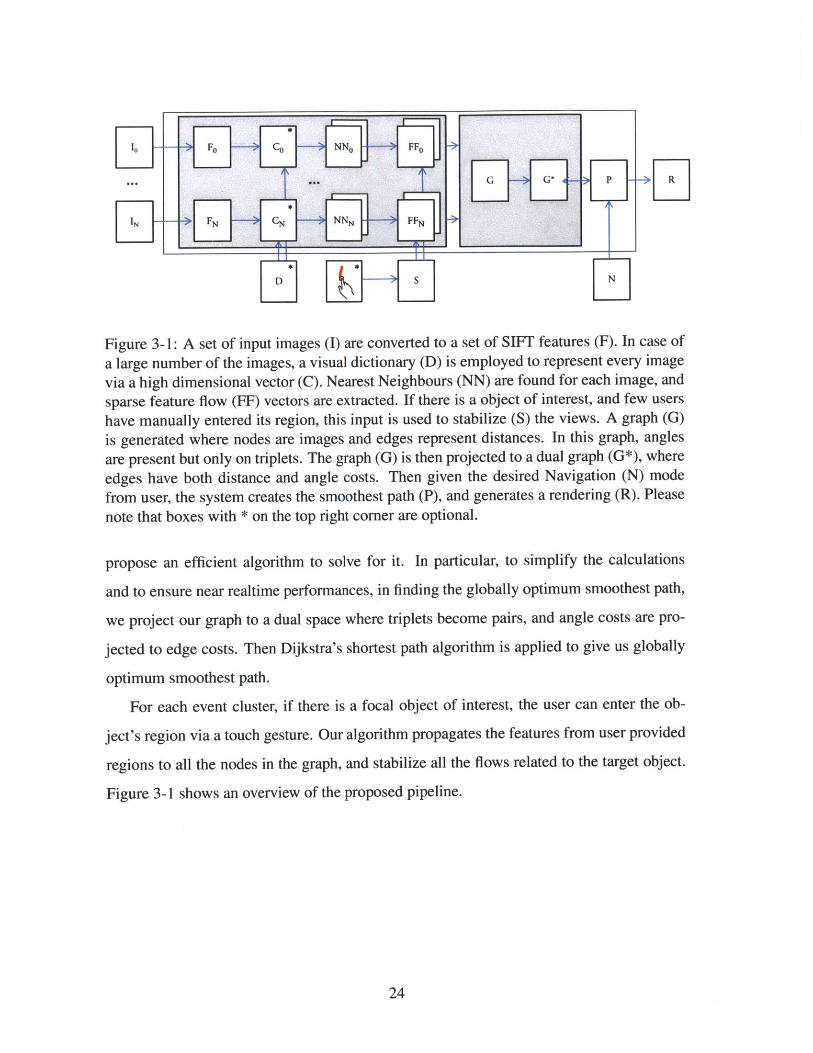
Figure 3-1: A set of input images (I) are converted to a set of SIFT features (F). In case of
a large number of the images, a visual dictionary (D) is employed to represent every imagevia a high dimensional vector (C). Nearest Neighbours (NN) are found for each image, andsparse feature flow (FF) vectors are extracted. If there is a object of interest, and few users
have manually entered its region, this input is used to stabilize (S) the views. A graph (G)is generated where nodes are images and edges represent distances. In this graph, anglesare present but only on triplets. The graph (G) is then projected to a dual graph (G*), where
edges have both distance and angle costs. Then given the desired Navigation (N) modefrom user, the system creates the smoothest path (P), and generates a rendering (R). Please
note that boxes with * on the top right corner are optional.
propose an efficient algorithm to solve for it. In particular, to simplify the calculations
and to ensure near realtime performances, in finding the globally optimum smoothest path,
we project our graph to a dual space where triplets become pairs, and angle costs are pro-
jected to edge costs. Then Dijkstra's shortest path algorithm is applied to give us globally
optimum smoothest path.
For each event cluster, if there is a focal object of interest, the user can enter the ob-
ject's region via a touch gesture. Our algorithm propagates the features from user provided
regions to all the nodes in the graph, and stabilize all the flows related to the target object.
Figure 3-1 shows an overview of the proposed pipeline.
24

Chapter 4
Coarse Spatiotemporal Sorting
Photos are uploaded continuously to the server, as soon as they are taken. The server
performs an initial clustering of these images based on the location and time information
stored in the image metadata. Depending on the event, and the type of desired experi-
ence, users can interactively select the spatiotemporal window within which to perform the
navigation, as in Figure 4-1. For instance, for a concert and a sports event, users might
prefer large spatial windows whereas, for a street performance, small spatial windows are
preferred. Concerning the time dimension, this can go between 1 or 2 seconds for very
fast events, to 10 seconds in case of almost static scenarios or very slow events, like an
Figure 4-1: GUI showing photos that are within specified spatio-temporal distance.
25
< CloudCarn
Share the Momnent- Take a Photo

orchestra performance.
In terms of temporal resolution, cellphone time is quite accurate thanks to indirect sync-
ing of its internal clock to the atomic clocks installed in satellites and elsewhere. However,
spatial information provided by sensors needs extra care as it is too coarse to be used in
smooth visual navigation ( See Figure 4-2 and Figure 4-3. ). Its accuracy drastically de-
creases in case of indoor events. In order to attain better spatial resolution, we exploit sparse
feature flows in between neighbouring photos, as described in the following sections.
Figure 4-2: GPS information can be quite unreliable. Below is a depiction of GPS
location and orientation of all photo positions and orientations taken around the Al-
chemist sculpture( http://web.mit.edu/newsoffice/201 0/plensa-installed.html ) in MIT. Ide-
ally points should correspond to a full circle.
26

Figure 4-3: Same as Figure 4-2, but this time, position information is overwritten using
only orientation and centre of rotation information. Although this is much more improvedthan previous state, some of the positions are swapped due to noisy orientation output fromthe sensors.
27

28

Chapter 5
Efficiently Finding Neighbours with
Visual Dictionaries
The graph generated from a collection of images is fully connected. However, the set of
edges utilized by desirable traversals of such a graph is a small subset. Intuitively, this is
because given a particular image, the set of next images is restricted to those that are similar
in space and time. Thus, we can generate a sparse graph composed of the same nodes,
whose edges connect only similar images as in Figure 5-1. Computing the angled graph
representation on the latter graph enables us to find the optimal traversal but at significantly
reduced computational complexity.
Naively, the computational complexity of calculating the feature flow for each pair of
images would be O(N 2 ), and therefore posits infeasible when the number N of photos in
the cluster is large. In these cases, we reduce the computational complexity by employing
a visual dictionary [6], and near-neighbor search algorithms [16]. By doing this, we reduce
the complexity to O(KN) where K is the number of neighbours.
Dictionaries can be catered for specific venues, or specific events. They can be created
on the fly, or can be re-utilized per location. For instance, in a fixed environment like a bas-
ketball stadium, it is really advisable to create a dictionary for the environment beforehand
and cache it for that specific location. For places where the environment is unknown, and
the number of participants is large, it is advisable that a dictionary is created on the fly at
the very beginning of the event, and shared by all. For the samples we used, our rule of
29
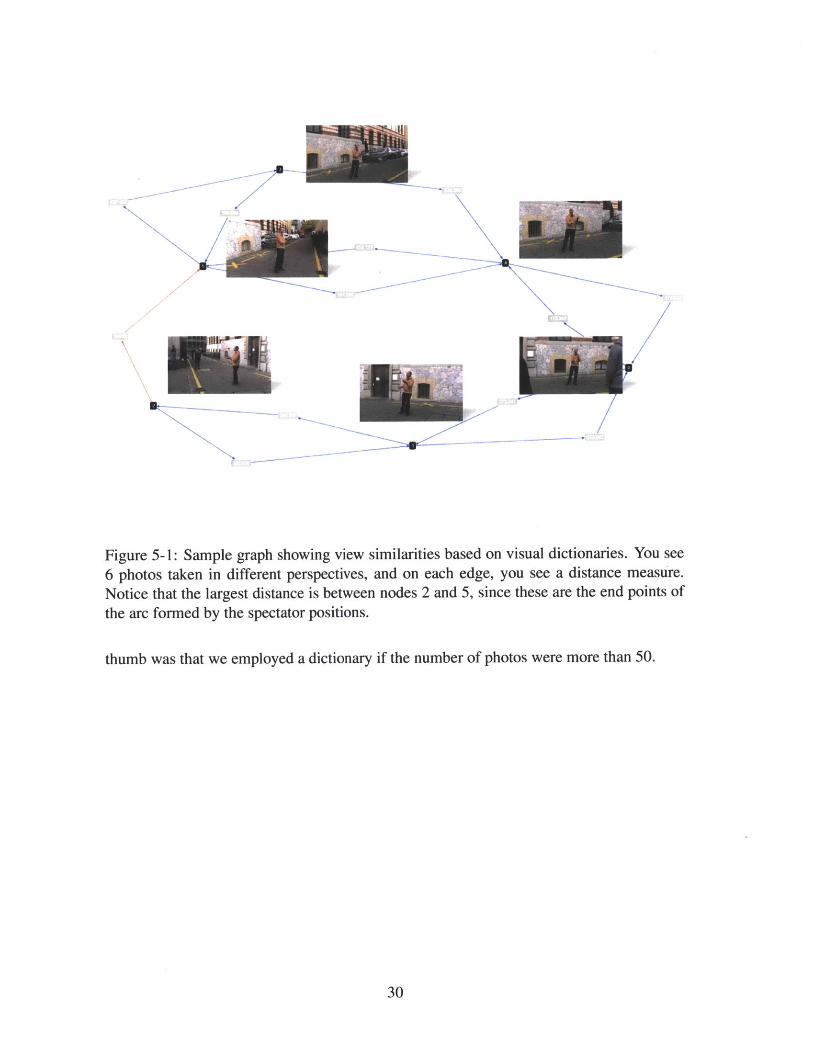
Figure 5-1: Sample graph showing view similarities based on visual dictionaries. You see
6 photos taken in different perspectives, and on each edge, you see a distance measure.Notice that the largest distance is between nodes 2 and 5, since these are the end points ofthe arc formed by the spectator positions.
thumb was that we employed a dictionary if the number of photos were more than 50.
30

Chapter 6
Weighted Angled Graph
In mathematics a geodesic is a generalization of the notion of a straight line to curved
spaces. In the presence of a Riemannian metric, geodesics are defined to be locally the
shortest path between points in the space. In Riemannian geometry geodesics are not the
same as shortest curves between two points, though the two concepts are closely related.
The main difference is that geodesics are only locally the shortest path between points. The
local existence and uniqueness theorem for geodesics states that geodesics on a smooth
manifold with an affine connection exist, and are unique. More precisely, but in simple
terms, for any point p in a Riemannian manifold, and for every direction vector VY away
from p (V' is a tangent vector to the manifold at p) there exists a unique geodesic that passes
through p in the direction of V'.
A weighted graph can be regarded as a discrete sampling of a Riemannian space. The
vertices correspond to point samples in the Riemannian space, and the edge weights to some
of the pairwise distances between samples. However, this discretization neither allows us
to define a discrete analog of the local geodesics with directional control, nor the notion
of straight line. Given two vertices of the graph connected by an edge, we would like to
construct the straightest path, i.e. the one that starts with the given two vertices in the given
order, and continues in the same direction with minimal turning.
To define a notion of straight path in a graph we augment a weighted graph with angles
and angle weights. An angle of a graph is a pair of edges with a common vertex, i.e., a
path of length 2. Angle weights are non-negative numbers which penalizes turning along
31

the corresponding angle.
Graph angles are related to the intuitive notion of angle between two vectors defined by
an inner product. This definition extends the relation between edges and edge weights in a
natural way to angles and angle weights. In a Riemannian space, using the inner product
derived from the Riemannian metric, the angle a between two local geodesics passing
through a point p with directions defined by tangent vectors & and W' is well defined. In
fact, the cosine of the angle (0 < a < 7r) is defined by the expression
cos(a) = ,T K (6.1)
where (6, ') is the inner product of & and W' in the metric, and | denotes the length (L 2
norm) of the vector V'. Within this context, angle weights can be defined as a non-negative
function s(a) > 0 defined on the angles.
A graph G = (V, E) comprises a finite set of vertices V, and a finite set E of vertex
pairs (i, j) called edges. A weighted graph G = (V, E, D) is a graph with edge weights
D, an additional mapping D : E -+ R which assigns an edge weight dij > 0 to each edge
(i, j) E E. An Angled Graph G (V, E, A) is a graph augmented with a set of angles A.
Given a path (i, j, k), an angle is defined as the high dimensional rotation between edges
(i, j) and (j, k). Finally, a Weighted Angled Graph G = (V, E, D, A, S) is an weighted
graph augmented with a set of angles A and and angle weights S, a mapping S : A -+ R
which assigns an angle weight Sijk > 0 to each angle (i, J, k) E A. Since edges (j, i) and
(j, i) are considered identical, angles (i, j, k) and (k, j, i) are considered identical as well.
6.1 Angles as Navigation Parameters
We are more interested in minimizing the path energy one step at a time, i.e. within the
neighborhood of each vertex: if (i, j) is an edge, the vertex k in the first order neighborhood
of j which makes the path (i, j, k) straightest is the one that minimizes Sijk. The local
straightest path is the path with the lowest energy to the next node with respect to edge and
32

(a) Path ind23 weighted graph
(b) Path ind S123 d23 angled graph
(c) Convert angled
uw> graph to weighted~u 2 graph G*
012 2
Figure 6-1: The angled graph is converted to a weighted graph in order to simplify the
computation of the global shortest path.
angle weights. This energy is written as a linear combination of both measurements:
A dig + (1 - A) skij (6.2)
Where node k is the previous node in the path. The parameter A is chosen by the user, or
globally optimized, as described in the next section. Section 6.3 describes how to com-
pute the image-space distances dij, while Section 6.4 describes how to compute the angle
weights skij.
6.2 Computing Global Smoothest Paths
A path in a weighted graph cannot be regarded as parameterized by unit length because
the length of the edges vary. If traversed at unit speed, the edge lengths are proportional
to the time it would take to traverse them. Given a path 7r = (ii, i 2 , ... , iN) the following
33

expressions are the length of the path, and the lack of straightness
N-1 N-1
L(7r) = Z djisi K(7r) = sj,_11 . (6.3)1=0 1=1
Given a scalar weight 0 < A < 1, we consider the following path energy
E(7r) = A L(7r) + (1 - A) K(7r) . (6.4)
The problem is to find a minimizer for this energy, amongst all the paths of arbitrary length
which have the same endpoints (iO, iN). For A = 1 the angle weights are ignored, and the
problem reduces to finding a shortest path in the original weighted graph. But for 0 < A,
in principle it is not clear how the problem can be solved. We present a solution which
reduces to finding a shortest path in a derived weighted graph which depends on the pair
(i, iN). To simplify the notation it is sufficient to consider path (0, 1, 2, 3) of length three.
It will be obvious to the reader how to extend the formulation to paths of arbitrary length.
For a path of length three, the energy function is
E(7r) = A (do1 + d12 + d2 3 ) + (1 - A) (8012 + S123) (6.5)
Rearranging terms we can rewrite it as
E(7r) = U0 1 + w 012 + w 123 + U23 (6.6)
where
Uoi = (A/2) doi
W0i2 = (A/2) do1 + (1 - A) 8012 + (A/2) d1 2 (6.7)
Wi23 = (A/2) d 12 + (1 - A) 8123 + (A/2) d2 3
U23 = (A/2) d2 3
Now we create a weighted directed graph G* (more precisely G*(io, iN)) composed of
the edges (i, j) of G as vertices, the angles (i, j, k) of G (regarded as pairs of edges
34
((i, j), (j, k))) as edges, and the following value as the ((i, j), (j, k))-edge weight:
Wijk - (A/2) dij + (1 - A) Sijk + (A/2) dyk (6.8)
We still need an additional step to account for the two values uoi and u23 of the energy.
We augment the graph G* by adding the two vertices 0 and 3 of the original path as new
vertices. For each edge (0, i) of the original graph, we add the weight
o= (A/2) d (6.9)
to the edge (0, (0, i)), and similarly for the other end point. Now, minimizing the energy
E(7r) amongst all the paths in G* from 0 to 3 is equivalent to solving the original problem.
This conversion is demonstrated in Figure 6-1.
6.3 Defining Image-Space Distance & Angle Measures
Sparse SIFT flow is employed to compute the spatial distances between image pairs, and
to compute the angles between image triplets. An example of SIFT flow computed for two
representative pairs of images is shown in Figure 6-2. The spatial distance 6ij between
image i and image j is computed as the median of the L2 norms of all the flow vectors
between these two images. The image-space distance d between i and j is then computed
as
dig = 6i + /3ti - tj| (6.10)
where 6 ij denotes the spatial distance between i and j, and |tj - t| denotes the time dif-
ference in which these two images were taken. 3 is a constant used to normalize these two
quantities. The angle between a triplet of images i, j and k is defined as the normalized dot
product of the average vector flows in these two pairs of images, i and ifjk, respectively.
Formally,
Oijk = arCCOS 3 jkri|iJ|||j|kj
35
Figure 6-2: (Top) Three neigbouring images A, B and C. (Middle) Feature flows computedbetween the images A, B and C after being stabilized with respect to the object of interestin the scene (the person with blue T-shirt). (Bottom) Zoom of the image AB.
6.4 Defining The Angle Weights S
As introduced in Section 6 and Section 6.2, the angle weight function S : A -+ R needs to
provide an accurate notion of lack of straightness for each chosen triplet (i, j, k) in A, such
that the term K(7r) of Equation 3 represents the overall lack of straightness of the selected
path r. We formalize this concept as the total curvature of a smooth curve passing through
36

all the vertices of the path ir. Let -y denotes this curve, its total curvature is defined as
1I" (X) 2 dx. (6.12)
We define the curve -y to be a piecewise union of quadratic B6zier curves having as control
points the vertices it_ 1, i1 and i1 1, for each index 1 along the path 7r. Therefore, its total
curvature corresponds to the sum of all the total curvatures corresponding to each B6zier
curved segment, which, for a given triplet (i, JI k), corresponds to
Sijk = d2 + d3k + dijdjk COS (7F - Oijk) (6.13)
where Oijk is defined as in Equation 6.11. We therefore use Equation 6.13 to define the cost
of choosing a specific edge in the angle graph, Sijk. See Appendix A for the details on this
calculation.
6.5 Preventing Cycles
Since each edge of G corresponds to a vertex of G*, and each angle of G corresponds to
an edge in G*, if we consider all possible such angles, each vertex in the original graph
corresponds to a clique in G* composed of all the angles with the given vertex in the
middle. When consecutive edges for a candidate shortest path in G* are picked from the
same clique, such as (i, j, k) and (k, j, 1), the corresponding path in the original graph G
forms a cycle (i, j, k, j, 1). As a result the shortest path in G* may correspond to a path
in G with cycles. For example if the weights associated with angles (i, j, k), (k, j, 1), and
(i, j, 1) satisfy the following relation Wijk + WkjI < wisj, the total angle cost of traversing
path (i, j, k, j, 1) is lower than (i, jI 1). We can prohibit the angle weights to satisfy these
inequalities for every pair of angles which share an edge, but this is not sufficient to prevent
the problem, since longer cycles may nevertheless form. To prevent all cycles we need to
require the inequality Wijk + Whjl > wiji to hold for each tern of angles (i, j, k), (h, j, 1),
and (i, j, 1). However, for the target application it is appropriate to allow longer cycles, for
example to create infinite movies which visit a large number of images.
37

38

Chapter 7
Semi-Automatic View Stabilization and
Collaborative Segmentation
If a focal object is present, and view stabilization is desired, we exploit the possibility of an
optional collaborative labeling of the region of interest from the users. In fact, after taking
a photo, the user can choose to label the object of interest on the screen for the image just
taken. This information is sent to the central server also. This is an optional step, and it is
not mandatory. However, if a label is present, this allows the system to generate animations
stabilized with respect to the object of interest.
This is performed by propagating SIFT features from the selected regions to the other
nodes, where such information is not present. In cases where there are not enough SIFT
features, we rely on color distribution of the region. In case, multiple users label the object
of interest, this information is propagated in the graph, and fused with the information
collected from other users as well.
We observed that, in order to achieve the best visual quality results, a label has to be
entered at least every 60 degrees or in cases of zoomed levels above 100% in scale factor.
To increase the accuracy of the selected region, we employed graph cut techniques which
also greatly simplify user input by requiring only a simple stroke( See Figure 7-1).
After establishing the region of interest for the focal object, the photo is stabilized to
a canonical view where the object of interest is at the same position and have the same
size in all photos (see Figure 9-1). This is accomplished by applying an affine transform
39

Figure 7-1: (Left) User indicates the object of interest by drawing a stroke on it. (Right)Showing perfect segmentation of object of interest in a different perspective via featurepropogation and graph cut techniques.
to all images. This step effects all parameters down the stream, including feature flows,
distances, and angles (see Figure 3-1).
40

Chapter 8
Implementation
8.1 Overall Architecture
Our main philosophy in the design and architecture of this implementation was capture,
access and process anywhere. Secondly we wanted to apply our second principle of "write
once, deploy many". Therefore for client side we chose HTML5, and for servers, we used
LAMP(Linux, Apache, MySQL, PHP) architecture (See Figure 8-1).
8.2 Mobile Framework
With the use of HTML5, we had a web-app that would work in all major operating systems,
and also provide access to all sensor data required. We initially wanted to utilize the EXIF
data embedded in the image itself, which has all of this data already. However, we quickly
realized that the browser environment strips out this information just before uploading the
data due to potential privacy issues. Therefore we wrote ancillary modules to extract sensor
data explicitly and send this information along with the photo to the server (See Figure 8-2
). When this data is accessed explicitly, the user needs to give permission for this access,
therefore eliminates basic privacy concerns.
41

Figure 8-1: High level diagram showcasing information flow, and platform agnostic archi-tecture. Sensor information, such as geolocation, orientation, time, context and visual datais sent to cloud framework and shared amongst participating devices.
8.3 Server Architecture
LAMP utilizes Linux, Apache, MySQL and PHP software stack, and is a quite popular
choice for server architecture. When the sensor data is sent to the server, it creates a
database entry, and saves image files accordingly. Server can be queried for various tasks,
such as asking about photo uploads at a specific time and centered at specific latitude and
longitude with a radius of R. At the end, the server is designed to be a dynamic information
hub for sharing data, and not necessarily for processing. The reason for this choice is that
we wanted to be able to do processing anywhere, spanning from the least sophisticated mo-
bile platform to the most powerful cloud computing framework. All of these computation
platforms at the end need one thing, which is fast access to all data, and this architecture
42
provided us the simplest form of that.
Figure 8-2: HTML5 based app showing all the sensor information collected from the mo-bile device.
8.4 Navigation
The user can choose between three different navigation modes. In the first mode, the user
swipes his/her finger towards a direction, and the system computes the smoothest path in
that direction and creates a navigation with some momentum. In the second mode, the
user selects a photo, and the system responds by providing the best possible next photo and
stops. This gives user the ability to "surf" step by step in the sea of images- akin to surfing
over the Riemannian manifold. Finally, user can pick a destination photo, and the system
finds the smoothest path between start and end photos as shown in Figure 8-3. ( Please
also see supplementary video in Appendix C. ).
43
Sensor Data
8 secv
Cancel
Start photo
Enid photo Sot k-
Figure 8-3: By providing start and end photos, system can provide smooth video tours of acity.
8.5 View Interpolation
For view interpolation, we tried three different techniques, namely blending, view interpo-
lation with meshification [4], and view morphing [21]. Although view morphing provides
great results, we have ruled it out early on as we needed a solution that applies to all pos-
sible camera configurations, and view morphing does not work when the optical center of
one camera is in the field of view of other. In the current implementation, the user can
select either simple blending or view interpolation with meshification [4]. Meshification is
performed using the previously computed feature flows.
44

Chapter 9
Results
We evaluated our system on 18 real world scenarios spanning events like street perform-
ers, basketball games, and talks with a large audience. For each experiment, we asked few
people to capture specific moments during these events using their cellphones and tablets.
iPhones, iPads, and Nokia and Samsung phones were used for these experiments. The cap-
tured images were then uploaded to the central server which performed the spatiotemporal
ordering.
Figure 9-2 and Figure 9-3(top row), show two navigation paths computed using our
approach. The obtained results can be better appreciated in the supplementary video in
Appendix C. Here we will address, one by one, the different scenarios shown in the video.
In the indoor scenario, where a person was throwing a ball in the air, the moment
was captured using 7 cellphones. The time difference between the different shots was in
the order of half a second. Despite this temporal misalignment, the overall animation in
pleasant to experience. In this scene, the obtained graph was linear since the cameras were
recording all around the performer.
The basketball scenarios were captured from 16 different perspectives. In one of the
examples, three people were performing. The usage of the performer stabilization in this
case drastically increased the visual quality of the resulting animation, and made it more
pleasant to visualize. To prove this fact, we provide in the video a side by side comparison
between the results obtained using our algorithm with and without performer stabilization.
This can also be seen partially in Figure 9-1.
45

(original images) (stabilized images)
Figure 9-1: (Left) Four neighbouring images. (Right) Same images stabilized in scale andposition with respect to the object of interest in the scene (red rectangles).
In order to evaluate the effectiveness of our angled graph approach, we compared it with
a naive approach where only image similarities were considered, see Figure 9-3(bottom
row). This corresponds to setting A equals to 1 in Equation 4. The obtained result was quite
jagged. It is visible that for some frames (marked with red rectangles), the camera motion
46
Source 2 Source 3
So" Source 6 Source 7 Source 8
source 10 Source 11 Source 12
Source 13 Source 14 Source Is Source 16
Figure 9-2: Example of smooth path generated by our algorithm.
seems to be moving back and forth. Using the angle graph instead (A = 0.5), the resulting
animation is more smooth, see Figure 9-3(top row). This comparison was run on a dataset
of 235 images inside a lecture room. These results can also be seen in the submitted video.
The properties of the angled graph allow for an intuitive navigation of the image col-
lection. The hall scene in the video demonstrates this feature. The user simply needs to
specify the direction of movement and our algorithm ensures that the generated path lies
on a geodesic of the Riemannian manifold embedding all the collected images. The paths
shown in the video were 36 photos long.
47
Source 1 Source 4
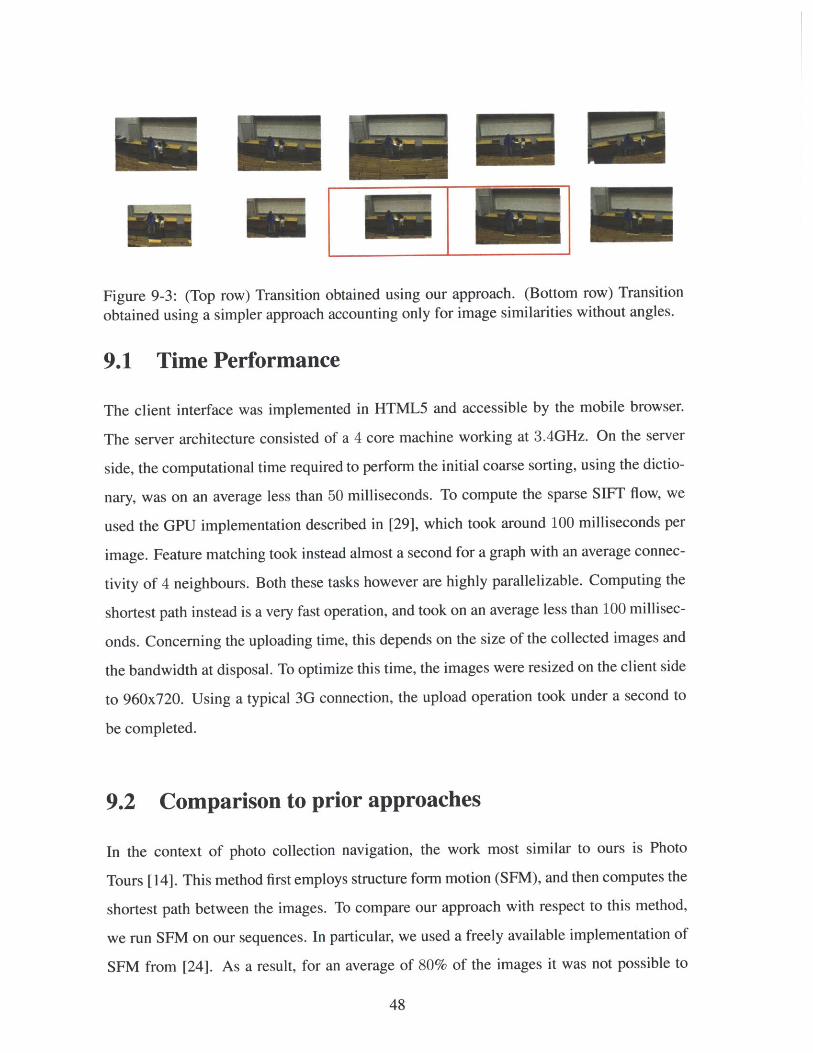
Figure 9-3: (Top row) Transition obtained using our approach. (Bottom row) Transition
obtained using a simpler approach accounting only for image similarities without angles.
9.1 Time Performance
The client interface was implemented in HTML5 and accessible by the mobile browser.
The server architecture consisted of a 4 core machine working at 3.4GHz. On the server
side, the computational time required to perform the initial coarse sorting, using the dictio-
nary, was on an average less than 50 milliseconds. To compute the sparse SIFT flow, we
used the GPU implementation described in [29], which took around 100 milliseconds per
image. Feature matching took instead almost a second for a graph with an average connec-
tivity of 4 neighbours. Both these tasks however are highly parallelizable. Computing the
shortest path instead is a very fast operation, and took on an average less than 100 millisec-
onds. Concerning the uploading time, this depends on the size of the collected images and
the bandwidth at disposal. To optimize this time, the images were resized on the client side
to 960x720. Using a typical 3G connection, the upload operation took under a second to
be completed.
9.2 Comparison to prior approaches
In the context of photo collection navigation, the work most similar to ours is Photo
Tours [14]. This method first employs structure form motion (SFM), and then computes the
shortest path between the images. To compare our approach with respect to this method,
we run SFM on our sequences. In particular, we used a freely available implementation of
SFM from [24]. As a result, for an average of 80% of the images it was not possible to
48

recover the pose, due to sparse imagery, lack of features, and/or reflections present in the
scene.
Compared to our approach, SFM is computationally heavier. As an example, the imple-
mentation provided by [I], used a cluster of 500 cores. The overall operation took about 5
minutes per image. In [14] instead, 1000 CPUs were used, and it took more than 2 minutes
per image.
Since our aim is to create smooth navigation in the image space, we do not need to
care about global consistency. This drastically simplifies the solution. In essence, we favor
visually smooth transitions and near-realtime results to global consistency.
49

50

Chapter 10
Conclusions
In this work, we presented a near real-time algorithm for interactively exploring a collec-
tively captured moment without explicit 3D reconstruction. Through our approach, we
are allowing users to visually navigate a salient moment of an event within seconds after
capturing it.
To enable this kind of navigation, we proposed to organize the collected images in
an angled graph representation reflecting the Riemannian structure of the collection. We
introduced the concept of geodesics for this graph, and we proposed a fast algorithm to
compute visually smooth paths exploiting sparse feature flows.
In contrast to past approaches, which heavily rely on structure from motion, our ap-
proach favors immediacy and local coherency as opposed to the global consistency pro-
vided by a full 3D reconstruction, making our approach more robust to challenging scenar-
ios (See Figure 2-1).
We proposed to exploit sparse feature flows and angled graph representation to find
geodesics in Reimannian manifolds, which correspond to visually smoothest paths in a
discrete photo collection of a salient moment.
Ultimately, our system enables everyday people to take advantage of each others' per-
spectives in order to create on-the-spot spatiotemporal visual experiences. We believe
that this type of application will greatly enhance shared human experiences spanning from
events as personal as parents watching their children's football game to highly publicized
red carpet galas.
51

10.1 Limitations
The list of current limitations of the CrowdCam system includes:
* When the quantity of input visual data is large, our system relies heavily on visual
dictionaries. Therefore, a geo-registered database of visual dictionaries would be
handy for large events that happen in similar surroundings( e.g. stadiums, concert
halls, theatres, etc.)
" System currently relies on time tags for temporal filtering, and its resolution limits
the quality of final experience. While some systems provide milisecond accuracy
using GPS or radio signals, others don't.
" For users to have meaningful results, there needs to be reasonably dense coverage
of an event. If coverage is too sparse, the experience will not be as satisfactory as it
could be.
10.2 Future Work
There are a few very exciting future directions for this work.
" Video: Our system can be extended to video, where key frames are processed,
and dynamically adjusted to users' real-time view, thereby enabling spatio-temporal
traversal from video to video.
" Time-Warp: For improved quality, scenes can be visually "time-warped". To achieve
this, scenes can first be targeted for a temporally desirable configuration, such as
monotonically increasing, decreasing or stable data-set. Then, image samples can be
segmented out to "super-pixels", and these can in turn be interpolated or extrapolated
for the desired temporal fit. (e.g. moving the player limbs and the ball to the expected
position in a sports action photo. )
" View Clustering: For photo tours, clustering views and creating canonical images
for potential popular destinations would be useful.
52

" Sound Synchronization: Since sound sampling is much higher than the frame rate
of a typical video, temporal precision of our system can be improved by applying
sound synchronization.
" Angled Graphs Theory: Expand on the theoretical foundations of angled graphs,
and explore additional applications of these concepts.
" Collaborative Object Recognition & AR: As users are selecting what they are in-
terested in, and the platform propogates this information around, our framework can
be utilized for collaborative object recognition, labelling, and augmented reality.
53

54

Appendix A
Details on the Angle Weights S
As described in the thesis, we formalized the concept of lack of straightness as the total
curvature of a smooth curve y passing through all the vertices of the selected path 7. We
also defined -y to be a piecewise continuous and differentiable union of quadratic Bezier
curves 73, for each index 1 along the path 7r.
Figure A- 1 shows how the curve 7 is subdivided into Bezier curved segments y;, each
related to a triplet of type (ij_1, i1 , ij+1). The three control points of 7y corresponds respec-
tively to the midpoint between il- 1 and il, the midpoint between il and i 11 , and the node
il. Let
1i 1 - (i1 - 1 + ii) (A.1)
2iz1= (i1+1 + i1) (A.2)
denotes these midpoints. By definition, the B6zier curve having il_ 1, ii, and i1+1 as control
points is
_Y1 (t = (1 - t) ((1 -- t) il- + t ii) + t ((1 - t) ii + t Z1+) (A.3)
and its total curvature is equal to
||7' (t)_ 2 dt = ||(z_1 - i1 ) + (i1+1 - i() 2 A.4)
= d2- +±d2, + d,_, 1 d1+1 1, cos (7r - 0) (A.5)
55

where 0 is the angle between the segment iiz and the segment i',izl, as described in
Figure A-1. The total curvature of -y is therefore
0/ |" (t) 2 dtN-1 i
= ||7"(t) 2 dt
N- +
[X d1
(A.6)
(A.7)+ di,_,idi,li, cos (7r
By defining the cost of selecting the triplet (ij_1, ii, i+1±) as
si,_1 ,1,,1, 1 = dl li + d?2+ 1+ d. -di, 1-, cos (- ) (A.8)
the cost K (7r) indicating the lack of straightness of 7 becomes equal to the total curvature
of -Y.
0
Figure A-1: The curve -y is subdivided into Bdzier curved segments 71, each related to atriplet of type (i1 _1, ii, i l+1).
56
-06)]

Appendix B
Publications and Presentations
Aydin Arpa, Luca Ballan, Gabriel Taubin, Rahul Sukthankar, Marc Pollefeys and Ramesh
Raskar,CrowdCam: Instantaneous Navigation of Crowd Images using Angled Graph,
IEEE 3DV, June 2013, Seattle, WA, USA
Aydin Arpa, Otkrist Gupta, Gabriel Taubin, Rahul Sukthankar, and Ramesh RaskarPersonal
to Shared Moments with Angled Graphs of Pictures, IEEE CVPR, Workshop for Com-
putational Cameras and Displays, June 2012, Providence, RI, USA
57

58

Appendix C
Supplementary Media
" IEEE 3DV Submission Video: http: //goo. gl/3P75G
" IEEE CVPR Poster: http: //goo. gl/SZkra
59

60

Bibliography
[1] Sameer Agarwal, Yasutaka Furukawa, Noah Snavely, Ian Simon, Brian Curless,Steven M. Seitz, and Richard Szeliski. Building rome in a day. Commun. ACM,54(10):105-112, 2011.
[2] Luca Ballan, Gabriel J. Brostow, Jens Puwein, and Marc Pollefeys. Unstructuredvideo-based rendering: Interactive exploration of casually captured videos. ACMTransactions on Graphics (Proceedings of SIGGRAPH), pages 1-11, July 2010.
[3] Herbert Bay, Andreas Ess, Tinne Tuytelaars, and Luc Van Gool. Speeded-up robustfeatures (SURF). Computer Vision and Image Understanding, 110(3):346-359, 2008.
[4] Shenchang Eric Chen and Lance Williams. View interpolation for image synthesis.In Proceedings of the 20th annual conference on Computer graphics and interactivetechniques, SIGGRAPH '93, pages 279-288, New York, NY, USA, 1993. ACM.
[5] Matthew Cooper, Jonathan Foote, Andreas Girgensohn, and Lynn Wilcox. Temporalevent clustering for digital photo collections. In ACM Multimedia, pages 364-373,2003.
[6] G. Csurka, C. Dance, L. Fan, J. Willamowski, and C. Bray. Visual categorizationwith bags of keypoints. In Proceedings of ECCV Workshop on Statistical Learning inComputer Vision, 2004.
[7] J. Deng, W. Dong, R. Socher, L.-J. Li, K. Li, and L. Fei-Fei. ImageNet: A large-scalehierarchical image database. In IEEE CVPR, 2009.
[8] Edsger W. Dijkstra. A note on two problems in connexion with graphs. NumerischeMathematik, 1:269-271, 1959.
[9] Robert W. Floyd. Algorithm 97: Shortest path. Commun. ACM, 5(6):345, 1962.
[10] Floraine Grabler, Maneesh Agrawala, Robert W. Sumner, and Mark Pauly. Automaticgeneration of tourist maps. In ACM SIGGRAPH, pages 1-11, 2008.
[11] P.E. Hart, N.J. Nilsson, and B. Raphael. A formal basis for the heuristic determinationof minimum cost paths. IEEE TSSC, 4(2):100 -107, 1968.
[12] James Hays and Alexei A Efros. Scene completion using millions of photographs.ACM Transactions on Graphics (SIGGRAPH), 26(3), 2007.
61

[13] Donald B. Johnson. Efficient algorithms for shortest paths in sparse networks. J.ACM, 24(l):1-13, 1977.
[14] Avanish Kushal, Ben Self, Yasutaka Furukawa, David Gallup, Carloz Hernandez,Brian Curless, and Steven M. Seitz. Photo tours. In 3DImPVT, 2012.
[15] D.G. Lowe. Object recognition from local scale-invariant features. In IEEE ICCV,1999.
[16] Marius Muja and David G. Lowe. Fast approximate nearest neighbors with automaticalgorithm configuration. In International Conference on Computer Vision Theory andApplication VISSAPP'09), pages 331-340. INSTICC Press, 2009.
[17] Mor Naaman, Yee Jiun Song, Andreas Paepcke, and Hector Garcia-Molina. Auto-matic organization for digital photographs with geographic coordinates. In JCDL,2004.
[18] Aude Oliva and Antonio Torralba. Modeling the shape of the scene: A holistic repre-sentation of the spatial envelope. IJCV, 42:145-175, 2001.
[19] Voicu Popescu, Paul Rosen, and Nicoletta Adamo-Villani. The graph camera. ACMSIGGRAPH ASIA, pages 1-8, 2009.
[20] Bryan C. Russell, Antonio Torralba, Kevin P. Murphy, and William T. Freeman. La-belme: A database and web-based tool for image annotation. IJCV, 77:157-173,2008.
[21] Steven M. Seitz and Charles R. Dyer. View morphing. In Proceedings of the 23rdannual conference on Computer graphics and interactive techniques, SIGGRAPH'96, pages 21-30, New York, NY, USA, 1996. ACM.
[22] J. Sivic, B. Kaneva, A. Torralba, S. Avidan, and W. Freeman. Creating and exploringa large photorealistic virtual space. In IEEE WIV, 2008.
[23] Noah Snavely, Rahul Garg, Steven M. Seitz, and Richard Szeliski. Finding pathsthrough the world's photos. ACM Trans. Graph., 27(3):1-11, 2008.
[24] Noah Snavely, Steven M. Seitz, and Richard Szeliski. Photo tourism: Exploring photocollections in 3d. In ACM SIGGRAPH, pages 835-846, 2006.
[25] Carlo Tomasi and Takeo Kanade. Detection and tracking of point features. TechnicalReport CMU-CS-91-132, Carnegie Mellon University, 1991.
[26] J. Tompkin, K.I. Kim, J. Kautz, and C. Theobalt. Videoscapes: Exploring sparse,unstructured video collections. In Proceedings of SIGGRAPH. ACM SIGGRAPH,2012.
[27] Antonio Torralba, Rob Fergus, and William T. Freeman. 80 million tiny images: Alarge data set for nonparametric object and scene recognition. IEEE PAMI, 2008.
62

[28] Kentaro Toyama, Ron Logan, and Asta Roseway. Geographic location tags on digitalimages. In MULTIMEDIA, pages 156-166, New York, NY, USA, 2003. ACM.
[29] Changchang Wu. SiftGPU: A GPU implementation of scale invariant feature trans-form (SIFT). http: //cs.unc .edu/-ccwu/sif tgpu, 2007.
63


![Enabling Crowd Sensing for Non-Expertsfaculty.washington.edu/lagesse/publications/crowdsensedemo.pdf · APISENSE [5] need programming experience to deploy a task. Medusa[4] needs](https://static.fdocuments.in/doc/165x107/5f8ede506f100140bd5ab501/enabling-crowd-sensing-for-non-apisense-5-need-programming-experience-to-deploy.jpg)