Comptes Rendus Biologies -...
16
Biological modelling/Biomode ´ lisation Dynalets: A new method for modelling and compressing biological signals. Applications to physiological and molecular signals Dynalets : une nouvelle me ´thode de mode ´lisation et compression de signaux biologiques. Applications aux signaux physiologiques et mole ´culaires Jacques Demongeot a, *, Olivier Hansen a , Ali Hamie a , Ce ´ line Franco a , Brian Sutton b , E ´ lie-Paul Cohen a,b a Universite ´ Joseph-Fourier, Grenoble, AGIM CNRS FRE 3405, Faculte ´ de me ´decine, 38700 La Tronche, France b King’s College, Strand, London WC2R 2LS, United Kingdom C. R. Biologies xxx (2014) xxx–xxx * Corresponding author. E-mail addresses: [email protected], [email protected] (J. Demongeot). A R T I C L E I N F O Article history: Received 16 June 2014 Accepted after revision 19 August 2014 Available online xxx Keywords: Fourier transform Dynalet transform Signal processing Heart and pulse signals compression Protein ‘‘stethoscope’’ Mots cle ´s : Transformation de Fourier Transformation Dynalet Traitement du signal Compression des signaux ECG et pouls « Ste ´ thoscope » prote ´ ique A B S T R A C T The biological information coming from electrophysiologic sensors like ECG, pulse sensor or from molecular signal devices like NMR spectrometry has to be visualized and manipulated in a compressed way for an efficient medical use by clinicians, if stored in scientific data bases or in personalized patient records repositories. Here, we define a new transform called Dynalet based on Lie ´ nard ordinary differential equations susceptible to model the mechanism at the source of the studied signal, and we propose to apply this new technique first to the modelling and compression of real biological periodic signals like ECG and pulse rhythm. We consider that the cardiovascular activity results from the summation of cellular oscillators located in the cardiac sinus node and we show that, as a result, the van der Pol oscillator (a particular Lie ´ nard system) fits well the ECG signal and the pulse signal. The reconstruction of the original signal (pulse or ECG) using Dynalet transform is then compared with that of Fourier, counting the number of parameters to be set for obtaining an expected signal-to-noise ratio. Then, we apply the Dynalet transform to the modelling and compression of molecular spectra obtained by protein NMR spectroscopy. The reconstruc- tion of the original signal (peak) using Dynalet transform is again compared with that of Fourier. After reconstructing visually the peak, we propose to periodize the signal and give it to hear, the whole process being called the protein ‘‘stethoscope’’. ß 2014 Acade ´ mie des sciences. Published by Elsevier Masson SAS. All rights reserved. R E ´ S U ME ´ L’information biologique provenant de capteurs e ´ lectrophysiologiques, comme l’ECG, les capteurs de pouls, ou d’appareils ge ´ ne ´ rant des signaux mole ´ culaires, comme la spectrome ´ trie de masse ou la spectrome ´ trie RMN, doit e ˆtre visualise ´e et manipule ´e sous une forme compresse ´ e, de manie ` re a ` optimiser son usage en me ´ decine clinique et n’en G Model CRASS3-3296; No. of Pages 16 Please cite this article in press as: J. Demongeot, et al., Dynalets: A new method for modelling and compressing biological signals. Applications to physiological and molecular signals, C. R. Biologies (2014), http://dx.doi.org/10.1016/ j.crvi.2014.08.005 Contents lists available at ScienceDirect Comptes Rendus Biologies ww w.s cien c edir ec t.c om http://dx.doi.org/10.1016/j.crvi.2014.08.005 1631-0691/ß 2014 Acade ´ mie des sciences. Published by Elsevier Masson SAS. All rights reserved.
Transcript of Comptes Rendus Biologies -...

Bio
Dybisig
Dy
sig
mo
JacBria Unb Kin
C. R. Biologies xxx (2014) xxx–xxx
*
A R
Artic
Rece
Acce
Avai
Keyw
Four
Dyn
Sign
Hea
Prot
Mot
Tran
Tran
Trai
Com
« Ste
G Model
CRASS3-3296; No. of Pages 16
Plbj.c
http
163
logical modelling/Biomodelisation
nalets: A new method for modelling and compressingological signals. Applications to physiological and molecularnals
nalets : une nouvelle methode de modelisation et compression de
naux biologiques. Applications aux signaux physiologiques et
leculaires
ques Demongeot a,*, Olivier Hansen a, Ali Hamie a, Celine Franco a,an Sutton b, Elie-Paul Cohen a,b
iversite Joseph-Fourier, Grenoble, AGIM CNRS FRE 3405, Faculte de medecine, 38700 La Tronche, France
g’s College, Strand, London WC2R 2LS, United Kingdom
Corresponding author.
E-mail addresses: [email protected], [email protected] (J. Demongeot).
T I C L E I N F O
le history:
ived 16 June 2014
pted after revision 19 August 2014
lable online xxx
ords:
ier transform
alet transform
al processing
rt and pulse signals compression
ein ‘‘stethoscope’’
s cles :
sformation de Fourier
sformation Dynalet
tement du signal
pression des signaux ECG et pouls´ thoscope » proteique
A B S T R A C T
The biological information coming from electrophysiologic sensors like ECG, pulse sensor or
from molecular signal devices like NMR spectrometry has to be visualized and manipulated
in a compressed way for an efficient medical use by clinicians, if stored in scientific data
bases or in personalized patient records repositories. Here, we define a new transform called
Dynalet based on Lienard ordinary differential equations susceptible to model the
mechanism at the source of the studied signal, and we propose to apply this new technique
first to the modelling and compression of real biological periodic signals like ECG and pulse
rhythm. We consider that the cardiovascular activity results from the summation of cellular
oscillators located in the cardiac sinus node and we show that, as a result, the van der Pol
oscillator (a particular Lienard system) fits well the ECG signal and the pulse signal. The
reconstruction of the original signal (pulse or ECG) using Dynalet transform is then compared
with that of Fourier, counting the number of parameters to be set for obtaining an expected
signal-to-noise ratio. Then, we apply the Dynalet transform to the modelling and
compression of molecular spectra obtained by protein NMR spectroscopy. The reconstruc-
tion of the original signal (peak) using Dynalet transform is again compared with that of
Fourier. After reconstructing visually the peak, we propose to periodize the signal and give it
to hear, the whole process being called the protein ‘‘stethoscope’’.
� 2014 Academie des sciences. Published by Elsevier Masson SAS. All rights reserved.
R E S U M E
L’information biologique provenant de capteurs electrophysiologiques, comme l’ECG, les
capteurs de pouls, ou d’appareils generant des signaux moleculaires, comme la
spectrometrie de masse ou la spectrometrie RMN, doit etre visualisee et manipulee sous
une forme compressee, de maniere a optimiser son usage en medecine clinique et n’en
Contents lists available at ScienceDirect
Comptes Rendus Biologies
ww w.s c ien c edi r ec t . c om
://dx.doi.org/10.1016/j.crvi.2014.08.005
ease cite this article in press as: J. Demongeot, et al., Dynalets: A new method for modelling and compressingiological signals. Applications to physiological and molecular signals, C. R. Biologies (2014), http://dx.doi.org/10.1016/rvi.2014.08.005
1-0691/� 2014 Academie des sciences. Published by Elsevier Masson SAS. All rights reserved.

J. Demongeot et al. / C. R. Biologies xxx (2014) xxx–xxx2
G Model
CRASS3-3296; No. of Pages 16
1. Introduction
The different ways to represent a biological signal areaiming both to:
� explain the mechanisms having produced the signal;� facilitate its use in medical applications or in life
sciences.
The biological signals can come from electrophysiologicsignal sensors like ECG, arterial pulse sensors, etc., or frommolecular devices like mass or NMR spectrometry, etc.,and have to be modelled and compressed for an efficientmedical use by clinicians and to retain only the pertinentinformation about the mechanisms at the origin of therecorded signal for the researchers in life sciences, orrestored to be interpreted, e.g., in telemedicine. If therecorded signal is periodic in time and/or space,the classical compression processes like Fourier andwavelet transforms give good results concerning thecompression rate, but bring in general no supplementaryinformation about the interactions between elements ofthe living system producing the studied signal. Here, wedefine a new transform called Dynalet based on Lienarddifferential equations, which are susceptible to model themechanism that is the source of the signal and we proposeto apply this new technique to real signals like ECG, arterialpulse and mass or NMR spectrometry. We will recall inSection 2 the classical Fourier and wavelet Haley trans-forms from the point of view of differential equations, andthen, we present in Section 3 the prototype of the Lienardequations, i.e. the van der Pol equation. In Section 4, we willdefine the Dynalet transform, and then describe in Sections5 to 8 the biological applications.
2. Fourier and Haley wavelet transforms
The Fourier transform comes from the desire of JosephFourier [1], in 1807, to represent in a simple way functionsused in physics, notably in the frame of heat propagation
modelling. He used a base of functions made of thesolutions to the simple not-damped pendulum differentialequation (cf. the trajectory on Fig. 1):
dx=dt ¼ y; dy=dt ¼ �v2x;
whose general solution is: x(t) = k cosvt, y(t) = �kv sinvt.By using the polar coordinates u and r defined from the
variables x and z = �y/v, we get the new differentialsystem:
du=dt ¼ v; dr=dt ¼ 0;
with u = arctan(z/x) and r2 = x2 + z2. The polar system isconservative, its Hamiltonian function being defined byH(u,r) = vr. The general solution x(t) = k cosvt, z(t) = k
sinvt has two degrees of freedom, k and v, respectively theamplitude and the frequency of the signal, and constitutesan orthogonal base, by choosing for v the multiples (calledharmonics) of a fundamental frequency v0.
After the seminal theoretical works by Meyer [2,4],Daubechies [3] and Mallat [5], Haley [6] used in 1997 asimple wavelet transform for representing signals inastrophysics. He used a base of functions made of thesolutions to the damped pendulum differential equation(cf. the trajectory on Fig. 1):
dx=dt ¼ y; dy=dt ¼ � v2 þ t2� �
x � 2ty;
whose general solution is: x(t) = k e�ttcosvt, y(t) = �k
e�tt(vsinvt + tcosvt).By using the polar coordinates u and r defined from the
variables x and z = �y/v – tx/v, we get the differentialsystem:
du=dt ¼ v; dr=dt ¼ �tr
The polar system is dissipative (or gradient), itspotential function being defined by P(u,r) = �vu + tr2/2.The general solution x(t) = k e�
ttcosvt, z(t) = k e�ttsinvt has
three degrees of freedom, k, v and t, the last parameter
retenir que la partie pertinente, explicative des mecanismes ayant genere le signal, en vue
d’un stockage dans des bases de donnees scientifiques ou dans des gisements de dossiers
medicaux personnalises. Lorsque le signal enregistre est periodique, les procedes de
compression classiques que sont les transformees de Fourier et ondelettes donnent de bons
resultats au niveau du taux de compression et de la qualite de la restitution, mais n’apportent
en general aucune information nouvelle concernant les interactions existant entre les
elements du systeme vivant ayant produit le signal etudie. On definit ici une nouvelle
transformation, nommee Dynalet, fondee sur les equations differentielles ordinaires de
Lienard, susceptibles de modeliser le mecanisme generateur du signal ; nous proposons
d’appliquer cette nouvelle technique de modelisation et de compression a des signaux
biologiques periodiques reels, comme l’ECG et le pouls, ainsi qu’aux donnees proteiques
provenant de la spectrometrie moleculaire RMN. Dans chaque application, la reconstruction
du signal d’origine (oscillations ou pic) utilisant la transformee Dynalet est comparee a celle
de Fourier, en comptant le nombre de parametres a regler pour un rapport signal sur bruit
determine. Dans le cas du signal proteique, apres la reconstruction visuelle des pics du
spectre RMN, nous proposons de les periodiser et de les donner a entendre, l’ensemble de ce
processus applicatif etant alors appele « stethoscope » proteique.
� 2014 Academie des sciences. Publie par Elsevier Masson SAS. Tous droits reserves.
Please cite this article in press as: J. Demongeot, et al., Dynalets: A new method for modelling and compressingbiological signals. Applications to physiological and molecular signals, C. R. Biologies (2014), http://dx.doi.org/10.1016/j.crvi.2014.08.005

beipen
3. T
funpenFiggen
dx=
whR(xalgepoltialHamexa
Hvd
wh(Figsysanhtotipoirec
� meocow
Fig.
v =
HvdP
J. Demongeot et al. / C. R. Biologies xxx (2014) xxx–xxx 3
G Model
CRASS3-3296; No. of Pages 16
Plbj.c
ng the exponential time constant responsible for thedulum’s damping.
he van der Pol system
For the Dynalet transform, we propose to use a base ofctions made of the solutions to the relaxationdulum’s differential equation (cf. the trajectory on
. 1, top right), which is a particular example of the mosteral Lienard differential equation:
dt ¼ y; dy=dt ¼ �R xð Þx þ Q xð Þy;
ich is specified in the van der Pol case by choosing) = v2 et Q(x) = m(1–x2/b2). Its general solution is notbraic, but can be approximated by a family of
ynomials [7–11]. The van der Pol system is a poten-–Hamiltonian system, defined by the potential PvdP and
iltonian HvdP functions (Fig. 2, top left), HvdP being formple approximated at order 4, when v = b = 1, by:
P x; yð Þ ¼ x2þy2� �
=2 � mxy=2 þ myx3=8 � mxy3=8;
ich allows us to obtain the equation of its limit-cycle. 1, bottom): HvdP(x,y) � 2.024 [8,11]. The van der Pol
tem has three degrees of freedom, b, v and m, the lastarmonic parameter being responsible for the asymp-c stability of the pendulum’s limit-cycle, which has ant, but not revolution symmetry. These parameterseive different interpretations:
appears as an anharmonic term: when m = 0, thequation is that of the simple pendulum, i.e., a sine wavescillator, whose amplitude depends on the initialnditions. Relaxation oscillations are observed evenith small initial conditions (Figs. 1 and 2), with a period
T equal to 2p/Imb near the bifurcation value m = 0,where b is eigenvalue of the Jacobian matrix J of the vander Pol equation at the origin:
J ¼ 0 1�v2 m
� �:
The characteristic polynomial of J is equal to: b2–mb + v2 = 0, hence b = (m � (m2–4v2)1/2)/2 and T � 2p/v + pm4/2v3:
� b looks as a term of control: when x > b and y > 0, thederivative of y is negative, acting as a moderator on thevelocity. The maximum of the oscillations amplitude isabout 2b, whatever the initial conditions and values ofthe other parameters are. More precisely, the amplitudeax(m) of x is estimated by 2b < ax(m) < 2.024b, for everym > 0, and when m is small, ax(m) is estimated by:ax(m) � (2 + m2/6)b/(1 + 7 m2/96) [12,13]. The amplitudeay(m) is obtained for dy/dt = 0, i.e. is approximately forx = b, then ay(m) is the dominant root of the followingalgebraic equation: HvdP(b,ay(m)) = 2.024;� v is a frequency parameter: when v >> m/2 >> 1, the
period T of the limit-cycle is determined mainly by thetime during which the system stays around the cubicfunction where both x and y are O(1/m), T being roughlyestimated to be T � 2p/v, and the system can berewritten as: dx/dt = z, dz/dt = �v2x + m(1–x2/m2)z � �v2x + mz, with the change of variables:x = mx/b, z = my/b.
4. The Dynalet transform
The Dynalet transform consists in identifying a Lienardsystem based on the interactions mechanisms between its
1. (Color online.) Top left: a simple pendulum trajectory. Top middle: a damped pendulum trajectory. Top right: van der Pol limit-cycle (m = 10,
b = 1). Middle: relaxation oscillation of the van der Pol oscillator with m = 5, v = b = 1. Bottom: representation of the harmonic contour lines
(x,y) = 2.024 for different values of m.
ease cite this article in press as: J. Demongeot, et al., Dynalets: A new method for modelling and compressingiological signals. Applications to physiological and molecular signals, C. R. Biologies (2014), http://dx.doi.org/10.1016/rvi.2014.08.005

J. Demongeot et al. / C. R. Biologies xxx (2014) xxx–xxx4
G Model
CRASS3-3296; No. of Pages 16
variables (well expressed by its Jacobian matrix) analogousto those of the experimentally studied system, whoselimit-cycle is the nearest (in the sense of the D set or of themean quadratic distances between sets of van der Polpoints and experimental points having the same phase,sampled respectively from the original signal and the vander Pol limit-cycle) to the signal in the phase plane (xOy),where y = dx/dt. We can notice that the Jacobian interac-tion graph of the van der Pol system contains a couple ofpositive and negative tangent circuits (called regulon [10]).Practically, for performing the Dynalet transform, it isnecessary to choose:
� the parameters v and m such as the period of the van derPol limit-cycle equals the mean period of the originalsignal;� a translation of the origin of axes, in order to fix the first
van der Pol point on its limit-cycle identified, byconvention, at the first signal point (corresponding tothe mean baseline value of the original signal);� a homothety on these axes defining their scales, by
minimizing the distance between two sets of points fromboth van der Pol and original signals.
By repeating this process for the difference betweenthe original signal and the van der Pol limit-cycle, it is
of the fundamental reconstructed signal and of itsharmonics.
The potential and Hamiltonian parts PvdP and HvdP used forthis transform can be calculated following [7–9]. For example,for m = 1 (respectively [resp.] m = 2), the correspondingpolynomials are respectively P1 and H1 (P2 and H2), defined by:
P1 x; yð Þ ¼ �3x2=4 þ y2=4 þ 3x4=32 þ y4=96 þ x2y2=16and H1 x; yð Þ ¼ x2 þ y2
� �=2 � 3xy=2 þ 3yx3=8 � y3x=24 � 2
res p:P2 x; yð Þ¼�3x2=4 þ y2=4 þ 3x4=32 þ y4=96 þ x2y2=16�and H2 x; yð Þ¼ x2 þ y2
� �=2�3xy=8 þ 3yx3=8� y3x=24 � 1=2Þ
Using this potential–Hamiltonian decomposition, it ispossible to calculate an approximate solution S(ki,mi)(t) ofthe van der Pol differential system corresponding to the ithharmonics of the Dynalet transform, as a polynomial oforder 2 + i verifying:
dx=dt ¼ y and dy=dt ¼ �x þ mi 1 � k2i x2
� �y
We will search for example for the approximatesolution x(t) = S(1,1)(t) as a polynomial of order 3 in thecase m = 1:
x tð Þ ¼ c0 þ c1t þ c2t2 þ c3t3; y tð Þ ¼ c1 þ 2c2t þ 3c3t2
The polynomial coefficients ci’s above represent boththe potential and Hamiltonian parts of the van der Pol
Fig. 2. (Color online.) Top left: representation of the potential P and Hamiltonian H on the phase plane axis (xOy). Bottom left: limit-cycle of the van der Pol
equation for different values of m (from [16]). Right: isochronal landscape surrounding the van der Pol limit-cycle (m = 2, v = b = 1; period T � 7.642).
system and they can be obtained by identification with P1
possible to get successively a polynomial approximationPlease cite this article in press as: J. Demongeot, et al., Dynalets: A new method for modelling and compressingbiological signals. Applications to physiological and molecular signals, C. R. Biologies (2014), http://dx.doi.org/10.1016/j.crvi.2014.08.005

anddt =
c02
c2c�c, c
whappsymarefun
cantheof acurevo
5. C
likerhytionsincarwhof
app
Fig.
the
Righ
Fig.
rela
J. Demongeot et al. / C. R. Biologies xxx (2014) xxx–xxx 5
G Model
CRASS3-3296; No. of Pages 16
Plbj.c
H1 derivatives [7–11]: dx/dt = �@P1/@x + @H1/@y, dy/ �@P1/@y–@H1/@x. Then, we get:
=2 þ c12=2 � 3c0c1=2 þ 3c0
3c1=8 � c0c13=24 ¼ 2;
3 � 9c32=2 � 9c0c2
3 þ 9c0c23=4 þ 27c0
2c32=8 � 3
0c2c32=4 � c2
4=24 ¼ 0
2c3 � 27c23=2 þ 9c3
2 � 3c32 � 3c2c3
2=2 � c24=24 ¼ 0;
ich implies c0 = 2, c1 = 0, c2� 0.46 and c3� 0.04, i.e.,roximately the values given in [14]. Because of themetry of the limit-cycle, all the solutions {S(kj,m/2j)}j2IN
orthogonal and we can decompose any continuousction f on this base, thanks to the Weierstrass theorem.A first example of application of the Dynalet technique
be represented by the mitosis rhythm in lateral cells of caudal fin in zebrafish [16]: by using the relaxation waves
van der Pol oscillator (Fig. 3), we can fit better the mitosisve (represented by the intracellular BrDU concentrationlution on Fig. 4) than when using a sine function.
ardiovascular applications
We propose to apply this new technique to real signals ECG and pulse rhythm. In these both cases, thethmic cardiovascular activity results from the summa-
of cellular oscillators (Fig. 5) located in the cardiacus node, which are subject to the control of the bulbardiovascular moderator and cardio-accelerator centres,ich modulate the sinus signal, integrating the influencethe inspiratory bulbar centre, which causes the
The Dynalet transform consists in identifying a Lienardsystem that expresses interactions between its variablesthrough its Jacobian matrix analogous to those of theexperimentally studied system, whose limit-cycle is thenearest (in the sense of the distance D between sets, or ofthe mean quadratic distance between points of samephase) to the signal pattern in the phase plane (xOy), wherey = dx/dt.
Practically, if the Lienard system is a van der Pol system,it is necessary to execute the following transforms forgetting Dynalet approximation from original signal:
� to estimate the parameters v and m such as the period ofthe van der Pol signal is equal to the mean empiricalperiod (calculated for the original signal);� do a translation of the origin of axes in the phase plane;� do a homothetic change of the coordinates, in order to
match the van der Pol signal to the original signal.
Then the whole approximation procedure done for theECG signal (Fig. 6a) involves the following steps:
� suppress the time intervals when the signal wasunder the critical plateau value L of the Levy timel(e) equal to the time interval during which thesignal has passed between 0 and e. This step allowsobtaining the QRS complex of the experimental ECG(Fig. 6b and c);� fix the value of the parameter m such as the period of the
4. Left: BrdU concentration evolution representing the mitosis rhythm in lateral cells of caudal fin in zebrafish [16], with indication of the nadir (time of
minimum) of the cycle (red arrow), showing a rather good fit with the sine function (red) and a better fit with the van der Pol relaxation wave (blue).
t: same curve for the axial cells, showing a phase shift of the nadir, due to the spatial bell shaped form of the caudal fin.
3. Representation of different waves from van der Pol oscillator simulations (from [15]), from the symmetric type (left, for m = 0.4, v = 1, b = 4) to the
xation type (right, for m = 4, v = 1, b = 4).
an der Pol signal is equal to the QRS complex duration;
earance of harmonics in the cellular rhythm. vease cite this article in press as: J. Demongeot, et al., Dynalets: A new method for modelling and compressingiological signals. Applications to physiological and molecular signals, C. R. Biologies (2014), http://dx.doi.org/10.1016/rvi.2014.08.005

Fig. 5. (Color online.) a: van der Pol signal [15] fitting (in blue) the single cardiac cell activity [17] (in white); b: ECG signals recorded for different
electrophysiologic derivations (from [18]), with indication (in red) of the baseline.
Fig. 6. (Color online.) a: ECG signal (V2 derivation); b: decomposition into two temporal profiles respectively of period T and T/2, whose corresponding
functions are orthogonal for the integral on [0,T[of the vector product; c: representation of different van der Pol limit-cycles, for different values of m (from
m = 0.01 in red, to m = 4, with v = b = 1); d: Fourier decomposition of the ECG signal (V5 derivation), showing the reconstruction process until the 17th
harmonics; e: representation of a relaxation wave from van der Pol oscillator simulations [15], for m = 2.24, v = 1.6, b = 3.
J. Demongeot et al. / C. R. Biologies xxx (2014) xxx–xxx6
G Model
CRASS3-3296; No. of Pages 16
Please cite this article in press as: J. Demongeot, et al., Dynalets: A new method for modelling and compressingbiological signals. Applications to physiological and molecular signals, C. R. Biologies (2014), http://dx.doi.org/10.1016/j.crvi.2014.08.005

� ppsiQ
Fig.
der
from
then
mat
in tr
sam
plus
J. Demongeot et al. / C. R. Biologies xxx (2014) xxx–xxx 7
G Model
CRASS3-3296; No. of Pages 16
Plbj.c
erform a translation of the origin of the (xOy) phaselane and a scaling on the coordinates of the van der Polgnal, so as to adjust them to the maximum of the x
RS complex;
� finish the approximation with a parameter optimization(parameters v and b), by matching the QRS complexpoints to the van der Pol limit-cycle in order to minimizethe distance D between the interiors of the QRS points
7. (Color online.) a: Initial position in the phase plane xOy of the van der Pol limit-cycle (in green clear) and ECG signal (in red) and final fit between van
Pol (in dark green) and ECG signal after transformation on the X and Y axes (translation and scaling); first row: b: fundamental component extraction
the original experimental ECG signal (in red), (i) by identifying the phase 0 value on the original V1 derivation in the phase plane xOy, where y = dx/dt,
a sample of 100 points extracted from the mean signal, on the van der Pol limit-cycle having the same period as the pitch of the mean ECG signal; c:
ch for getting the fundamental Dynalet component (F in blue) and first harmonic (H1 in green), with a transformation in the (xOy) phase plane consisting
anslating/scaling x and y axes (as indicated in the left table of a), in order to obtain the best fit for the cost function based on the D distance between
pled empirical mean points (blue curve) and the set of points of same phase extracted from the van der Pol limit-cycle; d: subtracting the fundamental
the first harmonic component (F + H1 in violet) from the sampled original ECG signal (in blue).
ease cite this article in press as: J. Demongeot, et al., Dynalets: A new method for modelling and compressingiological signals. Applications to physiological and molecular signals, C. R. Biologies (2014), http://dx.doi.org/10.1016/rvi.2014.08.005

J. Demongeot et al. / C. R. Biologies xxx (2014) xxx–xxx8
G Model
CRASS3-3296; No. of Pages 16
set and the van der Pol limit-cycle (denoted respectivelyby ECG and VDP, with interiors ECG0 and VDP0) in thephase plane:
D ECG0; VDP0ð Þ ¼ Area ECG0nVDP0ð Þ [ VDP0nECG0ð Þ½ �;
by using a Monte-Carlo method for estimating the areaof the interiors of the linear approximation of empiricalpoints of the Experimental QRS complex and of the vander Pol limit-cycle, calculated from a sample of points inthe phase plane, respectively {Ei}i = 1,100 and {Pi}i = 1,100. It isalso possible to minimize the mean quadratic distancebetween the points of the van der Pol limit-cycle and theempirical points having the same phase;� repeat the procedure for obtaining the successive
harmonics in order to respect, for example, a fixedthreshold of 20 dB for the signal-to-noise ratio (SNR) and10% for the quadratic relative error (QRE);� calculate a polynomial approximation of the signal from
the quadratic estimate of the van der Pol limit-cyclecorresponding to the previous step, e.g., if v = b = 1:
HvdP x; yð Þ ¼ x2 þ y2� �
=2 � mxy=2 þ myx3=8 � mxy3=8
¼ 2:024:
6. Application to ECG
Let now compare the performance of the Dynaletreconstruction of the ECG V1 signal (given on Fig. 8c) witha Fourier transform having the same number of parameters,that is 5, i.e., the origin abscissa translation, two values of m(period) and two abscissa scaling ratios for the fundamental
and first harmonic of the Dynalet transform; the period, theorigin abscissa translation and three values of sinecoefficients for the Fourier transform F(x) (Fig. 7), whoseequation is:
F xð Þ ¼ 0:42142 cos 2px=176ð Þ þ 0:40773 sin 2px=176ð Þ
þ 0:34225 � 0:10539 cos 4px=176ð Þ
For defining a quantitative assessment of the errorbetween the abscissae of the K original signal observationsXi’s (obtained after extraction of the baseline) and their Fourieror Dynalet approximations ji’s, we use the notions of meansquare error (MSEX) and signal-to-noise ratio (SNRX) where:
MSEX ¼X
i¼1;KXi � jið Þ2=
Xi¼1;K
X2i ;
SNRX ¼ �10 log10MSEX
The calculation made for the QRS signal of Figs. 7 and 8shows, for example, a good Dynalet fit for ordinates values:
SNRY Dynalet ¼ 40 dB;
SNRY Fourier ¼ 15:7 dB;
MSEY Dynalet ¼ 27 � 10�5; MSEY Fourier ¼ 22 � 10�4
In the reconstitution of Figs. 7 and 8, MSEX Fourier = 0.08,SNRX Fourier = 22 dB and MSEX Dynalet = 0.09, SNRX Dyna-
let = 21 dB. We can notice that this Fourier transform needssix parameters (including the value of the period), whilethe Dynalet transform requires only five parameters(Fig. 8).
Fig. 8. (Color online.) a: First coefficients of the Fourier transform of the QRS complex: the fundamental and two first harmonics are labelled; b: original QRS
complex of the ECG (green) and Fourier (blue) reconstruction with two harmonics matching; c: experimental ECG V1; d: evolution of the Levy time l(e)
corresponding to the time interval during which the signal passed between 0 and e.Please cite this article in press as: J. Demongeot, et al., Dynalets: A new method for modelling and compressingbiological signals. Applications to physiological and molecular signals, C. R. Biologies (2014), http://dx.doi.org/10.1016/j.crvi.2014.08.005

7. T
mabas(Fovan(resFoumehar21 d0.00.0defi
totiequphyFoupultranbei
8. P
Polfact[19proHuequanaequjusz =
phy
Fig.
nega
J. Demongeot et al. / C. R. Biologies xxx (2014) xxx–xxx 9
G Model
CRASS3-3296; No. of Pages 16
Plbj.c
he pulse signal
Concerning the pulse signal, the pulse wave is approxi-ted, after identification and extraction of the inter-beatseline, by using successively the sine functions familyurier transform) and the family of the limit-cycles of the
der Pol equation. In the example of the Fig. 11, MSEp. SNR) is equal, for the amplitude X, to 0.066 for arier transform having two harmonics with six para-ters, and 0.09 for a Dynalet decomposition with onemonic defined by only five parameters (resp. 24 dB andB). For the velocity Y = dX/dt, MSE (resp. SNR) is equal to
092 for a Fourier transform with two harmonics and095 for a Dynalet decomposition with 1 harmonicned by five parameters (resp. 40.8 dB and 40.4 dB).
Given the fact that the Dynalet transform uses asymp-cally stable trajectories (limit-cycles) with a differentialation closer to the mechanism of genesis of electro-siological signals than the simple pendulum used by therier transform, the above-obtained performances for these signal show that the compression rate for Dynaletsform is as efficient as for Fourier transform, while also
ng more explanatory, than for the Fourier transform.
hysiologic applications
One of the reasons explaining the efficacy of the van der equation in representing the cardiac activity lies in the
that since 50 years and the first models by Noble,20], 45 models of the cardiac rhythm have beenposed [21], many of them being based on Hodking–xley model, which is closely related to the van der Polation (Fig. 9). The van der Pol system is indeedlogous to the 2D-version of the Hodgkin–Huxleyation, called the FitzHugh–Nagumo equation, by
t changing the second variable y for the new variabley–mx(1–x/H3)(1 + x/H3).The explanatory power of the Dynalets in the case of
and respiratory rhythms are regulated through interactionloops (called ‘‘regulons’’ in [22]) having one activation, oneinhibition and one auto-catalysis, in interaction with thesame structure controlling the respiration:
� the bulbar cardio-moderator CM (resp. cardio-accelera-tor CAC) inhibits (resp. activates) the sinus node (S);� the sinus node activates (resp. inhibits) the CM (resp.
CAC) via the peripheral chemoreceptors, and auto-activates itself;� the expiratory neurons (E) inhibit the inspiratory ones (I);� the inspiratory neurons activate expiratory ones (Fig. 10).
Biological rhythms other than the ECG or pulse can beinterpreted and compressed using Lienard equations andthe Dynalet transform, like the respiratory rhythm or thesingle cardiac cell activity, which represent good examplesof a relaxation wave (Fig. 5a and [23,24]), as well as pulseactivity (Fig. 11). In summary, the main advantages of theDynalet transform on the Fourier transform in the case ofperiodic physiologic signals are:
� the limit-cycles of the Lienard systems, like those of thevan der Pol system, are asymptotically stable, unlikethose of the simple pendulum of Fourier transform,which are asymptotically unstable because the simple
9. Overview of van der Pol equation in a biological models’ landscape. Interaction graph of these systems contains in general a couple of positive and
tive tangent circuits (called ‘‘regulons’’ in [22]).
Fig. 10. Interaction graph of cardiac (CM, CAC, S) and respiratory (E, I)
ems.
siologic signals comes also from the fact that cardiac systease cite this article in press as: J. Demongeot, et al., Dynalets: A new method for modelling and compressingiological signals. Applications to physiological and molecular signals, C. R. Biologies (2014), http://dx.doi.org/10.1016/rvi.2014.08.005

J. Demongeot et al. / C. R. Biologies xxx (2014) xxx–xxx10
G Model
CRASS3-3296; No. of Pages 16
pendulum is a conservative Hamiltonian system. In bothcases, these trajectories have algebraic approximations;� the approximating system in the case of the Dynalet
transform explains the mechanism genesis of the signal;for example, in the case of the heart, the van der Pol systemhas the same interaction structure as the cardiac system;� the trajectories of the Dynalets can break the rotation
symmetry of the simple pendulum, which makes themmore likely to approximate the asymmetrical biologicalwaves, like the relaxation waves.
9. Non-periodic protein spectrum signal
In addition to the compression of periodic signals,another application of the Dynalet transform is the
compression of a non-periodic signal. If the mechanismof signal generation is of Lienard type, for example arelaxation in a magnetic field in case of NMR spectroscopy[25] (giving signals of type T1 and T2, which are functionsof lifetime of a given energy state, hence of a relaxationrate) or in an electric field in the case of mass spectro-scopy [26] (giving signals of relaxation occurring byfragmentation of a molecule, in order to produce ions oflower masses), and even if the signal is a response in theform of isolated peaks, it can approximated by theDynalet processing. If the peaks are very asymmetric(Figs. 12 and 13), of relaxation type, it is possible to obtainby periodization an approximate polynomial representa-tion of any desired order in the space of the solutions to aLienard equation. A good example of this type ofapplication is given by the approximation of the spectrum
Fig. 11. (Color online.) a: Dynalet reconstruction of the pulse wave with a fundamental (F) and one harmonic (H1); b: original experimental pulse wave
recorded at the level of the dorsalis pedis artery; c: representation of a sequence of pulse waves in the phase plane (amplitude, velocity); d: original pulse
(red) and van der Pol (green) signal matching, after an abscissa translation of the origin of the xOy referential and extraction of the points of the base line; e:
second matching of the fundamental with a new van der Pol signal of triple period; f: coefficients of the Fourier transform with one harmonics; g: original
pulse wave (green) and Fourier reconstruction with one harmonic (blue).
Please cite this article in press as: J. Demongeot, et al., Dynalets: A new method for modelling and compressingbiological signals. Applications to physiological and molecular signals, C. R. Biologies (2014), http://dx.doi.org/10.1016/j.crvi.2014.08.005

of aspe
10.spe
Fig.andthe(SN
MS
SNR
whtheharsix
MSMS
signfor
witdoitionpro
� >
� 2� 1
Fig.
isola
J. Demongeot et al. / C. R. Biologies xxx (2014) xxx–xxx 11
G Model
CRASS3-3296; No. of Pages 16
Plbj.c
protein, observable by NMR spectroscopy or by massctrometry.
Dynalet transform of a peak from a protein NMRctroscopy signal
By focusing on the peak indicated by a red arrow red on 12, we will perform both the Dynalet transform (Fig. 14)
the Fourier transform (Fig. 15). We recall that the level of mean square error (MSEX) and of the signal-to-noise ratioRX) of these transforms is calculated from the formulas:
EX ¼X
i¼1;KXi � jið Þ2=
Xi¼1;K
X2i ;
X ¼ �10 log10MSEX ;
ich shows that the Dynalet transform fits better than Fourier transform for the X values with only onemonics (five coefficients for the Dynalet transform andfor the Fourier transform):
EX Fourier ¼ 0:0188; SNRX Fourier ¼ 11:8 dBEX Dynalet ¼ 0:0038; SNRX Dynalet ¼ 18:8 dB
Following [27], the quality of the reconstitution of theal can be qualified of low, but it is in general sufficient
performing an efficient surveillance of chronic diseasesh protein defects using e-health systems at home (i.e.,ng a fusion of actimetric data with metabolic informa-
fixing the gravity level of the disease as thegressive entrance into complications):
40 dB SNR = excellent signal;5 dB to 40 dB SNR = very good signal;5 dB to 25 dB SNR = low signal;
� 10 dB to 15 dB SNR = very low signal;� 5 dB to 10 dB SNR = no signal.
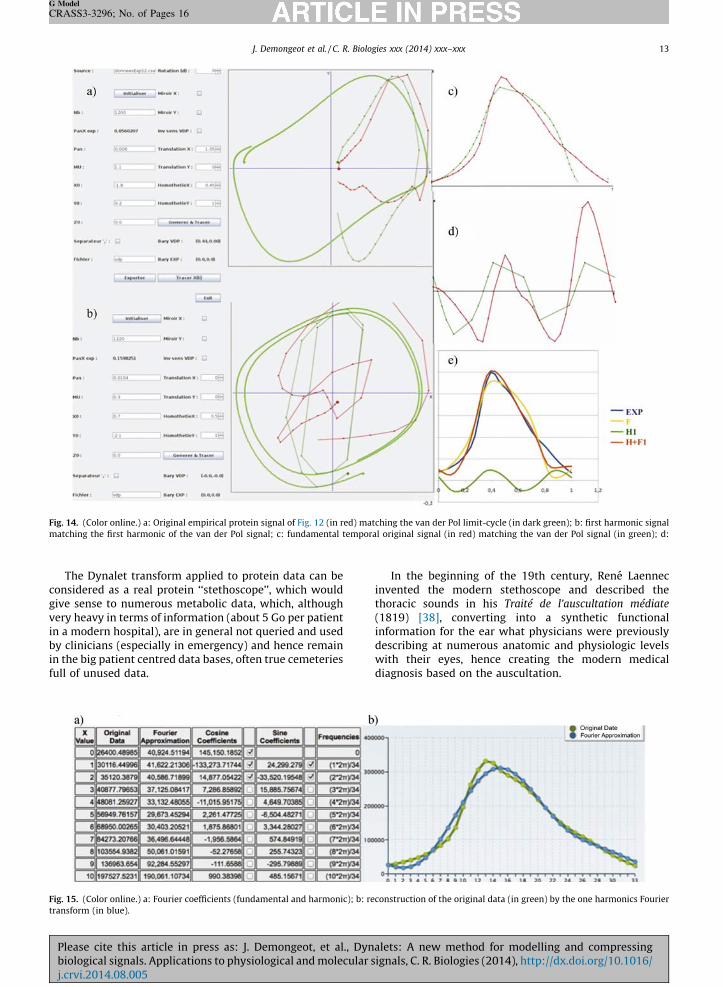
The Fourier transform allows to obtain the reconstruc-tion of a compressed signal XF(t) with one harmonic(Fig. 15), equal to:
XF tð Þ ¼ 145150:1852 � 133273:71744 cos 2pt=34ð Þ
� 33520:19548 sin 4pt=34ð Þ
þ 24299:279 sin 2pt=34ð Þ
þ 14877:05422 cos 4pt=34ð Þ
One can see on Fig. 15 the quality of the reconstructionof the original data (in green) by the one harmonic Fouriertransform (in blue).
11. Toward a protein ‘‘stethoscope’’
The identification of proteins by their spectrum allowsfor example the construction of complex genetic controlnetworks, such as those found in the regulation of theimmune system [28–31], where key proteins are effectorsof the genetic expression (activators or inhibitors) and maybe subject to pathologic conditions, leading to up- ordown-expressions. These regulatory interactions lead toabnormal protein or protein complexes concentrations inexcess or lacking, and spectroscopy peaks indicating thesepathologic defects can be treated by the Dynalet approach.Of course, other alternative techniques for estimatingprotein spectra already exist, like kernel functionalestimation tools [32–37], but there are not related tothe mechanism of production of the protein signal (Fig. 16).
12. (Color online.) a: Original protein NMR spectroscopy signal; b: extraction of a peak P0 called ‘‘proteosol’’ (because it sounds like a sol) allowing it to be
ted and processed by the Dynalet transform (red arrow). All the peaks (like P1) surrounding the ‘‘proteosol’’ peak P0 are also processed and can be heard.
ease cite this article in press as: J. Demongeot, et al., Dynalets: A new method for modelling and compressingiological signals. Applications to physiological and molecular signals, C. R. Biologies (2014), http://dx.doi.org/10.1016/rvi.2014.08.005

Fig. 13. (Color online.) a: Original protein NMR spectroscopy signal; b: extraction of a peak P0 called ‘‘proteosol’’ (because it sounds like a sol) allowing it to
be isolated and processed by the Dynalet transform (red arrow). All the peaks (like P1) surrounding the ‘‘proteosol’’ peak P0 are also processed and can be
heard.
J. Demongeot et al. / C. R. Biologies xxx (2014) xxx–xxx12
G Model
CRASS3-3296; No. of Pages 16
Please cite this article in press as: J. Demongeot, et al., Dynalets: A new method for modelling and compressingbiological signals. Applications to physiological and molecular signals, C. R. Biologies (2014), http://dx.doi.org/10.1016/j.crvi.2014.08.005
congivverin aby
in tfull
Fig.
mat
Fig.
tran
J. Demongeot et al. / C. R. Biologies xxx (2014) xxx–xxx 13
G Model
CRASS3-3296; No. of Pages 16
Plbj.c
The Dynalet transform applied to protein data can besidered as a real protein ‘‘stethoscope’’, which would
e sense to numerous metabolic data, which, althoughy heavy in terms of information (about 5 Go per patient
modern hospital), are in general not queried and usedclinicians (especially in emergency) and hence remainhe big patient centred data bases, often true cemeteries
of unused data.
In the beginning of the 19th century, Rene Laennecinvented the modern stethoscope and described thethoracic sounds in his Traite de l’auscultation mediate
(1819) [38], converting into a synthetic functionalinformation for the ear what physicians were previouslydescribing at numerous anatomic and physiologic levelswith their eyes, hence creating the modern medicaldiagnosis based on the auscultation.
14. (Color online.) a: Original empirical protein signal of Fig. 12 (in red) matching the van der Pol limit-cycle (in dark green); b: first harmonic signal
ching the first harmonic of the van der Pol signal; c: fundamental temporal original signal (in red) matching the van der Pol signal (in green); d:
15. (Color online.) a: Fourier coefficients (fundamental and harmonic); b: reconstruction of the original data (in green) by the one harmonics Fourier
sform (in blue).
ease cite this article in press as: J. Demongeot, et al., Dynalets: A new method for modelling and compressingiological signals. Applications to physiological and molecular signals, C. R. Biologies (2014), http://dx.doi.org/10.1016/rvi.2014.08.005
J. Demongeot et al. / C. R. Biologies xxx (2014) xxx–xxx14
G Model
CRASS3-3296; No. of Pages 16
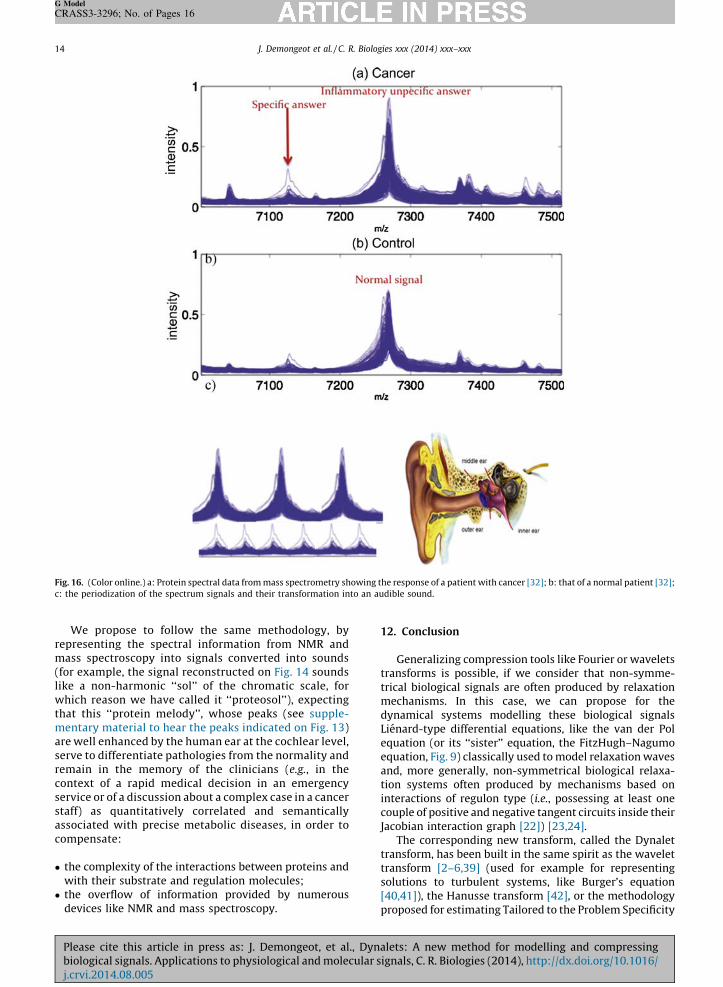
We propose to follow the same methodology, byrepresenting the spectral information from NMR andmass spectroscopy into signals converted into sounds(for example, the signal reconstructed on Fig. 14 soundslike a non-harmonic ‘‘sol’’ of the chromatic scale, forwhich reason we have called it ‘‘proteosol’’), expectingthat this ‘‘protein melody’’, whose peaks (see supple-mentary material to hear the peaks indicated on Fig. 13)are well enhanced by the human ear at the cochlear level,serve to differentiate pathologies from the normality andremain in the memory of the clinicians (e.g., in thecontext of a rapid medical decision in an emergencyservice or of a discussion about a complex case in a cancerstaff) as quantitatively correlated and semanticallyassociated with precise metabolic diseases, in order tocompensate:
� the complexity of the interactions between proteins andwith their substrate and regulation molecules;� the overflow of information provided by numerous
devices like NMR and mass spectroscopy.
12. Conclusion
Generalizing compression tools like Fourier or waveletstransforms is possible, if we consider that non-symme-trical biological signals are often produced by relaxationmechanisms. In this case, we can propose for thedynamical systems modelling these biological signalsLienard-type differential equations, like the van der Polequation (or its ‘‘sister’’ equation, the FitzHugh–Nagumoequation, Fig. 9) classically used to model relaxation wavesand, more generally, non-symmetrical biological relaxa-tion systems often produced by mechanisms based oninteractions of regulon type (i.e., possessing at least onecouple of positive and negative tangent circuits inside theirJacobian interaction graph [22]) [23,24].
The corresponding new transform, called the Dynalettransform, has been built in the same spirit as the wavelettransform [2–6,39] (used for example for representingsolutions to turbulent systems, like Burger’s equation[40,41]), the Hanusse transform [42], or the methodologyproposed for estimating Tailored to the Problem Specificity
Fig. 16. (Color online.) a: Protein spectral data from mass spectrometry showing the response of a patient with cancer [32]; b: that of a normal patient [32];
c: the periodization of the spectrum signals and their transformation into an audible sound.
Please cite this article in press as: J. Demongeot, et al., Dynalets: A new method for modelling and compressingbiological signals. Applications to physiological and molecular signals, C. R. Biologies (2014), http://dx.doi.org/10.1016/j.crvi.2014.08.005

maresappFouLienniafastneutranin
necdattionperperconFouplu
Ack
en
prohelAndexp
App
be f
j.cr
Ref
[1]
[2]
[3]
[4]
[5]
[6]
[7]
[8]
[9]
[10]
[11]
[12]
[13]
[14]
J. Demongeot et al. / C. R. Biologies xxx (2014) xxx–xxx 15
G Model
CRASS3-3296; No. of Pages 16
Plbj.c
thematical transforms [43–45]. Some preliminaryults [46] have been already published and furtherlications will be published in future articles. As for therier and wavelet transforms, a fast estimation of theard coefficients (calculable using potential–Hamilto-
n decomposition techniques [7–11]) is needed by the Dynalet transform and could be possible following theral networks methodology [47,48]. Then, the Dynaletsform will be for example very useful for compressing
real time the signals coming from e-health systemsessary to the fusion between actimetric and physiologica recorded at home, with genetic and protein informa-
coming in general from hospital records, in order toform adequate personalized surveillance and triggertinent alarms without false alerts [49–51], hencecretizing in medicine the approach proposed by J.rier: ‘‘L’etude approfondie de la nature est la source las feconde des decouvertes mathematiques’’ [52].
nowledgements
We thank A. Glaria from the Escuela de Ingenierıa CivilInformatica, Universidad de Valparaıso, Chile, for
viding us the dorsalis pedis artery pulse data and forpful discussions. We are also indebted to Sasi Conte andrew Atkinson for providing both protein data andlanation about spectroscopy devices.
endix A. Supplementary material
Supplementary material associated with this article can
ound, in the online version, at http://dx.doi.org/10.1016/
vi.2014.08.005.
erences
J. Fourier, Propagation de la chaleur dans les corps solides, Nouv. Bull.Sci. Soc. Philomath. Paris 6 (1808) 112–116.
P.G. Lemarie, Y. Meyer, Ondelettes et bases hilbertiennes, Rev. Mat.Iberoam. 2 (1986) 1–18.
I. Daubechies, Orthonormal bases of compactly supported wavelets,Comm. Pure Appl. Math. 41 (1988) 909–996.
Y. Meyer, Wavelets and operators, in: E. Berkson, N.T. Peck, J. Uh (Eds.),Analysis at Urbana, Vol. 1, London Math. Soc. Lect. Notes Ser. 137 (1989)256–365.
S. Mallat, A theory of multiresolution signal decomposition: the wave-let representation, IEEE Trans. Pattern Anal. Mach. Intell. 11 (6) (1989)74–693.
R. Lind, M. Brenner, S.M. Haley, Estimation of modal parameters using awavelet-based approach, NASA Report TM-97-206300, NTRS, Houston,1997.
J. Demongeot, N. Glade, L. Forest, Lienard systems and potential-Hamil-tonian decomposition. I, C. R. Acad. Sci. Paris, Ser. I 344 (2007) 121–126.
J. Demongeot, N. Glade, L. Forest, Lienard systems and potential-Hamil-tonian decomposition. II, C. R. Acad. Sci. Paris, Ser. I 344 (2007) 191–194.
N. Glade, L. Forest, J. Demongeot, Lienard systems and potential-Hamil-tonian decomposition. III, C. R. Acad. Sci. Paris, Ser. I 344 (2007) 253–258.
N. Glade, L. Forest, J. Demongeot, Lienard systems and potential-Ham-iltonian decomposition, C. R. Biologies 330 (2007) 97–106.
J. Demongeot, J.P. Francoise, Approximation for limit-cycles and theirisochrones, C. R. Biologies 329 (2006) 967–970.
E. Fisher, The period and amplitude of the van der Pol limit-cycle, J.Appl. Phys. 25 (1954) 273–274.
J.L. Lopez, S. Abbasbandy, R. Lopez-Ruiz, Formulas for the amplitude ofthe van der Pol limit-cycle, Scholarly Res. Exch. 2009 (2009) 854060.
C. Bota, B. Caruntu, L. Bereteu, Approximate polynomial solution of anonlinear differential equation using a Taylor-type method, in: A.C.J.
Luo, J.A.T. Machado, D. Baleanu (Eds.), Dynamical Systems and Meth-ods, Springer Verlag, New York, 2012, pp. 169–177.
[15] http://www.sciences.univnantes.fr/sites/genevieve_tulloue/Meca/Oscillateurs/vdp_phase.html.
[16] F. Caraguel, Proliferation au cours de la regeneration de la formebilobee de la nageoire et de la peau lepidogene chez Zebrafish,(Thesis), University J. Fourier, Grenoble, France, 2013.
[17] G. Bub, L. Glass, A. Shrier, Coupling dependent wavefront stability inheterogeneous cardiac cell cultures, Biophys. J. 84 (2003) 408a.
[18] http://wikimedia.org/wikipedia/commons/7/70/ECG_12derivations.[19] D. Noble, A modification of the Hodgkin-Huxley equations applicable to
Purkinje fibre action and pacemaker potential, J. Physiol. 160 (1962)317–352.
[20] R.E. McAllister, D. Noble, R.W. Tsien, Reconstruction of the electricalactivity of cardiac Purkinje fibres, J. Physiol. 251 (1975) 1–59.
[21] F.H. Fenton, E.M. Cherry, Models of cardiac cell, Scholarpedia 3 (2008)1868.
[22] J. Demongeot, J. Aracena, F. Thuderoz, T.P. Baum, O. Cohen, Geneticregulation networks: circuits, regulons and attractors, C. R. Biologies326 (2003) 171–188.
[23] B. van der Pol, J. van der Mark, Le battement du cœur considere commeoscillation de relaxation et un modele electrique du coeur, Onde Electr.7 (1928) 365–392.
[24] B. van der Pol, Oscillations sinusoıdales et de relaxation, Onde Electr. 9(1930) 245–256 (293–312).
[25] J. Jeener, B.H. Meier, P. Bachmann, R.R. Ernst, Investigation of exchangeprocesses by two-dimensional NMR spectroscopy, J. Chem. Phys. 71(1979) 4546–4553.
[26] B. Domon, R. Aebersold, Mass spectrometry and protein analysis,Science 312 (2006) 212–217.
[27] www.enterprisenetworkingplanet.com/netsp/article.php/3747656/WiFi-Define-Minimum-SNR-Values-for-Signal-Coverage.htm.
[28] J. Demongeot, A. Elena, M. Noual, S. Sene, F. Thuderoz, ‘‘Immunet-works’’, intersecting circuits, J. Theor. Biol. 280 (2011) 19–33.
[29] K. Miyake, H. Ogata, Y. Nagai, S. Akashi, M. Kimoto, Innate recognition oflipopolysaccharide by Toll-like receptor 4/MD-2 and RP105/MD-1, J.Endotoxin Res. 6 (2000) 389–391.
[30] C. Georgescu, W.J.R. Longabaugh, D.D. Scripture-Adams, E.S. David-Fung, M.A. Yui, M.A. Zarnegar, H. Bolouri, E.V. Rothenberg, A generegulatory network armature for T lymphocyte specification, Proc.Natl. Acad. Sci. U S A 105 (2008) 20100–20105.
[31] R. Elkon, C. Linhart, Y. Halperin, Y. Shiloh, R. Shamir, Functional geno-mic delineation of TLR-induced transcriptional networks, BMC Geno-mics 8 (2007) 394.
[32] A. Antoniadis, J. Bigot, S. Lambert-Lacroix, Peaks detection and align-ment for mass spec data, J. Soc. Fr. Stat. 151 (2010) 17–37.
[33] J. Demongeot, A. Laksaci, F. Madani, M. Rachdi, Estimation locale line-aire de la densite conditionnelle pour des donnees fonctionnelles, C. R.Acad. Sci. Paris, Ser. I 348 (2010) 931–934.
[34] I. Ouassou, M. Rachdi, Regression operator estimation by delta-sequences method for functional data and its applications, Adv. Stat.Anal. 96 (2012) 451–465.
[35] J. Demongeot, A. Laksaci, F. Madani, M. Rachdi, Functional data: locallinear estimation of the conditional density and its application, Statis-tics 47 (2013) 26–44.
[36] M. Rachdi, A. Laksaci, J. Demongeot, A. Abdali, Theoretical and practicalaspects on the quadratic error in the local linear estimation of theconditional density for functional data, Comput. Statist. Data Anal. 73(2014) 53–68.
[37] J. Demongeot, A. Laksaci, M. Rachdi, S. Rahmani, On the local linearmodelization of the conditional distribution for functional data, San-khya A 76 (2014), http://dx.doi.org/10.1007/s13171-013-0050-z.
[38] R.T.M.H. Laennec, De l’auscultation mediate ou traite du diagnostic desmaladies des poumons et du cœur, fonde principalement sur ce nou-veau moyen d’exploration, J.-A. Brosson et J.-S. Chaude, Paris, 1819.
[39] A. Antoniadis, Wavelet methods in statistics: some recent develop-ments and their application, Stat. Surv. 1 (2007) 16–55.
[40] R. Nguyen van yen, M. Farge, D. Kolomenskiy, K. Schneider, N. Kings-bury, Wavelets meet Burgulence: CVS-filtered Burgers equation, Phy-sica D 237 (2008) 2151–2157.
[41] M. Farge, K. Schneider, O. Pannekoucke, R. Nguyen van yen, Multiscalerepresentations: fractals, self-similar random processes and wavelets,in: H.J. Fernando (Ed.), Handbook of Environmental Fluid Dynamics,CRC Press, Boca Raton, FL, USA, 2013, pp. 311–332.
[42] P. Hanusse, A novel approach to anharmonicity for a wealth of applicationsin nonlinear science technologies, AIP Conf. Proc. 1339 (2010) 303–308.
[43] A. Glarıa Bengoechea, C. Taramasco, J. Demongeot, Methodologicalproposal to estimate a tailored to the problem specificity mathemat-ical transformation. Use of computer intelligence to optimize algo-rithm complexity and application to auditory brain stem responses
ease cite this article in press as: J. Demongeot, et al., Dynalets: A new method for modelling and compressingiological signals. Applications to physiological and molecular signals, C. R. Biologies (2014), http://dx.doi.org/10.1016/rvi.2014.08.005

J. Demongeot et al. / C. R. Biologies xxx (2014) xxx–xxx16
G Model
CRASS3-3296; No. of Pages 16
modelling, in: L. Barolli, et al. (Eds.), IEEE AINA’10, IEEE Proceedings,Piscataway, 2010 , pp. 775–781.
[44] J. Demongeot, A. Hamie, A. Glaria, C. Taramasco, Dynalets: a new time-frequency representation of periodic biological signals and spectraldata, in: L. Barolli, et al. (Eds.), IEEE AINA’ 13, IEEE Proceedings, Piscat-away, 2013, pp. 1525–1530.
[45] A. Glaria, H. Zepeda, S. Chabert, M. Hidalgo, J. Demongeot, C. Taramasco,Complex adaptive systems with inference learning emergent propertyto estimate tailored to the problem specificity mathematical trans-forms: three study cases, in: A. Diaz-Guilera, et al. (Eds.), ECCS’13,Complex Systems Society, Barcelona, Spain, (2013), pp. 127–129.
[46] J. Demongeot, O. Hansen, A. Hamie, Dynalets: a new tool for biologicalsignal processing, in: L.M. Roa Romero (Ed.), Medicon’13, IFBME Pro-ceedings 41, Springer Verlag, New York, 2014, pp. 1250–1260.
[47] B. Hai-long, C. Guang-ju, D. Tian-jun, A method of time-varying har-monic detection based on the wavelet neural network, Proc. CSEE 28 (7)(2008) 104–109.
[48] X. Cheng, X. Zhang, L. Zhao, A. Deng, Y. Bao, Y. Liu, Y. Jiang, Theapplication of shuffled frog leaping algorithm to wavelet neural net-works for acoustic emission source location, C. R. Mecanique 342(2014) 229–233.
[49] J. Demongeot, G. Virone, F. Duchene, G. Benchetrit, T. Herve, N. Noury,V. Rialle, Multi-sensors acquisition, data fusion, knowledge mining andalarm triggering in health smart homes for elderly people, C. R. Biol-ogies 325 (2002) 673–682.
[50] V. Rialle, F. Duchene, N. Noury, L. Bajolle, J. Demongeot, Health ‘‘smart’’home: information technology for patients at home, Telemed. J. EHealth 8 (2002) 395–409.
[51] J. Demongeot, O. Hansen, A. Hamie, H. Hazgui, G. Virone, N. Vuillerme,Actimetry@home: actimetric tele-surveillance and tailored to the sig-nal data compression, ICOST’14, Lecture Notes in Comput. Sci., 8472,2014, pp. 21–30.
[52] J. Fourier, Theorie de la Chaleur, Firmin Didot, Paris, 1822.
Please cite this article in press as: J. Demongeot, et al., Dynalets: A new method for modelling and compressingbiological signals. Applications to physiological and molecular signals, C. R. Biologies (2014), http://dx.doi.org/10.1016/j.crvi.2014.08.005


![ه ارا - tarjomefa.comtarjomefa.com/wp-content/uploads/2018/01/TarjomeFa-F410-English.pdf · Cullender and Smith [9] derivedthecalculationequationforpuregaswellbottom-hole pressure](https://static.fdocuments.in/doc/165x107/5af637d77f8b9a4d4d902432/-and-smith-9-derivedthecalculationequationforpuregaswellbottom-hole.jpg)