PETRO-TIM Limited et SENEGAL HUNT OIL COMPANY Crpp cayar profond-2
`
Comprehensive ReliabilityPlanning Process
(CRPP)
2007 Reliability Needs
Assessment
March 16, 2007
3/16/07 - NYISO Comprehensive Reliability Planning Process (CRPP) 2007 Reliability Needs Assessment
Table of Contents
1 Introduction..................................................................................................................1 2 Reliability Criteria .......................................................................................................3 3 Summary of the 2005 Comprehensive Reliability Plan...............................................4 4 RNA study case Assumptions, Drivers and Methodology for Determination of Needs....................................................................................................................................6
4.1 RNA study case system ...................................................................................... 6 4.2 Methodology for the Determination of Needs .................................................... 9 4.3 Short Circuit Analysis......................................................................................... 9
5 Reliability Needs........................................................................................................10 5.1 Introduction....................................................................................................... 10 5.2 Reliability Needs............................................................................................... 10
5.2.1 RNA Study Case:.......................................................................................10 5.2.2 Thermal Limit Transmission Sensitivity ...................................................11 5.2.3 Unconstrained or Free Flowing Transmission Sensitivity.........................12 5.2.4 Reliability Needs Summary .......................................................................13
5.3 Compensatory MWs ......................................................................................... 14 5.4 Scenarios ........................................................................................................... 18
5.4.1 Load Forecast Uncertainty - High Load Forecast......................................18 5.4.2 Coal Retirement/Environmental Scenario .................................................18 5.4.3 Poletti Retirement Deferred to 2010..........................................................20 5.4.4 NUG Retirement Scenario .........................................................................20 5.4.5 New York Power Authority (NYPA) New York City Purchase Power Agreement..................................................................................................................21 5.4.6 NYPA Clean Coal Initiative ......................................................................22
5.5 Observations and Recommendations................................................................ 22 6 Historic Congestion ...................................................................................................24
3/16/07 - NYISO Comprehensive Reliability Planning Process (CRPP) 2007 Reliability Needs Assessment 1
1 Introduction The introduction of competition in the electric industry in New York State, and in many parts of the Northeast separated the costs of utilities’ services into distinct producers and marketers, and led to the unbundling of power generation and transmission development. As a result, the State’s electric utilities no longer conduct vertically-integrated planning through which generation and transmission plans are tightly coordinated.
In today’s world, the future reliability of the bulk power system depends on a combination of additional resources, provided in response to market forces and by electric utility companies, which continue to deliver electricity to customers and have the obligation to provide safe and reliable services. To maintain the system’s long-term reliability, those resources must be readily available or in development to meet future needs.
With these goals in mind, the NYISO, in conjunction with stakeholders, developed and implemented in 2005 its Comprehensive Reliability Planning Process (CRPP), which is contained in Attachment Y of the NYISO’s Open Access Transmission Tariff (OATT). The NYISO’s CRPP is an annual, ongoing process – developed with NYISO stakeholders – to assess and establish the grid’s reliability needs and solutions1 to maintain bulk power system reliability. The first step in the CRPP is the Reliability Needs Assessment (RNA) over a ten year Study Period with the second step in the process being the solicitation and evaluation of market-based and regulated backstop solutions to the identified needs and the development of the Comprehensive Reliability Plan (CRP).
If the RNA identifies a reliability need in the ten year Study Period, the NYISO will designate one or more Responsible Transmission Owners, who are responsible for the development of a regulated back-stop solution to address the identified need. In addition, the NYISO will solicit market-based and alternative regulated solutions to address the identified need. Solutions will have to satisfy reliability criteria which may not necessarily be the same as the specified level or locations of compensatory Megawatt (MW) or Megavar (MVAR) amounts used in the RNA to quantify need. There are various combinations of resources and transmission upgrades that could meet the needs identified in the RNA. In addition, reconfiguration of transmission facilities and/or modifications to operating protocols identified in the solution phase could result in changes in or modification of the needs identified in the RNA.
This report is the second RNA2 prepared by the New York Independent System Operator. This document represents the second in a series of annual CRPP plans designed to
1 The development of long-term firm transmission rights will help enable long-term power supply arrangements and the development of resource additions. 2 The first RNA was entitled RNA 2005 while the second is entitled RNA 2007. This difference of two years is the result of a change in naming convention which adopts the first year of the study period as the identifier for the CRPP study year as opposed to the year the study assumptions are derived. This year’s CRPP used data derived from the 2006 Load and Capacity Data Book and other inputs developed in 2006, while last year’s CRPP was based upon data and inputs from 2005.
3/16/07 - NYISO Comprehensive Reliability Planning Process (CRPP) 2007 Reliability Needs Assessment 2
address the long-term reliability of the New York State bulk power system. The RNA consists of this document and the supporting documents and appendices.
Just as important as the electric system plan is the process of planning itself. Electric system planning is an ongoing process of evaluating, monitoring and updating as conditions warrant. In addition to addressing reliability, the CRPP is also designed to provide information that is both informative and of value to the New York wholesale electricity marketplace.
This report begins with a review of the reliability criteria, which are the basis for the needs assessment, followed by a summary of the first CRP. The needs assessment begins with a description of the study assumptions, RNA study case, and a general description of the methodology utilized to determine the needs. This discussion is followed by the needs assessment and scenarios. The report concludes with a reporting of the latest information available regarding historic congestion, which is provided to market place as part of the CRPP for informational purposes only.
3/16/07 - NYISO Comprehensive Reliability Planning Process (CRPP) 2007 Reliability Needs Assessment 3
2 Reliability Criteria The standard industry definition of bulk power system reliability is the degree to which the performance of the elements of that system (i.e., generation and transmission) results in power being delivered to consumers within accepted standards and in the amount desired. It may be measured by the frequency, duration, and magnitude of potentially adverse effects on consumer service.
Reliability consists of adequacy and security. Adequacy, which encompasses both generation and transmission adequacy, refers to the ability of the bulk power system to supply the aggregate requirements of consumers at all times, accounting for scheduled and unscheduled outages of system components. Security is the ability of the bulk power system to withstand disturbances such as electric short circuits or unanticipated loss of system components.
There are two different approaches to analyzing a bulk power system’s security and adequacy. Adequacy is a planning and probability concept. The New York State Power System is planned to meet an LOLE that is less than or equal to a involuntary load disconnection that is not more frequent than once in every 10 years, or 0.1 day per year. A system is adequate if the probability of having sufficient transmission and generation to meet expected demand is equal to or less than the system’s standard, which is expressed as a loss of load expectation (LOLE). This requirement forms the basis of New York’s installed capacity or resource adequacy requirement.
Security is an operating and deterministic concept. This means that possible events are identified as having significant adverse reliability consequences and the system is planned and operated so that the system can continue to serve load even if these events occur. Security requirements are sometimes referred to as N-1 or N-2. N is the number of system components; an N-1 requirement means that the system can withstand the loss of any one component without overloading any other components or before affecting service to consumers. Generally, the one component study reflects the largest single contingency.
3/16/07 - NYISO Comprehensive Reliability Planning Process (CRPP) 2007 Reliability Needs Assessment 4
3 Summary of the 2005 Comprehensive Reliability Plan The 2005 CRP was the first Comprehensive Reliability Plan prepared by the NYISO. The 2005 CRP was approved by the NYISO Management Committee and subsequently the NYISO Board of Directors in August of 2006. The 2005 CRP determined that the transmission owner plans and proposed solution to the identified needs would maintain the reliability of the New York State Bulk Power System (BPS) and presented the CRP findings, conclusions and recommendations:
Actions identified in the 2005 CRP that will maintain reliability of the BPS:
1. Defer retirement of the New York Power Authority’s Charles A. Poletti generating unit in Astoria, Queens for one year, from 2008 until 2009.
2. Deploy transmission projects, including upgrades, reactive resource additions and
capacity additions (466 MW); import 990 MW of generation from neighboring control areas committed to the New York Control Area (NYCA); and implement demand reduction programs (449 MW). This results in total resource additions of 1,905 MW through 2010.
3. The development of 1,200 MW of merchant generation, in particular, 950 MW in
New York City consisting of the 400 MW Astoria repowering project (NRG Power Marketing Inc.) and the 550 MW Oak Point Energy Center (Key-Span Ravenswood, LLC). It is important that generation equivalent to this 950 MW be in service in New York City no later than 2011. Also proposed for development is the 250 MW Spagnoli Energy Center on Long Island (Key-Span Ravenswood, LLC).
4. The planned resource additions noted above total 3,105 MW by 2015.
2005 CRP Findings, Conclusions and Recommendations:
1. The New York State Legislature should reinstate the Article X power plant siting law, which expired at the end of 2002. The lack of a project siting process could delay the construction and operation of new generation plants necessary for future system reliability needs.
2. The construction of planned resources and transmission upgrades must stay on
schedule. It is important for the NYISO, along with its stakeholders, to approve and deploy a process to monitor the viability of solutions and assess when regulatory solutions should be triggered.
3. The impact of fuel diversity on the power supply system should be continually
monitored. 4. New York must monitor its capacity markets to determine if they are competitive and
can attract enough investment to maintain system reliability.
3/16/07 - NYISO Comprehensive Reliability Planning Process (CRPP) 2007 Reliability Needs Assessment 5
5. The Comprehensive Reliability Planning Process must stay on schedule. Environmental factors that could lead to the retirement of generating units must be identified and addressed in the RNA and CRP.
6. Conforming New York’s reactive power planning and voltage control practices to the
best practices identified in the North American Electric Reliability Council’s (NERC) Blackout Recommendation 7a.
7. A review of NERC blackout recommendations related to voltage is also advisable.
3/16/07 - NYISO Comprehensive Reliability Planning Process (CRPP) 2007 Reliability Needs Assessment 6
4 RNA study case3 Assumptions, Drivers and Methodology for Determination of Needs
4.1 RNA study case system The NYISO established procedures and a schedule for the collection and submission of data and the preparation of the models used in the underlying studies that were performed during the Comprehensive Reliability Planning Process (CRPP) as defined in Attachment Y of the NYISO OATT.
The NYISO’s procedures were designed to allow the NYISO’s planning activities associated with the CRPP to be aligned with and coordinated with the related activities of NERC, NPCC, and other regional reliability organizations. The assumptions underlying the RNA were reviewed both at TPAS and ESPWG. The RNA study case consists of the Five Year Base Case and the second five years of the Study Period. The Five Year Base Case was developed based on the 2005 Annual Transmission Reliability Assessment (ATRA) base case, input from Market Participants, and a project screening procedure.
The NYISO developed the system representation for the second five years of the Study Period starting with the First Five Year Base Case and using (1) the most recent Load and Capacity Data Report published by the NYISO on its web site; (2) the most recent versions of NYISO reliability analyses and assessments provided for or published by NERC, NPCC, NYSRC, and Neighboring Control Areas; (3) information reported by neighboring control areas such as power flow data, forecasted load, significant new or modified generation and transmission facilities, and anticipated system conditions that the NYISO determines may impact the bulk-power transmission facilities; and (4) Market Participant input. Based on this process, the network model for the second five-year period incorporates TO and neighboring system plans not incorporated in the Five Year Base Case. In addition, the changes in the MW and MVAR load model resulting from load growth are incorporated. The load model reflected the load forecast from the 2006 Load and Capacity Data Report, also known as the “Gold Book”. The RNA study assumes that no additional market-based resources are added during the second five years of the Study Period.
The RNA study case model of the New York system for the 2007 RNA includes the following new and proposed facilities:
a. TO projects on non-bulk power facilities;
b. Facilities that have accepted their Attachment S cost allocations and are in service or under construction as of June, 2006;
c. Transmission upgrades related to any projects and facilities that are included in the RNA study case, as defined above.
3 The RNA study case consist of the Five Year Base Case and the second five years of the Study Period as defined in Section 4.3 of Attachment Y of the NYISO OATT.
3/16/07 - NYISO Comprehensive Reliability Planning Process (CRPP) 2007 Reliability Needs Assessment 7
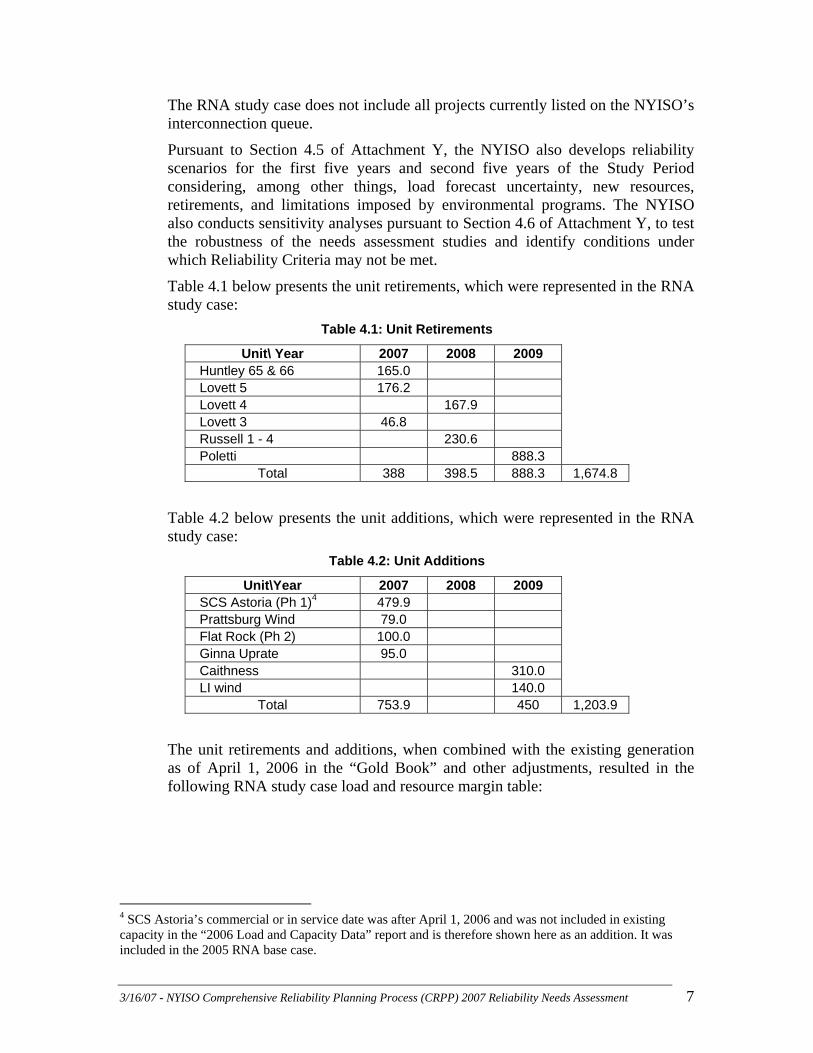
The RNA study case does not include all projects currently listed on the NYISO’s interconnection queue.
Pursuant to Section 4.5 of Attachment Y, the NYISO also develops reliability scenarios for the first five years and second five years of the Study Period considering, among other things, load forecast uncertainty, new resources, retirements, and limitations imposed by environmental programs. The NYISO also conducts sensitivity analyses pursuant to Section 4.6 of Attachment Y, to test the robustness of the needs assessment studies and identify conditions under which Reliability Criteria may not be met.
Table 4.1 below presents the unit retirements, which were represented in the RNA study case:
Table 4.1: Unit Retirements
Unit\ Year 2007 2008 2009 Huntley 65 & 66 165.0 Lovett 5 176.2 Lovett 4 167.9 Lovett 3 46.8 Russell 1 - 4 230.6 Poletti 888.3
Total 388 398.5 888.3 1,674.8
Table 4.2 below presents the unit additions, which were represented in the RNA study case:
Table 4.2: Unit Additions
Unit\Year 2007 2008 2009 SCS Astoria (Ph 1)4 479.9 Prattsburg Wind 79.0 Flat Rock (Ph 2) 100.0 Ginna Uprate 95.0 Caithness 310.0 LI wind 140.0
Total 753.9 450 1,203.9
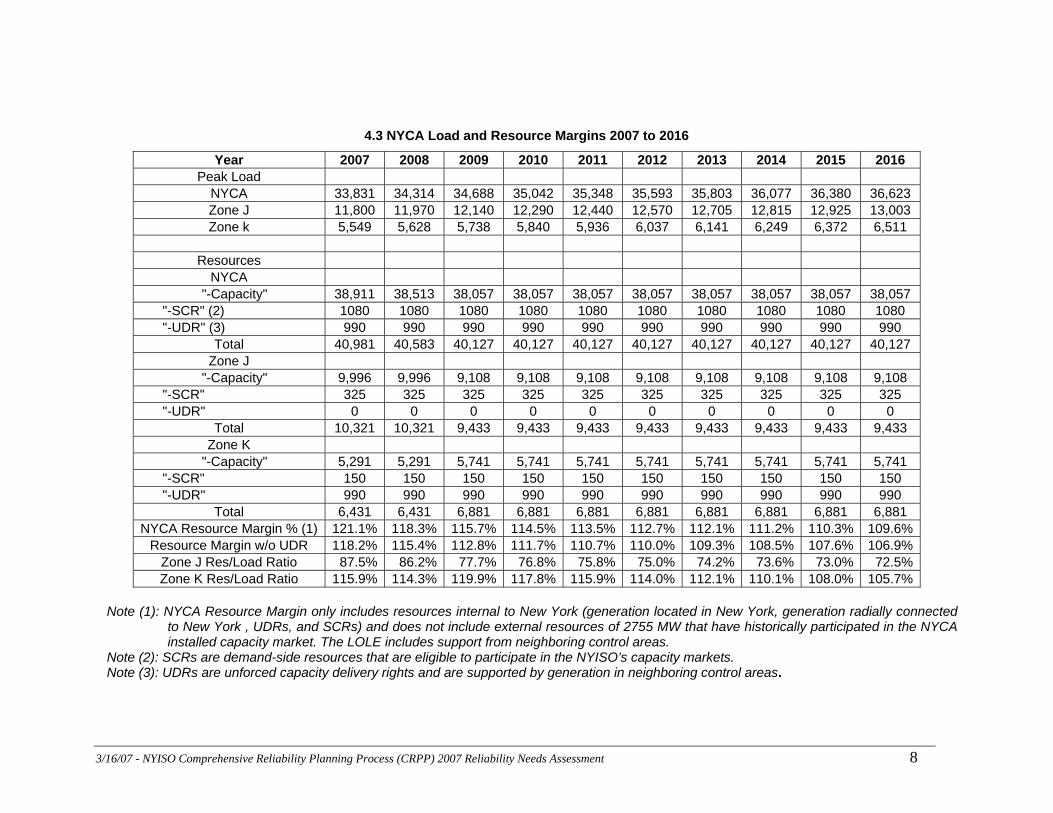
The unit retirements and additions, when combined with the existing generation as of April 1, 2006 in the “Gold Book” and other adjustments, resulted in the following RNA study case load and resource margin table:
4 SCS Astoria’s commercial or in service date was after April 1, 2006 and was not included in existing capacity in the “2006 Load and Capacity Data” report and is therefore shown here as an addition. It was included in the 2005 RNA base case.
3/16/07 - NYISO Comprehensive Reliability Planning Process (CRPP) 2007 Reliability Needs Assessment 8
4.3 NYCA Load and Resource Margins 2007 to 2016
Year 2007 2008 2009 2010 2011 2012 2013 2014 2015 2016 Peak Load
NYCA 33,831 34,314 34,688 35,042 35,348 35,593 35,803 36,077 36,380 36,623 Zone J 11,800 11,970 12,140 12,290 12,440 12,570 12,705 12,815 12,925 13,003 Zone k 5,549 5,628 5,738 5,840 5,936 6,037 6,141 6,249 6,372 6,511
Resources
NYCA "-Capacity" 38,911 38,513 38,057 38,057 38,057 38,057 38,057 38,057 38,057 38,057
"-SCR" (2) 1080 1080 1080 1080 1080 1080 1080 1080 1080 1080 "-UDR" (3) 990 990 990 990 990 990 990 990 990 990
Total 40,981 40,583 40,127 40,127 40,127 40,127 40,127 40,127 40,127 40,127 Zone J
"-Capacity" 9,996 9,996 9,108 9,108 9,108 9,108 9,108 9,108 9,108 9,108 "-SCR" 325 325 325 325 325 325 325 325 325 325 "-UDR" 0 0 0 0 0 0 0 0 0 0
Total 10,321 10,321 9,433 9,433 9,433 9,433 9,433 9,433 9,433 9,433 Zone K
"-Capacity" 5,291 5,291 5,741 5,741 5,741 5,741 5,741 5,741 5,741 5,741 "-SCR" 150 150 150 150 150 150 150 150 150 150 "-UDR" 990 990 990 990 990 990 990 990 990 990
Total 6,431 6,431 6,881 6,881 6,881 6,881 6,881 6,881 6,881 6,881 NYCA Resource Margin % (1) 121.1% 118.3% 115.7% 114.5% 113.5% 112.7% 112.1% 111.2% 110.3% 109.6%
Resource Margin w/o UDR 118.2% 115.4% 112.8% 111.7% 110.7% 110.0% 109.3% 108.5% 107.6% 106.9%Zone J Res/Load Ratio 87.5% 86.2% 77.7% 76.8% 75.8% 75.0% 74.2% 73.6% 73.0% 72.5%Zone K Res/Load Ratio 115.9% 114.3% 119.9% 117.8% 115.9% 114.0% 112.1% 110.1% 108.0% 105.7%
Note (1): NYCA Resource Margin only includes resources internal to New York (generation located in New York, generation radially connected
to New York , UDRs, and SCRs) and does not include external resources of 2755 MW that have historically participated in the NYCA installed capacity market. The LOLE includes support from neighboring control areas.
Note (2): SCRs are demand-side resources that are eligible to participate in the NYISO’s capacity markets. Note (3): UDRs are unforced capacity delivery rights and are supported by generation in neighboring control areas.
3/16/07 - NYISO Comprehensive Reliability Planning Process (CRPP) 2007 Reliability Needs Assessment 9
4.2 Methodology for the Determination of Needs The General Electric Multi-Area Reliability Simulation (GE-MARS) model was used to determine the year in which the loss-of-load criterion was violated and by what degree. Compensatory MWs were added to the system to resolve criteria violations, i.e., the Loss of Load Expectation (LOLE) of 0.1 days per year. As violations are found, compensatory MW needs for the NYCA were developed by adding generic 250 MW generating units to zones that are capable of addressing the needs based on a review of binding transmission constraints and zonal LOLE in an iterative process to determine when reliability criteria were satisfied. These additions were used to estimate the amount of resources generally needed to satisfy reliability needs. The additions are not intended to represent proposed solutions. Resource needs could potentially be met by many other combinations of resources in other areas including generation, transmission and demand side management. Due to the differing natures of supply and demand-side resources and transmission constraints, the amounts and locations of resources needed to match the level of compensatory MW needs identified will vary. In addition, resource needs could be met in part by transmission system reconfigurations that increase transfer limits, or by changes in operating protocols. Operating protocols could include such actions as using dynamic ratings for certain facilities, operating exceptions or special protection systems.
4.3 Short Circuit Analysis A short circuit analysis was performed for 2011 which showed no significant differences from the 2006 ATRA Class Year fault levels. A short circuit analysis was also conducted for 2016 for the maximum generation scenario. [See the Supporting Document for further details.]
3/16/07 - NYISO Comprehensive Reliability Planning Process (CRPP) 2007 Reliability Needs Assessment 10
5 Reliability Needs
5.1 Introduction This reliability needs assessment for the New York State bulk-power system using the RNA study case indicates that the forecasted system exceeds the 0.1 days per year reliability criteria starting in the year 2011 with 2010 just meeting the 0.1 days per year criteria. Continued load growth with only transmission additions, increases the deficiency well above 0.1 for the years 2012 through 2016 of the ten-year Study Period. This year’s RNA builds upon the NYISO’s first CRP, which included major resource and transmission system additions in load Zones G through K. These additions have been incorporated into the ten-year RNA study case. These additions have had major impact on the RNA 2007 finding of need, in particular, for load Zone K. In this RNA the NYISO has assumed a reasonable projection of load growth but has not included any capacity or demand-side resource assumptions beyond the Five Year Base Case.
Load growth over the last several years in excess of two percent per year in load Zones G through K has resulted in increasing demands being placed on the transmission system to meet capacity and energy needs in this area. By 2011, the NYCA load forecast estimates that approximately two thirds of the NYCA load will be located in load Zones G through K which is downstream of the UPNY – SENY5 transmission interface. In addition, approximately 52% of the NYCA load will be located in load Zones J and K, downstream of the Dunwoodie-South transmission interface, which is a slight increase from current load levels.
The demands that are increasingly being placed on the transmission system in conjunction with other system changes, consisting primarily of generating unit retirements listed in Table 3.1, load growth, neighboring system changes and the lack of new capacity or transmission resources downstream of the UPNY-SENY interface, have and will continue to result in voltage criteria violations at much lower transfer levels than have previously occurred The result is that over time, transfers into and through SENY will increasingly be limited by voltage constraints, rather than thermal constraints. This reduced capability of the bulk power system to make power transfers into SENY due to these voltage constraints, coupled with continuing load growth in SENY results in a resource adequacy criterion violation by 2011. Below are the principal findings of the Reliability Needs Assessment:
5.2 Reliability Needs
5.2.1 RNA Study Case: The RNA study case refers to the entire ten years of the Study Period encompassing the Five Year Base Case and the second five years. The
5 UPNY or Upstate New York is defined as load Zones A through F while SENY or Southeast New York is defined as load Zones G through K
3/16/07 - NYISO Comprehensive Reliability Planning Process (CRPP) 2007 Reliability Needs Assessment 11
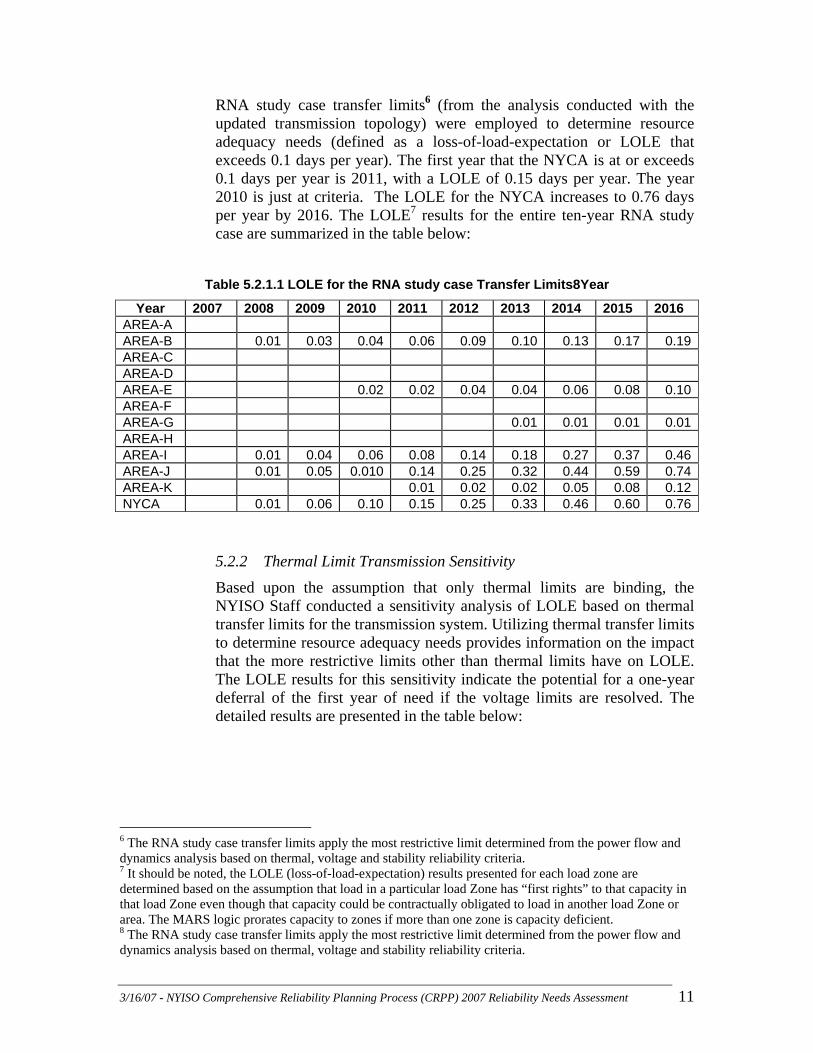
RNA study case transfer limits6 (from the analysis conducted with the updated transmission topology) were employed to determine resource adequacy needs (defined as a loss-of-load-expectation or LOLE that exceeds 0.1 days per year). The first year that the NYCA is at or exceeds 0.1 days per year is 2011, with a LOLE of 0.15 days per year. The year 2010 is just at criteria. The LOLE for the NYCA increases to 0.76 days per year by 2016. The LOLE7 results for the entire ten-year RNA study case are summarized in the table below:
Table 5.2.1.1 LOLE for the RNA study case Transfer Limits8Year
Year 2007 2008 2009 2010 2011 2012 2013 2014 2015 2016 AREA-A AREA-B 0.01 0.03 0.04 0.06 0.09 0.10 0.13 0.17 0.19AREA-C AREA-D AREA-E 0.02 0.02 0.04 0.04 0.06 0.08 0.10AREA-F AREA-G 0.01 0.01 0.01 0.01AREA-H AREA-I 0.01 0.04 0.06 0.08 0.14 0.18 0.27 0.37 0.46AREA-J 0.01 0.05 0.010 0.14 0.25 0.32 0.44 0.59 0.74AREA-K 0.01 0.02 0.02 0.05 0.08 0.12NYCA 0.01 0.06 0.10 0.15 0.25 0.33 0.46 0.60 0.76
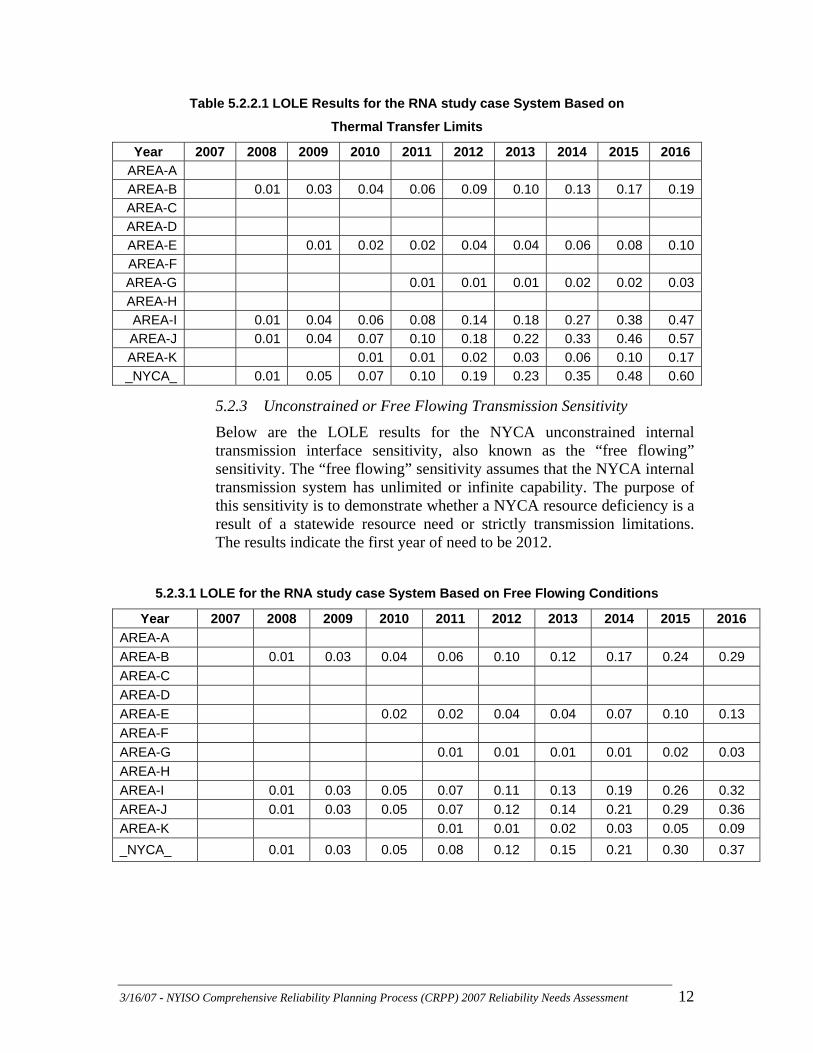
5.2.2 Thermal Limit Transmission Sensitivity Based upon the assumption that only thermal limits are binding, the NYISO Staff conducted a sensitivity analysis of LOLE based on thermal transfer limits for the transmission system. Utilizing thermal transfer limits to determine resource adequacy needs provides information on the impact that the more restrictive limits other than thermal limits have on LOLE. The LOLE results for this sensitivity indicate the potential for a one-year deferral of the first year of need if the voltage limits are resolved. The detailed results are presented in the table below:
6 The RNA study case transfer limits apply the most restrictive limit determined from the power flow and dynamics analysis based on thermal, voltage and stability reliability criteria. 7 It should be noted, the LOLE (loss-of-load-expectation) results presented for each load zone are determined based on the assumption that load in a particular load Zone has “first rights” to that capacity in that load Zone even though that capacity could be contractually obligated to load in another load Zone or area. The MARS logic prorates capacity to zones if more than one zone is capacity deficient. 8 The RNA study case transfer limits apply the most restrictive limit determined from the power flow and dynamics analysis based on thermal, voltage and stability reliability criteria.
3/16/07 - NYISO Comprehensive Reliability Planning Process (CRPP) 2007 Reliability Needs Assessment 12
Table 5.2.2.1 LOLE Results for the RNA study case System Based on
Thermal Transfer Limits
Year 2007 2008 2009 2010 2011 2012 2013 2014 2015 2016 AREA-A AREA-B 0.01 0.03 0.04 0.06 0.09 0.10 0.13 0.17 0.19AREA-C AREA-D AREA-E 0.01 0.02 0.02 0.04 0.04 0.06 0.08 0.10AREA-F AREA-G 0.01 0.01 0.01 0.02 0.02 0.03AREA-H AREA-I 0.01 0.04 0.06 0.08 0.14 0.18 0.27 0.38 0.47AREA-J 0.01 0.04 0.07 0.10 0.18 0.22 0.33 0.46 0.57AREA-K 0.01 0.01 0.02 0.03 0.06 0.10 0.17_NYCA_ 0.01 0.05 0.07 0.10 0.19 0.23 0.35 0.48 0.60
5.2.3 Unconstrained or Free Flowing Transmission Sensitivity Below are the LOLE results for the NYCA unconstrained internal transmission interface sensitivity, also known as the “free flowing” sensitivity. The “free flowing” sensitivity assumes that the NYCA internal transmission system has unlimited or infinite capability. The purpose of this sensitivity is to demonstrate whether a NYCA resource deficiency is a result of a statewide resource need or strictly transmission limitations. The results indicate the first year of need to be 2012.
5.2.3.1 LOLE for the RNA study case System Based on Free Flowing Conditions
Year 2007 2008 2009 2010 2011 2012 2013 2014 2015 2016 AREA-A AREA-B 0.01 0.03 0.04 0.06 0.10 0.12 0.17 0.24 0.29 AREA-C AREA-D AREA-E 0.02 0.02 0.04 0.04 0.07 0.10 0.13 AREA-F AREA-G 0.01 0.01 0.01 0.01 0.02 0.03 AREA-H AREA-I 0.01 0.03 0.05 0.07 0.11 0.13 0.19 0.26 0.32 AREA-J 0.01 0.03 0.05 0.07 0.12 0.14 0.21 0.29 0.36 AREA-K 0.01 0.01 0.02 0.03 0.05 0.09 _NYCA_ 0.01 0.03 0.05 0.08 0.12 0.15 0.21 0.30 0.37
3/16/07 - NYISO Comprehensive Reliability Planning Process (CRPP) 2007 Reliability Needs Assessment 13
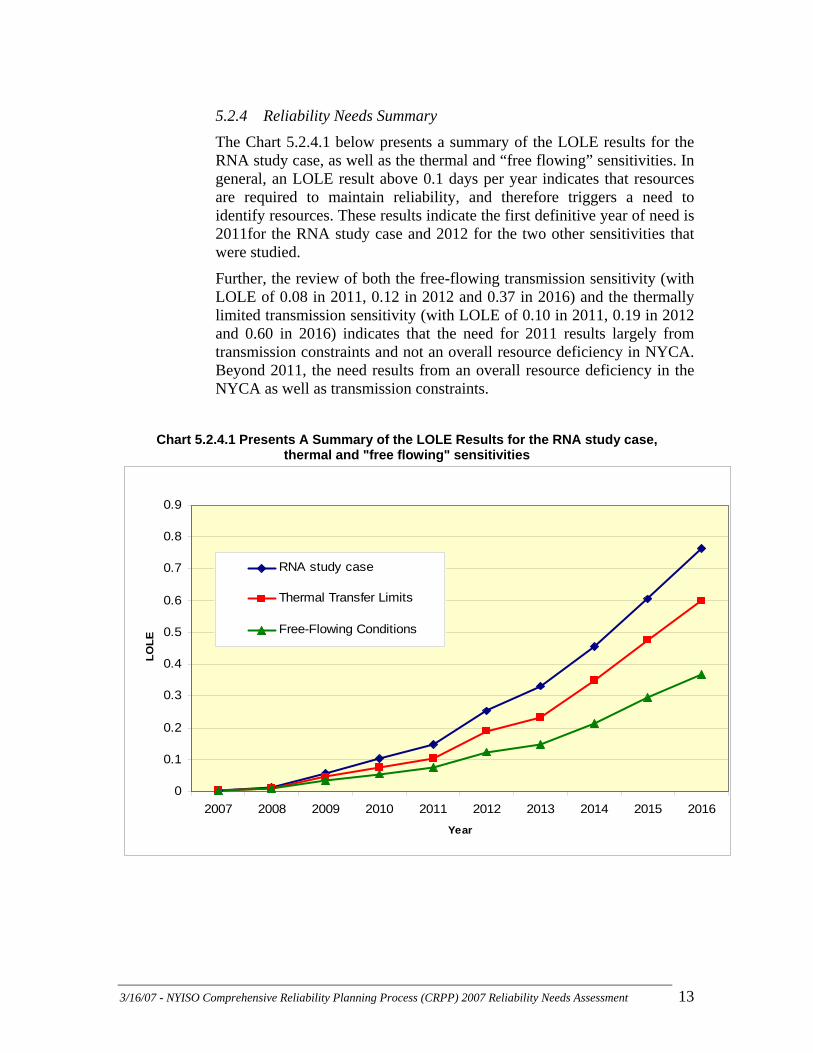
5.2.4 Reliability Needs Summary The Chart 5.2.4.1 below presents a summary of the LOLE results for the RNA study case, as well as the thermal and “free flowing” sensitivities. In general, an LOLE result above 0.1 days per year indicates that resources are required to maintain reliability, and therefore triggers a need to identify resources. These results indicate the first definitive year of need is 2011for the RNA study case and 2012 for the two other sensitivities that were studied.
Further, the review of both the free-flowing transmission sensitivity (with LOLE of 0.08 in 2011, 0.12 in 2012 and 0.37 in 2016) and the thermally limited transmission sensitivity (with LOLE of 0.10 in 2011, 0.19 in 2012 and 0.60 in 2016) indicates that the need for 2011 results largely from transmission constraints and not an overall resource deficiency in NYCA. Beyond 2011, the need results from an overall resource deficiency in the NYCA as well as transmission constraints.
Chart 5.2.4.1 Presents A Summary of the LOLE Results for the RNA study case,
thermal and "free flowing" sensitivities
0
0.1
0.2
0.3
0.4
0.5
0.6
0.7
0.8
0.9
2007 2008 2009 2010 2011 2012 2013 2014 2015 2016Year
LOLE
RNA study case
Thermal Transfer Limits
Free-Flowing Conditions
3/16/07 - NYISO Comprehensive Reliability Planning Process (CRPP) 2007 Reliability Needs Assessment 14
5.3 Compensatory MWs After the reliability needs are initially identified as deficiencies in reliability criteria, the NYISO translated those deficiencies into compensatory MWs that could satisfy the needs. This translation provides further information to the marketplace on the magnitude of the resources that are required to meet bulk power system reliability needs. The NYISO is providing these calculations for illustrative purposes only. It is not meant to reflect specific facilities or types of resources that may be offered as solutions to reliability needs. Accordingly, compensatory MWs may reflect either capacity, demand management or transmission additions. For this analysis, the amount and effective location of the compensatory MWs is determined by testing combinations of generic 250 MW combined cycle generating units located in various load Zones until the NYCA LOLE is reduced to 0.1 days per year or less. A unit size of 250 MWs was chosen because this unit size is consistent with nominal power rating of combined cycle unit power blocks that have been observed in practice and provides reasonable step sizes for simulation purposes. It is also recognized that solutions such as combustion turbine generating units and demand-side management solutions can be added in much smaller increments.
The results of the MARS simulations for the RNA study case transfer limit sensitivities, and scenario assessments provide information that can be used to guide the compensatory MWs analyses. It should be noted that there may be other combinations of compensatory MWs that would also meet the statewide reliability criteria. It is not the intent of this analysis to identify preferred locations or combinations for potential solutions. In addition to the zonal LOLEs, the MARS simulation reports what interfaces are constraining and the frequency of the constraint. From this information, it can be determined whether the LOLE violation is driven more by capacity deficiencies or transmission system transfer constraints. If the compensatory MWs are upstream of a load zone with an LOLE violation that is to some extent caused by a frequently constrained interface, the compensatory MWs will be less effective in reducing the zonal LOLE.
To reduce the LOLE to below the 0.1 days per year criterion in 2011 requires compensatory MWs to be located in load Zones G through J, which are below the UPNY – SENY interface. In general and also because of the modeling of the availability of the cables feeding load Zones J and K, locating compensatory MWs downstream of the Dunwoodie-South interface particularly in load Zone J is generally more effective in meeting LOLE requirements. However, MARS simulation shows that load Zone K export capability is being fully utilized to provide assistance to the Lower Hudson Valley and New York City, and would not be an effective location for compensatory MWs without additional transmission.
Resource additions to meet the reliability needs in 2011 were evaluated by adding either one 250 MW unit in load Zone J (A1 in the table below) or two 250 MW units for a total of 500 MWs in G (A2 in the table below). The exact location of the resource additions, whether in load Zones G through J or a combination thereof, impacts the level of compensatory MWs required. The compensatory
3/16/07 - NYISO Comprehensive Reliability Planning Process (CRPP) 2007 Reliability Needs Assessment 15
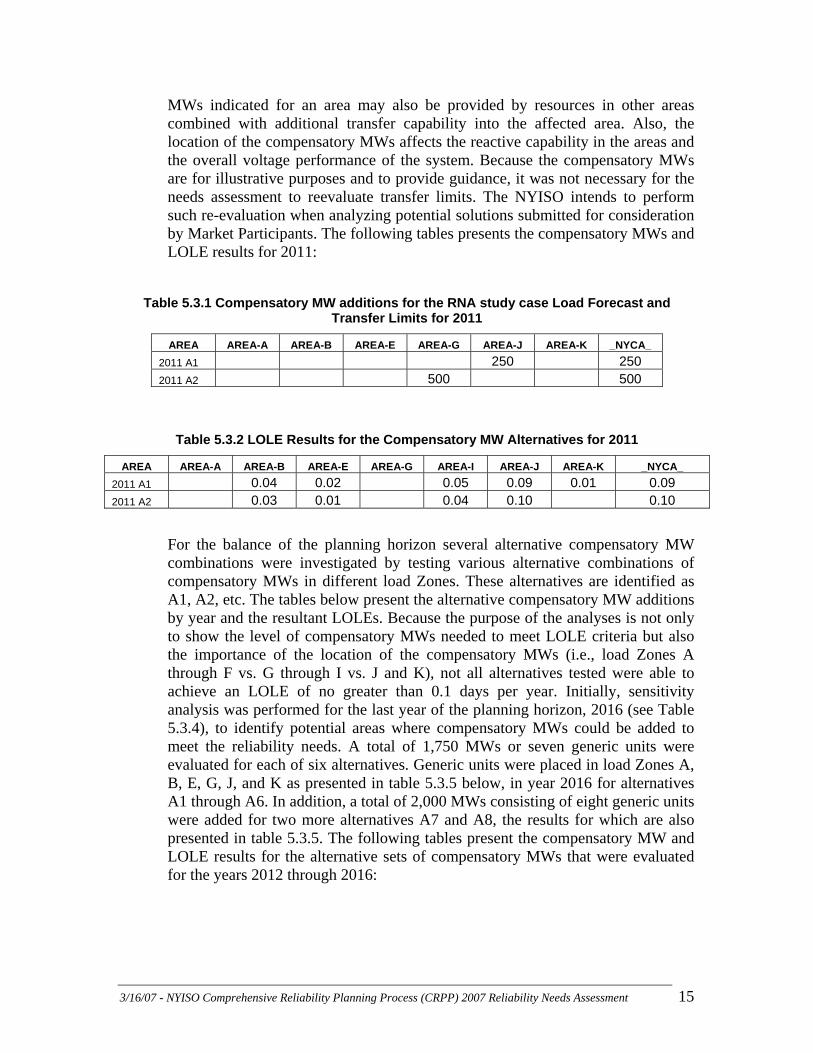
MWs indicated for an area may also be provided by resources in other areas combined with additional transfer capability into the affected area. Also, the location of the compensatory MWs affects the reactive capability in the areas and the overall voltage performance of the system. Because the compensatory MWs are for illustrative purposes and to provide guidance, it was not necessary for the needs assessment to reevaluate transfer limits. The NYISO intends to perform such re-evaluation when analyzing potential solutions submitted for consideration by Market Participants. The following tables presents the compensatory MWs and LOLE results for 2011:
Table 5.3.1 Compensatory MW additions for the RNA study case Load Forecast and
Transfer Limits for 2011
AREA AREA-A AREA-B AREA-E AREA-G AREA-J AREA-K _NYCA_ 2011 A1 250 250 2011 A2 500 500
Table 5.3.2 LOLE Results for the Compensatory MW Alternatives for 2011
AREA AREA-A AREA-B AREA-E AREA-G AREA-I AREA-J AREA-K _NYCA_ 2011 A1 0.04 0.02 0.05 0.09 0.01 0.09 2011 A2 0.03 0.01 0.04 0.10 0.10
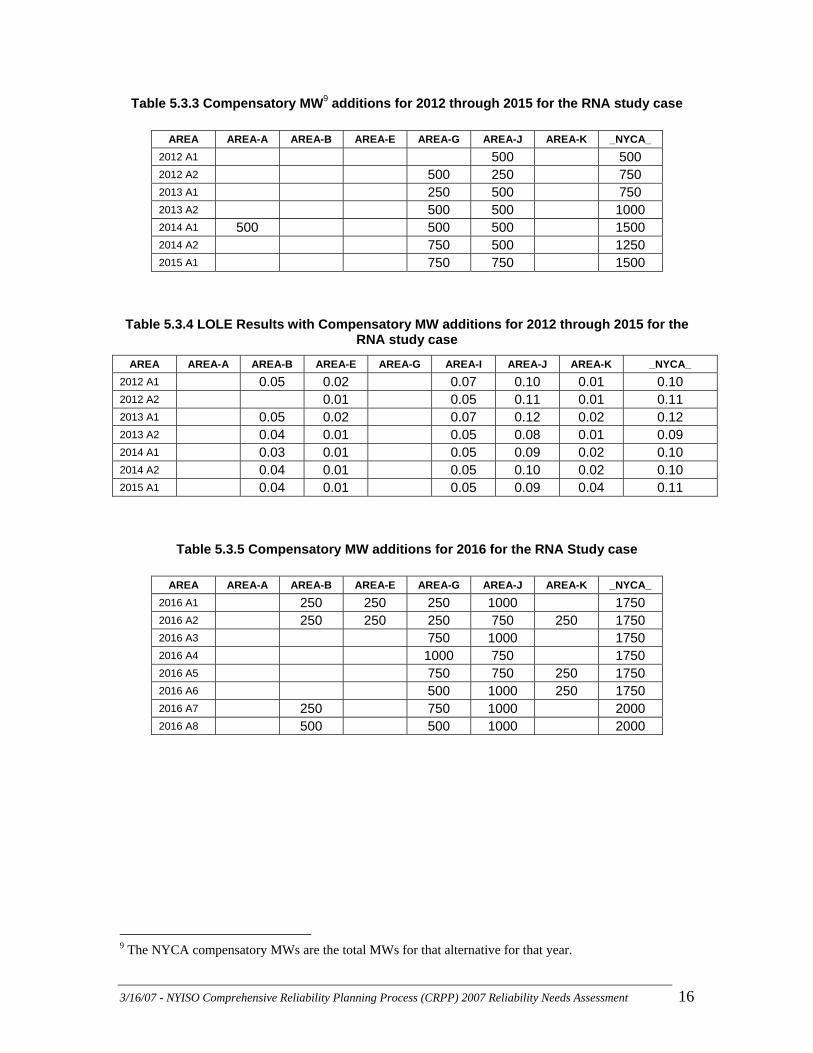
For the balance of the planning horizon several alternative compensatory MW combinations were investigated by testing various alternative combinations of compensatory MWs in different load Zones. These alternatives are identified as A1, A2, etc. The tables below present the alternative compensatory MW additions by year and the resultant LOLEs. Because the purpose of the analyses is not only to show the level of compensatory MWs needed to meet LOLE criteria but also the importance of the location of the compensatory MWs (i.e., load Zones A through F vs. G through I vs. J and K), not all alternatives tested were able to achieve an LOLE of no greater than 0.1 days per year. Initially, sensitivity analysis was performed for the last year of the planning horizon, 2016 (see Table 5.3.4), to identify potential areas where compensatory MWs could be added to meet the reliability needs. A total of 1,750 MWs or seven generic units were evaluated for each of six alternatives. Generic units were placed in load Zones A, B, E, G, J, and K as presented in table 5.3.5 below, in year 2016 for alternatives A1 through A6. In addition, a total of 2,000 MWs consisting of eight generic units were added for two more alternatives A7 and A8, the results for which are also presented in table 5.3.5. The following tables present the compensatory MW and LOLE results for the alternative sets of compensatory MWs that were evaluated for the years 2012 through 2016:
3/16/07 - NYISO Comprehensive Reliability Planning Process (CRPP) 2007 Reliability Needs Assessment 16
Table 5.3.3 Compensatory MW9 additions for 2012 through 2015 for the RNA study case
Table 5.3.4 LOLE Results with Compensatory MW additions for 2012 through 2015 for the RNA study case
AREA AREA-A AREA-B AREA-E AREA-G AREA-I AREA-J AREA-K _NYCA_ 2012 A1 0.05 0.02 0.07 0.10 0.01 0.10 2012 A2 0.01 0.05 0.11 0.01 0.11 2013 A1 0.05 0.02 0.07 0.12 0.02 0.12 2013 A2 0.04 0.01 0.05 0.08 0.01 0.09 2014 A1 0.03 0.01 0.05 0.09 0.02 0.10 2014 A2 0.04 0.01 0.05 0.10 0.02 0.10 2015 A1 0.04 0.01 0.05 0.09 0.04 0.11
Table 5.3.5 Compensatory MW additions for 2016 for the RNA Study case
9 The NYCA compensatory MWs are the total MWs for that alternative for that year.
AREA AREA-A AREA-B AREA-E AREA-G AREA-J AREA-K _NYCA_ 2012 A1 500 500 2012 A2 500 250 750 2013 A1 250 500 750 2013 A2 500 500 1000 2014 A1 500 500 500 1500 2014 A2 750 500 1250 2015 A1 750 750 1500
AREA AREA-A AREA-B AREA-E AREA-G AREA-J AREA-K _NYCA_ 2016 A1 250 250 250 1000 1750 2016 A2 250 250 250 750 250 1750 2016 A3 750 1000 1750 2016 A4 1000 750 1750 2016 A5 750 750 250 1750 2016 A6 500 1000 250 1750 2016 A7 250 750 1000 2000 2016 A8 500 500 1000 2000
3/16/07 - NYISO Comprehensive Reliability Planning Process (CRPP) 2007 Reliability Needs Assessment 17
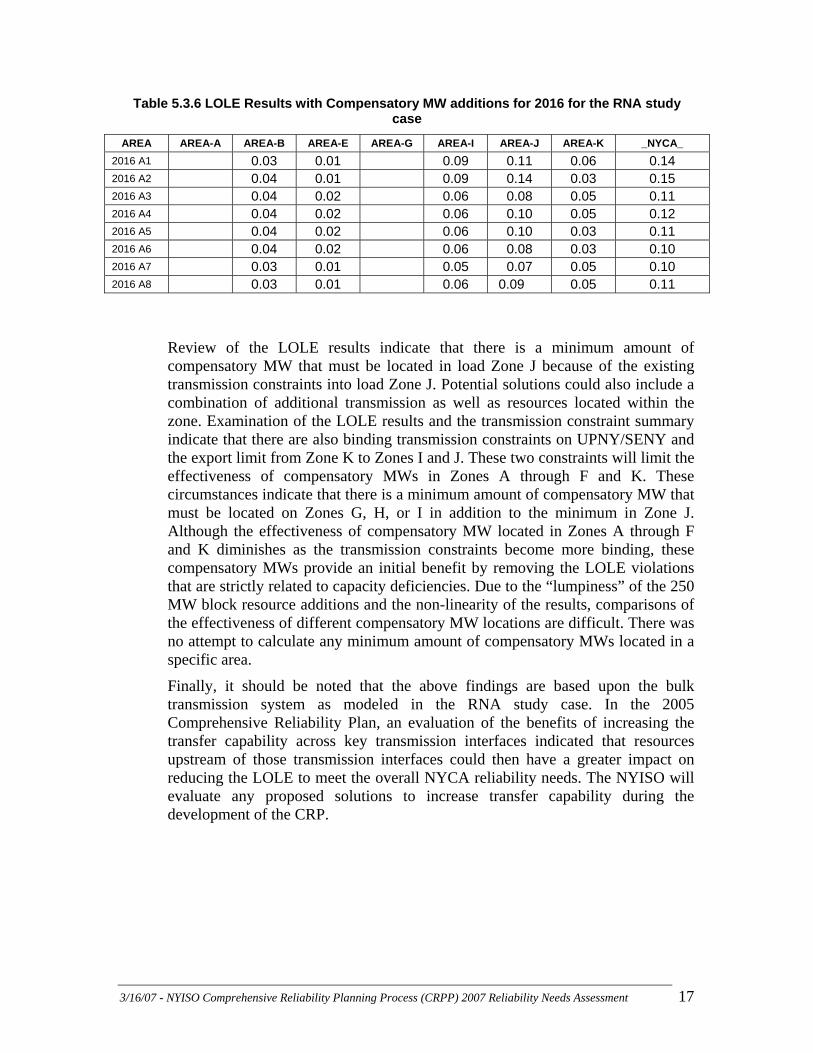
Table 5.3.6 LOLE Results with Compensatory MW additions for 2016 for the RNA study case
AREA AREA-A AREA-B AREA-E AREA-G AREA-I AREA-J AREA-K _NYCA_ 2016 A1 0.03 0.01 0.09 0.11 0.06 0.14 2016 A2 0.04 0.01 0.09 0.14 0.03 0.15 2016 A3 0.04 0.02 0.06 0.08 0.05 0.11 2016 A4 0.04 0.02 0.06 0.10 0.05 0.12 2016 A5 0.04 0.02 0.06 0.10 0.03 0.11 2016 A6 0.04 0.02 0.06 0.08 0.03 0.10 2016 A7 0.03 0.01 0.05 0.07 0.05 0.10 2016 A8 0.03 0.01 0.06 0.09 0.05 0.11
Review of the LOLE results indicate that there is a minimum amount of compensatory MW that must be located in load Zone J because of the existing transmission constraints into load Zone J. Potential solutions could also include a combination of additional transmission as well as resources located within the zone. Examination of the LOLE results and the transmission constraint summary indicate that there are also binding transmission constraints on UPNY/SENY and the export limit from Zone K to Zones I and J. These two constraints will limit the effectiveness of compensatory MWs in Zones A through F and K. These circumstances indicate that there is a minimum amount of compensatory MW that must be located on Zones G, H, or I in addition to the minimum in Zone J. Although the effectiveness of compensatory MW located in Zones A through F and K diminishes as the transmission constraints become more binding, these compensatory MWs provide an initial benefit by removing the LOLE violations that are strictly related to capacity deficiencies. Due to the “lumpiness” of the 250 MW block resource additions and the non-linearity of the results, comparisons of the effectiveness of different compensatory MW locations are difficult. There was no attempt to calculate any minimum amount of compensatory MWs located in a specific area.
Finally, it should be noted that the above findings are based upon the bulk transmission system as modeled in the RNA study case. In the 2005 Comprehensive Reliability Plan, an evaluation of the benefits of increasing the transfer capability across key transmission interfaces indicated that resources upstream of those transmission interfaces could then have a greater impact on reducing the LOLE to meet the overall NYCA reliability needs. The NYISO will evaluate any proposed solutions to increase transfer capability during the development of the CRP.
3/16/07 - NYISO Comprehensive Reliability Planning Process (CRPP) 2007 Reliability Needs Assessment 18
5.4 Scenarios Scenarios are variations on key assumptions in the RNA study case to assess the impact of possible changes in circumstances that could impact the RNA. The following scenarios were evaluated as part of the RNA.
5.4.1 Load Forecast Uncertainty - High Load Forecast
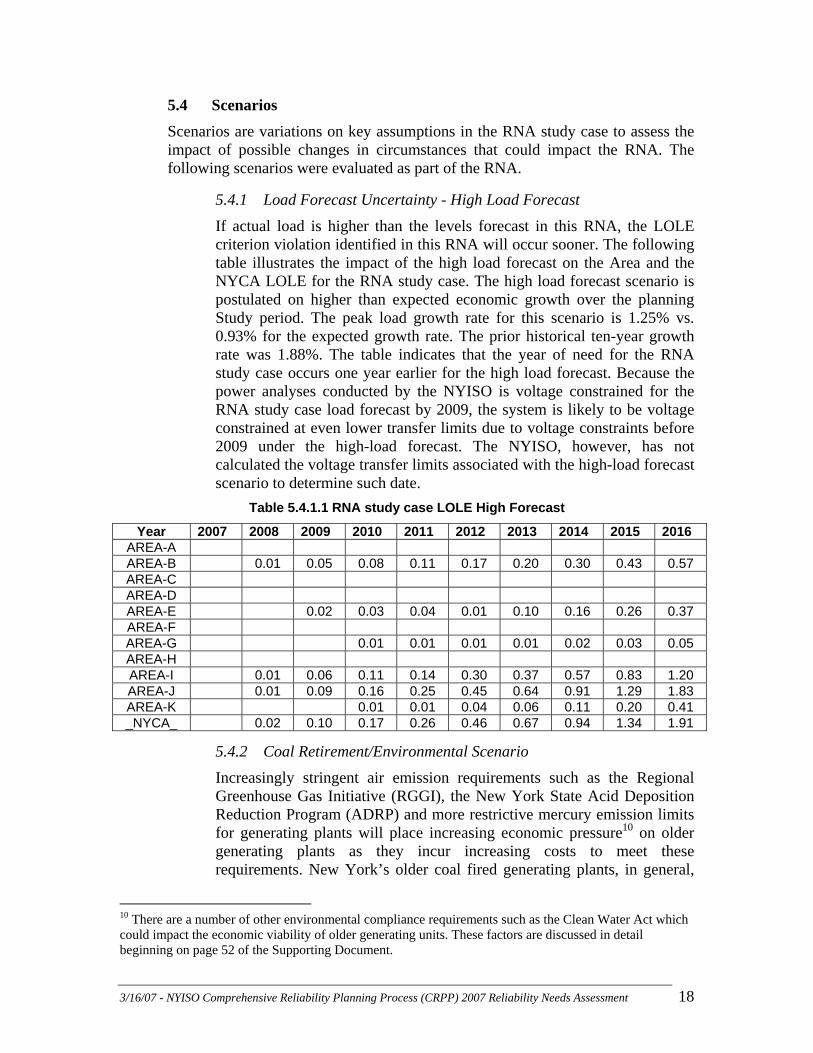
If actual load is higher than the levels forecast in this RNA, the LOLE criterion violation identified in this RNA will occur sooner. The following table illustrates the impact of the high load forecast on the Area and the NYCA LOLE for the RNA study case. The high load forecast scenario is postulated on higher than expected economic growth over the planning Study period. The peak load growth rate for this scenario is 1.25% vs. 0.93% for the expected growth rate. The prior historical ten-year growth rate was 1.88%. The table indicates that the year of need for the RNA study case occurs one year earlier for the high load forecast. Because the power analyses conducted by the NYISO is voltage constrained for the RNA study case load forecast by 2009, the system is likely to be voltage constrained at even lower transfer limits due to voltage constraints before 2009 under the high-load forecast. The NYISO, however, has not calculated the voltage transfer limits associated with the high-load forecast scenario to determine such date.
Table 5.4.1.1 RNA study case LOLE High Forecast
Year 2007 2008 2009 2010 2011 2012 2013 2014 2015 2016 AREA-A AREA-B 0.01 0.05 0.08 0.11 0.17 0.20 0.30 0.43 0.57 AREA-C AREA-D AREA-E 0.02 0.03 0.04 0.01 0.10 0.16 0.26 0.37 AREA-F AREA-G 0.01 0.01 0.01 0.01 0.02 0.03 0.05 AREA-H AREA-I 0.01 0.06 0.11 0.14 0.30 0.37 0.57 0.83 1.20 AREA-J 0.01 0.09 0.16 0.25 0.45 0.64 0.91 1.29 1.83 AREA-K 0.01 0.01 0.04 0.06 0.11 0.20 0.41 _NYCA_ 0.02 0.10 0.17 0.26 0.46 0.67 0.94 1.34 1.91
5.4.2 Coal Retirement/Environmental Scenario Increasingly stringent air emission requirements such as the Regional Greenhouse Gas Initiative (RGGI), the New York State Acid Deposition Reduction Program (ADRP) and more restrictive mercury emission limits for generating plants will place increasing economic pressure10 on older generating plants as they incur increasing costs to meet these requirements. New York’s older coal fired generating plants, in general,
10 There are a number of other environmental compliance requirements such as the Clean Water Act which could impact the economic viability of older generating units. These factors are discussed in detail beginning on page 52 of the Supporting Document.
3/16/07 - NYISO Comprehensive Reliability Planning Process (CRPP) 2007 Reliability Needs Assessment 19
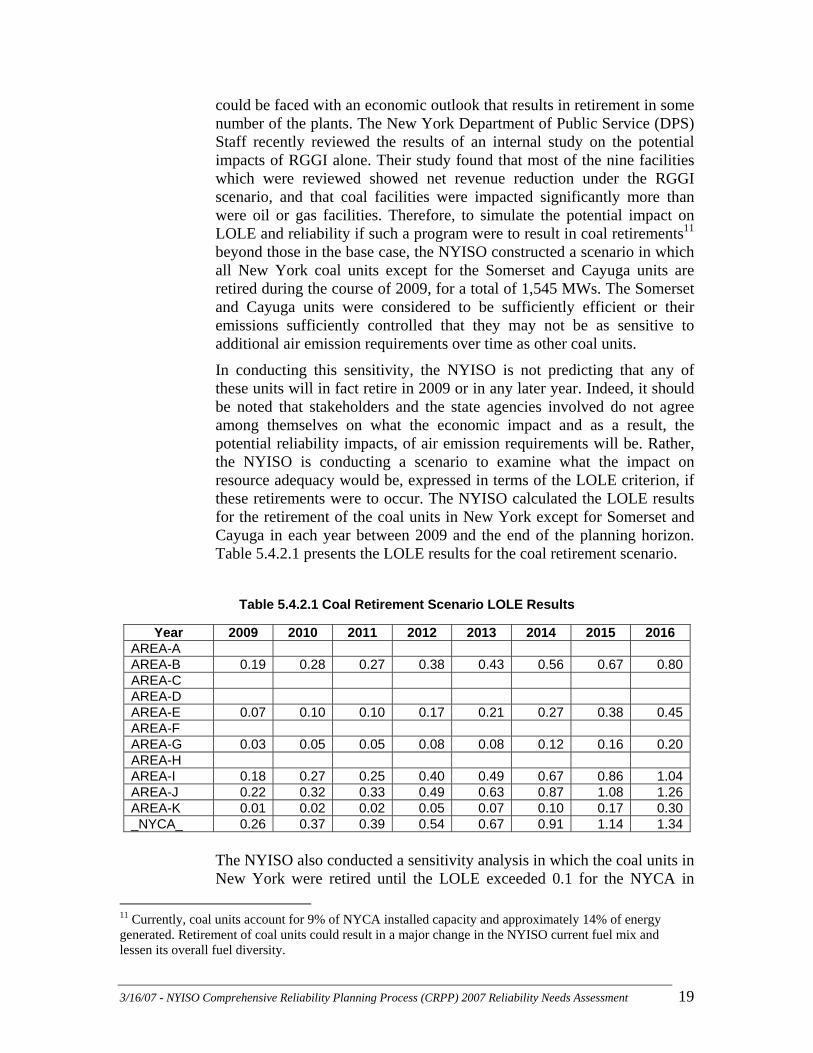
could be faced with an economic outlook that results in retirement in some number of the plants. The New York Department of Public Service (DPS) Staff recently reviewed the results of an internal study on the potential impacts of RGGI alone. Their study found that most of the nine facilities which were reviewed showed net revenue reduction under the RGGI scenario, and that coal facilities were impacted significantly more than were oil or gas facilities. Therefore, to simulate the potential impact on LOLE and reliability if such a program were to result in coal retirements11 beyond those in the base case, the NYISO constructed a scenario in which all New York coal units except for the Somerset and Cayuga units are retired during the course of 2009, for a total of 1,545 MWs. The Somerset and Cayuga units were considered to be sufficiently efficient or their emissions sufficiently controlled that they may not be as sensitive to additional air emission requirements over time as other coal units.
In conducting this sensitivity, the NYISO is not predicting that any of these units will in fact retire in 2009 or in any later year. Indeed, it should be noted that stakeholders and the state agencies involved do not agree among themselves on what the economic impact and as a result, the potential reliability impacts, of air emission requirements will be. Rather, the NYISO is conducting a scenario to examine what the impact on resource adequacy would be, expressed in terms of the LOLE criterion, if these retirements were to occur. The NYISO calculated the LOLE results for the retirement of the coal units in New York except for Somerset and Cayuga in each year between 2009 and the end of the planning horizon. Table 5.4.2.1 presents the LOLE results for the coal retirement scenario.
Table 5.4.2.1 Coal Retirement Scenario LOLE Results
The NYISO also conducted a sensitivity analysis in which the coal units in New York were retired until the LOLE exceeded 0.1 for the NYCA in
11 Currently, coal units account for 9% of NYCA installed capacity and approximately 14% of energy generated. Retirement of coal units could result in a major change in the NYISO current fuel mix and lessen its overall fuel diversity.
Year 2009 2010 2011 2012 2013 2014 2015 2016 AREA-A AREA-B 0.19 0.28 0.27 0.38 0.43 0.56 0.67 0.80AREA-C AREA-D AREA-E 0.07 0.10 0.10 0.17 0.21 0.27 0.38 0.45AREA-F AREA-G 0.03 0.05 0.05 0.08 0.08 0.12 0.16 0.20AREA-H AREA-I 0.18 0.27 0.25 0.40 0.49 0.67 0.86 1.04AREA-J 0.22 0.32 0.33 0.49 0.63 0.87 1.08 1.26AREA-K 0.01 0.02 0.02 0.05 0.07 0.10 0.17 0.30_NYCA_ 0.26 0.37 0.39 0.54 0.67 0.91 1.14 1.34
3/16/07 - NYISO Comprehensive Reliability Planning Process (CRPP) 2007 Reliability Needs Assessment 20
2009. Depending on the location, approximately 400 and 600 MW of coal retirements in 2009 resulted in an LOLE that exceeded 0.1 days per year.
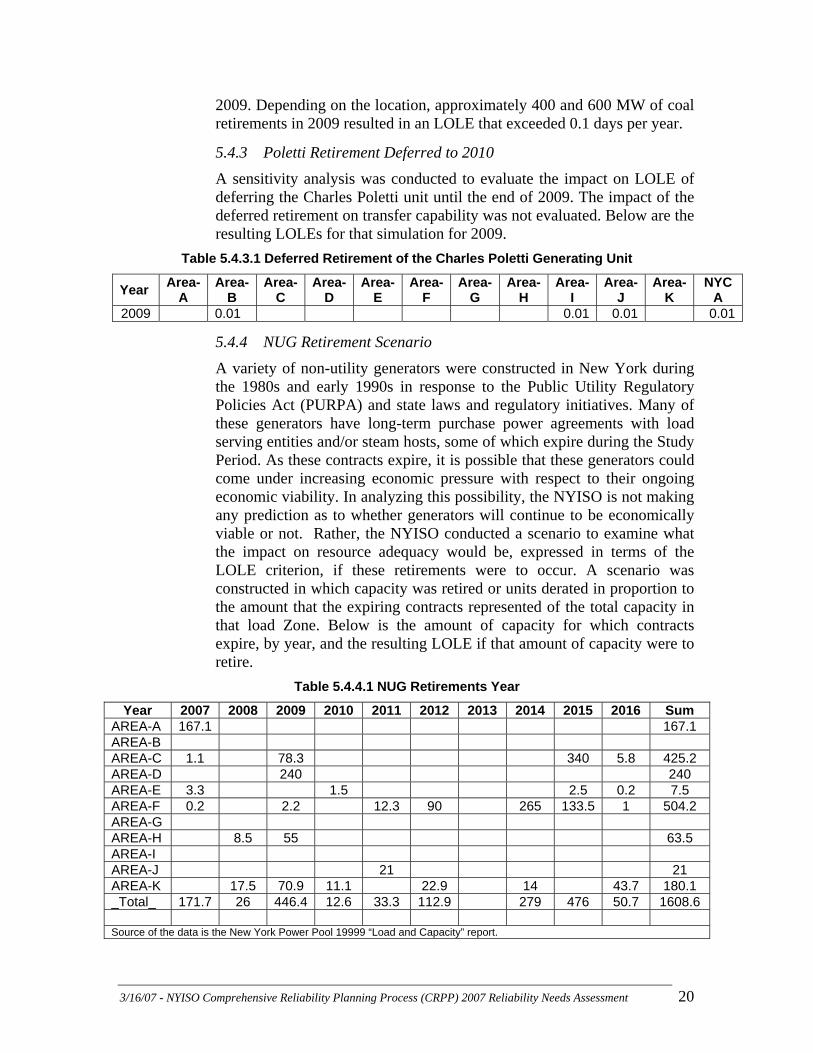
5.4.3 Poletti Retirement Deferred to 2010 A sensitivity analysis was conducted to evaluate the impact on LOLE of deferring the Charles Poletti unit until the end of 2009. The impact of the deferred retirement on transfer capability was not evaluated. Below are the resulting LOLEs for that simulation for 2009.
Table 5.4.3.1 Deferred Retirement of the Charles Poletti Generating Unit
Year Area-A
Area-B
Area-C
Area-D
Area-E
Area-F
Area-G
Area-H
Area-I
Area-J
Area-K
NYCA
2009 0.01 0.01 0.01 0.01
5.4.4 NUG Retirement Scenario A variety of non-utility generators were constructed in New York during the 1980s and early 1990s in response to the Public Utility Regulatory Policies Act (PURPA) and state laws and regulatory initiatives. Many of these generators have long-term purchase power agreements with load serving entities and/or steam hosts, some of which expire during the Study Period. As these contracts expire, it is possible that these generators could come under increasing economic pressure with respect to their ongoing economic viability. In analyzing this possibility, the NYISO is not making any prediction as to whether generators will continue to be economically viable or not. Rather, the NYISO conducted a scenario to examine what the impact on resource adequacy would be, expressed in terms of the LOLE criterion, if these retirements were to occur. A scenario was constructed in which capacity was retired or units derated in proportion to the amount that the expiring contracts represented of the total capacity in that load Zone. Below is the amount of capacity for which contracts expire, by year, and the resulting LOLE if that amount of capacity were to retire.
Table 5.4.4.1 NUG Retirements Year
Year 2007 2008 2009 2010 2011 2012 2013 2014 2015 2016 Sum AREA-A 167.1 167.1 AREA-B AREA-C 1.1 78.3 340 5.8 425.2 AREA-D 240 240 AREA-E 3.3 1.5 2.5 0.2 7.5 AREA-F 0.2 2.2 12.3 90 265 133.5 1 504.2 AREA-G AREA-H 8.5 55 63.5 AREA-I AREA-J 21 21 AREA-K 17.5 70.9 11.1 22.9 14 43.7 180.1 _Total_ 171.7 26 446.4 12.6 33.3 112.9 279 476 50.7 1608.6 Source of the data is the New York Power Pool 19999 “Load and Capacity” report.
3/16/07 - NYISO Comprehensive Reliability Planning Process (CRPP) 2007 Reliability Needs Assessment 21
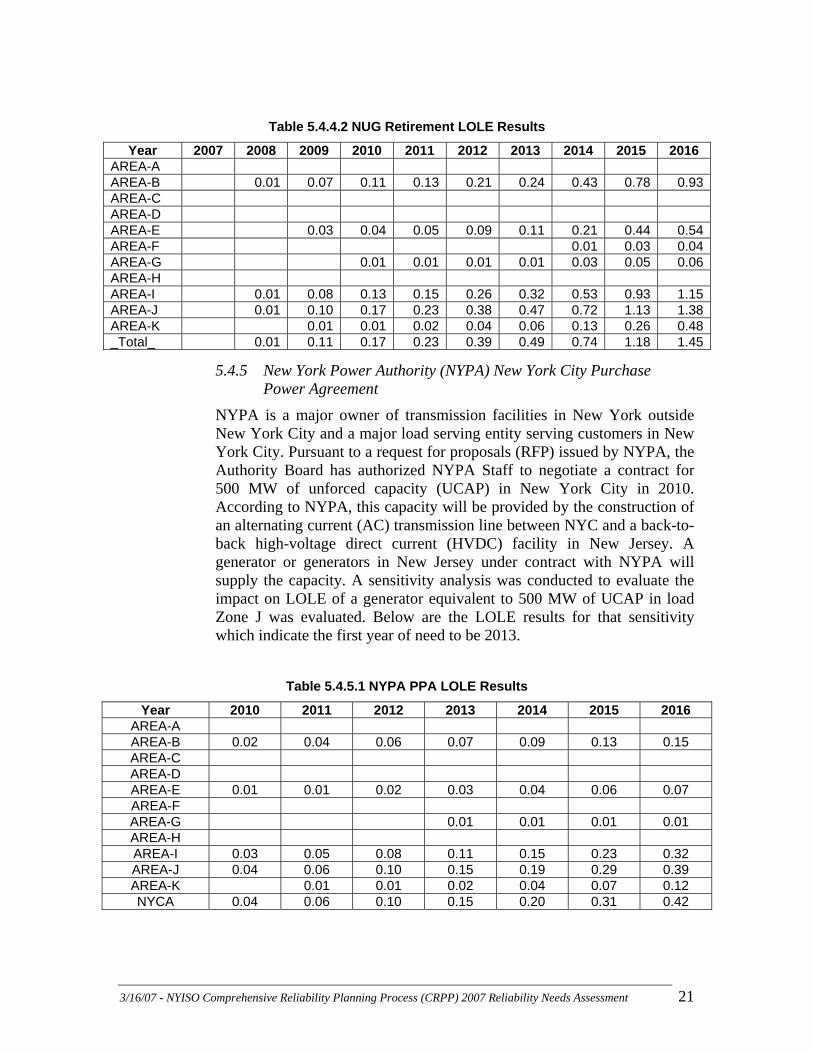
Table 5.4.4.2 NUG Retirement LOLE Results
Year 2007 2008 2009 2010 2011 2012 2013 2014 2015 2016 AREA-A AREA-B 0.01 0.07 0.11 0.13 0.21 0.24 0.43 0.78 0.93AREA-C AREA-D AREA-E 0.03 0.04 0.05 0.09 0.11 0.21 0.44 0.54AREA-F 0.01 0.03 0.04AREA-G 0.01 0.01 0.01 0.01 0.03 0.05 0.06AREA-H AREA-I 0.01 0.08 0.13 0.15 0.26 0.32 0.53 0.93 1.15AREA-J 0.01 0.10 0.17 0.23 0.38 0.47 0.72 1.13 1.38AREA-K 0.01 0.01 0.02 0.04 0.06 0.13 0.26 0.48_Total_ 0.01 0.11 0.17 0.23 0.39 0.49 0.74 1.18 1.45
5.4.5 New York Power Authority (NYPA) New York City Purchase Power Agreement
NYPA is a major owner of transmission facilities in New York outside New York City and a major load serving entity serving customers in New York City. Pursuant to a request for proposals (RFP) issued by NYPA, the Authority Board has authorized NYPA Staff to negotiate a contract for 500 MW of unforced capacity (UCAP) in New York City in 2010. According to NYPA, this capacity will be provided by the construction of an alternating current (AC) transmission line between NYC and a back-to-back high-voltage direct current (HVDC) facility in New Jersey. A generator or generators in New Jersey under contract with NYPA will supply the capacity. A sensitivity analysis was conducted to evaluate the impact on LOLE of a generator equivalent to 500 MW of UCAP in load Zone J was evaluated. Below are the LOLE results for that sensitivity which indicate the first year of need to be 2013.
Table 5.4.5.1 NYPA PPA LOLE Results
Year 2010 2011 2012 2013 2014 2015 2016 AREA-A AREA-B 0.02 0.04 0.06 0.07 0.09 0.13 0.15 AREA-C AREA-D AREA-E 0.01 0.01 0.02 0.03 0.04 0.06 0.07 AREA-F AREA-G 0.01 0.01 0.01 0.01 AREA-H AREA-I 0.03 0.05 0.08 0.11 0.15 0.23 0.32 AREA-J 0.04 0.06 0.10 0.15 0.19 0.29 0.39 AREA-K 0.01 0.01 0.02 0.04 0.07 0.12 NYCA 0.04 0.06 0.10 0.15 0.20 0.31 0.42
3/16/07 - NYISO Comprehensive Reliability Planning Process (CRPP) 2007 Reliability Needs Assessment 22
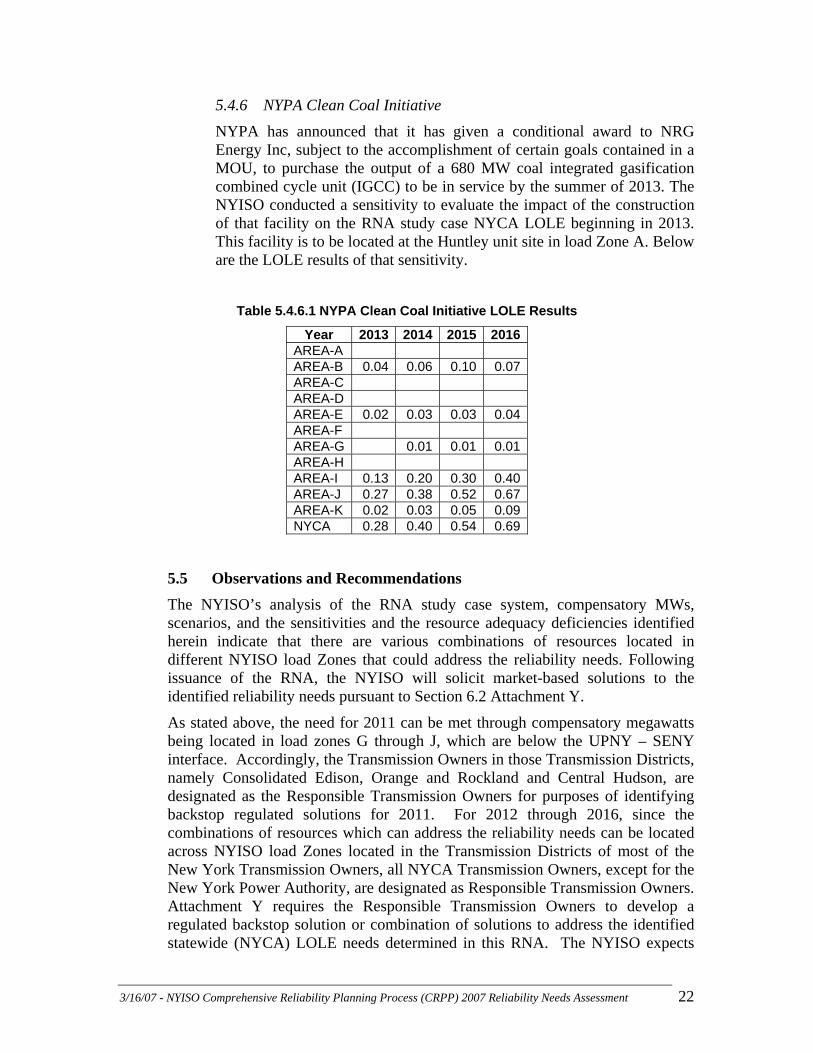
5.4.6 NYPA Clean Coal Initiative NYPA has announced that it has given a conditional award to NRG Energy Inc, subject to the accomplishment of certain goals contained in a MOU, to purchase the output of a 680 MW coal integrated gasification combined cycle unit (IGCC) to be in service by the summer of 2013. The NYISO conducted a sensitivity to evaluate the impact of the construction of that facility on the RNA study case NYCA LOLE beginning in 2013. This facility is to be located at the Huntley unit site in load Zone A. Below are the LOLE results of that sensitivity.
Table 5.4.6.1 NYPA Clean Coal Initiative LOLE Results
Year 2013 2014 2015 2016AREA-A AREA-B 0.04 0.06 0.10 0.07AREA-C AREA-D AREA-E 0.02 0.03 0.03 0.04AREA-F AREA-G 0.01 0.01 0.01AREA-H AREA-I 0.13 0.20 0.30 0.40AREA-J 0.27 0.38 0.52 0.67AREA-K 0.02 0.03 0.05 0.09NYCA 0.28 0.40 0.54 0.69
5.5 Observations and Recommendations The NYISO’s analysis of the RNA study case system, compensatory MWs, scenarios, and the sensitivities and the resource adequacy deficiencies identified herein indicate that there are various combinations of resources located in different NYISO load Zones that could address the reliability needs. Following issuance of the RNA, the NYISO will solicit market-based solutions to the identified reliability needs pursuant to Section 6.2 Attachment Y.
As stated above, the need for 2011 can be met through compensatory megawatts being located in load zones G through J, which are below the UPNY – SENY interface. Accordingly, the Transmission Owners in those Transmission Districts, namely Consolidated Edison, Orange and Rockland and Central Hudson, are designated as the Responsible Transmission Owners for purposes of identifying backstop regulated solutions for 2011. For 2012 through 2016, since the combinations of resources which can address the reliability needs can be located across NYISO load Zones located in the Transmission Districts of most of the New York Transmission Owners, all NYCA Transmission Owners, except for the New York Power Authority, are designated as Responsible Transmission Owners. Attachment Y requires the Responsible Transmission Owners to develop a regulated backstop solution or combination of solutions to address the identified statewide (NYCA) LOLE needs determined in this RNA. The NYISO expects
3/16/07 - NYISO Comprehensive Reliability Planning Process (CRPP) 2007 Reliability Needs Assessment 23
that NYPA will work with the other Transmission Owners on the development of regulated backstop solutions to the statewide needs on a voluntary basis.
The regulatory backstop solutions may take the form of alternative solutions of possible resource additions and system changes. Such proposals shall also provide an estimated implementation schedule so that trigger dates can be determined by the NYISO for purposes of beginning the regulatory approval and development processes for the backstop solutions if market solutions do not materialize in time to meet the reliability needs.
The current New York ISO market rules recognize the need to have defined quantities of capacity specifically located on Long Island, within New York City and available as dedicated resources to the New York Control Area as a whole so that the system can perform reliably. The NYISO has implemented a capacity market that is designed to procure and pay for at least the minimum requirements in each area. If these mechanisms work as intended and continue to require resources at the same levels as have existed in the past, they should result in the addition of new resources to meet most or all of the New York City and Long Island needs identified in this RNA. The control area wide requirement would result in additions that are needed to meet statewide reliability requirements.
3/16/07 - NYISO Comprehensive Reliability Planning Process (CRPP) 2007 Reliability Needs Assessment 24
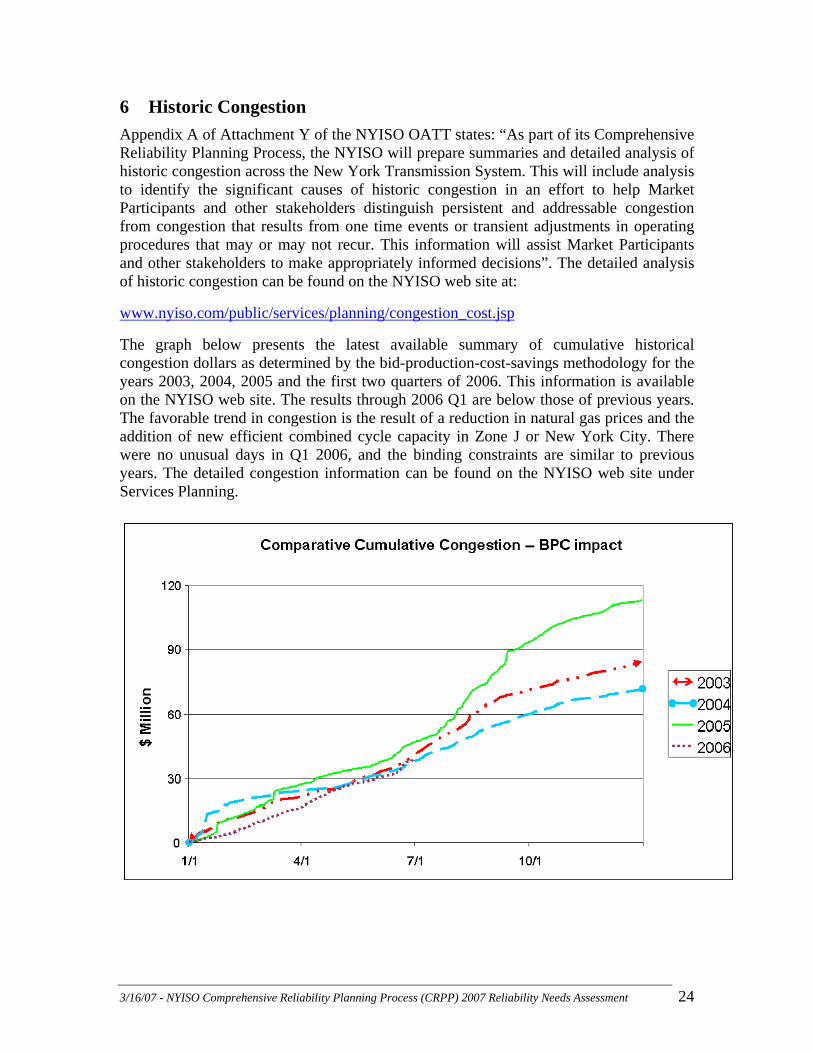
6 Historic Congestion Appendix A of Attachment Y of the NYISO OATT states: “As part of its Comprehensive Reliability Planning Process, the NYISO will prepare summaries and detailed analysis of historic congestion across the New York Transmission System. This will include analysis to identify the significant causes of historic congestion in an effort to help Market Participants and other stakeholders distinguish persistent and addressable congestion from congestion that results from one time events or transient adjustments in operating procedures that may or may not recur. This information will assist Market Participants and other stakeholders to make appropriately informed decisions”. The detailed analysis of historic congestion can be found on the NYISO web site at:
www.nyiso.com/public/services/planning/congestion_cost.jsp
The graph below presents the latest available summary of cumulative historical congestion dollars as determined by the bid-production-cost-savings methodology for the years 2003, 2004, 2005 and the first two quarters of 2006. This information is available on the NYISO web site. The results through 2006 Q1 are below those of previous years. The favorable trend in congestion is the result of a reduction in natural gas prices and the addition of new efficient combined cycle capacity in Zone J or New York City. There were no unusual days in Q1 2006, and the binding constraints are similar to previous years. The detailed congestion information can be found on the NYISO web site under Services Planning.