Comprehensive notes for DEC712S CHARACTERISTICS OF ... notes... · According to Myint, the dualism...
21
Comprehensive notes for DEC712S CHARACTERISTICS OF DEVELOPING COUNTRIES Low level of GNI per capita. The Gross National Product (GNP) per capita or Gross National Income (GNI) per capita is often considered to be a good index of the economic welfare of the people in a country. Judging developing nations by this criterion one finds them in an extremely miserable position. The GNI per capita in these countries is very low. According to the estimates of the World Bank, in 2007 there were 43 low income economies where the GNI per capita was estimated at $350 or even less. This low level of GNI per capita is sufficient to reflect the plight of common people in these countries. On world scale, income inequalities between the developed and developing countries are quite large. But what is more distressing is that the economic distance between the two groups of countries increases with every year that passes. In 2007, the average GNI per capita of the high income economies was estimated at $37,566 while it was only $578 in low income developing economies. Larger income inequalities. In developing countries apart from GNP per capita being considerably lower, income inequalities are also larger than in developed countries. Recent data published in the World Development Indicators lends credence to the view that income inequalities are far greater in developing countries than in developed countries. According to Simon Kuznets, inequalities are much larger in the developing countries. The comparison of income distribution in developed and developing countries is generally made of incomes prior to levying of direct taxes and the free benefits from the government also remain excluded. He rightly asserts “since the burden and progressivity of direct taxes are much greater in developed countries and since it is in the latter that substantial volumes of free economic assistance are extended to low income groups, a comparison in terms of income net of direct taxes and excluding government benefits would only accentuate the wider inequality of income distribution in the underdeveloped countries” Widespread Poverty. The extent of absolute poverty is an important dimension of the problem of income distribution in the developing countries. At relatively lower levels of GNP per capita large income inequalities as they exist in the developing countries of Asia, Africa and Latin America, have resulted in widespread poverty. The poverty problem could perhaps be overcome in these countries with a more equitable income distribution. China`s case lends credence to the view that in near future if developing countries wish to wipe out poverty they have no choice except to improve the income distribution so as to ensure a minimum standard of living in terms of calorie intake the nutrition levels, clothing, sanitation, health, education and so on. Poverty is, however, not easy to define, and whatever be the approach, there is bound to be an element of arbitrariness in it. Till recently, the World Bank used a poverty line of $1 a day in 1993 PPP (Purchasing Power Parity) terms. This has now been revised to $1.25 a day in 2005 PPP terms ( which represents the mean of the poverty lines found in the poorest 15 countries ranked by per capita consumption)
Transcript of Comprehensive notes for DEC712S CHARACTERISTICS OF ... notes... · According to Myint, the dualism...
Comprehensive notes for DEC712S
CHARACTERISTICS OF DEVELOPING COUNTRIES
Low level of GNI per capita. The Gross National Product (GNP) per capita or Gross
National Income (GNI) per capita is often considered to be a good index of the economic
welfare of the people in a country. Judging developing nations by this criterion one finds
them in an extremely miserable position. The GNI per capita in these countries is very low.
According to the estimates of the World Bank, in 2007 there were 43 low income
economies where the GNI per capita was estimated at $350 or even less. This low level of
GNI per capita is sufficient to reflect the plight of common people in these countries. On
world scale, income inequalities between the developed and developing countries are quite
large. But what is more distressing is that the economic distance between the two groups of
countries increases with every year that passes. In 2007, the average GNI per capita of the
high income economies was estimated at $37,566 while it was only $578 in low income
developing economies.
Larger income inequalities. In developing countries apart from GNP per capita being
considerably lower, income inequalities are also larger than in developed countries. Recent
data published in the World Development Indicators lends credence to the view that
income inequalities are far greater in developing countries than in developed countries.
According to Simon Kuznets, inequalities are much larger in the developing countries. The
comparison of income distribution in developed and developing countries is generally
made of incomes prior to levying of direct taxes and the free benefits from the government
also remain excluded. He rightly asserts “since the burden and progressivity of direct taxes
are much greater in developed countries and since it is in the latter that substantial volumes
of free economic assistance are extended to low income groups, a comparison in terms of
income net of direct taxes and excluding government benefits would only accentuate the
wider inequality of income distribution in the underdeveloped countries”
Widespread Poverty. The extent of absolute poverty is an important dimension of the
problem of income distribution in the developing countries. At relatively lower levels of
GNP per capita large income inequalities as they exist in the developing countries of Asia,
Africa and Latin America, have resulted in widespread poverty. The poverty problem
could perhaps be overcome in these countries with a more equitable income distribution.
China`s case lends credence to the view that in near future if developing countries wish to
wipe out poverty they have no choice except to improve the income distribution so as to
ensure a minimum standard of living in terms of calorie intake the nutrition levels,
clothing, sanitation, health, education and so on. Poverty is, however, not easy to define,
and whatever be the approach, there is bound to be an element of arbitrariness in it. Till
recently, the World Bank used a poverty line of $1 a day in 1993 PPP (Purchasing Power
Parity) terms. This has now been revised to $1.25 a day in 2005 PPP terms ( which
represents the mean of the poverty lines found in the poorest 15 countries ranked by per
capita consumption)

Low levels of Productivity. Labour productivity in developing countries is invariably low.
It is both a cause and effect of low levels of living in these countries. Todaro and Smith
assert that “low levels of living and low productivity are self-reinforcing social and
economic phenomena in third World countries and as such are the principal manifestations
of and contributors to their underdevelopment”. Labour productivity depends on a number
of factors, particularly the availability of other inputs to be combined with labour, health
and skill of workers, motivation for work and institutional flexibilities. The two inputs viz.
capital and managerial skill raise the productivity of labour considerably when they are
combined with it. But developing countries lack both of these inputs. Hence, it is quite
natural to advocate that this deficiency should be overcome as early as possible by
improving domestic supply of these inputs, and if need be, also by supplementing it from
foreign sources.
Great dependence on agriculture with a backward industrial structure : Harvey
Leibenstein asserts that developing economies are basically agrarian in their character. In
these countries agriculture and allied activities generally account for 30% to 80% of the
labour force. This is true of most of the Asian and African countries. In Latin America,
however there are a number of developing countries where proportion of labour force
employed in agriculture has declined to 20% or even less of the total work force. As
compared to overall labour productivity, labour productivity in the agricultural sector is
lower in the developing countries than in the developed countries. Making his observations
on this phenomenon. Simon Kuznets remarks “One major implication of the relatively low
per worker production in agriculture in the underdeveloped countries is that a large
proportion of the population is attached to a sector with low productivity operating under
conditions of rural life and isolation that cannot be penetrated by modern economic
methods”. The industrial sector in the developing countries is both small and backward
while the extended industrial sector in these countries accounts for about a fifth of the total
product in these countries, less than 10% is allocable to manufacturing proper.
High Proportion of consumption and expenditure and low risk saving rate: on
examining the major use structure of Gross National Product in the standard national
accounts, Kuznets has observed that “the underdeveloped countries differ from developed
countries in several respects: a large share for private consumption (73% – 75 % compared
with 64%-66% for developed countries); a slightly lower share for government
consumption ( 11 to 12 percent compared with 12 to 14 per cent ); a distinctly lower share
for gross domestic formation ( 15 to 16 percent , compared with 22 to 23 percent); and an
even lower share of gross national capital formation ( 14 to 15 per cent, compared with 22
per cent )”. It is not surprising why the savings rate is lower in the developing countries. If
the income level is low, the propensity to consume will be high, and as a consequence
capital formation will be low. Ragnar Nurkse has contended that since the underdeveloped
countries are caught in a vicious circle of poverty they do not have much capacity to save.
Furthermore, on the demand side the market constraint operates as a distinctive and the
potential savers indulge in wasteful consumption.

High rate of population growth and dependency burdens: Population has been rising in
most developing countries at rates varying between 2 and 3.5 percent per annum for the
past few decades. This demographic trend is unprecedented in the history of mankind. Due
to increased medical facilities there has been a sudden decline in the mortality rates in
these countries. However, in most developing countries birth rate remain very high, in the
range of 25 to 50 per thousands, while in developed countries, nowhere it exceeds 15 per
thousand. Interestingly, china, Sri Lanka, and Thailand are the only lower middle income
developing countries which have managed to bring down their birth rates to 10 t0 15 per
thousand. A high rate of population growth in the third world countries is both a cause and
effect of their underdevelopment. A major implication of high birth rates in the developing
countries is that it results in a greater dependency burden than that in developed countries.
High levels of unemployment and underemployment: Unemployment in both rural and
urban areas is widespread in the developing countries. The traditional agriculture
characterised by outmoded techniques of production and low level of productivity lacks
labour absorption capacity. Thus, with rapidly growing population in these countries,
pressure of population on agricultural land has been increasing and with it the problem of
disguised unemployment is becoming increasingly serious. Rural people are aware of this
malady, and therefore quite often they migrate to cities in search of jobs where not many
employment opportunities exist for them. This part of urban unemployment in the
developing countries is a spill over of unemployment in the countryside. Another reason
for unemployment in cities is inadequate growth of industries. In developing countries,
markets for manufacturers are quite small due to widespread poverty. Faced with the
problems of lack of adequate demand, industries grow at a snail pace and fail to provide
jobs in sufficient number to absorb the growing population. Current rates of open
unemployment in urban areas in most developing countries average from 10 to 15 per cent
of the urban labour force. Unemployment among educated people aged 15 – 24 years is
also considerable in the urban areas. According to Michael P. Todaro “when the
unemployed are added to the openly unemployed and when “discouraged workers”- those
who have given up looking for a job – are added in, almost 35% of the combined urban
and rural labour forces in Third World nations is unutilised”
Technological Backwardness: In developing countries, production techniques are
inefficient over a wide range of industrial activity. This sorry state of affairs cannot be
explained in terms of one or two factors. Lack of research and development (R&D), weak
communication system between the research institutes and industries, abundance of labour
and capital scarcity are some obvious reasons for the use of techniques which have
otherwise become obsolete. Developing countries generally do not have large effective
institutions working for discovering appropriate technology. Under the circumstances, an
attempt is made to import technology from developed countries which often fails to adapt
to local conditions. Moreover, whatever limited research is undertaken in industrial
technology; its results fail to reach producers due to weak communication system. But
those factors do not explain wholly the continuance of outmoded techniques. In most cases
it`s not the ignorance which prevents producers from adopting modern techniques. In many
cases technological choice of producers is dictated by their poverty.
Dualism: Economist talk of various types of dualism existing in developing economies.
During the colonial and post-colonial period the concept of ‘social Dualism’ was quite
popular with the western economist and they used it extensively to explain the problems of
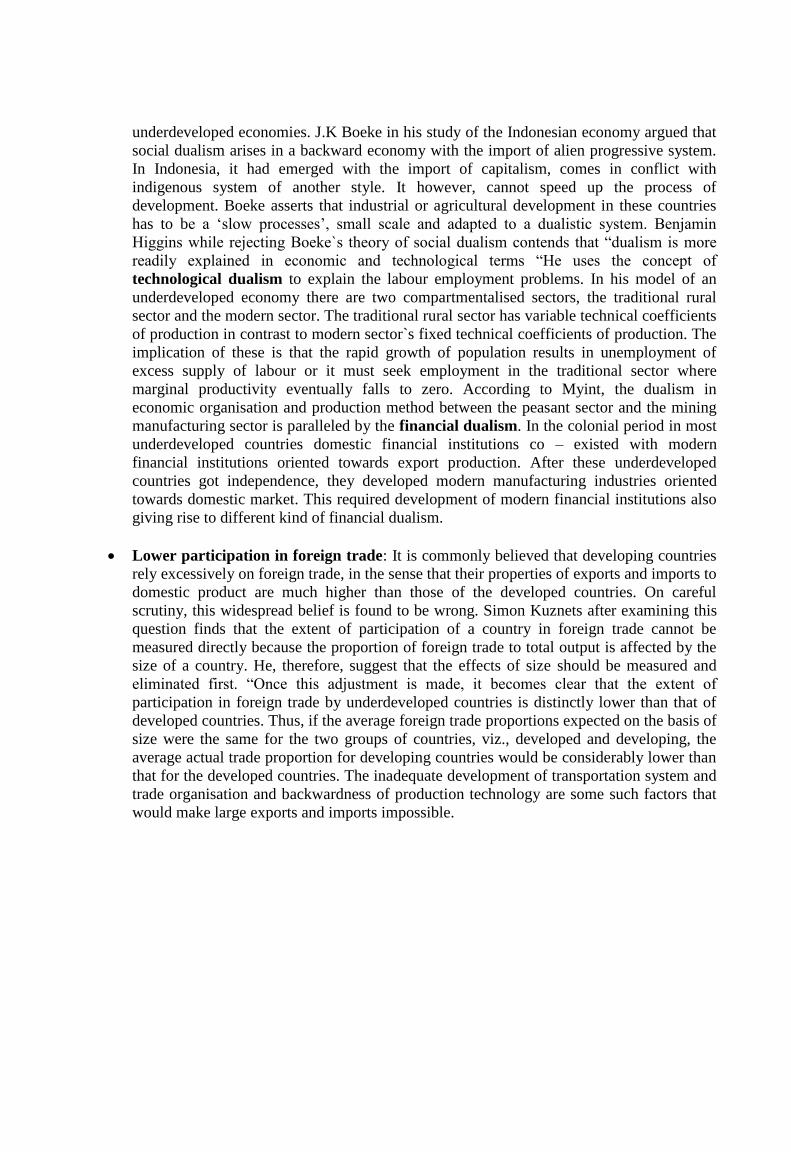
underdeveloped economies. J.K Boeke in his study of the Indonesian economy argued that
social dualism arises in a backward economy with the import of alien progressive system.
In Indonesia, it had emerged with the import of capitalism, comes in conflict with
indigenous system of another style. It however, cannot speed up the process of
development. Boeke asserts that industrial or agricultural development in these countries
has to be a ‘slow processes’, small scale and adapted to a dualistic system. Benjamin
Higgins while rejecting Boeke`s theory of social dualism contends that “dualism is more
readily explained in economic and technological terms “He uses the concept of
technological dualism to explain the labour employment problems. In his model of an
underdeveloped economy there are two compartmentalised sectors, the traditional rural
sector and the modern sector. The traditional rural sector has variable technical coefficients
of production in contrast to modern sector`s fixed technical coefficients of production. The
implication of these is that the rapid growth of population results in unemployment of
excess supply of labour or it must seek employment in the traditional sector where
marginal productivity eventually falls to zero. According to Myint, the dualism in
economic organisation and production method between the peasant sector and the mining
manufacturing sector is paralleled by the financial dualism. In the colonial period in most
underdeveloped countries domestic financial institutions co – existed with modern
financial institutions oriented towards export production. After these underdeveloped
countries got independence, they developed modern manufacturing industries oriented
towards domestic market. This required development of modern financial institutions also
giving rise to different kind of financial dualism.
Lower participation in foreign trade: It is commonly believed that developing countries
rely excessively on foreign trade, in the sense that their properties of exports and imports to
domestic product are much higher than those of the developed countries. On careful
scrutiny, this widespread belief is found to be wrong. Simon Kuznets after examining this
question finds that the extent of participation of a country in foreign trade cannot be
measured directly because the proportion of foreign trade to total output is affected by the
size of a country. He, therefore, suggest that the effects of size should be measured and
eliminated first. “Once this adjustment is made, it becomes clear that the extent of
participation in foreign trade by underdeveloped countries is distinctly lower than that of
developed countries. Thus, if the average foreign trade proportions expected on the basis of
size were the same for the two groups of countries, viz., developed and developing, the
average actual trade proportion for developing countries would be considerably lower than
that for the developed countries. The inadequate development of transportation system and
trade organisation and backwardness of production technology are some such factors that
would make large exports and imports impossible.
Dependence: The process of underdevelopment in the Asian, African and Latin American
countries had begun with the integration of their economies with those of the West
European capitalist economies. This relationship between the colonies and the metropolitan
countries gave rise to an international division of labour which allowed industrial
development to take place only in the latter. Though the economies of the colonies
remained backward yet they were part of the world capitalist system. They were in fact
made subservient to metropolitan interests and were forced to specialise in primary
producing activities. The pattern and direction of trade in colonial period was also
determined by the basic fact of the integration of colonies with the metropolitan countries.
On the one hand colonies depend on the metropolitan countries for almost all the capital
goods, industrial raw materials and most of the manufactured consumer goods, while on
the other hand their exports constituted of one or two primary products.
The three co-values of development 1. Sustenance: The ability to meet basic needs. All people have certain basic needs without which
life would be impossible. These life-sustaining basic human needs include food, health, and
protection. When any of these is absent or in critically short supply, a condition of “absolute
underdevelopment” exists.
2. Self-Esteem: A second universal component of the good life is self-esteem- a sense of worth
and self-respect, of not being used as a tool by others for their own ends.
3. Freedom from Servitude (bondage): A third and final universal value that should constitute
the meaning of development is the concept of human freedom. The concept of human freedom
should also encompass various component of political freedom including, but not limited to,
personal security, the rule of law, freedom of expression, political participation, and equity of
opportunity
Crowding out effect
When government spending fails to increase overall aggregate demand because higher government
spending causes an equivalent fall in private sector spending and investment. When the
government has to borrow, it needs to borrow from the private sector. This could be private
individuals, pension funds or investment trusts. It is argued that if the private sector buy
government securities this will crowd out private sectors investment. This can be fully illustrated
with the diagram below
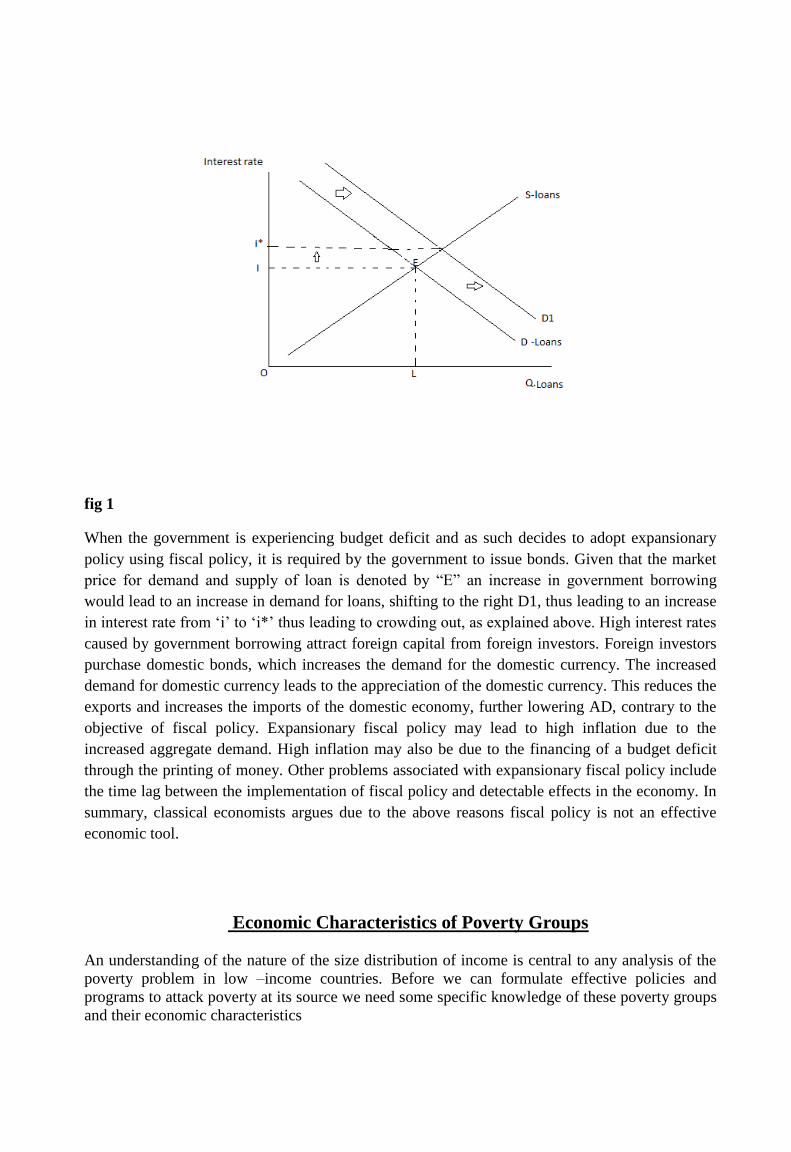
fig 1
When the government is experiencing budget deficit and as such decides to adopt expansionary
policy using fiscal policy, it is required by the government to issue bonds. Given that the market
price for demand and supply of loan is denoted by “E” an increase in government borrowing
would lead to an increase in demand for loans, shifting to the right D1, thus leading to an increase
in interest rate from ‘i’ to ‘i*’ thus leading to crowding out, as explained above. High interest rates
caused by government borrowing attract foreign capital from foreign investors. Foreign investors
purchase domestic bonds, which increases the demand for the domestic currency. The increased
demand for domestic currency leads to the appreciation of the domestic currency. This reduces the
exports and increases the imports of the domestic economy, further lowering AD, contrary to the
objective of fiscal policy. Expansionary fiscal policy may lead to high inflation due to the
increased aggregate demand. High inflation may also be due to the financing of a budget deficit
through the printing of money. Other problems associated with expansionary fiscal policy include
the time lag between the implementation of fiscal policy and detectable effects in the economy. In
summary, classical economists argues due to the above reasons fiscal policy is not an effective
economic tool.
Economic Characteristics of Poverty Groups
An understanding of the nature of the size distribution of income is central to any analysis of the
poverty problem in low –income countries. Before we can formulate effective policies and
programs to attack poverty at its source we need some specific knowledge of these poverty groups
and their economic characteristics
Rural Poverty:- The most valid generalization about the poor are that they are disproportionately
located in rural areas, that they are primarily engaged in agricultural and associated activities, that
they are more likely to be women and children than adult males, and that they are often
concentrated among minority ethnic groups and indigenous people. In Africa and Asia, about 80%
of all target poverty groups are located in the rural areas, as are about 50% in Latin America. It is
interesting to note, in light of the rural concentration of absolute poverty, that the largest share of
most LDC government expenditures over the past several decades has been directed toward the
urban area and especially toward the relatively affluent modern manufacturing and commercial
sectors.
Women and Poverty: – Women make up a substantial majority of the world’s poor. If we
compared the lives of the inhabitants of the poorest communities throughout the developing world,
we would discover that virtually everywhere, women and children experience the hardest
deprivation. They are more likely to be poor and malnourished and less likely to receive medical
services, clean water, sanitation and other benefits. The prevalence of female headed households
and lower earning capacity of women, and their limited control over their spouses` income all
contribute to this disturbing phenomenon. In addition women have less access to education, formal
sector employment, and social security and government employment programs. These facts
combine to ensure that poor women`s financial resources are meagre and unstable relative to
men`s. Development policies that increases the productivity differentials between men and women
are likely to worsen earnings disparities as well as further erode women economic status within the
household. Since government programs to alleviate poverty frequently work almost exclusively
with men, they tend to exacerbate these inequalities. In urban areas, training programs to increase
earning potential and formal – sector employment are generally limited to men, while agricultural
extension program promote male- dominated crops, frequently at the expense of women vegetable
plots. Studies have shown that development effort can actually increase women`s workload while
at the same time reduce the share of households resources over which they exercise control.
Consequently, women and their dependents remain the most economically vulnerable group in
LDC.
Any process of growth that fails to improve the welfare of the people experiencing the greatest
hardship, broadly recognised to be women and children, has failed to accomplish one of the
principals’ goals of development. In the long run, the low status of women is likely to translate
into slower rates of economic growth.
Ethnic Minorities and Poverty:- A final generalization about the incidence of poverty in the
developing world is that it falls heavily on minority ethnic groups and indigenous populations. In
recent years, domestic conflicts and even civil wars have arisen out of ethnic groups` perceptions
that they are losing out in the competition for limited resources and job opportunities the poverty
problem is even more serious for indigenous peoples, whose numbers exceed 300 million in over
5,000 different groups in more than 70 countries. In Latin America results have shown that most
indigenous groups live in extreme poverty and that being indigenous greatly increases the chances
that an individual will be malnourished, illiterate, in poor health and unemployed same research
could also be applicable to Africa and Asia regions with high rates of poverty. It should be noted
that the poor come from poor countries. Although this may seem like a trivial observation, it is
actually a useful note of optimism. The negative relationship between poverty and per capita
income suggest that if higher incomes can be achieved, poverty will be reduced, if only because of
the great resources that countries will have available to tackle poverty problems. Unfortunately, a
higher level of absolute poverty can also retard a country`s growth prospects.
Macroeconomic Goals
The three important Macroeconomic goals are, stable prices, High sustainable growth and Low
unemployment. These three goals can be achieved through Monetary and Fiscal policies.
Monetary Policy is the process used a monetary authority (government or central bank) to control
the supply, availability and the cost of money in the economy. Monetary policy can either be
expansionary or contractionary Expansionary increases whilst contractionary monetary policy
reduces the quantity of money in the economy. A substantial change in money supply would either
increase or decrease interest rate which would either decrease or increase aggregate demand
(ΔMS=↑↓i=↓↑AD) which has an effect on the three macroeconomic goals. Fiscal policy is the use
of government expenditure and revenue collection to influence the economy. The two main
instruments of fiscal policy are Government expenditure and Taxation. Neutral stance of fiscal
policy implies a balanced budget where G=T (Government spending = Tax revenue). Government
spending is fully funded by tax revenue and overall the budget outcome has a neutral effect on the
level of economic activity. Expansionary fiscal policy involves a net increase in government
spending (G>T) through rises in government spending, a fall in taxation revenue or a combination
of the two. This will lead to a larger budget deficit or a small budget surplus than the government
previous had Expansionary fiscal policy is usually associated with a budget deficit An increase in
government expenditure would lead to an increase in money supply (Expansionary policy) which
as a result would lead to increase in aggregate demand. Contractionary fiscal policy (G<T) occurs

when net government is reduced either through higher taxation revenue, reduced government
spending or a combination of the two. This will lead to a lower budget deficit or larger surplus.
Contractionary fiscal policy is usually associated with a surplus budget, and as such reduces
aggregate demand. The diagram below analyses how the three macroeconomic goals can be
controlled with the above mentioned polices.
Fig2
The classical economist assumes a state of full employment shown as QFe, although the
Keynesian school of thoughts didn’t dispute the assumption they criticise the classicalist views on
how to attain full employment in the long run siting the necessity of government intervention in
the economy, which would shift demand curve to the right through fiscal policies (Increasing
Government spending or decreasing tax); given unemployment rate at 20% and inflation rate at
3% the economy is approaching recession, as seen (fig.1) above the government can either choose
to adopt fiscal or monetary policy or adopt both policies. Adopting fiscal policies would shift
aggregate demand curve towards the right at AD*, this could also be achieved using monetary
policies, although the government suffers the consequences of inflation at 10% with a continuous
expansionary policy, shifting aggregate demand to AD2 from AD* thus it is necessary for the
governments to also adopt contractionary policies in order to balance the aggregate demand curve
at AD* maintaining inflation rate at 3% as well as achieving full employment.
MALTHUSIAN THEORY OF POPULATION
Thomas Robert Malthus wrote his essay on “Principle of Population” in 1798 and modified some
of his conclusions in the next edition in 1803. He feared that England was heading for a disaster,
and he considered it his solemn duty to warn his country-men of impending disaster. He deplored
“the strange contrast between over-care in breeding animals and carelessness in breeding men.”
His theory is very simple. To use his own words: “By nature human food increases in a slow
arithmetical ratio; man himself increases in a quick geometrical ratio unless want and vice stop
him.The increase in numbers is necessarily limited by the means of subsistence Population
invariably increases when the means of subsistence increase, unless prevented by powerful and
obvious checks.”
Propositions of Malthus theory;
The first proposition is that the population of a country is limited by the means of subsistence. In
other words, the size of population is determined by the availability of food. The greater the food
production, the greater the size of the population which can be sustained. The check of deaths
caused by want of food and poverty would limit the maximum possible population.
The second proposition states that the growth of population will out-run the increase in food
production. Malthus thought that man’s sexual urge to bear offspring knows no bounds. He
seemed to think that there was no limit to the fertility of man. But the power of land to produce
food is limited. Malthus thought that the law of diminishing returns operated in the field of
agriculture and that the operation of this law prevented food production from increasing in
proportion to labour and capital invested in land.
In fact, Malthus observed that population would tend to increase at a geometric rate (2, 4, 8, 16,
32, 64, etc.), but food supply would tend to increase at an arithmetic rate (2, 4, 6, 8, 10, 12). Thus,
at the end of two hundred years “population would be to the means of subsistence as 259 to 9; in
three centuries as 4,096 to 13, and in two thousand years the difference would be incalculable.”
Therefore, Malthus asserted that population would ultimately outstrip food supply.
According to the third proposition, as the food supply in a country increases, the people will
produce more children and would have larger families. This would increase the demand for food
and food per person will again diminish. Therefore, according to Malthus, the standard of living of
the people cannot rise permanently. As regards the fourth proposition, Malthus pointed out that
there were two possible checks which could limit’ the growth of population: (a) Preventive checks,
and (b) Positive checks.
Preventive Checks:
Preventive checks exercise their influence on the growth of population by bringing down the birth
rate. Preventive checks are those checks which are applied by man. Late marriage and self-
restraint during married life are the examples of preventive checks applied by man to limit the
family.
Positive Checks:
Positive checks exercise their influence on the growth of population by increasing the death rate.
They are applied by nature. The positive checks to population are various and include every cause,
whether arising from vice or misery, which in any degree contributes to shorten the natural
duration of human life. The unwholesome occupations, hard labour, exposure to the seasons,
extreme poverty, bad nursing of children, common diseases, wars, plagues and famines ire some
of the examples of positive checks. They all shorten human life and increase the death rate.
Malthus recommended the use of preventive checks if mankind was to escape from the impending
misery. If preventive checks were not effectively used, positive checks like diseases, wars and
famines would come into operation. As a result, the population would be reduced to the level
which can be sustained by the available quantity of food supply.
Criticism of Malthusian Theory:
mankind has been falsified in the Western world. Population has not increased as rapidly as
predicted by Malthus; on the other hand, production has increased tremendously because of the
rapid advances in technology.
the increase in food production alone. Malthus
held that because land was available in limited quantity, food production
could not rise faster than population. But he should have considered all types of production in
considering the question of optimum size of population. There is no food problem in Great Britain.
Therefore, Malthus made a mistake in taking agricultural land and food production alone into
account when discussing the population question.
istence or food supplies would cause
population to grow rapidly so that ultimately means of subsistence or food supply would be in
level with population, and everyone would get only bare minimum subsistence. In other words,
according to Malthus, living standards of the people cannot rise in the long run above the level of
minimum subsistence. But, as already pointed out, living standards of the people in the Western
world have risen greatly and stand much above the minimum subsistence level. There is no
evidence of birth-rate rising with the increases in the standard of living. Instead, there is evidence
that birth-rates fall as the economy grows.
progression and food production increased exactly in arithmetic progression. It has been rightly
pointed out that population and food supply did not change in accordance with these mathematical
series. Growth of population and food supply cannot be expected to show the precision or
accuracy of such series.
We must, however, add that though the gloomy conclusions of Malthus have not turned out to be
true due to several factors which have made their appearance only in recent times, yet the
essentials of the theory have not been demolished. He said that unless preventive checks were
exercised, positive checks would operate. So, Is Malthusian Theory valid today?
Okun`s Law
Economic study and thought has been around for centuries, and when it comes to studying the
economy, growth and jobs are two primary factors that economists must consider. There is clearly
a relationship between the two, and many economists have framed the discussion by trying to
study the relationship between economic growth and unemployment levels. Economist Arthur
Okun first started tackling the discussion in the 1960s, and his research on the subject has since
become known as Okun's law. Below is a more detailed overview of Okun's Law, why it is
important and how it stood the test of time since first being published
In its most basic form, Okun's law investigates the statistical relationship between a country's
unemployment rate and the growth rate of its economy. According to research "the logic behind
Okun's law is simple. Output depends on the amount of labor used in the production process, so
there is a positive relationship between output and employment. Total employment equals the
labor force minus the unemployed, so there is a negative relationship between output and
unemployment (conditional on the labor force)." according to [the] currently accepted versions of
Okun's law, to achieve a 1 percentage point decline in the unemployment rate in the course of a
year, real GDP must grow approximately 2 percentage points faster than the rate of growth of
potential GDP over that period. So, for illustration, if the potential rate of GDP growth is 2%,
Okun's law says that GDP must grow at about a 4% rate for one year to achieve a 1 percentage
point reduction in the rate of unemployment." It is most important to note that Okun's law is a
statistical relationship that relies on a regression of unemployment and economic growth. As such,
running the regression can result in differing coefficients that are used to solve for the change in
unemployment, based on how the economy grew. It all depends on the time periods used and
inputs, which are historical GDP and employment data. The law has indeed "evolved," or changed
over time to fit the current economic climate and employment trends at the time. One version of
Okun's law has stated very simply that when unemployment falls by 1%, GNP rises by 3%.
Another version of Okun's Law focuses on a relationship between unemployment and GDP,
whereby a percentage increase in unemployment causes a 2% fall in GDP. As with any law in
economics, science or any discipline, it is important to determine if it holds under varying
conditions and over time. In regard to Okun's law, there appear to be conditions where it holds
quite well and others where it doesn't. For instance, a review of Okun's law by the Federal Reserve
of Kansas City detailed that one of Okun's first
relationships looked at quarterly changes in unemployment compared to quarterly growth in real
output and it seemed to hold up well. Despite the fact that there are in reality many moving parts
to the relationship between unemployment and economic growth, there does appear to be
empirical support for the law. The Kansas City Fed study concluded that "Okun's law is not a tight
relationship," but that "Okun's law predicts that growth slowdowns typically coincide with rising
unemployment." In regard to the fact it did not hold up that well during the financial crisis.
Overall, there is little debate that Okun's law represents one of the most straightforward and
convenient methods to investigate the relationship between economic growth and employment.
One of the key benefits of Okun's law is its simplicity, a benefit shared by portfolio management,
and the ability to simply state that a 1% decrease in unemployment will occur when the economy
grows about 2% faster than expected. Additionally, his law has been studied extensively since it
was first published. Finally, there has been plenty of history over the past five decades, since
Okun's first works were published, to put it to the test. In reality though, it appears that relying on
Okun's law to make specific predictions about unemployment, given economic growth trends,
doesn't hold up that well. For instance, since it has been studied it has been known to shift over
time and be impacted by more unusual economic climates, including jobless recoveries and the
more recent financial crisis. Because of the complexity of the inputs, different time periods that
can be used and basic uncertainty that goes with running economic regressions, the law can
become quite complex. It simply employs many different economic variables to try and analyze
the relationship more precisely. Okun's law doesn't hold up as well under these more precise
stipulations, but empirical evidence does still support its usefulness. Okun's law may not be
entirely predictive, but it again helps frame the discussion of economic growth and how
employment influences it and vice versa
Rostow`s theory of development
In 1960, the American Economic Historian, WW Rostow suggested that countries passed through
five stages of economic development.
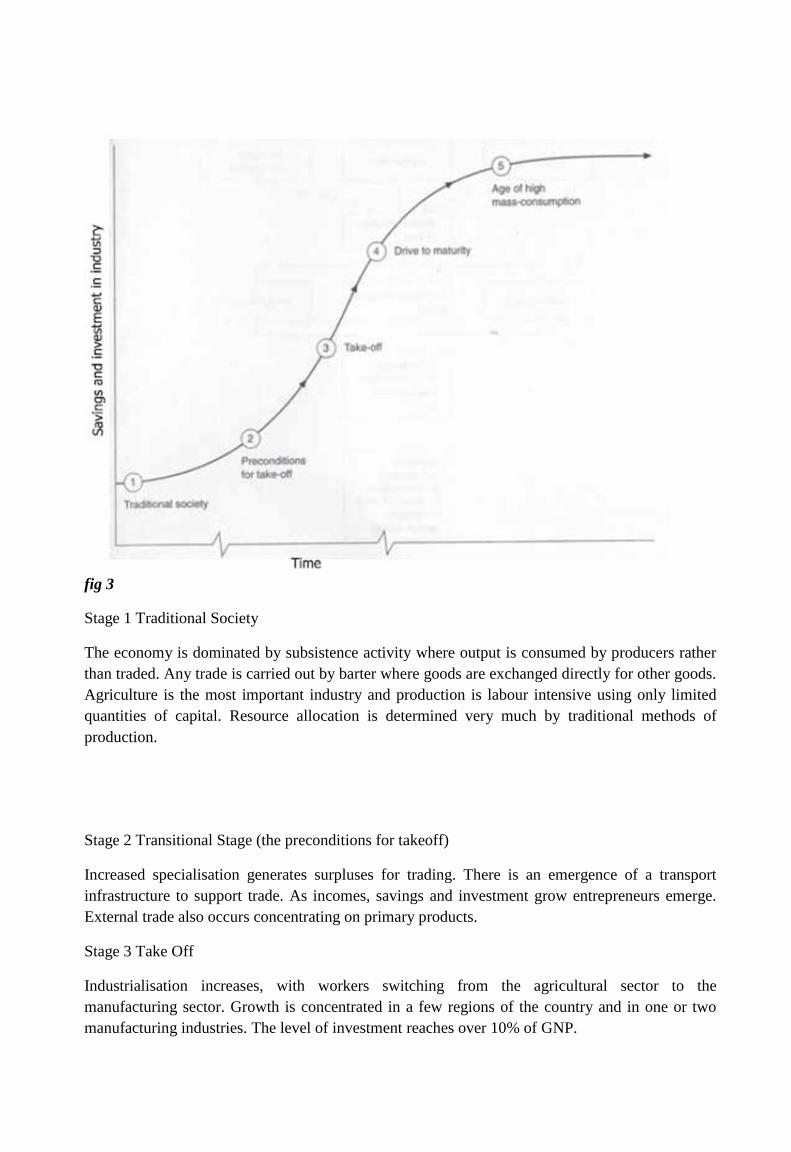
fig 3
Stage 1 Traditional Society
The economy is dominated by subsistence activity where output is consumed by producers rather
than traded. Any trade is carried out by barter where goods are exchanged directly for other goods.
Agriculture is the most important industry and production is labour intensive using only limited
quantities of capital. Resource allocation is determined very much by traditional methods of
production.
Stage 2 Transitional Stage (the preconditions for takeoff)
Increased specialisation generates surpluses for trading. There is an emergence of a transport
infrastructure to support trade. As incomes, savings and investment grow entrepreneurs emerge.
External trade also occurs concentrating on primary products.
Stage 3 Take Off
Industrialisation increases, with workers switching from the agricultural sector to the
manufacturing sector. Growth is concentrated in a few regions of the country and in one or two
manufacturing industries. The level of investment reaches over 10% of GNP.

The economic transitions are accompanied by the evolution of new political and social institutions
that support the industrialisation. The growth is self-sustaining as investment leads to increasing
incomes in turn generating more savings to finance further investment.
Stage 4 Drive to Maturity
The economy is diversifying into new areas. Technological innovation is providing a diverse range
of investment opportunities. The economy is producing a wide range of goods and services and
there is less reliance on imports.
Stage 5 High Mass Consumption
The economy is geared towards mass consumption. The consumer durable industries flourish. The
service sector becomes increasingly dominant.
According to Rostow development requires substantial investment in capital. For the economies of
LDCs to grow the right conditions for such investment would have to be created. If aid is given or
foreign direct investment occurs at stage 3 the economy needs to have reached stage 2. If the stage
2 has been reached then injections of investment may lead to rapid growth.
Limitations
Many development economists argue that Rostows's model was developed with Western cultures
in mind and not applicable to LDCs. It addition its generalised nature makes it somewhat limited.
It does not set down the detailed nature of the pre-conditions for growth. In reality policy makers
are unable to clearly identify stages as they merge together. Thus as a predictive model it is not
very helpful. Perhaps its main use is to highlight the need for investment. Like many of the other
models of economic developments it is essentially a growth model and does not address the issue
of development in the wider context.
The Harrod-Domar Growth Model
Every economy must save a certain proportion of its national income, if only to replace worn-out
or impaired capital goods (buildings, equipment and materials). However, in order to grow, new
investments representing net additions to the capital stock are necessary. If we assume that there is
some direct economic relationship between the size of the total capital stock, k, and total GDP, Y,
for example if $3 of capital is always necessary to produce a $1 stream of GDP it follows that any
net additions to the capital stock in the form of new investment will bring about corresponding
increase in the flow of national output, GDP. Suppose that this relationship, known in economics
as the capital –output ratio, is roughly 3 to 1. If we define the capital – output ratio as k and
assume further that the national net savings ratio, s, is a fixed proportion of national output (e.g.,

6%) and that total new investment is determined by the level of total savings, we can construct the
following simple model in economic growth:
Net savings (S) is some proportion, s, of National Income (Y) such that we have the simple
equation
S=sY (1.1)
Net investment (I0 is defined as the change in the capital stock, K, and can be represented by ΔK
such that
I=ΔK (1.2)
But because the total capital stock K bears a direct relationship to total national income or output,
Y, as expressed by the capital- output ratio k, it follows that
K/Y=k
Or
ΔK/ΔY=k
Finally,
ΔK=kΔY (1.3)
Finally, because net national savings, S, must equal net investment, I, we can write this equality as
S=I (1.4)
But from equation 1.1 we know that S=sY, and from equations 2.2 and 3.3 we know that
I=ΔK=kΔY
It therefore follows that we can write the identity of saving equalling investment shown by
equation 1.4 as
S=sY=kΔY=ΔK=I (1.5)
Or simply as
sY=kΔY (1.6)
Dividing both sides of Equation 1.6 first by Y and then by k, we obtain the following expression:
ΔY/Y=s/k (1.7)
Note, that the left – hand side of equation 1.7, ΔY/Y, represents the rate of change or rate growth
of GDP. Rate of growth is determined by the net national savings ratio, and the capital-output
ratio.
From Harrod-Donmar growth model we learn that the most fundamental strategies of economic
growth is simply to increase the proportion of national income saved ( i.e., not consumed). If we
can raise s in equation 1.7, we can increase ΔY/Y, the rate of growth. For example if we assume
that the national capital output ratio in some less developed country is, say 3 and the aggregate net
saving ratio is 6% of GDP, it follows from equation 1.7 that this country can grow at the rate of
2% per year because
ΔY/Y=s/k=6%/3 = 2%
Now if the national net savings rate can somehow be increased from 6% to, say, 15% through
some combination of increased tax, foreign aid, and general consumption sacrifices – GDP growth
can be increased from 2% to 5%
Reasons behind its failure in less developed countries the basic reason they didn’t work was not
because more savings and investment isn’t a necessary condition for accelerated rates of economic
growth but rather because it’s not a sufficient condition. The marshal plan worked for Europe
because the European country receiving aid possessed the necessary structural, institutional and
attitudinal conditions (e.g. well integrated commodity and money markets, highly developed
transport facilities, a well-trained and educated work force, the motivation to succeed an efficient
government bureaucracy) to convert new capital effectively into higher levels of output.
The Lewis Dual Sector
Lewis proposed his dual sector development model in 1954. It was based on the assumption that
many LDCs had dual economies with both a traditional agricultural sector and a modern industrial
sector. The traditional agricultural sector was assumed to be of a subsistence nature characterised
by low productivity, low incomes, low savings and considerable underemployment. The industrial
sector was assumed to be technologically advanced with high levels of investment operating in an
urban environment.
Lewis suggested that the modern industrial sector would attract workers from the rural areas.
Industrial firms, whether private or publicly owned could offer wages that would guarantee a
higher quality of life than remaining in the rural areas could provide. Furthermore, as the level of
labour productivity was so low in traditional agricultural areas people leaving the rural areas
would have virtually no impact on output. Indeed, the amount of food available to the remaining
villagers would increase as the same amount of food could be shared amongst fewer people. This
might generate a surplus which could then be sold generating income.
Those people that moved away from the villages to the towns would earn increased incomes and
this crucially according to Lewis generates more savings. The lack of development was due to a
lack of savings and investment. The key to development was to increase savings and investment.
Lewis saw the existence of the modern industrial sector as essential if this was to happen. Urban
migration from the poor rural areas to the relatively richer industrial urban areas gave workers the
opportunities to earn higher incomes and crucially save more providing funds for entrepreneurs to
investment. A growing industrial sector requiring labour provided the incomes that could be spent
and saved. This would in itself generate demand and also provide funds for investment.
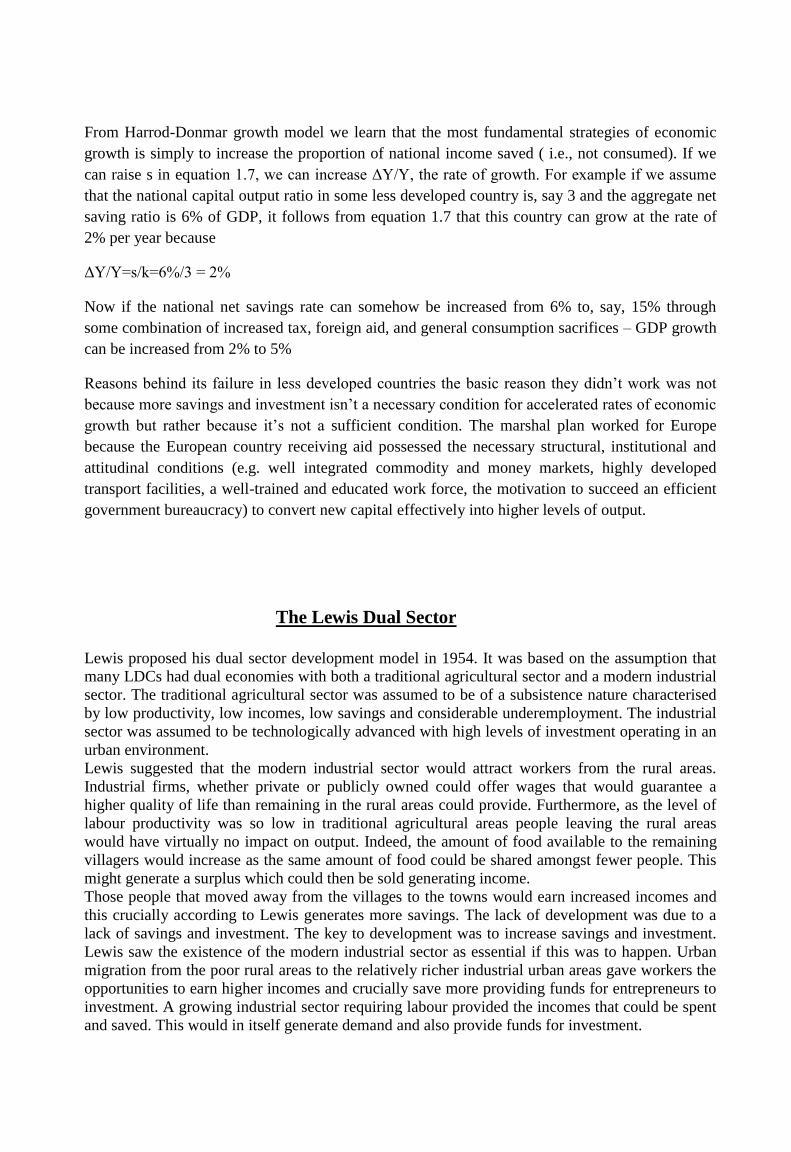
fig.4
The situation is depicted in figure 3 above, where OS represents subsistence earnings, OW the real
wage in the capitalist sector and WK the perfectly elastic supply of labour. Given a fixed amount
of capital at the outset, the demand for labour is initially represented by the marginal productivity
schedule of labour N1Q1. If we assume profit maximization, capital will be employed up to the
point where the current wage equals the marginal productivity of labour. If OW is the current
wage, the amount of labour employed in the capitalist sector is OM1. Beyond the point M1,
workers earn whatever they can in the subsistence sector. The total product in this case is
ON1P1M1 of which the share of wages is OWP1M1 and capitalist surplus or profits is N1WP1.
Criticism of the model
Model assumes that all profits made by the entrepreneurs will be reinvested, this may not
always be the case
Reinvestment may take place in the form of fixed capital but it may be capital that is labour
saving and thus demand for labour may in fact fall.
The model also assumes that there is a surplus of labour in the agricultural sector that can
easily move to the manufacturing sector.
Wage levels may not always be fixed. There may be upward pressure on wages for example
through trade union activity and profits may therefore fall.
The Neoclassical Counterrevolution: Market Fundamentalism
In the 1980`s, the political ascendancy of conservative governments in the United states, Canada,
Britain and West Germany came with a neoclassical counter revolution in economic theory and
policy. In developed nations, this counterrevolution favoured supply side macroeconomic policies,

rational expectations theories and privatisation of public corporations. In developing countries, it
called for freer markets and dismantling of public ownership, statist planning, and government
regulation of economic activities. Neoclassical obtained controlling votes on the boards of the two
most powerful international financial agencies – the World Bank and international Monetary Fund.
In conjunction and with the simultaneous erosion of influence of organization such as international
labour Organization (ILO), the United Nation Development Program (UNDP), and the United
Nation Conference on Trade and Development (UNCTAD), which more fully represent the views
of LDC delegates, it was inevitable that the neoconservative, free market challenge to the
interventionist arguments of dependence theories would gather momentum. The central argument
of the neoclassical counterrevolution is that underdevelopment results from poor resource
allocation due to incorrect pricing policies and too much state intervention by overly active
developing –nation governments. According to them what is needed is not a reform of the
international economic system, a restructuring of dualistic developing economies, an increase in
foreign aid, attempts to control population growth, or a more effective developing planning
system. Rather it is simply a matter of promoting free market and laissez –faire economics within
the context of permissive government that allows the magic of the market place and the invisible
hand of market prices to guide resource allocation and stimulate economic development. They
made emphasis to the Asian Tigers which embraces “free market” approach. The neoclassical
counterrevolution can be categorise under three different approaches:
1. The free Market approach: it argues that markets alone are efficient- product markets provide
the best signals for investments in new activities, labor markets respond to these new industries in
appropriate ways; producers know best what to produce and how to produce it efficiently, and
product and factor prices reflect accurate scarcity values of goods and resources now and in future.
Competition is effective, if not perfect; technology is freely available and nearly costless to absorb
information is also perfect and nearly costless to obtain. Under these circumstances, any
government intervention in the economy is by definition distortionary and counterproductive.
Free- market development economist have tended to assume that developing world markets are
efficient and that whatever imperfections exist are of little consequence.
2. Public – choice theory: this is also known as new political economy approach, it goes even
further to argue that government can do nothing right. This is because public-choice theory
assumes that politicians, bureaucrats, citizens and state act soley from a self-interested perspective,
using their power and authority of government for their own selfish ends. Citizens use political
influence to obtain special benefits from governments policies, politicians use government
resources to consolidate and maintain positions of power and authority. Bureaucrats and public
officials use their positions to extract bribes from rent seeking citizens and to operate protected
business on the side. The net result is not only a misallocation of resources but also a general
reduction in individual freedoms. The conclusion, therefore, is that minimal government is the best
government.
3. Market –friendly approach: this is a variant on the neoclassical counterrevolution associated
principally with the 1990`s writings of the world bank and its economists, many of whom were
more in the free market and public- choice camps during the 1980`s. this approach recognises that
there are many imperfections in LDC, product and factor markets and that the governments do
have a key role to play in facilitating the operation of market through “non-selective” interventions
for example by investing in physical and social infrastructure, health care facilities and educational
institutions and by providing a suitable climate for private enterprise. The market friendly
approach also differs from the free- market and public-choice schools of thought by accepting the
notion that market failures are more widespread in developing countries in areas such as
investment coordination and environmental outcomes.
John Rawl`s theory of justice
The term veil of ignorance was an idea by John Rawls in his book “Theory of Justice” in 1971 the
idea relates to how a just society can be formed. As Rawls argues the justice and the maximizing
of it becomes the basis for all social orders, he has to derive a philosophical justification for the
notion of justice as fairness. In order to accomplish this, Rawls develops the "veil of ignorance."
Essentially, it means that if an individual had no idea as to what and where they would fit in a
social or political order, they would make decisions with the least benefitted individuals in mind.
They would do this because this could be them. Few would create decisions that would benefit the
upper echelon of a social order because in a veil of ignorance, there is a distinct possibility that an
individual could wind up at the bottom rung of a social order. If a rational person had to select
policy within the veil of ignorance, they would do so ensuring that that the lower levels of society
would be represented in some manner for this could be them. The veil of ignorance is what Rawls
uses formulate his two premises of justice in that individuals have the right to individual liberty
and freedom in so far as it does not interfere with another and that social/ political orders have
accountability to ensure that those who are marginalized are spoken for in this political order as
justice being fairness, under the veil of ignorance, demands
Why is Inequality Bad
There are major answers to this question.
First: extreme income inequality leads to economic inefficiency. This is partly because at any
given average income, the higher the inequality, the smaller the fraction of the population that
qualifies for a loan or other credit. Indeed, one definition of relative poverty is the lack of
collateral.
When low- income individuals (whether they are absolutely poor or not) cannot borrow money,
they generally cannot adequately educate their children or start and expand a business. Moreover,
with high inequality, the overall rate of saving in the economy tends to be lower, because the
highest rate of marginal savings is usually found among the middle classes. Although the rich may
save a larger dollar amount, they typically save a smaller fraction of their incomes, and they
certainly save a smaller fraction of their marginal incomes. Landlords, business leaders,
politicians, and other rich elites are known to spend much of their incomes on imported luxury
goods, gold, jewellery, expensive houses, and foreign travel or to seek safe havens abroad for their
savings in what is known as capital flight. Such savings and investment do not add to the nations
productive resources; in fact, they represent substantial drains on these resources. In short, the rich
do not generally save and invest significantly larger proportions of their incomes (in the real
economic sense of productive domestic saving and investment) than the middle class or even the
poor.
Furthermore, inequality may lead to an inefficient allocation of assets. The second reason to be
concerned with inequality above the poverty line is that extreme income disparities undermine
social stability and solidarity. Worse, high inequality strengthens the political power of the rich
and hence their economic bargaining power.
Usually this power will be used to encourage outcomes favourable to themselves. High inequality
facilities rent seeking, including actions such as excessive lobbying, large political donations,
bribery and cronyism. When resources are allocated to such rent-seeking behaviours, they are
diverted from productive purposes that could lead to faster growth.
Finally, extreme inequality is generally viewed as unfair. The philosopher John Rawls proposed a
thought experiment to help clarify why this is so. Suppose that before you were born into this
world, you had a chance to select the overall level of inequality among the earth’s people but not
your own identity. That is, you might be born as Bill Gates, but you
might be born as the most wretchedly poor person in rural Ethiopia with equal probability. Rawls
calls this uncertainty the ‘’veil of ignorance.’’ The question is, facing this kind of risk; would you
vote for an income distribution that was more equal or less equal than the one you see around you?
If the degree of equality had no effect on the level of income or rate of growth, most people would
vote for nearly perfect equality.