Comprehensive Needs Assessment School: Carroll MS School ...
19
School Improvement Plan Comprehensive Needs Assessment School: Carroll MS Plan Year 2014-2016 Page 1 of 19 Data Components Areas of Strengths Areas of Concern Student Achievement EVAAS 2011-2012 to 2012-2013 comparison When comparing scores from 2011-2012 to 2012-2013, growth was made for each of the grade levels in reading and math. Growth was also made for 8th grade Science and Algebra I. 6th Reading -3.0 to -1.4 6th Math -5.9 to -5.4 7th Reading -1.1 to 2.0 7th Math -4.6 to 0.0 8th Reading -1.6 to -1.3 8th Math -4.8 to 1.1 8th Science -2.4 to -1.7 Algebra I -4.0 to -1.5 In the 2012-2013 EVAAS chart, we scored better than the district in 7th grade Reading and Math as well as in 8th grade Math. Based on the AMO Status Report in both Reading and Math, our White subgroup met reading proficiency in 2012-2013. 2010-2011 Overall EOG proficiency was 64.1 compared to the district average of 81.3 based on EOG Composite Scores. All three grade levels are below the district average on the EOG performance composite in both reading AND math: 6th grade reading = 61.3 vs. 79.3 for district 7th grade reading = 59.7 vs. 73.6 for district 8th grade reading = 59.2 vs. 75.5 for district 6th grade math = 65.9 vs. 83.4 for district 7th grade math = 67.6 vs. 84.5 for district 8th grade math = 69.1 vs. 85.4 for district When comparing all three grade levels within our school, 6th grade had the highest reading scores and 8th grade had the highest math scores. Only 15 of 25 (60%) federal target goals were met (AYP) The lowest performing subgroups were Black (34.1%), Hispanic (48.6%), Economically Disadvantaged (38.8%), LEP (23.7%), and SWD (24.3%) 2011-2012 Overall EOG proficiency was 63.6 compared to the district average of 82 based on EOG Composite Scores. All three grade levels are below the district average on the EOG performance composite in both reading AND math: 6th grade reading = 68.0 vs. 79.8 for district 7th grade reading = 54.1 vs. 73.9 for district 8th grade reading = 59.7 vs. 76.6 for district 6th grade math = 65.2 vs. 84.9 for district 7th grade math = 58.7 vs. 84.3 for district 8th grade math = 65.1 vs. 85.6 for district When comparing all three grade levels within our school, 6th grade had the highest reading and the highest math scores. Only 21 of 29 (72.4%) federal target goals were met according to the federal AMO status report. The lowest performing subgroups were Black (31.6%), Hispanic (41.2%), Asian (41.2%), Economically Disadvantaged (34.7%), LEP (18.2%), and SWD (24.2%). The majority of these subgroups showed a decrease in scores when compared to the 2010-2011 report. 2012-2013 Overall EOG proficiency is at 28.7 compared to the district average of 55 for 2012-2013 EOG scores. We are below the district average in all areas. The average Reading proficiency for all grades is 31.7 compared to district average of 54. The average Math proficiency for all grades is 20.2 compared to the district average of 48. CCMath1 has an average proficiency is 45.5 compared to the district average of 68. 8th grade Science scored a proficiency of 38 compared to the district score of 70. All three grade levels are below the district average on the EOG performance composite in both reading AND math: 6th grade reading = 29.7 vs. 55 for district 7th grade reading = 39.8 vs. 56 for district 8th grade reading = 26.7 vs. 50 for district 6th grade math = 19.7 vs. 51 for district 7th grade math = 23.5 vs. 50 for district 8th grade math = 17.8 vs. 42 for district Within our school, 7th grade had the highest scores in Reading and Math when compared to 6th and 8th grade. For 2012-2013, we met 18 of 29 (62.1%) of the federal AMO targets and 35 of 52 (67.3%) of the state AMO targets. Our Black, Hispanic, Economically Disadvantaged, LEP, SWD, and AG subgroups performed below target in both reading and math. The White subgroup also did not meet target expectations in math.
Transcript of Comprehensive Needs Assessment School: Carroll MS School ...

School Improvement Plan
Comprehensive Needs AssessmentSchool: Carroll MSPlan Year 2014-2016
Page 1 of 19
DataComponents Areas of Strengths Areas of Concern
Stud
ent
Achi
evem
ent
EVAAS 2011-2012 to 2012-2013 comparisonWhen comparing scores from 2011-2012 to 2012-2013, growth was made for each of the grade levels in reading and math. Growth was also made for 8thgrade Science and Algebra I.6th Reading -3.0 to -1.46th Math -5.9 to -5.47th Reading -1.1 to 2.07th Math -4.6 to 0.08th Reading -1.6 to -1.38th Math -4.8 to 1.18th Science -2.4 to -1.7Algebra I -4.0 to -1.5
In the 2012-2013 EVAAS chart, we scored better than the district in 7th grade Reading and Math as well as in 8th grade Math.
Based on the AMO Status Report in both Reading and Math, our White subgroup met reading proficiency in 2012-2013.
2010-2011Overall EOG proficiency was 64.1 compared to the district average of 81.3 based on EOG Composite Scores. All three grade levels are below thedistrict average on the EOG performance composite in both reading AND math:
6th grade reading = 61.3 vs. 79.3 for district7th grade reading = 59.7 vs. 73.6 for district8th grade reading = 59.2 vs. 75.5 for district
6th grade math = 65.9 vs. 83.4 for district7th grade math = 67.6 vs. 84.5 for district8th grade math = 69.1 vs. 85.4 for district
When comparing all three grade levels within our school, 6th grade had the highest reading scores and 8th grade had the highest math scores.
Only 15 of 25 (60%) federal target goals were met (AYP)The lowest performing subgroups were Black (34.1%), Hispanic (48.6%), Economically Disadvantaged (38.8%), LEP (23.7%), and SWD (24.3%)
2011-2012 Overall EOG proficiency was 63.6 compared to the district average of 82 based on EOG Composite Scores. All three grade levels are below the districtaverage on the EOG performance composite in both reading AND math:
6th grade reading = 68.0 vs. 79.8 for district7th grade reading = 54.1 vs. 73.9 for district8th grade reading = 59.7 vs. 76.6 for district
6th grade math = 65.2 vs. 84.9 for district7th grade math = 58.7 vs. 84.3 for district8th grade math = 65.1 vs. 85.6 for district
When comparing all three grade levels within our school, 6th grade had the highest reading and the highest math scores.
Only 21 of 29 (72.4%) federal target goals were met according to the federal AMO status report.The lowest performing subgroups were Black (31.6%), Hispanic (41.2%), Asian (41.2%), Economically Disadvantaged (34.7%), LEP (18.2%), and SWD(24.2%). The majority of these subgroups showed a decrease in scores when compared to the 2010-2011 report.
2012-2013 Overall EOG proficiency is at 28.7 compared to the district average of 55 for 2012-2013 EOG scores. We are below the district average in all areas.
The average Reading proficiency for all grades is 31.7 compared to district average of 54.The average Math proficiency for all grades is 20.2 compared to the district average of 48.CCMath1 has an average proficiency is 45.5 compared to the district average of 68.8th grade Science scored a proficiency of 38 compared to the district score of 70.
All three grade levels are below the district average on the EOG performance composite in both reading AND math:
6th grade reading = 29.7 vs. 55 for district7th grade reading = 39.8 vs. 56 for district8th grade reading = 26.7 vs. 50 for district
6th grade math = 19.7 vs. 51 for district7th grade math = 23.5 vs. 50 for district8th grade math = 17.8 vs. 42 for district
Within our school, 7th grade had the highest scores in Reading and Math when compared to 6th and 8th grade.
For 2012-2013, we met 18 of 29 (62.1%) of the federal AMO targets and 35 of 52 (67.3%) of the state AMO targets.Our Black, Hispanic, Economically Disadvantaged, LEP, SWD, and AG subgroups performed below target in both reading and math. The Whitesubgroup also did not meet target expectations in math.

School Improvement Plan
Comprehensive Needs AssessmentSchool: Carroll MSPlan Year 2014-2016
Page 2 of 19
DataComponents Areas of Strengths Areas of Concern
Inst
ruct
iona
lPr
actic
es/S
trat
egie
s
Based on Middle School Programs Visits (from the district) the following areas were summarized as "Glows":• activities were relevant/personal to students• students had choices in projects, tools, and groups• students were maximizing the use of technology • students were working in partners and groups
Based on the compilation of staff instructional rounds completed for quarters 1-3 of the 2013-2014 school year, the following areas were summarized as"Glows":
6th grade
• classroom environments were warm and inviting• students had opportunities for creativity such as creating and performing skits, participating in gallery walks, and blogging about the books they were reading• graphic organizers were used frequently as well as rotating stations• culture was made accessible and relevant to every day life7th grade
• students used cooperative groups to complete rigorous projects that connected lessons to real life and were assessed using rubrics• some classrooms were "flipped" successfully• students used media clips, drawing of concepts, ePhotos, paper slideshows, board builders, PowerPoints, and webquests on both computers and iPads• The "RACER" technique was consistently used across the grade level classrooms8th grade
• teachers used current events to relate to students' lives • students were asked open-ended questions and used graphic organizers to construct responses• science and math was connected into inquiry-based activities and students participated in rotating stations• student work was displayed• RAFT writing assignments were used in different classrooms• music, foldables, and gallery walks were incorporated in various ways into lessons
Based on the Middle School Programs visits (from the district), these areas were summarized as "Grows":• all students should be able to articulate the class objective and goal for the day• more differentiation is needed (small strategy groups and tiering of assignments)• assignments should have deeper complexity and rigor• students need the opportunity to create a portfolio of their work
Based on the compilation of staff instructional rounds completed for quarters 1-3 of the 2013-2014 school year, the following areas were summarized as"Grows":
6th grade• reduce student traffic in and out of classrooms during class time and eliminate student idle time during the class period• engage students more with academic vocabulary and language as well as work on using higher-level questioning techniques• increase group work and peer interactions and increase technology use• create more cross-curricular units and projects and reduce the use of worksheets• teachers should circulate more through the classrooms to monitor students' use of technology more carefully• teachers should work to increase the frequency of hands-on/manipulative activities
7th grade
• more often than not, the objective for the lesson was NOT posted• some teachers need the physical space for computers for group work• teachers should increase critical-thinking questions and activities• during group time, teachers should move around the room more and not remain sitting in one location• more structure is needed for students as they transition during project work time and off-task behaviors including horseplay need to be reduced• teachers need to consistently use PBIS tickets to reward appropriate behavior during class time
8th grade
• more student engagment is needed and the chattiness of students with side conversations needs to be reduced• teachers should consider posting jobs/roles for students and encourage more partner and group work• teachers should consistently enforce school-wide rules and policies (such as use of headphones, bookbags, etc)• higher level questioning is needed and greater use of discussion circles is encouraged to get students talking on-task; teachers should consider creating opportunitiesfor students to lead and facilitate discussions as well as teaching students how to be an audience member and ask meaningful questions• teachers should consider how to differentiate for students that complete assignments early

School Improvement Plan
Comprehensive Needs AssessmentSchool: Carroll MSPlan Year 2014-2016
Page 3 of 19
DataComponents Areas of Strengths Areas of Concern
Staf
f and
Stud
ent
Dem
ogra
phic
s
Enrollment Data
For 2011-2012 school year:Membership = 695Not FRPL= 295FRPL = 400% Not FRPL = 42.4%% FRPL = 57.6%% ESL = 4.6%% LEP = 8.5%
6th grade = 211 7th grade = 240 8th grade = 244Male students = 386Female students = 309Asian = 16Black = 282Hispanic = 127American Indian/Alaskan Native = 2Multi-racial = 37Native Hawaiian/Pacific Islander = 0White = 231
For 2012-2013 school year:Membership = 808Not FRPL= 316FRPL = 492% Not FRPL = 39.1%% FRPL = 60.9%% ESL = 3.3 %% LEP = 11.5%
6th grade = 282 7th grade = 246 8th grade = 280Male students = 456Female students = 352Asian = 19Black = 325Hispanic = 193American Indian/Alaskan Native = 2Multi-racial = 1Native Hawaiian/Pacific Islander = 1White = 244
For 2013-2014 school year:Membership = 837Not FRPL= 339FRPL = 498% Not FRPL = 40%% FRPL = 60%% ESL = 4.1%% LEP = 11.7%
6th grade = 307 7th grade = 277 8th grade = 253Male students = 468Female students = 369 Asian = 23Black = 303Hispanic = 210American Indian/Alaskan Native = 2Multi-racial = 28Native Hawaiian/Pacific Islander = 1White = 270
Teacher DataIn 2011-2012 and 2012-2013, 100% of Carroll teachers were Highly Qualified
Attendance DataFor both 2011-2012 and 2012-2013 school years, Carroll's average attendance percentage has been closely aligned with the district and state attendanceaverages. 2011-2012/2012-2013Carroll 95% /94%WCPSS 96% /96%NC 95% /95%
Behavior DataAccording to our NCReportCard for 2012-2013, there were 12 acts of violence (out of 808 students) that occurred. When calculated as the number of crimes/acts ofviolence per 100 students, our school scored 1.47 in comparison to the district score of .84 and the state score of .91. In the 2011-2012 report there were also 12acts of violence committed (out of 707 students) and the the score per 100 students was 1.7 for our school vs. the district score of .97 and the state score of .96.
In both 2011-2012 and 2012-2013, Carroll had a larger number of short and long term suspensions than the district with an increase in both categoriesfrom year to year. 2011-2012/2012-2013 Carroll 28.27/31.74 (short-term) .43/.61 (long-term)WCPSS 16.22/17.10 (short-term) .26/.20 (long-term)
Teacher Datafor 2010-2011, teacher turnover rate was 25%for 2011-2012, teacher turnover rate was 22%for 2012-2013, the teacher turnover rate was 13% and there were 4 National Board Certified Teachers at Carroll.

School Improvement Plan
Comprehensive Needs AssessmentSchool: Carroll MSPlan Year 2014-2016
Page 4 of 19
DataComponents Areas of Strengths Areas of Concern
Perc
eptio
n
The Teacher Working Conditions survey comparison from 2010-2012 showed improvements in several areas. The greatest improvements were in class sizesatisfaction, professional development and communications resources, parental communication/involvement/support, and teacher support. Teachers felt thatthey worked in a safe environment and felt encouraged to serve in leadership roles. Positive changes that came along with new administrative leadership include positivechanges in new teacher support, effective feedback, evaluation processes, and the level of trust and respect from school leadership. Evaluating professional development andcommunicating the results to faculty improved and teachers felt supported to try new pedagogy in their classrooms.100% of teachers agree that Carroll is a safe school environment.88.9% of teachers agree that Carroll is a good place to work and learn
According to the Student Survey of 2012-2013, 80% of our students feel safe at school and 67% of students like our school. This is a notable increase fromthe results of the Student Survey of 2011-2012 where only 68.4% of students reported feeling safe and 61% of students like our school.
The parental satisfaction survey (from August 2013-February 2014) showed that the vast majority of parents had a satisfactory visit to our school and thatthey felt we offered a safe and orderly environment. 1. Was your visit today satisfactory? Yes = 1498 No = 20 2. Is your child in a safe and orderly environment? Yes = 1500 No = 18
During the magnet transition process (from 2012-2013 to 2013-2014), 100% of teachers opted in to the re-interview process.
When comparing the Teacher Working Conditions Survey results of 2010 and 2012, the percentage of teachers that agree with the following statements show thatwe did NOT improve in the following areas:• time available to collaborate with colleagues down to 46.5% from 70.6% agreement• non-instructional time is sufficient down to 41.9% from 47.1% agreement• access to technology down to 77.8% from 88.2% agreement• local assessment data timely delivered down to 81.0% from 93.8% agreement
According to the Student Survey comparison between 2011-2012 and 2012-2013 students rated the overall quality of our school in the following way:
2011-2012 vs. 2012-2013 • excellent = 5.6% vs. 10%• good = 38.1% vs. 39%• fair = 36.5% vs. 35%• poor = 19.8% vs. 15%Overall, only 49% of students rated Carroll as good or excellent in 2012-2013. Although this percentage is still less than half of our students, it is anincrease from the student rating in 2011-2012 of 43.7% of students rating Carroll as good or excellent.
Based on High-Five PLT surveys for 2011-2012 (of which 30 teachers responded), the following questions/areas relating to PLTs need attention. Thesestatements are included here because they were the statements most disagreed with on the survey.The percentage of teachers who disagreed is inparenthesis after each statement.
#17 - require students in need to participate in other learning opportunities (33%)#20 - examine results of assessments to identify students in need (30%)#22 - I am a better teacher because of my work with my PLT (23%)#23 - My students are learning more because of my work with my PLT (23%)#25 - Time spent with my PLT will save me time overall (27%)#27 - My school celebrates team progress toward implementing our PLTs (27%)
Based on High-Five PLT surveys for 2012-2013 (of which 14 teachers responded), the following questions/areas relating to PLTs need attention. Thesestatements are included here because they were the statements most disagreed with on the survey. Percentages were not calculated in this data set as thedata was reported as COUNTS responding.#20 - improve examination of results to identify students in need#21 - improve examination of results to evaluate instructional practices#25 - improve impact of time with PLC#26 - increase feedback and support from leadership#27 - increase celebration of progress toward implementing our PLCs#28 - increase celebration of progress toward SMART goals#29 - use of formative assessments and increased frequency of testing #22 & #23 - the perception that PLTs are impacting teacher instruction and student learning could increase
According to the MISO survey of 2012-2013:-about 55 - 60% of students agree that they are interested or are confident in mathematics-student confidence in science is not strong where 68% say they cannot do a good job in science-23 - 28% of students disagree that science will be a part of their future-on average about 53% of students are interested or curious about STEM fields-over 75% of students responded that they are confident with the skills needed for 21st century learning-85% of students report planning to go to college.-following a question about if students know adults in STEM fields, Carroll needs to increase connecting students to adults in STEM fields.
School Improvement Plan
Comprehensive Needs AssessmentSchool: Carroll MSPlan Year 2014-2016
Page 5 of 19
DataComponents Areas of Strengths Areas of Concern
Prog
ram
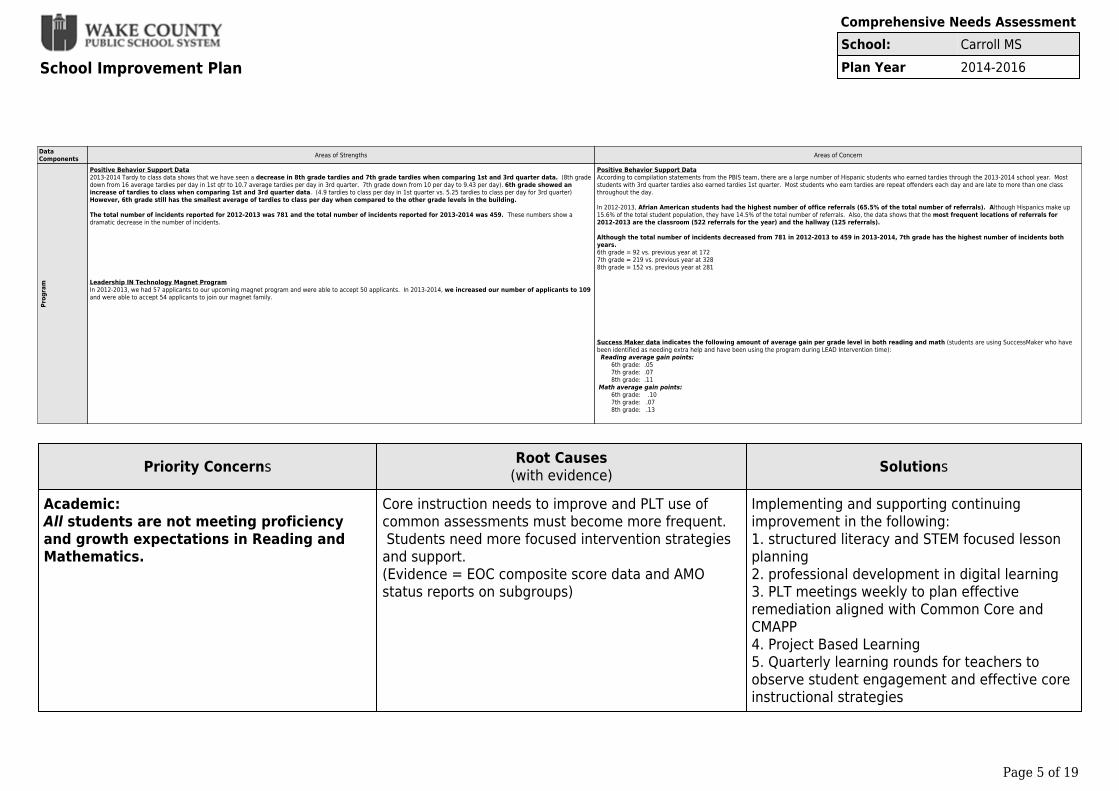
Positive Behavior Support Data2013-2014 Tardy to class data shows that we have seen a decrease in 8th grade tardies and 7th grade tardies when comparing 1st and 3rd quarter data. (8th gradedown from 16 average tardies per day in 1st qtr to 10.7 average tardies per day in 3rd quarter. 7th grade down from 10 per day to 9.43 per day). 6th grade showed anincrease of tardies to class when comparing 1st and 3rd quarter data. (4.9 tardies to class per day in 1st quarter vs. 5.25 tardies to class per day for 3rd quarter) However, 6th grade still has the smallest average of tardies to class per day when compared to the other grade levels in the building.
The total number of incidents reported for 2012-2013 was 781 and the total number of incidents reported for 2013-2014 was 459. These numbers show adramatic decrease in the number of incidents.
Leadership IN Technology Magnet ProgramIn 2012-2013, we had 57 applicants to our upcoming magnet program and were able to accept 50 applicants. In 2013-2014, we increased our number of applicants to 109and were able to accept 54 applicants to join our magnet family.
Positive Behavior Support DataAccording to compilation statements from the PBIS team, there are a large number of Hispanic students who earned tardies through the 2013-2014 school year. Moststudents with 3rd quarter tardies also earned tardies 1st quarter. Most students who earn tardies are repeat offenders each day and are late to more than one classthroughout the day.
In 2012-2013, Afrian American students had the highest number of office referrals (65.5% of the total number of referrals). Although Hispanics make up15.6% of the total student population, they have 14.5% of the total number of referrals. Also, the data shows that the most frequent locations of referrals for2012-2013 are the classroom (522 referrals for the year) and the hallway (125 referrals).
Although the total number of incidents decreased from 781 in 2012-2013 to 459 in 2013-2014, 7th grade has the highest number of incidents bothyears. 6th grade = 92 vs. previous year at 172 7th grade = 219 vs. previous year at 328 8th grade = 152 vs. previous year at 281
Success Maker data indicates the following amount of average gain per grade level in both reading and math (students are using SuccessMaker who havebeen identified as needing extra help and have been using the program during LEAD Intervention time): Reading average gain points: 6th grade: .05 7th grade: .07 8th grade: .11 Math average gain points: 6th grade: .10 7th grade: .07 8th grade: .13
Priority Concerns Root Causes(with evidence) Solutions
Academic: All students are not meeting proficiencyand growth expectations in Reading andMathematics.
Core instruction needs to improve and PLT use ofcommon assessments must become more frequent. Students need more focused intervention strategiesand support. (Evidence = EOC composite score data and AMOstatus reports on subgroups)
Implementing and supporting continuingimprovement in the following:1. structured literacy and STEM focused lessonplanning 2. professional development in digital learning3. PLT meetings weekly to plan effectiveremediation aligned with Common Core andCMAPP4. Project Based Learning5. Quarterly learning rounds for teachers toobserve student engagement and effective coreinstructional strategies

School Improvement Plan
Comprehensive Needs AssessmentSchool: Carroll MSPlan Year 2014-2016
Page 6 of 19
Priority Concerns Root Causes(with evidence) Solutions
Teacher Retention: In 2012-2013, the teacher turnover ratewas 13% and only 85% of teachers statedthey were satisfied at Carroll.
Teachers are still adjusting to the changes inleadership and to the addition of our magnet theme. Many new teachers were interviewed and hired inthe magnet school transition process. Also, someteachers do not believe in/perceive the validity andusefulness of PLTs nor do they maximize the use ofpeer planning and common assessments in theirindividual instruction.(evidence = TWC, High Five PLT survey)
Implement and continue supporting thefollowing:1. distributive leadership opportunitiesthroughout the school2. sharing of best practices and strategies3. quarterly learning rounds for teachers toobserve and learn from each other4. monthly teacher recognitions based on theinnovative use of technology and integration ofour magnet theme5. monthly mentee meetings with plannedagendas to support new teachers6. quarterly staff satisfaction surveys7. monthly staff appreciation activities8. ongoing staff development that isdifferentiated to meet different staff members'needs9. duty free lunch and planning as required bythe North Carolina policy

School Improvement Plan
Comprehensive Needs AssessmentSchool: Carroll MSPlan Year 2014-2016
Page 7 of 19
Priority Concerns Root Causes(with evidence) Solutions
Safe, Healthy, Schools: According to the Student Survey of2012-2013, only 49% of students rated ourschool as good or excellent and 80% ofstudents feel safe at our school.
Needs of certain subgroups are not being met inregards to teaching and explaining behaviorexpectations and following through withconsequences. These same subgroups may not feelsupported emotionally or socially either.
Implement and support the continuation of thefollowing interventions:1. Latina Girls lunch group2. Helping Hands mentoring3. ICC Mentoring Program4. PBIS rewards and incentives5. school and grade-level traditions (STEM night,field trips, pep rallies, dances, CCC Breakfast forCharacter Education, cultural artsperformances) 6. ensure that every student continues toreceive the physical activity requirements setforth by the Healthy Active Children Policy
Data SummaryDescribe your conclusionsA comprehensive look at our data indicates that our strengths include growth according to our EVAAS data, improved perception among the communityand teachers, and positive outcomes stemming from our PBIS program work. In addition, our data indicates that our priority concerns are the lack ofacademic growth for ALL students in Reading and Math (both in proficiency and growth), teacher turnover rate, and student perceptions of our school. Toaddress these concerns, we plan to participate and benefit from various professional development opportunities (such as digital portfolio building,academic vocabulary building, and project based learning), continue to maximize the positive impact of our Leadership IN Technology magnet theme onthe student and community perception of our school, and ensure that all teachers feel supported and are represented in decision making processes inorder to reduce the teacher turnover rate.

School Improvement Plan
Membership of School Improvement TeamSchool: Carroll MSPlan Year 2014-2016Principal: Cynthia KeechDate: Mar - 2014
Page 8 of 19
SIP Team MembersName School Based Job Title
1 Aaron Munz Teacher2 Courtney Harris Teacher3 Cynthia Keech Principal4 Donnell McLean Assistant Principal5 Jeremy Cominole Parent6 Jessica Streck Teacher7 Joe Boriatti Teacher8 Kathryn Green Teacher9 Rachael Jorgensen Teacher10 Raychelle Baptist Teacher11 Sharon Harris Instructional Support Personnel12 Tanya Guinn Other

School Improvement Plan
Mission, Vision and Value StatementsSchool: Carroll MSPlan Year 2014-2016Date: Mar - 2014
Page 9 of 19
Mission Statement:Carroll Leadership in Technology Magnet Middle School encourages, empowers, and equips our studentsto be positive and competitive leaders in the global community.
Vision Statement:At Carroll Leadership in Technology Magnet Middle School:• We will be nurturers of innovative leaders.• We will prepare students to create relationships built upon trust.• Through the use of cutting-edge technology, we will collaborate with all stakeholders in order to modelbeing positive, contributing members of a global community.
Value Statement:We teach students to collaborate meaningfully while working toward solutions to problems by fosteringpositive relationships with students, parents, colleagues, and the community.
We challenge every student to actively participate to the best of their ability; we evaluate, reflect andutilize data to support our decisions.
We behave as positive leaders and approach each day with the attitude that every student will learn.
We incorporate available technology and work cooperatively to support the academic achievement andpersonal growth of every student.
We encourage students, parents, and the community to recognize and celebrate success.

School Improvement Plan
Summary of Goals, Key Processes and Action StepsSchool: Carroll MSPlan Year 2014-2016LEA: Wake County (920)
Page 10 of 19
School Goal By June 2016, students in all subgroups, in grades 6 through8, will increase growth by 20% in reading and math asmeasured by EOG growth data. All students in all subgroupswill meet their AMO targets.
Goal Manager Sharon HarrisStrategic Directive Focus on Learning and Teaching
State Board of Education Goal Globally Competitive StudentsData Justification for Goal Based onComprehensive Needs Assessment
In the last three years, according to Carroll Middle School’sAYP/AMO data: only one subgroup (white) has met thetarget in Reading, with declines of .5% in all othersubgroups. In the last three years, according to CarrollMiddle School's AYP/AMO no subgroups met the target inmathematics with 1.5%+ declines.
1 Key Process Teachers across all content areas will implement PBL practices, Leadership,and Best Practices to increase literacy and mathematics instruction for allstudents.
Process Manager Joe Boriatti, Raychelle Baptist, Rachael JorgensenCompletion Date Jun - 2016
Restrainers Continuing development of CCSS and district directives, implementingCCSS, STEM, Leadership, and PBL standards/practices simultaneously,Limited technology resources/availability
Resources Discovery Ed, TLC, CCSS, STEM standards, C-mapp, organized PLTs,professional development plan, magnet coordinator, technology facilitator,RTI Coach, Google Apps, NBC Learn, Voice Thread, NC Wise Owl, SASCurriculum, Edmundo, ThinkfinityIn addition, we wish to utilize all budget flexibilities allowed by DPI, generalstatues, applicable laws, and local policies.
Measurable ProcessCheck(s)
Twice quarterly PLT’s will analyze common formative assessments todetermine student progress and the need for intervention and enrichmentsupport. Staff will complete three learning rounds quarterly for datacollection to determine the implementation of instructional practices forCCSS, STEM, PBL, and Leadership standards/practices.
1 Action Step PLTs will develop common assessments anddocument in minutes posted by subject area PLTs.
Timeline From 8/2014 To 6/2016
2 Action Step PLTs will use common test taking strategies such asC.U.T.E. and R.A.C.E.R. to improve comprehensionand test question deconstruction
Timeline From 8/2014 To 6/2016
3 Action Step Teachers will use c-Mapp and other resources for theimplementation of PBL practices, Leadership, and Best Practices.
Timeline From 8/2014 To 6/2016
School Improvement Plan
Summary of Goals, Key Processes and Action StepsSchool: Carroll MSPlan Year 2014-2016LEA: Wake County (920)
Page 11 of 19
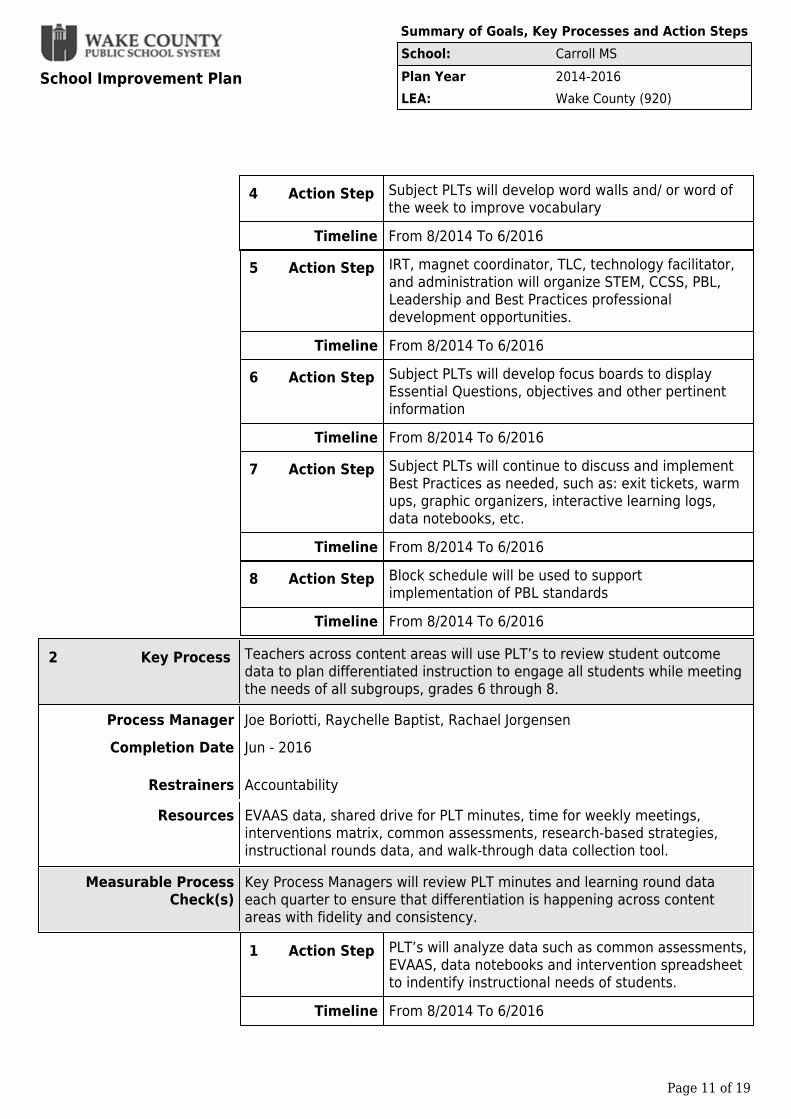
4 Action Step Subject PLTs will develop word walls and/ or word ofthe week to improve vocabulary
Timeline From 8/2014 To 6/2016
5 Action Step IRT, magnet coordinator, TLC, technology facilitator,and administration will organize STEM, CCSS, PBL,Leadership and Best Practices professionaldevelopment opportunities.
Timeline From 8/2014 To 6/2016
6 Action Step Subject PLTs will develop focus boards to displayEssential Questions, objectives and other pertinentinformation
Timeline From 8/2014 To 6/2016
7 Action Step Subject PLTs will continue to discuss and implementBest Practices as needed, such as: exit tickets, warmups, graphic organizers, interactive learning logs,data notebooks, etc.
Timeline From 8/2014 To 6/2016
8 Action Step Block schedule will be used to supportimplementation of PBL standards
Timeline From 8/2014 To 6/2016
2 Key Process Teachers across content areas will use PLT’s to review student outcomedata to plan differentiated instruction to engage all students while meetingthe needs of all subgroups, grades 6 through 8.
Process Manager Joe Boriotti, Raychelle Baptist, Rachael JorgensenCompletion Date Jun - 2016
Restrainers Accountability
Resources EVAAS data, shared drive for PLT minutes, time for weekly meetings,interventions matrix, common assessments, research-based strategies,instructional rounds data, and walk-through data collection tool.
Measurable ProcessCheck(s)
Key Process Managers will review PLT minutes and learning round dataeach quarter to ensure that differentiation is happening across contentareas with fidelity and consistency.
1 Action Step PLT’s will analyze data such as common assessments,EVAAS, data notebooks and intervention spreadsheetto indentify instructional needs of students.
Timeline From 8/2014 To 6/2016

School Improvement Plan
Summary of Goals, Key Processes and Action StepsSchool: Carroll MSPlan Year 2014-2016LEA: Wake County (920)
Page 12 of 19
2 Action Step PLT’s will discuss, document in minutes and post theminutes to show the use of research-basedinstructional strategies to be incorporated intoclassroom instruction (Examples: bell ringers, exittickets, game reviews, small group instruction,remediation and enrichment, DEN time, SMART lunchand differentiation).
Timeline From 8/2014 To 6/2016
3 Action Step Walkthrough teams will use the Walkthrough tool tomeasure the frequency of the use of differentiationstrategies.
Timeline From 8/2014 To 6/2016
4 Action Step Intervention team will analyze the results of thewalkthrough and instructional rounds data andintervention matrix in order to determine theappropriateness of the differentiation and studentengagement strategies.
Timeline From 8/2014 To 6/2016

School Improvement Plan
Summary of Goals, Key Processes and Action StepsSchool: Carroll MSPlan Year 2014-2016LEA: Wake County (920)
Page 13 of 19
School Goal By June 2016, there will be a 20% decrease in out-of-schoolsuspensions as measured by Carroll's SIRS data and 90%percent of CMMS parents and students will report that theyfeel safe at school and like our school as measured by theannual parent and student school climate surveys.
Goal Manager Jessica StreckStrategic Directive Systems and Structures to Support Schools
State Board of Education Goal Healthy Responsible StudentsData Justification for Goal Based onComprehensive Needs Assessment
According to the student survey of 2012-2013, 80% of ourstudents feel safe at school and 67% of students like ourschool.
Parents responded to a 2013-2014 parental satisfactionsurvey and indicated that the majority of parents hadsatisfactory visits to our school and that our school offered asafe and orderly environment. (satisfactory visit? Yes = 1498 and No = 20) (safe and orderly environment? Yes = 1500 and No = 18)
1 Key Process Address the needs of subgroups at-risk of out-of-school suspensions atCarroll by implementing the following interventions:• Latina Girls Lunch Group• Helping Hands Mentoring• Behavior Education Program (BEP) (Check in-Check-out CICO)• PBIS rewards and incentives
Process Manager Aaron MunzCompletion Date Jun - 2016
Restrainers Environmental factors affecting students at-risk that happen outside ofschool; designated individuals to collect data from specific sources
Resources PBIS Team, SIRSdata, OSS data, ISS data, ALC data, ASD data, PRIDEexpectations published, PBIS reward incentives, William Bunn LeadershipProgramStudents are assigned to a PE class daily for 30 minutes of activityin orderto follow the Healthy Active Children Policy.Carroll Middle School's Character Education Program includes teachersnominating a student once a month for a designated character trait; thosestudents attend a Character Breakfast at the end of the month (parents ofthe students are invited to attend).
Carroll Middle School has a safe and orderly schools plan.
Measurable ProcessCheck(s)
The Key Process Manager will review SIRS data quarterly and administersurveys to intervention groups quarterly to measure success ofinvolvement.

School Improvement Plan
Summary of Goals, Key Processes and Action StepsSchool: Carroll MSPlan Year 2014-2016LEA: Wake County (920)
Page 14 of 19
1 Action Step Counselors, PBIS Team, Tier II Team, PLTs, andAdministrators will have input for student selection inall intervention groups.
Timeline From 8/2014 To 6/2016
2 Action Step During weekly team PLTs, teachers will review theefficiency of interventions groups with their studentsduring "kid talk."
Timeline From 8/2014 To 6/2016
3 Action Step During a staff meeting once a quarter, interventiongroup representatives will report out to faculty andstaff about the progress of students in the targetedat-risk subgroups
Timeline From 8/2014 To 6/2016
2 Key Process Create a welcoming, safe, and positive school climate by implementingextra-curricular activities, PBIS rewards and incentives, bully preventionbox, positive teacher-student relationships, and school/grade leveltraditions (such as the CCC Breakfast, pep rallies, school dances, field trips,STEM night, cultural arts performances, etc)
Process Manager Aaron MunzCompletion Date Jun - 2016
Restrainers Survey return rate
Resources Ways to communicate with parents, surveys
Measurable ProcessCheck(s)
Grade level counselors will annually administer school climate sureysduring LEAD class time for both parents and students to determine theeffectiveness of the aforementioned strategies for improving school climate.
1 Action Step The Student Services Team, PBIS Team, and staff willmonitor progress via survey information and level ofparticipation in all school activities.
Timeline From 8/2014 To 6/2016
2 Action Step Weekly highlights related to school activities will bedisseminated via students throughout the school.
Timeline From 8/2014 To 6/2016

School Improvement Plan
Waiver RequestSchool: Carroll MSPlan Year 2014-2016
Page 15 of 19
Date Aug - 2014Waiver RequestedN/AHow will this waiver impact school improvement?N/APlease indicate the type of waiver: LocalPlease indicate the policy to be waived N/A

School Improvement Plan
Summary Sheet of Professional Development ActivitiesSchool: Carroll MSPlan Year 2014-2016School Year: 2014-2015
Page 16 of 19
Development Activities for
Topic: Participants: GoalSupported:
SupportingData:
Results from the end-of-year staff surveywhich will be administered and collected atthe close of the 2013-2014 school year willdetermine the professional developmentactivities for the upcoming 2014-2015 schoolyear.
So far, we are sure we will be offeringprofessional development in Digital DataNotebooks and Covey's 7 Habits(refresher).
Our staff will respond to the professionaldevelopment survey and will be asked tochoose from the following opportunities:• Project Based Learning• Padeia• Digital Learning/Technology (equipment use)• PowerSchool• Classroom Management/PBIS• Motivational Strategies• other
All Carroll MagnetMiddle School staffmembers.
Academic Goal TBD

School Improvement Plan
Summary Sheet of Professional Development ActivitiesSchool: Carroll MSPlan Year 2014-2016School Year: 2015-2016
Page 17 of 19
Development Activities for Topic: Participants: Goal Supported: Supporting Data:
School Improvement Plan
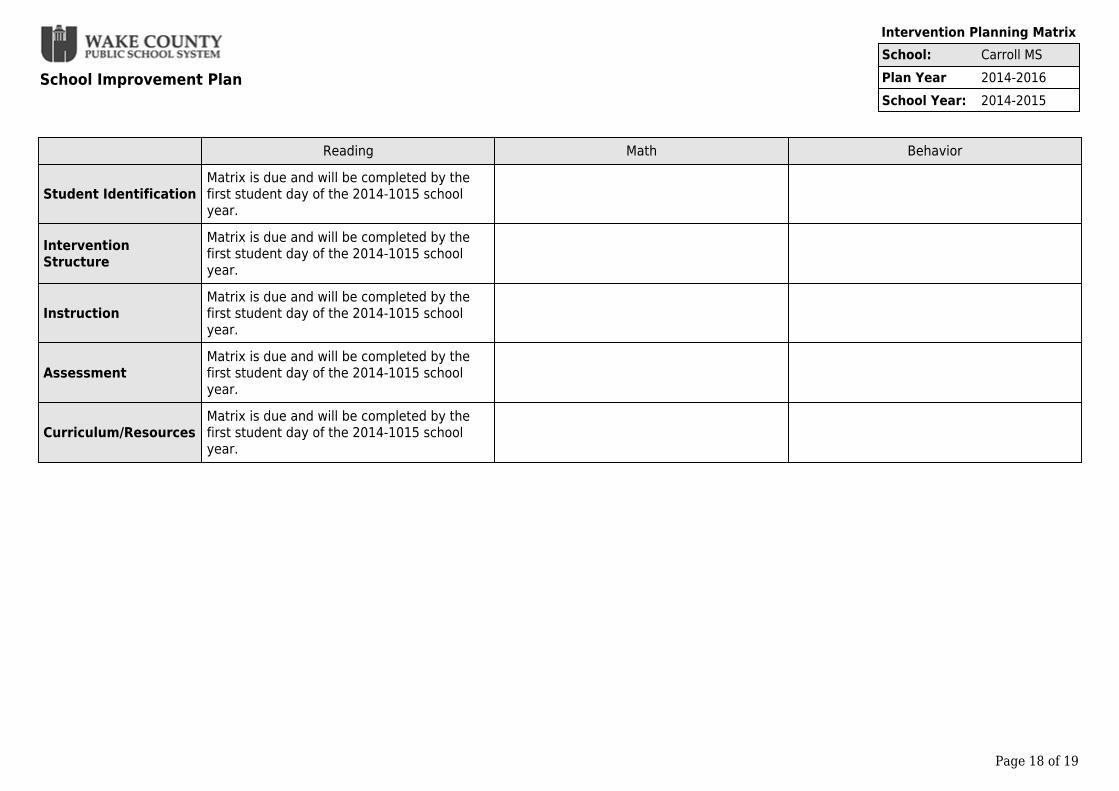
Intervention Planning MatrixSchool: Carroll MSPlan Year 2014-2016School Year: 2014-2015
Page 18 of 19
Reading Math Behavior
Student IdentificationMatrix is due and will be completed by thefirst student day of the 2014-1015 schoolyear.
InterventionStructure
Matrix is due and will be completed by thefirst student day of the 2014-1015 schoolyear.
InstructionMatrix is due and will be completed by thefirst student day of the 2014-1015 schoolyear.
AssessmentMatrix is due and will be completed by thefirst student day of the 2014-1015 schoolyear.
Curriculum/ResourcesMatrix is due and will be completed by thefirst student day of the 2014-1015 schoolyear.

School Improvement Plan
Intervention Planning MatrixSchool: Carroll MSPlan Year 2014-2016School Year: 2015-2016
Page 19 of 19
Reading Math BehaviorStudent IdentificationInterventionStructureInstructionAssessmentCurriculum/Resources