Designing for Search Engines MIS 314 MIS 314 Mr. David Auer.

Comprehensive Integrated Master
Plan for Chennai Bengaluru
Industrial Corridor Final Report
Krishnapatnam Industrial Node
Development Plan
October 2015
Japan International Cooperation Agency
PricewaterhouseCoopers Co., Ltd.
Nippon Koei Co., Ltd.
4RJR
15-050

Table of Contents
1 Executive Summary 12
2 Introduction 57
2.1 Context of Industrial Corridors for Sustainable Growth 57
2.2 Objective of the Study 58
2.3 Selection of Nodes 59
2.4 Approach & Methodology 61
2.5 Vision for CBIC 64
2.6 Coverage of Final Report 65
3 Overview of Nellore District and Krishnapatnam Industrial Node 66
3.1 Regional Assessment of Krishnapatnam Area 66
3.2 Socio-Economic Profile of Nellore District 69
3.3 Industrial Infrastructure Profile 76
3.4 Overview of the Krishnapatnam Industrial Node 81
4 Node Development Vision – Krishnapatnam 86
4.1 Analytical Framework for Development of Node Vision 86
4.2 Potential as an Industrial Hub for Resource-driven Industries 86
4.3 Vision for Krishnapatnam – Building a Competitive Node 88
5 Industrial Development Analysis 94
5.1 Proposed Industries Mix for Krishnapatnam Industrial Node 94
5.2 Planning development of industry sectors for KPT Industrial node 96
5.3 Implementation of recommendations 141
6 Land Use Plan 144
6.1 Review of Existing Development Plan 144
6.2 Development Framework 146
6.3 Land Use Plan 147
6.4 Development Plan for Residential Area 151
6.5 Implementation Plan (Development Schedule) 152
6.6 Cost Estimate 153
7 Infrastructure Development Plan 154
7.1 Roads and Public Transport 154
7.2 Railways 192
7.3 Logistics 200
7.4 Power 210
7.5 Water 236 Final Report - Krishnapatnam Industrial Node Development Plan PwC/Nippon Koei 1

7.6 Solid Waste Management 266
8 Economic cost benefit assessment 287
8.1 Methodology for economic cost benefit assessment 287
8.2 Assumptions 287
8.3 Key Economic Benefits 290
8.4 Detailed cost-benefit analysis Krishnapatnam IN 292
8.5 Benefit-cost ratio 293
9 Financial Assessment and Planning 295
9.1 Basic assumptions for the Financial Model 295
9.2 Project cost 296
9.3 Revenues 299
9.4 Scenario and Sensitivity Analysis for Project Viability 300
10 Environmental and Social Considerations for Node Development Plan 303
10.1 Introduction 303
10.2 Necessary Environmental Studies for the Prioritized Nodes 303
10.3 Framework for EIA Studies for the Prioritized Node Developments 303
10.4 Initial Environmental Examination (IEE) Study 304
10.5 Recommendations(Necessary Action and Schedule) 311
11 Institutional and Financing Framework for Krishnapatnam Industrial Node 314
11.1 Approach towards formulation of Institutional Framework for CBIC 315
11.2 Assessment of key provisions of administrative and implementation framework for large area industrial developments in India 316
11.3 Key pointers for CBIC from stakeholder consultations on current DMIC structure 321
11.4 Summary of key learnings for CBIC 325
11.5 Proposed Institutional and Financing Framework for development of Krishnapatnam Node and CBIC in Andhra Pradesh 327
12 Investment Environment Improvement 337
12.1 Background 337
12.2 CBIC state investment environment status 337
12.3 Analytical framework 345
12.4 Analysis 346
12.5 Recommendations to improve investment environment 369
11.6 Policy Recommendation on Improvement of Soft Issues 370
13 Way Forward for Development of Nodes 377
Final Report - Krishnapatnam Industrial Node Development Plan PwC/Nippon Koei 2

List of Figures Figure 1.1: Vision and Objective of National Manufacturing Policy ......................................................................... 12 Figure 1.2: Nodes selected for CBIC ........................................................................................................................... 14 Figure 1.3: Industrial hubs in proximity to the Krishnapatnam Industrial Node ................................................... 15 Figure 1.4: Major components of GDDP of Nellore district ...................................................................................... 16 Figure 1.5: Investment composition, Nellore district, % ........................................................................................... 16 Figure 1.6: Node Boundary of Krishnapatnam ......................................................................................................... 30 Figure 1.7: Distribution of Settlements in Krishnapatnam Node ............................................................................ 30 Figure 1.8: Enhancement of Connectivity among Surrounding Cores .................................................................... 32 Figure 1.9: Infrastructure Development Plan for Krishnapatnam Industrial Node ............................................... 34 Figure 1.10: Water Balance for the Phase 3 .............................................................................................................. 39 Figure 1.11: Solid waste management in the Nodefor the Phase 3 ........................................................................... 41 Figure 1.12: Sensitivity Analysis – Master SPV......................................................................................................... 50 Figure 1.13: Sensitivity Analysis – unbundling of utilities ....................................................................................... 50 Figure 1.14: Central level institutional structure for CBIC in Andhra Pradesh ....................................................... 51 Figure 1.15: State level institutional structure for CBIC in Andhra Pradesh .......................................................... 52 Figure 1.16: Option 1- Financing framework for CBIC in Andhra Pradesh ............................................................. 53 Figure 1.17: Option 2- Financing framework for CBIC in Andhra Pradesh ............................................................ 53 Figure 2.1: Vision and Objective of National Manufacturing Policy ........................................................................ 57 Figure 2.2: Trend in manufacturing contribution to GDP across developing countries ......................................... 57 Figure 2.3: Industrial Corridor Development Projects ............................................................................................ 58 Figure 2.4: Study Framework .................................................................................................................................... 59 Figure 2.5: Nodes selected for CBIC including three nodes selected for Master plan development ...................... 61 Figure 2.6: Study Framework ..................................................................................................................................... 61 Figure 2.7: Parameters used for short-listing of potential sector in the corridor ................................................... 62 Figure 2.8: Industry Sectors to be promoted within the corridor ........................................................................... 63 Figure 2.9: Public Private Partnership in Node Development ................................................................................ 63 Figure 3.1: Infrastructure map of Krishnapatnam ................................................................................................... 67 Figure 3.2: Population density in 2013 of Krishnapatnam and the surrounding area ........................................... 67 Figure 3.3: Cluster development of South Nellore ................................................................................................... 68 Figure 3.4: Demographic profile of Nellore district ................................................................................................. 69 Figure 3.5: Employable population and distribution of workers across main categories ...................................... 70 Figure 3.6: GDP composition in Andhra Pradesh and Nellore district, % .............................................................. 70 Figure 3.7: Composition of secondary sector in Nellore district .............................................................................. 71 Figure 3.8: GDP at constant 2004-05 prices, Nellore district vs CBIC districts, Andhra Pradesh and India ...... 72 Figure 3.9: Major components of GDDP of Nellore district .................................................................................... 72 Figure 3.10: Composition of manufacturing sector of Nellore district.................................................................... 73 Figure 3.11: Distribution of employees in registered sector ..................................................................................... 73 Figure 3.12: Per capita income of Nellore district vs Andhra Pradesh and India ................................................... 74 Figure 3.13: Cumulative FDI in AP sector wise ........................................................................................................ 74 Figure 3.14: Upcoming investment in manufacturing sector, Nellore district ........................................................ 75 Figure 3.15: Value of exports in AP and India ........................................................................................................... 75 Figure 3.16: AP exports by major economic groups and dynamics of manufacturing sector exports in AP ......... 76 Figure 3.17: Industrial Hubs in proximity to Krishnapatnam Industrial Node ...................................................... 80 Figure 3.18: Node Boundary of Krishnapatnam ........................................................................................................ 81 Figure 3.19: Location of Nodes .................................................................................................................................. 82 Figure 3.20: Location of Nellore District .................................................................................................................. 82 Figure 3.21: Geography of Krishnapatnam SEZ ....................................................................................................... 82 Figure 3.22: Distribution of Settlements in Krishnapatnam Node ......................................................................... 83 Figure 3.23: Reservoir nearby Node Area ................................................................................................................. 84 Figure 3.24: Surface of Node Area ............................................................................................................................. 84 Figure 3.25: Existing Access Road ............................................................................................................................. 84 Final Report - Krishnapatnam Industrial Node Development Plan PwC/Nippon Koei 3
Figure 3.26: Subbase of the Access Road .................................................................................................................. 84 Figure 5.1: Sectors shortlisted as potential sectors for the corridor ........................................................................ 94 Figure 5.2: Top sectors in Nellore district vs AP ...................................................................................................... 94 Figure 5.3: Share of AP CBIC districts in total output of Nellore specific leading districts ................................... 95 Figure 5.4: Top exporting countries based on value of exports ............................................................................... 96 Figure 5.5: FDI in food processing sector, India ...................................................................................................... 98 Figure 5.6: Natural resources in Nellore district – agriculture, aquaculture........................................................ 100 Figure 5.7: Manufacturing sectors of Nellore district and upcoming investments .............................................. 100 Figure 5.8: Share of world imports in food processing product groups of top importing countries in the Southeast Asia; proximity from KPT port ............................................................................................................... 102 Figure 5.9: Value chain in food processing sector .................................................................................................. 104 Figure 5.10: Constitution of food processing exports basket in India – level of processing complexity (value addition), 2003 vs 2013 ............................................................................................................................................105 Figure 5.11: Gap in cold storage capacity, 2010, CBIC states, million MT ............................................................ 106 Figure 5.12: Cost structure – food processing sector ............................................................................................. 108 Figure 5.13: Labour productivity for food processing (fish & seafood) sector ...................................................... 109 Figure 5.14: Process time taken for production and reaching to market ............................................................... 110 Figure 5.15: Contribution of sub-sectors to metallurgy sector GDP ....................................................................... 115 Figure 5.16: Growth rate of India’s GDP vs. Metallurgy sector .............................................................................. 115 Figure 5.17: FDI in metallurgical sector, India ........................................................................................................ 117 Figure 5.18: Growth in trade of iron and steel commodities .................................................................................. 118 Figure 5.19: Natural resources of Nellore district ................................................................................................... 118 Figure 5.20: Manufacturing sectors of Nellore district, 2010-11 ............................................................................ 119 Figure 5.21: Share of world imports in metallurgy product groups of top importing countries in the Southeast Asia; proximity from KPT port ................................................................................................................................ 120 Figure 5.22: Constitution of iron, steel and its articles in export basket of India vs. top exporting countries – Level of processing complexity (value addition) ..................................................................................................... 122 Figure 5.23: Constitution of copper and its articles in export basket of India vs. top exporting countries – Level of processing complexity (value addition) ............................................................................................................... 122 Figure 5.24: Constitution of aluminum and its articles in export basket of India vs. top exporting countries – Level of processing complexity (value addition) ..................................................................................................... 122 Figure 5.25 Change in the value of exports of iron and steel products between 2003 and 2013 among top exporting countries in the world .............................................................................................................................. 123 Figure 5.26: Top exporting countries based on value of exports ........................................................................... 128 Figure 5.27: Composition of electrical machinery output, India ............................................................................ 129 Figure 5.28: FDI in electrical machinery sector, India .......................................................................................... 130 Figure 5.29: Share of world imports in electrical machinery product groups of top importing countries in the Southeast Asia; proximity from KPT port ................................................................................................................ 133 Figure 5.30: Cost breakup (as a % of total sales) in India vs leading manufacturers of electrical machinery ..... 135 Figure 5.31: Labour productivity in India and leading electrical machinery manufacturing countries ............... 136 Figure 5.32: Process time in electrical machinery sector for India and leading electrical machinery manufacturing countries, days ................................................................................................................................. 137 Figure 5.33: Capacity utilization in electrical machinery sector for India and leading electrical machinery manufacturing countries ........................................................................................................................................... 137 Figure 5.34: Electrical machinery cluster in Nashik ...............................................................................................138 Figure 6.1: Existing Master Plan of Krishnapatnam Port ....................................................................................... 144 Figure 6.2: Road Connectivity of Krishnapatnam Node ......................................................................................... 145 Figure 6.3: Road Network in Krishnapatnam Node ............................................................................................... 148 Figure 6.4: Phasing Plan ...........................................................................................................................................150 Figure 7.1: Number of Lanes on Major External Linkage (Krishnapatnam) ......................................................... 154 Figure 7.2: Work Flow for Commuter Traffic Demand Estimate ........................................................................... 156 Figure 7.3: Envisaged Direction of Urbanization .................................................................................................... 157 Figure 7.4: Identification of Node Access Point ...................................................................................................... 158 Figure 7.5: Proposed Work Time Zones ................................................................................................................... 159 Figure 7.6: Work Flow for Freight Traffic Demand Estimate ................................................................................ 160 Final Report - Krishnapatnam Industrial Node Development Plan PwC/Nippon Koei 4

Figure 7.7: Access Roads to Krishnapatnam Node by Access Points ..................................................................... 162 Figure 7.8: External Road Connectivity from Siddavaram to Naidupeta via Durgarajapatnam .......................... 164 Figure 7.9: Work Flow for Demand Supply Analysis .............................................................................................. 164 Figure 7.10: Industrial and Urban Road Hierarchy ................................................................................................ 170 Figure 7.11: Standard for Industrial and Urban Road Network Segment .............................................................. 170 Figure 7.12: Concept of Cross-section Planning Based on Road Functions ........................................................... 171 Figure 7.13: Integrated Traffic Control System ....................................................................................................... 172 Figure 7.14: Proposed Typical Cross Section (Primary-Industry-6Lanes)............................................................. 174 Figure 7.15: Proposed Typical Cross Section (Primary-Industry-4Lanes-Stage) .................................................. 174 Figure 7.16: Proposed Typical Cross Section (Primary-Industry-4Lanes)............................................................. 175 Figure 7.17: Proposed Typical Cross Section (Primary-6Lanes) ............................................................................. 176 Figure 7.18: Proposed Typical Cross Section (Primary-6Lanes-Stage) .................................................................. 176 Figure 7.19: Proposed Typical Cross Section (Primary-4 Lanes) ........................................................................... 176 Figure 7.20: Proposed Typical Cross Section (Primary-Residential-6 Lanes) ...................................................... 176 Figure 7.21: Proposed Typical Cross Section (Primary-Residential-6 Lanes-Stage) ............................................. 177 Figure 7.22: Proposed Typical Cross Section (Primary-Residential-4 Lanes) ....................................................... 177 Figure 7.23: Proposed Typical Cross Section (Secondary-4 Lanes) ....................................................................... 178 Figure 7.24: Proposed Typical Cross Section (Secondary-Residential-4 Lanes) ................................................... 178 Figure 7.25: Proposed Typical Cross Section (Tertiary-4 Lanes) ........................................................................... 178 Figure 7.26: Proposed Typical Cross Section (Tertiary-Residential-2 Lanes) ....................................................... 179 Figure 7.27: Proposed Typical Cross Section (Primary-6 Lanes) ........................................................................... 179 Figure 7.28: Proposed Typical Cross Section (Primary-4 Lanes) ........................................................................... 179 Figure 7.29: Proposed Typical Cross Section (Secondary-4 Lanes) ...................................................................... 180 Figure 7.30: Proposed Typical Cross Section (Tertiary-4 Lanes) .......................................................................... 180 Figure 7.31: Proposed Typical Cross Section (Tertiary-2 Lanes) ........................................................................... 180 Figure 7.32: Proposed Typical Cross Section of LRT (Embankment Section)....................................................... 181 Figure 7.33: Proposed Typical Cross Section of LRT (Bridge Section) .................................................................. 181 Figure 7.34: Road and Public Transport Facilities Development Plan in Internal Krishnapatnam Node (Phase 1) ................................................................................................................................................................................... 182 Figure 7.35: Road and Public Transport Facilities Development Plan in Internal Krishnapatnam Node (Phase 2) ....................................................................................................................................................................................183 Figure 7.36: Road and Public Transport Facilities Development Plan in Internal Krishnapatnam Node (Phase 3) ................................................................................................................................................................................... 184 Figure 7.37: Road and Public Transport Facilities Development Plan in External Krishnapatnam Node (Phase 1) ................................................................................................................................................................................. 185 Figure 7.38: Road and Public Transport Facilities Development Plan in External Krishnapatnam Node (Phase 2) ................................................................................................................................................................................ 186 Figure 7.39: Road and Public Transport Facilities Development Plan in External Krishnapatnam Node (Phase 3) ................................................................................................................................................................................. 187 Figure 7.40: Krishnapatnam Node – Layout of proposed rail access line and reception sidings ........................ 194 Figure 7.41: Krishnapatnam Node - View facing North .......................................................................................... 195 Figure 7.42: Krishnapatnam Node - View facing South .......................................................................................... 195 Figure 7.43: Krishnapatnam Logistics Hub - Layout ............................................................................................. 202 Figure 7.44: Underground distribution network: Characteristics .......................................................................... 214 Figure 7.45: Existing power infrastructure for node ............................................................................................... 216 Figure 7.46: Sub-station locations for Phase I ....................................................................................................... 220 Figure 7.47: Sub-station locations for Phase II........................................................................................................ 221 Figure 7.48: Sub-station locations for Phase III ..................................................................................................... 222 Figure 7.49: Proposed distribution network for the node superimposed on master plan for roads ................... 224 Figure 7.50: Water Flow Diagram of the Node ....................................................................................................... 237 Figure 7.51: Rainfall in One Hour as per IRC-42 .................................................................................................... 244 Figure 7.52: Krishnapatnam Node Drainage Basin Plan ....................................................................................... 245 Figure 7.53: Water Balance of Krishnapatnam Node ............................................................................................. 247 Figure 7.54: Location of Water Sources of Krishnapatnam Node ......................................................................... 248 Figure 7.55: System configuration of MBR ............................................................................................................. 250 Final Report - Krishnapatnam Industrial Node Development Plan PwC/Nippon Koei 5

Figure 7.56: Layout Plan of Potable Water Supply System .................................................................................... 252 Figure 7.57: Layout Plan of Non-Potable Water Supply System ........................................................................... 255 Figure 7.58: Layout Plan of Sewerage System ........................................................................................................ 257 Figure 7.59: Layout Plan of Industrial Effluent Collection System ....................................................................... 259 Figure 7.60: Layout Plan of Stormwater Drainage System ..................................................................................... 261 Figure 7.61: Phase Development Plan for Stormwater Drainage System ............................................................. 262 Figure 7.62: Estimates of Non-hazardous Industrial Waste .................................................................................. 270 Figure 7.63: Estimates of Municipal Solid Waste ................................................................................................... 272 Figure 7.64: Hazardous waste treatment system ................................................................................................... 275 Figure 7.65: capacity of AFR pre-processing facility .............................................................................................. 275 Figure 7.66: Capacity of hazardous waste sanitary landfill .................................................................................... 276 Figure 7.67: Segregation at source............................................................................................................................ 277 Figure 7.68: Solid waste management in the Node ................................................................................................ 280 Figure 7.69: Capacity of Compost plant and biomethanation plant ..................................................................... 281 Figure 7.70: Capacity of sorting plant ..................................................................................................................... 281 Figure 7.71: Capacity of Sanitary landfill ................................................................................................................ 281 Figure 7.72: Image of municipal solid waste management .................................................................................... 282 Figure 8.1: Deadweight assessment......................................................................................................................... 289 Figure 9.1: O&M costs – Krishnapatnam Industrial Node .................................................................................... 298 Figure 9.2: Revenue streams in Krishnapatnam Industrial Node ......................................................................... 299 Figure 9.3: Cash available vs debt service obligations, Rs. crore........................................................................... 300 Figure 9.4: Sensitivity Analysis – Master SPV ........................................................................................................ 301 Figure 9.5: Sensitivity Analysis – unbundling of utilities ...................................................................................... 302 Figure 10.1: Review Meeting on 25th July, ............................................................................................................. 303 Figure 10.2: Location of Sensitive Area ................................................................................................................... 305 Figure 10.3: General View of Krishnapatnam Node ............................................................................................... 306 Figure 10.4: Necessary Action for EIA study ........................................................................................................... 311 Figure 11.1: 8 industrial nodes selected along CBIC ................................................................................................ 314 Figure 11.2: DMIC Project Implementation Framework ........................................................................................ 317 Figure 11.3: Financing framework for DMIC .......................................................................................................... 320 Figure 11.4: Central level institutional structure for CBIC in Andhra Pradesh ..................................................... 331 Figure 11.5: State level institutional structure for CBIC in Andhra Pradesh ......................................................... 331 Figure 11.6: Option 1- Financing framework for CBIC in Andhra Pradesh ........................................................... 335 Figure 11.7: Option 2- Financing framework for CBIC in Andhra Pradesh .......................................................... 336 Figure 12.1: Per Capita Income at Current Prices (2010-11) .................................................................................. 338 Figure 12.2: Received FDI Equity (April 2000 - November 2013) ........................................................................ 338 Figure 12.3: Doing Business Ranking in India (Latest-2009) ............................................................................... 339 Figure 12.4 : Manufacturing industry maturity (2005) ......................................................................................... 339 Figure 12.5: International comparison of manufacturing GDP contribution (2010) .......................................... 340 Figure 12.6: Feedback from private investors ......................................................................................................... 345 Figure 12.7: Power supply position (Energy), CBIC states vs Gujarat .................................................................. 347 Figure 12.8: Power supply position (peak demand met), CBIC states vs Gujarat ................................................ 347 Figure 12.9: Industrial electricity tariff, 2014-15 .................................................................................................... 348 Figure 12.10: IPPs installed capacities .................................................................................................................... 348 Figure 12.11: Renewable energy installed capacities .............................................................................................. 348 Figure 12.12: Port Utilization of a Major Port in each state ................................................................................... 349 Figure 12.13: Non-Major Port per Total in Traffic .................................................................................................. 349 Figure 12.14: Duration for Land allocation ............................................................................................................. 350 Figure 12.15: Duration for Land conversion ........................................................................................................... 350 Figure 12.16: Duration for Approval for the building plan ..................................................................................... 351 Figure 12.17: Business Regulatory Compliances for EM Registration .................................................................. 354 Figure 12.18: Authority for Industrial Park Development by State ....................................................................... 356 Figure 12.19: Power Capacity and Demand (MW) ................................................................................................. 359 Figure 12.20: Ratio of renewable energy ................................................................................................................. 359 Figure 12.21: Electricity Tariff ................................................................................................................................. 360 Final Report - Krishnapatnam Industrial Node Development Plan PwC/Nippon Koei 6

Figure 12.22: Traffic of Cargo Container (T.E.U.s).................................................................................................. 361 Figure 12.23: Ratio of surfaced road ....................................................................................................................... 362 Figure 12.24: The No. and area of Industrial Park ................................................................................................. 366 Figure 12.25: Summary of Key Implication ............................................................................................................ 367 Figure 12.26: Number of procedures ....................................................................................................................... 372
Final Report - Krishnapatnam Industrial Node Development Plan PwC/Nippon Koei 7

List of Tables Table 1.1: Overview of the Krishnapatnam Area ........................................................................................................ 15 Table 1.2: Breakdown of Node Area .......................................................................................................................... 30 Table 1.3: Land Acquisition Status of Krishnapatnam Node as of June 2015 ......................................................... 31 Table 1.4: Items to be considered in the Existing Plan (Krishnapatnam) ............................................................... 32 Table 1.5: Estimation of Developable area for Krishnapatnam Industrial Node .................................................... 33 Table 1.6: Population Framework ............................................................................................................................. 33 Table 1.7: Proposed Area by Land Use in Krishnapatnam Node ............................................................................. 33 Table 1.8: Summary of Infrastructure Development Plan ....................................................................................... 34 Table 1.9: Result of Demand Supply Analysis by Access Points ......................................................................... 35 Table 1.10: Implementation Plan with Preliminary Cost Estimate for Internal and External Node Development Plans ................................................................................................................................................... 36 Table 1.11: Krishnapatnam Node – Forecast Rail share of container and break bulk freight volume .................. 37 Table 1.12: Krishnapatnam Railway Access Line and Logistics Hub - Cost Summary ........................................... 38 Table 1.13: Summary of Capital Cost and O&M Cost for Water Sector ................................................................... 39 Table 1.14: Development concept, policy and program for solid waste management in the Node ....................... 40 Table 1.15: Summary of Capital Cost and O&M Cost for Solid waste management Sector .................................... 42 Table 1.16: Substation requirement in the node area ............................................................................................... 43 Table 1.17: Additional Investment requirements (Rs. lakhs) [Inflation adjusted] ................................................. 44 Table 1.18: Direct and Indirect Benefits .................................................................................................................... 45 Table 1.19: Direct potential employment of Krishnapatnam Industrial Node ....................................................... 45 Table 1.20: Industrial Investment in Krishnapatnam Industrial Node .................................................................. 46 Table 1.21: Permanent net employment to be generated in Krishnapatnam Industrial Node .............................. 47 Table 1.22: Projected GVA benefits, Krishnapatnam Industrial Node .................................................................... 47 Table 1.23: Summary of Net Present Costs and Benefits, Krishnapatnam Industrial Node .................................. 47 Table 1.24: Benefits-Cost Ratio for Krishnapatnam Industrial Node Development .............................................. 47 Table 1.25: Financial model options .......................................................................................................................... 48 Table 1.26: Capital cost components ......................................................................................................................... 48 Table 1.27: Phase wise capital cost components ....................................................................................................... 48 Table 1.28: Financing Structure ................................................................................................................................ 49 Table 1.29: Recommendation for Andhra Pradesh .................................................................................................. 54 Table 2.1: Vision for CBIC .......................................................................................................................................... 64 Table 3.1: Overview of the Krishnapatnam Area ...................................................................................................... 66 Table 3.2: Industrial park details, Nellore district .................................................................................................... 77 Table 3.3: SEZ details in Nellore district by Developer ............................................................................................. 77 Table 3.4: Vacant land of SEZ in Nellore district ..................................................................................................... 79 Table 3.5: Breakdown of Node Area ........................................................................................................................... 81 Table 3.6: Land Acquisition Status of Krishnapatnam Node as of June 2015 ........................................................ 85 Table 4.1: SWOT Analysis for Krishnapatnam Node................................................................................................ 87 Table 5.1: Trade competitiveness ranking, 2003 vs 2013, Food processing ........................................................... 97 Table 5.2: Sub-sector wise projected growth rates – Food processing sector ........................................................ 98 Table 5.3: Share of top exporting countries vs India to Japan in food processing sector .................................... 102 Table 5.4: Percentage of food processed in India vis-a-vis in developed countries, 2010 ................................... 104 Table 5.5: Key design implications for food processing sector ............................................................................... 112 Table 5.6: Trade competitiveness ranking, 2003 vs 2013, Metallurgy ................................................................... 116 Table 5.7: Share of top exporting countries vs India to China in metallurgy sector ............................................. 120 Table 5.8: Key design implications for metallurgy sector ....................................................................................... 125 Table 5.9: Trade competitiveness ranking, 2003 vs 2013, Food processing.......................................................... 129 Table 5.10: Share of top exporting countries vs India to China in electrical machinery sector ............................ 133 Table 5.11: Key design implications for electrical machinery sector ...................................................................... 139 Table 6.1: Items to be considered in the existing plan (Krishnapatnam) .............................................................. 145 Table 6.2Existing Infrastructure Projects in Krishnapatnam Node ....................................................................... 146 Final Report - Krishnapatnam Industrial Node Development Plan PwC/Nippon Koei 8

Table 6.3: Land for Infrastructure Development on Krishnapatnam Node .......................................................... 146 Table 6.4: Population Framework ............................................................................................................................ 147 Table 6.5: Proposed Area by Land Use in Krishnapatnam Node ........................................................................... 149 Table 6.6: Specification of Housing Building .......................................................................................................... 151 Table 6.7: Implementation Plan ............................................................................................................................... 152 Table 6.8: Cost Estimate of Land Development (Krishnapatnam Node) .............................................................. 153 Table 6.9: Cost Estimate for Housing Development Plan (Krishnapatnam Node) ........................................ 153 Table 6.10: Cost Estimate for Public Facilities Development Plan (Krishnapatnam Node) ................................. 153 Table 7.1: Distance from Nodes ................................................................................................................................ 154 Table 7.2: Population Demand Forecast in Krishnapatnam Node ......................................................................... 155 Table 7.3: Distribution of Node Employee to Vicinal Sub-Districts ....................................................................... 157 Table 7.4: Grouping of Node Employee by Access Points ....................................................................................... 158 Table 7.5: Number of Node Employee in Peak Hour .............................................................................................. 159 Table 7.6: Traffic Parameters ................................................................................................................................... 160 Table 7.7: Annual Cargo Volume by Access Point ................................................................................................... 161 Table 7.8: Peak Hour Cargo Volume by Access Point ............................................................................................. 161 Table 7.9: Traffic Parameters .................................................................................................................................... 162 Table 7.10: Road Capacity of Main Access Roads .................................................................................................... 163 Table 7.11: Capacity and Cost of Public Transport .................................................................................................. 163 Table 7.12: Result of Demand Supply Analysis by Access Points ........................................................................... 166 Table 7.13: Three Pronged Approach of Smart City Scheme ................................................................................. 168 Table 7.14: Benchmarks for Smart Cities ................................................................................................................ 168 Table 7.15: Example of Target Road Density in Urban Area ................................................................................... 170 Table 7.16: Counter Measures for Road Safety ........................................................................................................ 172 Table 7.17: Elements of Proposed Typical Cross Sections ....................................................................................... 174 Table 7.18: Implementation Plan for Internal Node .............................................................................................. 188 Table 7.19: Implementation Plan for External Node .............................................................................................. 189 Table 7.20: Cost Estimate for Internal and External Node Infrastructures ......................................................... 190 Table 7.21: Operation Cost Estimate for Internal Node Infrastructures ................................................................ 191 Table 7.22: Krishnapatnam Node - Train Composition and Length ...................................................................... 193 Table 7.23: Krishnapatnam Node – Forecast Rail share of container and break bulk freight volume ................ 196 Table 7.24: Krishnapatnam Node - Capital Cost for construction of Access Lines .............................................. 198 Table 7.25: Krishnapatnam Node - Recovery of railway capital, haulage and maintenance charges for Containers ................................................................................................................................................................. 198 Table 7.26: Krishnapatnam Node – Recovery of railway capital, haulage and maintenance charges for Steel . 199 Table 7.27: Krishnapatnam Logistics hub - Throughput ....................................................................................... 201 Table 7.28: Krishnapatnam Logistics Hub - Specifications ................................................................................... 203 Table 7.29: Krishnapatnam Logistics Hub - Capital Cost Estimates ..................................................................... 204 Table 7.30: Krishnapatnam Logistics Hub - Capital Expenditure Profile (2014 constant prices) ...................... 205 Table 7.31: Krishnapatnam Logistics Hub - Estimates of Wage and Salary Costs (2014 values) ........................ 206 Table 7.32: Krishnapatnam Logistics Hub - Estimates of Fixed Asset and Equipment Maintenance Costs (2014 values) ....................................................................................................................................................................... 207 Table 7.33: Krishnapatnam Logistics Hub - Estimated Revenue Flows (2014 values) ........................................ 208 Table 7.34: Krishnapatnam Logistics Hub - Comparison of Revenue with O&M costs ....................................... 209 Table 7.35: Demand and supply gap analysis in the various scenarios ................................................................. 210 Table 7.36: Loss level for the node power network ................................................................................................. 215 Table 7.37: Power demand estimates for various years, PwC analysis ................................................................... 215 Table 7.38: Gap assessment for the node ................................................................................................................. 216 Table 7.39: Scenarios for design gap (MW), PwC analysis ..................................................................................... 216 Table 7.40: Available capacity for the node ............................................................................................................. 217 Table 7.41: Distribution sub-station requirement (Nos.) ....................................................................................... 218 Table 7.42: Transmission sub-station requirement (Nos.) .................................................................................... 218 Table 7.43: Line characteristics (I/O configurations) ............................................................................................. 219 Table 7.44: Standard land requirement for sub-stations ....................................................................................... 223 Table 7.45: Land requirement for sub stations ....................................................................................................... 223 Final Report - Krishnapatnam Industrial Node Development Plan PwC/Nippon Koei 9

Table 7.46: Renewable energy source: Expected capacity addition (MW) ........................................................... 225 Table 7.47: Gap analysis for the node area. ............................................................................................................ 226 Table 7.48: Comparison of operating frameworks ................................................................................................. 229 Table 7.49: Comparison of various DFs .................................................................................................................. 230 Table 7.50: Contribution and benefits to Consumers, Discom and IBF ............................................................... 230 Table 7.51: Elements in the node ............................................................................................................................. 230 Table 7.52: Driving factors and limitations of gas based power plants .................................................................. 231 Table 7.53: Elements and costs for Phase I (current prices) .................................................................................. 232 Table 7.54: Elements and costs for Phase II (current prices) ................................................................................ 233 Table 7.55: Elements and costs for Phase III (current prices) ............................................................................... 234 Table 7.56: Capital cost escalation (in INR lacs) .................................................................................................... 235 Table 7.57: O&M cost and net cash outflow for franchise (in INR lacs) ............................................................... 235 Table 7.58: Applicable Technical Standards for Water Infrastructure Plans ...................................................... 237 Table 7.59: Applicable Water Quality Standards for the Target Facilities ............................................................ 238 Table 7.60: Target Per Capita Water Supply Level ................................................................................................. 239 Table 7.61: Domestic Water Demand of Krishnapatnam Node ............................................................................. 240 Table 7.62: Industrial Water Demand of Krishnapatnam Node ............................................................................ 241 Table 7.63: Sewage Generation of Krishnapatnam Node ....................................................................................... 241 Table 7.64: Industrial Effluent Generation of Krishnapatnam Node ..................................................................... 241 Table 7.65: Percentage of Imperviousness of Areas ............................................................................................... 242 Table 7.66: Summary of the Storm Water Discharge in each zone ....................................................................... 246 Table 7.67: Potential Water Sources for Krishnapatnam Node ............................................................................. 246 Table 7.68: Supply Amount of Water Sources for Krishnapatnam Node by Phase .............................................. 247 Table 7.69: Selected Treatment Processes for Krishnapatnam Node ................................................................... 249 Table 7.70: Outlines of the Potable Water Supply Facilities .................................................................................. 253 Table 7.71: Outlines of the Non-Potable Water Supply Facilities .......................................................................... 256 Table 7.72: Outlines of the Sewerage Facilities....................................................................................................... 258 Table 7.73: Outlines of Industrial Effluent Collection Facilities ............................................................................ 260 Table 7.74: Outlines of the Stormwater Drainage System ..................................................................................... 263 Table 7.75: Sizes of Stormwater Drains ................................................................................................................... 263 Table 7.76: Summary of Construction Cost of Water Infrastructures ................................................................... 264 Table 7.77: Summary of O&M Cost of Water Infrastructures ................................................................................ 265 Table 7.78: Population Forecast of Krishnapatnam Node ..................................................................................... 267 Table 7.79: Proposed land demand of Each Industrial Sector in Krishnapatnam Node ...................................... 268 Table 7.80: Applicable Technical Standards for Development Plan ..................................................................... 268 Table 7.81: Type of the target waste for planning ................................................................................................... 269 Table 7.82: Industrial hazardous waste generated in CIBC area ........................................................................... 269 Table 7.83: Non-hazardous waste generated in the Krishnapatnam Node .......................................................... 269 Table 7.84: Date of waste generation based on generators in Nellore Municipal Corporation ........................... 270 Table 7.85: Details of qualitative analysis of MSW ................................................................................................ 270 Table 7.86: Waste generated per capita per day of other municipalities of Asia ................................................... 271 Table 7.87: Future prediction of Municipal solid waste generation in the Node................................................... 271 Table 7.88: Concept and Policy for solid waste management in the Node ........................................................... 272 Table 7.89: Policy and program for solid waste management in the Node........................................................... 274 Table 7.90: Facilities capacity of each phase .......................................................................................................... 276 Table 7.91: Collection vehicle required ................................................................................................................... 278 Table 7.92: Option of municipal solid waste intermediate technology ................................................................. 278 Table 7.93: Capacity of each facility ........................................................................................................................ 282 Table 7.94: Capacity of each infrastructure facility for each target year ............................................................... 285 Table 7.95: Preliminary cost estimation of infrastructures ................................................................................... 286 Table 8.1: GDP growth ratio .................................................................................................................................... 287 Table 8.2: GVA per capita ........................................................................................................................................ 288 Table 8.3: Construction and manufacturing multipliers ....................................................................................... 288 Table 8.4: Displacement ready reckoner ................................................................................................................ 289 Table 8.5: Direct potential employment of Krishnapatnam Industrial Node ....................................................... 290 Final Report - Krishnapatnam Industrial Node Development Plan PwC/Nippon Koei 10

Table 8.6: Land demand, acres ................................................................................................................................. 291 Table 8.7: Industrial Investment in Krishnapatnam Industrial Node ................................................................... 291 Table 8.8: Temporary employment to be generated in Krishnapatnam Industrial Node ................................... 292 Table 8.9: Total temporary impact in monetary terms, Krishnapatnam Industrial Node .................................. 293 Table 8.10: Permanent net employment to be generated in Krishnapatnam Industrial Node ........................... 293 Table 8.11: Projected GVA benefits, Krishnapatnam Industrial Node .................................................................. 293 Table 8.12: Summary of Net Present Costs and Benefits, Krishnapatnam Industrial Node ............................... 293 Table 8.13: Benefits-Cost Ratio for Krishnapatnam Industrial Node Development ............................................ 293 Table 9.1: Financial model options .......................................................................................................................... 295 Table 9.2: Capital cost .............................................................................................................................................. 296 Table 9.3: Key revenue assumptions ....................................................................................................................... 299 Table 10.1: Land Acquisition Status of Krishnapatnam ......................................................................................... 305 Table 10.2: Project Component (Krishnapatnam) ................................................................................................. 307 Table 10.3: Environmental Scoping and the Reasons ............................................................................................ 308 Table 10.4: Summary of Matters for Consideration ............................................................................................... 309 Table 10.5: Expected EIA Schedule .......................................................................................................................... 312 Table 10.6: Procedures for Land Acquisition ........................................................................................................... 312 Table 11.1: Indicative roles and responsibility framework for list of project related activities for CBIC............. 315 Table 11.2: Suitability matrix for selection of legislative framework for CBIC in Andhra Pradesh ..................... 327 Table 11.3: Model comparison ................................................................................................................................. 329 Table 12.1: Port Summary ........................................................................................................................................ 350 Table 12.2: Land Acquisition Policy ......................................................................................................................... 351 Table 12.3: Initiatives for Skill Development .......................................................................................................... 353 Table 12.4: The number of Higher Educational Instituted and Vocational Training Infrastructure .................. 353 Table 12.5: Policy for Research & Development ..................................................................................................... 354 Table 12.6: Single Window Mechanism .................................................................................................................. 355 Table 12.7: Policy for Green Practices ..................................................................................................................... 357 Table 12.8: Power Generation and Distribution ..................................................................................................... 358 Table 12.9: Port Authority ........................................................................................................................................ 360 Table 12.10: Authority to develop roads ................................................................................................................... 361 Table 12.11: Land Acquisition Policy ....................................................................................................................... 362 Table 12.12: Skill Development Policy ..................................................................................................................... 364 Table 12.13: Skill Development Infrastructure ....................................................................................................... 364 Table 12.14: Single Window Mechanism ................................................................................................................. 365 Table 12.15: Institutes for development of Industrial Park .................................................................................... 366 Table 12.16: Maintenance Policy for Industrial Park ............................................................................................. 367 Table 12.17: Recommendation for Andhra Pradesh ............................................................................................... 370 Table 12.18: Period of Procedures in CBIC Region ............................................................................................. 373 Table 12.19: Key Bottlenecks in Administrative Issue in CBIC Region .......................................................... 373 Table 12.20: Current and Recommended Tax Rates for CBIC ........................................................................ 374
Final Report - Krishnapatnam Industrial Node Development Plan PwC/Nippon Koei 11

1 Executive Summary
Corridor Development for Industrial Growth National Manufacturing Policy (NMP) of India envisages manufacturing sector as key economic driver for realizing fast-tracked GDP growth and creation of incremental employment opportunities. In the past 10 years, Indian manufacturing has grown at a robust average rate of 7.3%, putting itself on the map of some of the best performing manufacturing economies. However it is still only 15% of Indian’s overall GDP and hence assumes vast growth potential. The government has set a vision to grow India’s manufacturing sector to contribute 25% to the nation’s GDP from current 15% by the year 2022. To meet the ambitious vision of the NMP and provide further boost to industrial growth, there is a need to raise global competitiveness of the Indian manufacturing sector.
That India has large infrastructure gap, which impacts competitiveness of manufacturing in India, is well understood. Equally, the financing and institutional capacity constraints imply that rapid build-up across all areas is unrealistic. In this context, the Industrial Corridors can help prioritize industrial and infrastructure projects in a defined regional boundary to leverage agglomeration benefits. Thus, the foundation for developing successful models of development needs to be created.
Figure 1.1: Vision and Objective of National Manufacturing Policy
The CBIC is poised to play a pivotal role in the economic development of the region and be the engine for manufacturing growth in the country.
Chennai-Bengaluru Industrial Corridor (CBIC) comprises of “sets of projects” – including industrial parks at delineated nodes, access to sufficient utilities (power, water, etc), and connectivity through road and rail, to markets, ports and airports. Such prioritized infrastructure investment in the region can yield higher economic activity in short run, as opposed to prioritizing similar projects with each line ministry independently. The plan to develop CBIC is aligned to this strategy to achieve accelerated industrial agglomeration and regional development.
The corridor is planned to cover 16 districts spread across the states of Tamil Nadu, Karnataka and Andhra Pradesh. Industrial and economic clusters of Bengaluru and Chennai are developing rapidly. There is significant interest in the region from international investors including increasing number of private Japanese companies.
CBIC Development Plan envisages enhanced regional competitiveness to attract substantial international and national capital investment.
Increase manufacturing sector growth to 12-14% over the medium term
Create 100 million additional jobs by 2022Create appropriate skill sets among rural migrant and urban poorIncrease domestic value addition and technological depthEnhance global competitiveness through policy support
Ensure sustainability of growth
DIPP’s Vision -National
Manufacturing Policy
Objectives of the Policy
Increase share of manufacturing in GDP from 16% to 25% by 2022
Final Report - Krishnapatnam Industrial Node Development Plan PwC/Nippon Koei 12

The corridor development plan envisages developing the region as the world class hub for attracting domestic and foreign investment in industries by providing world class infrastructure, required connectivity to the eastern ports, associated soft infrastructure and policy support to allow for rapid inclusive industrial growth with sustained employment creation.
Vision for Chennai Bengaluru Industrial Corridor (CBIC) for 2033:
Global Manufacturing Center “Be known as a global leading manufacturing
center towing world economic growth and generating national employment opportunities.”
Top Investment Destination “Be one of the top three preferred investment
destinations in Asia and the most preferred in India with high efficiency and competitiveness.”
Leading Innovation Hub “Be known as the leading innovation hub and
knowledge capital of India through presenting innovative progress in industrial sector.”
Model of Inclusive Growth “Exhibit a model of inclusive growth pattern and ensure high level of environmental standards.”
The success of the corridor development vision will hinge on translating hard and soft infrastructure proposals into reality. Based on the request from GOI to formulate “Infrastructure Development Program for Chennai-Bengaluru Industrial Corridor” (the Program), GOI and JICA agreed to develop “Comprehensive Regional Perspective Plan for Chennai-Bengaluru Industrial Corridor Region,” (the Perspective Plan) in May 2013.
Selection of Industrial Nodes in CBIC
JICA study team, in consultation with respective state governments, had proposed eight potential destinations as Industrial Nodes to be included in the CBIC. These were based on broad views on land availability and suitability of potential zones; the following locations have been suggested as the proposed destinations for industrial nodes based on a set of eight assessment criteria that includes the following:
1. Accessibility to regional trunk roads 2. Existence of protected/restricted areas 3. Government land availability and availability of proposed industrial development areas 4. Water availability 5. Assessment of urban planning strategy 6. Existing and planned industrial areas 7. Accessibility to major transport facilities (port and airport) 8. Accessibility to electricity network
Final Report - Krishnapatnam Industrial Node Development Plan PwC/Nippon Koei 13

Figure 1.2: Nodes selected for CBIC
a. Development of Industrial Node at Krishnapatnam
Selection of Krishnapatnam Node The JICA Perspective Plan for CBIC identified Krishnapatnam SEZ area as a prospective industrial node for CBIC along with seven other nodes in Tamil Nadu, Karnataka and Andhra Pradesh – including Hindupur and Kalikiri in Andhra Pradesh. This planned area is located in south of Krishnapatnam port as industrial development of about 12,000 acres, and KPCL (Krishnapatnam Port Company Ltd.) had earlier planned the layout plan for this area. Additionally, KPCL has plans to develop plant facilities (power plant, water treatment plant and waste water plant) near this area, and it is expected to provide stable operational environment for the factories in the future. A trunk road network (access road from NH-5) and railway connectivity have already been developed by KPCL. As the proposed node is near the port, it will also enjoy significant benefit from the port for industrial purposes.
Locational Advantages
KPT IN offers location advantage predominantly due to its proximity to rapidly expanding Krishnapatnam port
Krishnapatnam Industrial Node is Greenfield development where Krishnapatnam Infra-tech Private Limited (KPIL) had earlier planned development of Krishnapatnam SEZ. The access from NH-5 is currently a 4-lane road; however Krishnapatnam Port Company Ltd (KPCL) is planning to widen this to 6-lanes to satisfy future road demand.
Additionally, Naidupeta SEZ and Sri City are also located along NH-5. These areas, along with the proposed node and the cluster of developments around the urban core of Nellore city are expected to contribute to the further development of the south of Nellore District.
1
2
3
Final Report - Krishnapatnam Industrial Node Development Plan PwC/Nippon Koei 14

Table 1.1: Overview of the Krishnapatnam Area
Particular Description
District/ State • Nellore district/ Andhra Pradesh state
Distance from Metropolitan/major city
• 170 km from Chennai city centre along NH-5 and the access road to Krishnapatnam port
• 40 km from Nellore city
Accessibility to trunk road network
• 20 km from NH-5, however no direct access from the national highway (only via Krishnapatnam Port)
Accessibility to railway network • Railway access connects Krishnapatnam port to the
mainline; however no railway access to the node area so far
Accessibility to major transport facilities (port, airport)
• 10 km from Krishnapatnam port • 90 km from Tirupati airport
Major industrial locations in the surrounding area
• 80 km from the proposed SEZ at Naidupeta on NH-5 • 130 km from Sri City on NH-5
Source: JICA Study Team
Figure 1.3: Industrial hubs in proximity to the Krishnapatnam Industrial Node
Source: MSME profiles of districts, CAPEX database, PwC analysis
IP1IP2IP3IP2221IP1
50 km
NH5
IP3
Krishnapatnam
port
Krishnapatnam
Industrial Node
IP4
IP6
IP5
IP3IP2
IP1
IP1
Final Report - Krishnapatnam Industrial Node Development Plan PwC/Nippon Koei 15

Opportunity exists for transition of Krishnapatnam IN from low urbanization, primary sector and low value added non-engineering manufacturing to a hub of resource driven industries supporting exports and imports activities in the area.
Analysis of social profile of Nellore district reveals that it is lower than state and national average on urbanization levels. Majority of population in Nellore district is engaged in agricultural sector.
Nellore’s economic analysis reveals that tertiary (53%) and primary (27%) sectors lead the economy of the district. Secondary sector contributes 20% to the district’s GDP. However, it is driven by construction sector and manufacturing sector has small role to play with only 6% contribution to GDDP by 2010-11. Among major economic segments its growth rate was also one of the lowest, which influenced performance of Nellore district compared to growth of AP state and India as a whole.
Figure 1.4: Major components of GDDP of Nellore district
Source: District domestic product - AP 2004-05 to 2010-11, Directorate of Economics and Statistics, GoAP, PwC analysis
Majority of employees are engaged in low value adding non-engineering sectors: 82% of employment in registered sector in Nellore district is concentrated in 3 sectors: leather (35%), food processing (31%), basic metals (16%). These sectors are characterized by low value addition in their final output. Number of employees engaged in in engineering sectors is very low.
However, analysis of the investments trends over the past decade suggests that Nellore district has accelerated infrastructure development to set the ground for manufacturing investments growth. Share of cumulative investments in Nellore district has grown from 10% in 2003-08 to 16% in 2009-15 in total investments in Nellore and districts in proximity.1
Infrastructure sectors have lion’s share in total Nellore investments over the past 12 years – 75%.
Nellore district is coming up as the next manufacturing destination after neighboring locations get saturated.
Source: CAPEX database
1 AP – Prakasam, Chittoor, Nellore, Y.S.R., Tamil Nadu – Chennai, Kancheepuram, Thiruvallur, Vellore
47%
34%
12%7%
0.1%
52%
28%
13%6%
1%
9%4%
10%5%
36%
0%5%10%15%20%25%30%35%40%
0%10%20%30%40%50%60%
Services Agriculture and allied Electricity, Gas,Watersupply and
Construction
Manufacturing Mining
Breakup of GDDP of Nellore district
2004-05 2010-11 CAGR
Figure 1.5: Investment composition, Nellore district, %
Final Report - Krishnapatnam Industrial Node Development Plan PwC/Nippon Koei 16
Power infra60%
Road infra10%
Port infra5%
Manufacturing23%
Services2%
Logistics infra
0.04%
Investments composition, Nellore district, %

Many industrial parks exist in the district but saturated; existing industrial parks around the proposed node will offer supply chain advantages for certain industries
Total area of industrial parks in Nellore district is to the tune of ~ 15,000 acres, out of which only 15% is vacant. Proposed node is in close proximity to the existing industrial cluster naturally formed around Krishnapatnam port. In 50 km radius from the node there are several industrial clusters that have naturally formed the corridor along national highway NH5. Area around the port also hosts number of operational and upcoming power projects.
Major areas of industries concentration in 50 km radius from proposed node are Nellore, Gudur, Naidupeta and Sulurpeta. Food processing, metallurgy, chemicals, pharma and leather industries are located around Nellore city; Gudur predominantly hosts food processing and metallurgy units; Naidupeta is prominent industrial area with food processing, textiles, electrical machinery and some glassware units. Sulurpeta is another large industrial cluster which hosts textile, metallurgy, electrical machinery, chemicals, leather and non-mineral based industries. Area around Krishnapatnam port has several food processing units (edible oil refineries), metallurgy and leather units.
Vision for Krishnapatnam Industrial Node as an Industrial Hub for Resource-driven Industries In the Master Plan’s context, the Competitiveness of Node means comparative advantages, which enable it to attract high quality human and capital resources, investments, technologies and knowledge base. To build and strengthen the competitiveness of the Node, key factors providing a comparative advantage against similar investment destinations both in India and globally were identified.
Based on SWOT analysis above, inputs from state government and key requirements for industrial and urban growth, it is envisaged that the Krishnapatnam Industrial Node should have the following characteristics to build Node Competitiveness:
•Technological Advancement, Cost Competitiveness, Ease of doing business, Enhanced Connectivity, Logistics Services, Skilled Manpower
Industry Competitiveness
•Assurance on utility services (24 x 7), Mobility and Connectivity, Efficiency, Effectiveness and Sustainability of all infrastructure services
Infrastructure Quality
•Environmental Sustainability, Economic Sustainability, Waste management, Water Management and Recycling, Renewable Energy, Skill Development, Organic Growth
Sustainability
•Responsive Governance, Civic Services, Affordable, Public Facilities, Parks & Recreation facilities, Leisure and Retail facilities
Quality of Life
Final Report - Krishnapatnam Industrial Node Development Plan PwC/Nippon Koei 17

Planned Growth Strategy
The industrial development at Krishnapatnam is proposed to become the seed for organic growth of the node into a fully functional industrial township with all the necessary ingredients for fueling further economic development of the township through urban agglomeration. The Master Plan envisages the development, i.e., competitiveness enhancement, of the node occurs through the following organic development phases:
• First phase, as Inception stage, where the node development is focused on ensuring availability of core infrastructure to meet essential industrial needs, such as 24x7 utilities services (water, power, waste management, effluent treatment); mobility, connectivity and skilled workforce. In addition, the foundation is laid for future organic development of the node in terms of infrastructure, economic competitiveness, quality of life and environment sustainability.
In addition, the nodes will also start accommodating a proportion of workers within the nodes as Resident Workers. In this stage, the Node is trying to provide the basic infrastructure so as to be able to attract investors to take industrial land parcels and create a seed development. The land allocation in this stage should ideally be closely placed so that the core infrastructure is efficiently utilized. However, large anchor tenants should also be given preference to choose appropriate locations within the node which best suit their requirements. The node development strategy at this stage is to become attractive industrial hub for attracting core tenants and provide effective infrastructure to make the node viable to live, work and do business.
• Second phase, i.e. the Growth Stage, after accumulation of set of core tenants, the node infrastructure should be enhanced by building soft infra such as healthcare, primary and secondary education, enhanced transport connectivity within a city and to surrounding areas. In addition, the
Industry Competitiveness
Cost Competitiveness, Ease of doing Business, Enhanced connectivity,
Logistics services, Skilled Manpower
Quality of Life Responsive
Governance, Civic Services,
Affordable Housing Public Facilities,
Parks & Recreation, Leisure and Retail
facilities
Infrastructure Quality Assurance on 24 x 7 utility services,
Mobility Planning Efficiency, Effectiveness and Sustainability
Sustainability Economic and Environmental Sustainability,
Waste management, Recycled water, Renewable energy, Skill Development, Organic
Growth
Qu
ality
of i
Infrastructure Quality
Industry Competitivenes
Sustainability
Final Report - Krishnapatnam Industrial Node Development Plan PwC/Nippon Koei 18

node should also build other technical institutions which are required to meet other functional needs of the tenant firms. At this stage, the node development strategy is to become a fully functional industrial township with resident workers and other commercial activities within the township to support sustainable living
• Third phase, i.e. the Advanced Stage, the infrastructure development is geared more toward improving economic growth and productivity enhancement to gain competitiveness and economic efficiency. This may include mass transit, commercial property development, introduction of knowledge based service industries, global connectivity, advanced university education and research, and enhanced natural-disaster risk management etc. At this stage, the node development becomes more proactive as a town which is able to drive economic activity in and around the node boundary through organic growth i.e., setting the pace, ahead of the demand curve, and becoming more attractive place in which to live, work and do business.
• Future Organic Growth of the town through urban agglomeration or city development will focus on more advanced human needs to improve all aspects of quality of life and sustainability, including elderly care, green space, leisure and cultural assess, and environmental infrastructure.
The proposed masterplan envisages the above growth through a planned and controlled development in of the node in initial phases. However it is envisaged that as the node matures into a functional industrial township, it will further fuel economic activity in and around the node to allow for more organic growth of the node into vibrant agglomeration of industrial and economic activities.
Source: PwC India
Private Sector Participation in Node Development
According to the analysis on industrial parks in CBIC, involvement of private sector is an essential factor for the success of creating high quality industrial park. For instance, the majority of the foreign investors admit that quality of recently developed private industrial parks is higher than the existing ones. The know-how of privates sectors on development of land, construction of facilities, and provision of operation support services should be utilized as much as possible in order to develop high quality industrial park.
The Krishnapatnam Industrial Node aims at a level of quality exceeding the above mentioned advanced industrial parks. The advantage of the Krishnapatnam Industrial Node is the hard and soft infrastructure which is supposed to be provided by the Government based on the CBIC Master Plan. Apart from that, the private participation in Krishnapatnam Industrial node will be expected not to bring equity (in the form of land) alone, but enhance the node attractiveness by involving its managerial expertise and capabilities to run the node after
Inception Stage Growth Stage Advanced Stage Organic Growth,
Urban Agglomeration
Provide core infrastructure, utility services, mobility and connectivity to attract seed investments into the node
Aim at making the node an attractive investment and residential destination by focusing on hard and soft infrastructure, commercial and retail activities
Matured Industrial Township which is a quality place to live and work by driving further economic efficiency
Final Report - Krishnapatnam Industrial Node Development Plan PwC/Nippon Koei 19
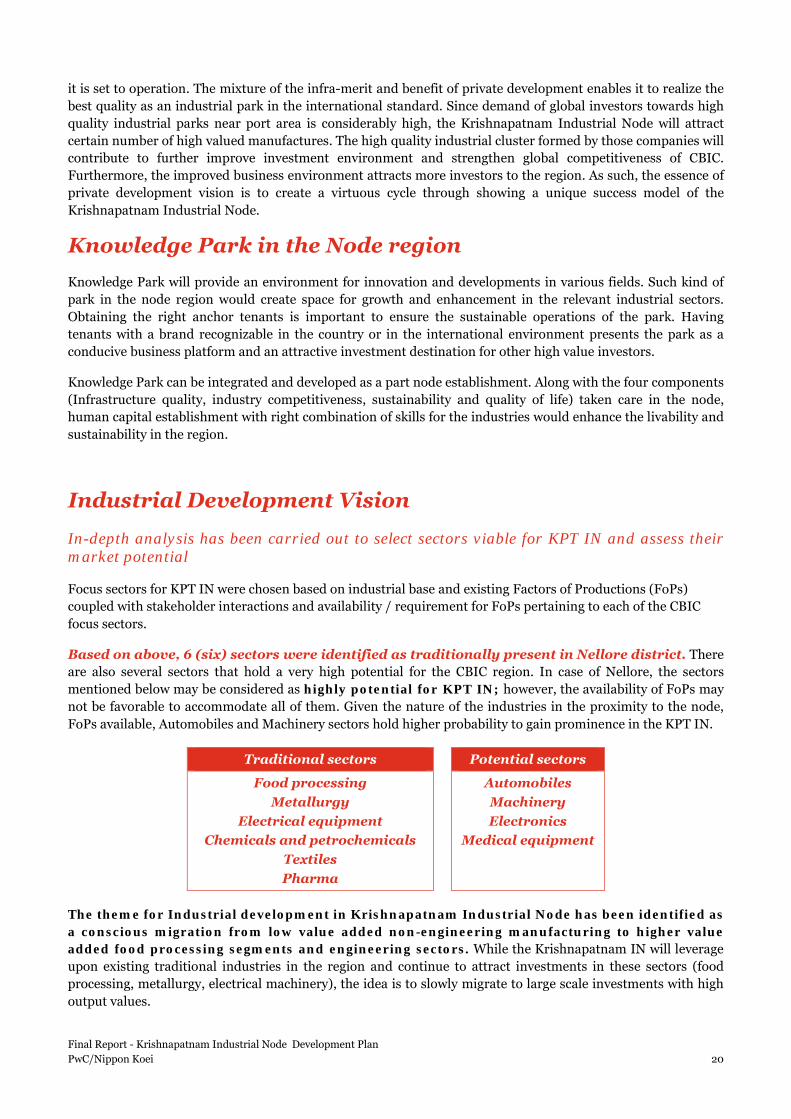
it is set to operation. The mixture of the infra-merit and benefit of private development enables it to realize the best quality as an industrial park in the international standard. Since demand of global investors towards high quality industrial parks near port area is considerably high, the Krishnapatnam Industrial Node will attract certain number of high valued manufactures. The high quality industrial cluster formed by those companies will contribute to further improve investment environment and strengthen global competitiveness of CBIC. Furthermore, the improved business environment attracts more investors to the region. As such, the essence of private development vision is to create a virtuous cycle through showing a unique success model of the Krishnapatnam Industrial Node.
Knowledge Park in the Node region Knowledge Park will provide an environment for innovation and developments in various fields. Such kind of park in the node region would create space for growth and enhancement in the relevant industrial sectors. Obtaining the right anchor tenants is important to ensure the sustainable operations of the park. Having tenants with a brand recognizable in the country or in the international environment presents the park as a conducive business platform and an attractive investment destination for other high value investors.
Knowledge Park can be integrated and developed as a part node establishment. Along with the four components (Infrastructure quality, industry competitiveness, sustainability and quality of life) taken care in the node, human capital establishment with right combination of skills for the industries would enhance the livability and sustainability in the region.
Industrial Development Vision
In-depth analysis has been carried out to select sectors viable for KPT IN and assess their market potential
Focus sectors for KPT IN were chosen based on industrial base and existing Factors of Productions (FoPs) coupled with stakeholder interactions and availability / requirement for FoPs pertaining to each of the CBIC focus sectors.
Based on above, 6 (six) sectors were identified as traditionally present in Nellore district. There are also several sectors that hold a very high potential for the CBIC region. In case of Nellore, the sectors mentioned below may be considered as highly potential for KPT IN; however, the availability of FoPs may not be favorable to accommodate all of them. Given the nature of the industries in the proximity to the node, FoPs available, Automobiles and Machinery sectors hold higher probability to gain prominence in the KPT IN.
Traditional sectors Potential sectors
Food processing Metallurgy
Electrical equipment Chemicals and petrochemicals
Textiles Pharma
Automobiles Machinery Electronics
Medical equipment
The theme for Industrial development in Krishnapatnam Industrial Node has been identified as a conscious migration from low value added non-engineering manufacturing to higher value added food processing segments and engineering sectors. While the Krishnapatnam IN will leverage upon existing traditional industries in the region and continue to attract investments in these sectors (food processing, metallurgy, electrical machinery), the idea is to slowly migrate to large scale investments with high output values.
Final Report - Krishnapatnam Industrial Node Development Plan PwC/Nippon Koei 20
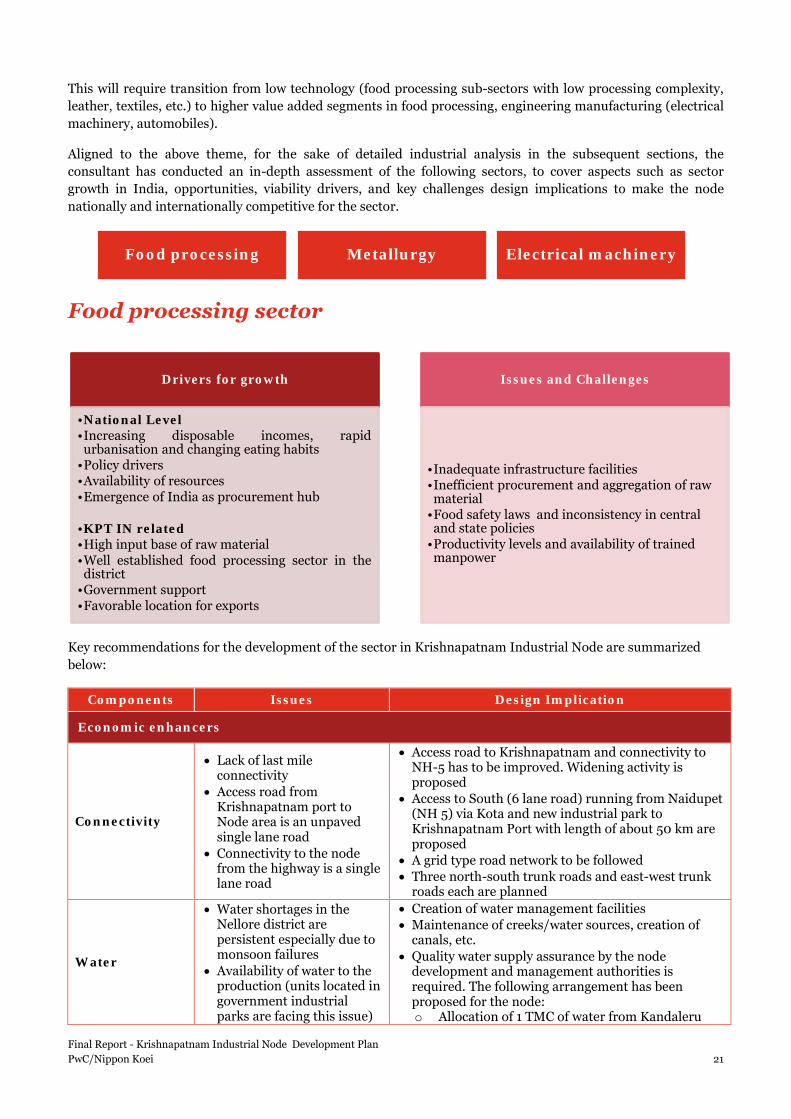
This will require transition from low technology (food processing sub-sectors with low processing complexity, leather, textiles, etc.) to higher value added segments in food processing, engineering manufacturing (electrical machinery, automobiles).
Aligned to the above theme, for the sake of detailed industrial analysis in the subsequent sections, the consultant has conducted an in-depth assessment of the following sectors, to cover aspects such as sector growth in India, opportunities, viability drivers, and key challenges design implications to make the node nationally and internationally competitive for the sector.
Food processing sector
Key recommendations for the development of the sector in Krishnapatnam Industrial Node are summarized below:
Components Issues Design Implication
Economic enhancers
Connectivity
• Lack of last mile connectivity
• Access road from Krishnapatnam port to Node area is an unpaved single lane road
• Connectivity to the node from the highway is a single lane road
• Access road to Krishnapatnam and connectivity to NH-5 has to be improved. Widening activity is proposed
• Access to South (6 lane road) running from Naidupet (NH 5) via Kota and new industrial park to Krishnapatnam Port with length of about 50 km are proposed
• A grid type road network to be followed • Three north-south trunk roads and east-west trunk
roads each are planned
Water
• Water shortages in the Nellore district are persistent especially due to monsoon failures
• Availability of water to the production (units located in government industrial parks are facing this issue)
• Creation of water management facilities • Maintenance of creeks/water sources, creation of
canals, etc. • Quality water supply assurance by the node
development and management authorities is required. The following arrangement has been proposed for the node: o Allocation of 1 TMC of water from Kandaleru
Food processing Metallurgy Electrical machinery
Drivers for growth
•National Level•Increasing disposable incomes, rapidurbanisation and changing eating habits
•Policy drivers•Availability of resources•Emergence of India as procurement hub
•KPT IN related•High input base of raw material•Well established food processing sector in thedistrict
•Government support•Favorable location for exports
Issues and Challenges
•Inadequate infrastructure facilities•Inefficient procurement and aggregation of raw material
•Food safety laws and inconsistency in central and state policies
•Productivity levels and availability of trained manpower
Final Report - Krishnapatnam Industrial Node Development Plan PwC/Nippon Koei 21

Components Issues Design Implication • Salinity of ground water
due to proximity to the seaside
• Marine food specific: − High tide affects water
quality & salinity severely affects the growth of shrimps
− Ineffective maintenance of canals doesn’t allow water from the sea to come inside and mix with fresh river waters
Reservoir for immediate industrial needs by GoAP
o Proposed to supply 0.5 TMC out of this 1 TMC water to the Krishnapatnam node through the newly-developed distinct pipeline. If this proposal is approved, 39 MLD (0.5 TMC/year) by Krishnapatnam Water Supply Company (KPWSC)
• Treated sewage from the STPs can be a reliable potential water resource for industrial water in Krishnapatnam Node
• A desalination plant has been identified by the food processing units as one of the utmost requirements for the area.
• Drainage system may require a pumping system because the node area is wide flat land
Environment
• Development of port, other industries disrupts production
• Lack of drainage for common water for the industries
• Careful planning of new industries is required as the segment is highly sensitive to water contamination
• Introduction of green principles in manufacturing is to be promoted
• Common effluent treatment plant can be developed by the government for similar industries within the district
Power
• For certain segments of food processing sector power cost is around 10-20% variable cost
• Stakeholders are of the opinion that power tariffs are high in the region
• In medium term, power tariff subsidies for food processing industries in the corridor (for example, for the first 10 years of operation) can be considered.
• After bifurcation of Andhra Pradesh into Andhra and Telangana, AP is a power surplus state. Stakeholders of Nellore district noted improvement of power supply scenario compared to the situation 1-1.5 years back. Further, regular vigilance on demand and supply of power on par with the growth in industries is required.
Logistics facilities
• Existing units experience issues with availability of trucks and tankers in vicinity
• Introduction of logistics hub in the node
Storage facilities
• Manufacturing capacities of processing units have increased, but storage facilities are inadequate
• Government can develop cold storage facilities in close vicinity of the markets and end consumers
• To encourage investment in cold chain infrastructure, government may consider providing incentive 5 years for construction of modern automated warehouses and cold chains.
Value enhancers
R&D facilities
• International practice suggests availability of R&D facilities for new product development within industrial park
• Marine related: The initial component of the value chain is imported; R&D facilities for breeding SFP breeders are not available
• R&D laboratories can be proposed to serve the product development requirement of this industrial node as well as other food processing units within CBIC/country
• Marine food related: Though almost the entire value chain is present in the country, it would be beneficial to develop indigenous capabilities for breeding SPF species
Manufacturing/ Processing Skills
• At present only unskilled labour is utilized in the processing units given the nature of job and lack of processing capacities of raw
• Processing can improve the value of the end product and fetch better prices for the food articles in the international market
• Investment in training and skilled labour will help achieving the above
Final Report - Krishnapatnam Industrial Node Development Plan PwC/Nippon Koei 22

Components Issues Design Implication food products
• Processing of the raw food articles can help improve the overall value of the product but this will require skilled labour
• Training centre can be proposed to be setup for training existing employees
Value addition activity
• Since majority of industry consists of small units, it is difficult to access advanced technology and machinery. Lack of technology adaption causes low labour productivity and low value additions.
• Government of Andhra Pradesh may consider additional financial scheme to encourage procurement of upgraded machinery
• Development of research center/center of excellence for value addition in food processing sector can be proposed in KPT IN. The center can explore tie ups with various organizations and research institutions abroad to emerge as a hub for new product development. It will help catering to the requirement of new products development higher on value addition
• New Product Development Center Development of research center for value addition in food processing sector can be proposed in KPT IN. The center can explore tie ups with various organizations and research institutions abroad to emerge as a hub for new product development. It will help catering to the requirement of new products development higher on value addition
Administrative enhancers
Ease of doing business
• 65 departments (pollution related, food safety related, labour related) are to be approached for clearances by an industrial unit. Labor issues are also being dealt by different departments
• Simplification of licensing system and reduction of the number of licenses is necessary.
• Duplicating licenses is to be removed. Single window system is to be promoted.
• In the opinion of existing units in the area, Factories department may act as a single point of contact and take care of all industries required by any industrial unit.
Policy and regulatory framework
• Existing policies to facilitate food processing sector in Andhra Pradesh have expired this year
• Power related: no adequate mechanisms for the companies buying power from open access
• Provide policy extension/introduce new policies/schemes for the sector
• In case of power holiday for entire day, companies that should be given incentives to trade power for the whole day and get compensated. mechanisms for companies which buy power from open access should be established
Quality Control
• The lack of adherence to international food standards and quality norms restricts imports of processed food
• The existing Indian standards are outdated and not harmonized with international standards.
• Lack of in-house quality control and testing facilities in conformity with the international standards.
• GoAP should promote awareness on quality standards needs to be created through seminars, newsletters and training programmes
• Food Processing units should be encouraged to implement Standards such as ISO, HACCP etc
Final Report - Krishnapatnam Industrial Node Development Plan PwC/Nippon Koei 23

Metallurgy sector
Key recommendations for the development of the sector in Krishnapatnam Industrial Node are summarized below:
Components Issues Design Implication
Economic enhancers
Power • Stakeholders are of the
opinion that power tariffs are high in the region
• In medium term, power tariff subsidies for metallurgy industries in the corridor (for example, for the first 10 years of operation) can be considered.
• After bifurcation of Andhra Pradesh into Andhra and Telangana, AP is a power surplus state. Stakeholders of Nellore district noted improvement of power supply scenario compared to the situation 1-1.5 years back. Further, regular vigilance on demand and supply of power on par with the growth in industries.
Drivers for growth
•National Level•Increased consumption intensity•Increase in demand for exports (demand forfinished products is growing faster than anyother segment along the value chain)
•KPT IN related•High input base of raw material•Well established Metallurgy sector in the district•Proximity to port – favorable location forexports
Issues and Challenges
•Poor supply•COnnectivity•High cost of capital•Low level of value addition
Final Report - Krishnapatnam Industrial Node Development Plan PwC/Nippon Koei 24

Components Issues Design Implication
Connectivity
Road
• Connectivity to domestic bauxite and alumina sources to be enhanced
• Access road from Krishnapatnam port to Node area is an unpaved 1-lane road. It is limited to local residents and few heavy vehicles
• Access to South (6 lane road) running from Naidupet (NH 5) via Kota and new industrial park to Krishnapatnam Port with length of about 50 km are proposed
• A grid type road network will be followed
• Three north-south trunk roads and east-west trunk roads each are planned
• Access road to Krishnapatnam and connectivity to NH-5 has to be improved
• Further allocation of Bauxite mines to companies setting up alumina and aluminum industries in Nellore region
Railway
• There is no rail connectivity to the node at present
• Nearest rail head is Venkatachalam located 25 (approx.) km away from the node
• Rail access to the Node area is proposed i.e., o 13.7 km spur line from the port
access line, with the expectation to have considerable spare capacity
o 55.7 km link from the port access line that would pass through the node (and the logistics hub itself) continue further south to connect Chennai – Nellore main line at Naidupeta
Value enhancers
Development of new sub-sectors of metallurgy in the node
• Large food-processing and textile industries in the corridor may give rise to packaging requirements in aluminium in Nellore district and KPT IN in particular.
• Further allocation of Bauxite mines to companies setting up alumina and aluminum industries in Nellore region
• In aluminum subsector, Nellore district is closest to bauxite sources. KPT IN also will have access to Krishnapatnam port. Further leases to Bauxite mining may be allocated to only those companies who intend to set up alumina and primary aluminum production units in the corridor.
Palletization
• There are limited reserves of high-grade Iron-ore lumps in the region. However, iron-ore fines are available and are currently exported in high quantities due to non-availability of pellet units to treat and use fines.
• Palletization can help to an extent in better usage of iron-ores fines and can also help ramp up export revenue by moving up the value chain.
Final Report - Krishnapatnam Industrial Node Development Plan PwC/Nippon Koei 25

Components Issues Design Implication
Technology linkages, research and development initiatives
• Outdated technology, lack of research and development activities in the sector
• State and central government should focus on initiatives to establish technological linkages internationally with countries like Japan and investing in R&D can help in procuring cost effective technologies for modernizing – A world class research center
• Government led initiatives inform of Knowledge Transfer Partnership, where students get more industry exposure, can play a key role in creating the right institute-industry linkages
Center of excellence Creation of the center can be proposed in KPT node to enable the technology linkages, create industry-academia connect in the metallurgy sector, attract leading international research institutions to open research labs in the node. The center can cater to the requirement of the entire CBIC region and beyond and facilitate technology upgradation in metallurgy sector.
Apart from the above, the center can also include:
• One of the major issues of the sector is low productivity. One of the wings of the center can become a training facility for retraining and redevelopment of the labor force
• Quality testing laboratory can become another element of the partnership center to work upon improvement of inferior quality of goods persistent in the sector at the moment.
Administrative enhancers
Policy
• Policy level support is lacking to the metallurgy sector in India and Andhra Pradesh in particular
• The sector is guided by the national level policies, where the draft National Steel Policy 2012 is yet to come out in concrete form
• Andhra Pradesh does not have any specific policy dedicated to the metallurgy sector
• A dedicated committee may be appointed comprising members from all stakeholder agencies
• Government of AP should propose a dedicated policy for the sector, which may increase the attractiveness of the sector along in the state as well as in the CBIC districts – Nellore, in particular
Final Report - Krishnapatnam Industrial Node Development Plan PwC/Nippon Koei 26

Electrical machinery sector
Key recommendations for the development of the sector in Krishnapatnam Industrial Node are summarized below:
Components Issues Design Implication Economic enhancers
Connectivity
Rail
• Nearest rail head is Venkatachalam located 25 (approx.) km away from the node
• There is no rail connectivity to the node at present
• Rail connectivity is necessary to transport over dimensional consignments (ODC) and avoid problems in transporting heavy and ODC >98 MT on NHAI bridges.
• Availability of rail sidings as a last mile connectivity to the main rail network is also essential
• Creation of rail network connectivity as necessary requirement to transport ODC cargoes
• Rail access to the Node area is proposed i.e., − 13.7 km spur line from the port
access line, with the expectation to have considerable spare capacity
− 55.7 km link from the port access line that would pass through the node (and the logistics hub itself) continue further south to connect Chennai – Nellore main line at Naidupeta
Road
• Availability of port infrastructure is essential FoP for the electrical machinery units
• The segments dependent on electrical steel require proximity to ports as their raw material is imported
• Ensure seamless connectivity to port
• Access to South (6 lane road) running from Naidupet (NH 5) via Kota and new industrial park to Krishnapatnam Port with length of about 50 km are proposed
• Access road to Krishnapatnam and connectivity to NH-5 has to be improved
• It is also important to promote the vision of the GoI to boost country’s share in electrical machinery exports
Drivers for growth
•National Level•Growing power sector•Accelerated infrastructure expansion and growing urbanization
•Growing telecom Industry•Farm mechanization•Increasing FDI•Nuclear capacity addition
•KPT IN related•Availability of MSME base (Engineering)•Locational advantage – proximity to port
Issues and Challenges
•Import oriented trade•Availability of raw materials•Infrastructural constraints (transporation of ODCs over NHAI bridges)
•Uninterrupted power supply•Availability of indigenous testing facilities
Final Report - Krishnapatnam Industrial Node Development Plan PwC/Nippon Koei 27

Components Issues Design Implication
Power supply • Electricity rates are a point of concern of various stakeholders
• In medium term, power tariff subsidies for engineering industries in the corridor (for example, for the first 10 years of operation) can be considered.
• After bifurcation of Andhra Pradesh into Andhra and Telangana, AP is a power surplus state. Stakeholders of Nellore district noted improvement of power supply scenario compared to the situation 1-1.5 years back. Further, regular vigilance on demand and supply of power on par with the growth in industries.
Value enhancers
Availability of indigenous testing facilities
• Inadequate electrical equipment testing facilities in the country
• Local players do not have enough capital to set up testing facilities as the investment required is huge.
• Facilitate setting up of indigenous testing and calibrating facility for equipment testing in the node, which can become a testing facility center for the state as well as neighboring states
Availability of Critical Raw Materials
• Constrained availability of certain critical raw materials such as Cold Rolled Grain Oriented (CRGO)/ Cold Rolled Non-Grain Oriented (CRNGO) Steel, Amorphous Steel etc. and volatility
• In the long run government should promote and ensure setting up units manufacturing CRGO and CRNGO electrical steel in the country to remove dependency on raw material imports
Technology linkages, research and development initiatives
• Outdated technology, lack of research and development activities in the sector
• State and central government should focus on initiatives to establish technological linkages internationally with countries like Japan and investing in R&D can help in procuring cost effective technologies for modernizing – A world class research center
• Government led initiatives inform of Knowledge Transfer Partnership, where students get more industry exposure, can play a key role in creating the right institute-industry linkages
Administrative enhancers
BIS certification guidelines
• Electrical industry is largely dependent on imported electrical grade steel due to very limited manufacturing capacities within India. CRGO and Boiler quality plates are presently imported from very few suppliers worldwide (only 14 mills are operating worldwide). Out of 14 only 3 mills are BIS certified; currently it is mandatory to obtain BIS certification for all the suppliers.
• Any delay in the registration of foreign suppliers with BIS leads to supply constraints to domestic industry
• BIS certifications guidelines to be modified to avoid delays in registration of foreign suppliers
Final Report - Krishnapatnam Industrial Node Development Plan PwC/Nippon Koei 28
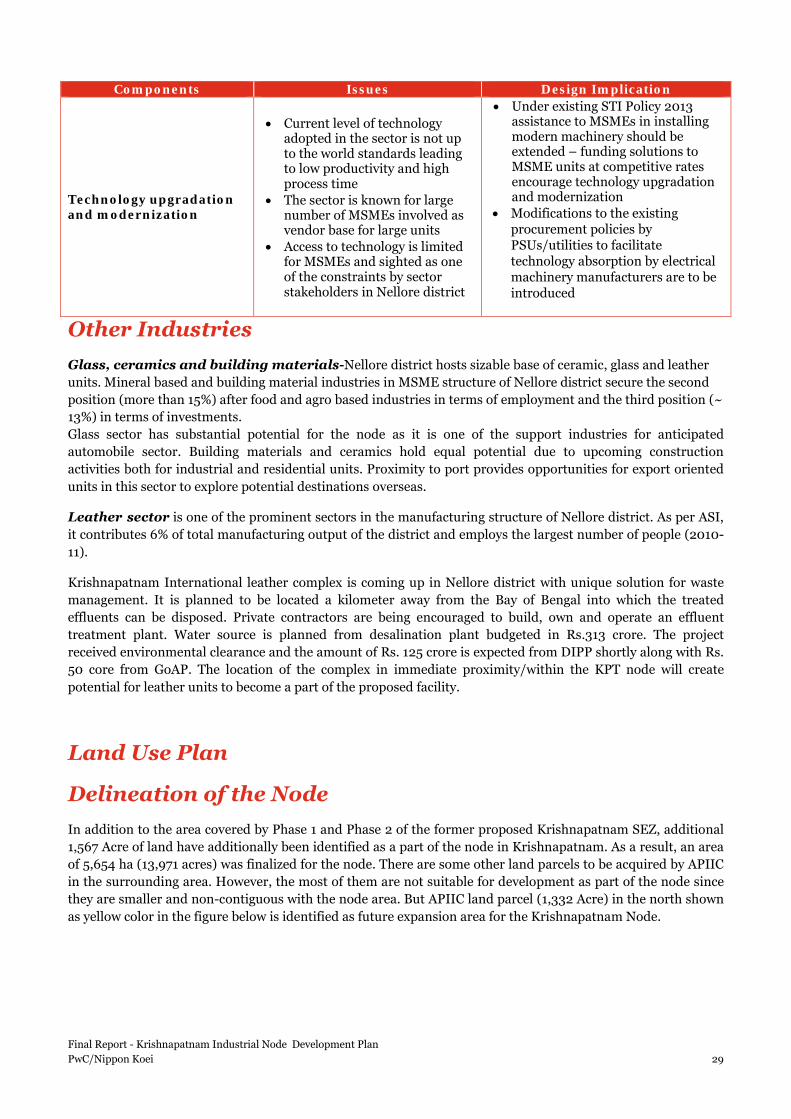
Components Issues Design Implication
Technology upgradation and modernization
• Current level of technology adopted in the sector is not up to the world standards leading to low productivity and high process time
• The sector is known for large number of MSMEs involved as vendor base for large units
• Access to technology is limited for MSMEs and sighted as one of the constraints by sector stakeholders in Nellore district
• Under existing STI Policy 2013 assistance to MSMEs in installing modern machinery should be extended – funding solutions to MSME units at competitive rates encourage technology upgradation and modernization
• Modifications to the existing procurement policies by PSUs/utilities to facilitate technology absorption by electrical machinery manufacturers are to be introduced
Other Industries Glass, ceramics and building materials-Nellore district hosts sizable base of ceramic, glass and leather units. Mineral based and building material industries in MSME structure of Nellore district secure the second position (more than 15%) after food and agro based industries in terms of employment and the third position (~ 13%) in terms of investments. Glass sector has substantial potential for the node as it is one of the support industries for anticipated automobile sector. Building materials and ceramics hold equal potential due to upcoming construction activities both for industrial and residential units. Proximity to port provides opportunities for export oriented units in this sector to explore potential destinations overseas.
Leather sector is one of the prominent sectors in the manufacturing structure of Nellore district. As per ASI, it contributes 6% of total manufacturing output of the district and employs the largest number of people (2010-11).
Krishnapatnam International leather complex is coming up in Nellore district with unique solution for waste management. It is planned to be located a kilometer away from the Bay of Bengal into which the treated effluents can be disposed. Private contractors are being encouraged to build, own and operate an effluent treatment plant. Water source is planned from desalination plant budgeted in Rs.313 crore. The project received environmental clearance and the amount of Rs. 125 crore is expected from DIPP shortly along with Rs. 50 core from GoAP. The location of the complex in immediate proximity/within the KPT node will create potential for leather units to become a part of the proposed facility.
Land Use Plan
Delineation of the Node In addition to the area covered by Phase 1 and Phase 2 of the former proposed Krishnapatnam SEZ, additional 1,567 Acre of land have additionally been identified as a part of the node in Krishnapatnam. As a result, an area of 5,654 ha (13,971 acres) was finalized for the node. There are some other land parcels to be acquired by APIIC in the surrounding area. However, the most of them are not suitable for development as part of the node since they are smaller and non-contiguous with the node area. But APIIC land parcel (1,332 Acre) in the north shown as yellow color in the figure below is identified as future expansion area for the Krishnapatnam Node.
Final Report - Krishnapatnam Industrial Node Development Plan PwC/Nippon Koei 29

Source: JICA Study Team
Figure 1.6: Node Boundary of Krishnapatnam
Table 1.2: Breakdown of Node Area
Area (Acre) (ha)
Phase-1 5,501 2,226 Phase-2 8,470 3,428 Total 13,971 5,654
Source: APIIC, JICA Study Team
Current Land Use The current land use pattern and distribution of settlements are shown in the figure below:
Figure 1.7: Distribution of Settlements in Krishnapatnam Node
Source: JICA Study Team
Forest
Bay of Bengal
Settlement
Final Report - Krishnapatnam Industrial Node Development Plan PwC/Nippon Koei 30

- Most of the land within the Krishnapatnam node area is vacant. However, a few settlements are
scattered inside of the area (See yellow circles in above figure). The area of the existing settlements inside Node is roughly measured as 243 Acre on the satellite image. R&R plan is needed to be prepared during DPR stage.
- Reserved forest is spread in north part of the Node, and the area has to be protected from any developments. In addition, a small stream cuts across the site in a north-south direction. In view of the need for environmental conservation, this alignment should be unchanged.
- Since this area is located along the coastline, the topsoil is sandy.
Land Acquisition Status For the areas covered by phase 1 of the Krishnapatnam SEZ, 90% of the land has already been acquired by APIIC and allocated to Krishnapatnam Port Infra-Tech Limited (KPIL). However the land acquisition for phase 2 is still in progress. In addition, 1332 acres of new land in the north (Thamminapatnam village) is planned to include as future expansion area through discussion with APIIC.
The land acquisition status of the Krishnapatnam Node as of June 2015 is summarised below:
Table 1.3: Land Acquisition Status of Krishnapatnam Node as of June 2015
Node Area Govt. Land Pvt. Land Acquisition Status Remarks
Kri
shn
apat
nam
Nod
e Total 5,654 ha (13,971 Acre)
656 ha (1,620 Acre)
4,998 ha (12,350 Acre)
Phase-1 2,226 ha (5,501 Acre)
312 ha (770 Acre)
1,914 ha (4,730 Acre) Completed
312 ha are owned by APIIC and 1,914 ha has been handed over to KPIL.
Phase 2 3,428 ha (8,470 Acre)
344 ha (850 Acre)
3,084 ha (7,620 Acre)
Under acquisition
The concessionaire or APIIC is in the process of land acquisition.
Note: Figures in the table are approximate numbers. The field survey has to be done and confirm the exact figures for each land.
Source: JICA Study Team
Consideration of Linkage among Node and other Key Developments
Nellore city is the highest populated city near the node which has a potential to provide skilled and unskilled labours to industrial areas nearby. In addition to Krishnapatnam Node, Sri City and proposed Naidupeta SEZ located along NH-5 are expected to be developed as a core of urban development /industrial development, and therefore the cluster developments have to be linked together to enhance the future growth of this area. The concept of cluster developments in the Nellore area is illustrated below:
Final Report - Krishnapatnam Industrial Node Development Plan PwC/Nippon Koei 31

Figure 1.8: Enhancement of Connectivity among Surrounding Cores
Source: JICA Study Team
As shown in the above figure, the access road from Naidupet to Krishnapatnam node will be proposed from which will reduce the freight distance and time as well. This will also ensure good connectivity to Bengaluru.
Review of Existing Development Plan The points for consideration and proposals for the transportation and land use sectors are summarised below:
Table 1.4: Items to be considered in the Existing Plan (Krishnapatnam)
Item should be considered Proposal Transportation • Access road from Krishnapatnam port to Node
area is an unpaved 1-lane road. • Access road to Krishnapatnam and
connectivity to NH-5 has to be improved • No public transport system is proposed • A bus system is necessary to transport workers
from the nearest railway station to individual factories
Land Use • Nellore city, which is expected to be the main
source of labour, is 40km from the Node. • Residential complexes for middle/low income
workers should be built to ensure stable manpower within the node.
Source: JICA Study Team
Projected Industrial Land Demand The target year for completion of the node’s development is 2033. Taking into account appropriate development scales and after discussion with nodal agencies, JICA Study Team proposes to develop the node in three phases: Phase-1 (2014-2018), Phase-2 (2019-2023) and Phase-3 (2024-2033).
The estimated land demand of those industries used to achieve the growth scenario is shown in the following table:
Final Report - Krishnapatnam Industrial Node Development Plan PwC/Nippon Koei 32

Table 1.5: Estimation of Developable area for Krishnapatnam Industrial Node
(unit: acre)
Sectors Phase-1 (2014-2018)
Phase-2 (2019-2023)
Phase-3 (2024-2033)
Traditionally Strong Sectors
Metallurgy 234 587 1,402
Food Processing 424 1,063 2,540
Textiles & Apparels 76 190 453
Electrical Machinery 212 532 1,270 Chemicals & Petrochemicals 83 207 494
Pharma 12 29 69
(Sub-total) 1,040 2,606 6,228
Potential Sectors
Medical Equipment 65 163 389
Machinery 65 163 389
Auto 65 163 389 Computer, electronic and optical products 65 163 389
(Sub-total) 260 652 1,557
Total 1,300 3,258 7,785
Source: JICA Study Team
Projected Population The future population of the node, consisting of the working population and residential population, was projected according to the land demand. As a result, the working population will be 582,700 people with a residential population of 200,000 people in the Krishnapatnam Node in 2032.
Table 1.6: Population Framework
Phase-1 Phase-2 Phase-3 Working Population 97,336 243,849 582,706 Residential Population 33,408 83,695 200,000
Source: JICA Study Team
Land Use and Phasing Plan Based on the development framework and the development concepts above, the required area for each land use category is estimated as shown in the following table.
Table 1.7: Proposed Area by Land Use in Krishnapatnam Node
(Acre)
Phase-1 Phase-2 Phase-3 Total Industrial area 1,300 1,957 4,527 7,785 Residential area 284 428 987 1,699 Existing settlement 164 94 261 519 Infrastructure(road & plant)
770 643 1095 2,508
Water body, green area and others
91 570 799 1,460
Total 2,609 3,692 7,669 13,971
Final Report - Krishnapatnam Industrial Node Development Plan PwC/Nippon Koei 33

Source: JICA Study Team
Infrastructure Development Plan
Overview The table below shows the infrastructure development plan for Krishnapatnam IN with the key features highlighted in the subsequent figure:
Table 1.8: Summary of Infrastructure Development Plan
Component Key features
Site characteristics 10 KM south of Krishnapatnam port The eastern edge of Phase-3 is adjacent to the coastline. Hence, the area has low elevation and is sandy
Land use Residential areas planned around existing settlements
Road Access road to Krishnapatnam port Connectivity to NH-5 are proposed
Railway New rail access line connecting port line to the node’s logistics hub
Water supply To be sourced from Kandarelu reservoir Recycled water from Nellore STP
Solid Waste Management Regional waste treatment facility proposed
Power No in-node generation High priority of dispatch from existing generation plant
Source: JICA Study Team
Logistics Waste Treatment
Reserved
to Krishnapatnam Port
To NH-5
To NH-5
Figure 1.9: Infrastructure Development Plan for Krishnapatnam Industrial Node
Final Report - Krishnapatnam Industrial Node Development Plan PwC/Nippon Koei 34

Road
Current Situation
Major industrial linkage to/from Krishnapatnam node will be developed with Bengaluru, Chennai, Vijayawada, Guntur, Nellore, Chennai Port, Ennore Port, and Sri City. Present lane numbers of corresponding roads to the linkages are four or six on linkages with Chennai, Vijayawada, Guntur, Sri City, Chennai Port, and Ennore Port. However, there are some sections which are given only two lanes on linkages with Bengaluru. There is almost no congested road sections on major industrial linkage to/from Krishnapatnam node based on volume capacity ratio at present condition.
External roads near Krishnapatnam node are NH5 and Krishnapatnam Port road. Krishnapatnam Port Road via NH5 is current main access road of Krishnapatnam node. Present road condition of NH5 and Krishnapatnam Port Road are fairy maintained. As for internal road, some road sections are being constructed with two lanes. Existing roads on undeveloped area are basically narrow and damaged.
Krishnapatnam Port Company Limited proposed accesses from south (6 lane road) running from Naidupet (NH 5) via Kota and new industrial park to Krishnapatnam Port with length of about 50 km. Dimension of the development area is that north-south distance of about 11km and east-west distance of about 2-4km. Road Network pattern is grid type and three north-south trunk roads three east-west trunk roads are planned.
Demand Supply Analysis for External Node Infrastructures
Demand supply gaps of main access routes connecting to the four access points of Krishnapatnam node are estimated and introduction of LRT is proposed for access route of access point D because V/C is 1.91 in long term under 8 lanes road capacity without introduction of public transport and development of more than 8 lanes road is not realistic. Result of demand supply analysis for all access points are shown in Table 1.9.
Table 1.9: Result of Demand Supply Analysis by Access Points
Year 2019 2024 2034
Access Points A B C D A B C D A B C D
Number of Lanes (Access Road) 2 2 2 4 2 4 2 4 4 8 4 8
Demand Supply Gap (V/C) Roads 0.35 0.58 0.36 0.38 0.88 0.55 0.89 0.90 0.90 0.97 0.92 0.91
LRT 0.60
Source: JICA Study Team
Framework for Infrastructure Development for Node Development
Four principle development issues on roads and public transport sector are established based on present condition and future traffic demand of the sector and the development vision as follows:
Promotion of Public Transport: Promotion of public transport, development of pedestrian and cyclist facilities, and development of transfer facilities among different transport facilities
Smooth Transit in Node: Efficient networking and good accessibility to station of public transport, and efficient traffic control at intersections to prevent bottleneck on road network
Segregation of Cargo Traffic: Segregation measures on road structure and road network
Environmental Conservation: Introduction of low-emission type vehicle into public transport system
Development Plan
Based on proposed internal and external node development plans and identified projects, implementation plan with preliminary cost estimate for internal and external node developments are proposed as shown in table below:
Final Report - Krishnapatnam Industrial Node Development Plan PwC/Nippon Koei 35

Table 1.10: Implementation Plan with Preliminary Cost Estimate for Internal and External Node
Development Plans
Source: JICA Study Team
Railway
Current Situation
The site is 9 km south of Krishnapatnam Port, which has an existing fully electrified double line with automatic signaling that connects to the Chennai – Nellore main line at Venkatachalam. There is also a full-fledged rail yard at the Port. As the Port is likely to serve as a gateway for EXIM traffic, all rail traffic generated at this node will be domestic traffic only.
Demand Forecast
The demand forecast for Krishnapatnam was based on input/output forecasts prepared by the JICA Study Team. The following table presents the forecasts of the rail modal volume and share used as a basis for scaling the rail facilities at Krishnapatnam.
2014 2015 2016 2017 2018 2019 2020 2021 2022 2023 2024 2025 2026 2027 2028 2029 2030 2031 2032 20331) Primary Roads 5175 6945 3655 516 516 516
2) Secondary Roads 6203 2243 8590 5980 5428 5428 5428 5428
3) Tertiary Roads 2600 4520 4238 4238 5398 4238 4310 4310 4310 4310 4310
1) At-Grade Intersection (signalized) 569 320 220 220 453 453
2) Grade-separated intersection 3257 3257 2517
1) On Primary Road 2142 2142 2142
2) On Secondary Road 835 835 835 626 626 626 626 626 626 626 626
3) On Tertiary Road 1158 1158 1158 1158
1) On Primary Road2) On Secondary Road 212 212 212
3) On Tertiary Road1) Street Light 675 928 607 607 760 2525
2) Traffic Light 810 810 880 905 905
3) Central Traffic Light Control System 300
4) Utilies Box 7680 7680 7680
1) Bus Terminal 1300 2600 2600
2) Bus stop 137 137 137 260 260 500 500
3) Bus Depot 800 1600 1600
4) LRT 15000 15000 15000 15000 15000 15000 15000 15000
19437 32363 28098 1784 6021 6628 16858 16538 15000 15000 15516 20452 26380 25364 26721 33320
7. External Road Works 1) RA1 8548 9246 12513 1280 1280 1280 4768 7762 9418
1) Railway2) LRT 36250 36250 36250 36250 36250 36250 36250 36250
1) Road Bridge 10965 10965 10965
2) LRT Bridge 900 900 900 900
19513 20211 23478 1280 1280 1280 37150 37150 37150 37150 36250 41018 44012 45668
38950 52574 51576 1784 6021 7908 18138 17818 52150 52150 52666 57602 62630 66382 70733 78988
Grand Total (External Node)Grand Total (Internal and External Node)
8. External Public TransportFacilities Works
9. Major River Bridge Works
6. Internal Public Transport FacilitiesWorks
Grand Total (Internal Node)
5. Road Facilities
3. River Bridge Works
4. Flyover Bridge Works
2. Intersection Works
Phase 3 (2024-2033)
1. Internal Road Works
Phase 1 (2014-2018) Phase 2 (2019-2023)Item Description
Final Report - Krishnapatnam Industrial Node Development Plan PwC/Nippon Koei 36

Table 1.11: Krishnapatnam Node – Forecast Rail share of container and break bulk freight
volume
Traffic category 2017/18 2022/23 2027/28 2032/33 Containers - Loaded inbound (TEU) 528 907 1,557 2,674 - Loaded outbound (TEU) 12,355 21,216 36,431 62,559 - Empty Inbound (TEU) 11,827 20,309 34,874 59,885 Total 24,710 42,431 72,862 1,25,118 Containers - rail volume - Loaded inbound (TEU) 528 907 1,557 2,674 - Loaded outbound (TEU) 6,211 10,665 18,314 31,449 - Empty Inbound(TEU) 0 0 0 0 Total 6,739 11,572 19,872 34,123 Containers - rail share (%) - Loaded inbound (TEU) 100% 100% 100% 100% - Loaded outbound (TEU) 50% 50% 50% 50% - Empty Inbound (TEU) 0% 0% 0% 0% Total 27% 27% 27% 27% Breakbulk - Inbound (tonnes) 4,68,967 8,05,300 13,82,845 23,74,594 - Outbound (tonnes) 1,90,649 3,27,378 5,62,167 9,65,341 Total 6,59,615 11,32,678 19,45,012 33,39,935 Breakbulk - rail volume - Inbound (tonnes) 92,192 1,58,310 2,71,847 4,66,810 - Outbound (tonnes) 0 0 0 0 Total 92,192 1,58,310 2,71,847 4,66,810 Breakbulk - rail share % - Inbound 20% 20% 20% 20% - Outbound 0% 0% 0% 0% Total 14% 14% 14% 14% Petrochemicals - inbound pipeline 77,012 1,32,243 2,27,084 3,89,945
Source: JICA Study Team
Development Plan
The logistics hub is proposed near the northern edge of the node and will be connected to the existing port line via a 15 km electrified line. Since hubs cannot be electrified for overhead traction (as it would obstruct loading), there will be receiving sidings outside each hub to allow for electric locomotives to run around and push trains into the hub. The proposed line therefore includes a main line of 13.5 km and 2 receiving sidings of 752 m each.
The line is expected to cost Rs. 79.5 Crores (USD 13.25 mn).
The Krishnapatnam logistics hub itself will cover an area of 151,375 square metres and will have 2 lines – one to receive steel and one to handle container traffic. It will also have a container freight station, warehouses, trailer parking and workshops as required. It will be developed in 2 phases at a total cost of Rs. 64.2 crores (USD 10.7 mn).
The capital costs and identified O&M costs for the Krishnapatnam logistics hub and railway access line over a 20 year operating period are given below.
Final Report - Krishnapatnam Industrial Node Development Plan PwC/Nippon Koei 37

Table 1.12: Krishnapatnam Railway Access Line and Logistics Hub - Cost Summary
Cost Details (Rs. Crore) Phase-1 Phase-2
Total 2016 to
2026 2027 to
2037
Railway Access Line and Wagons
a) Capital Cost of Railway Access Line 79.52 - 79.52
b) Maintenance Cost of Railway Access Line 16.39 40.02 56.41
c) Capital Cost of Container Wagons 5.65 9.25 14.90
d) Maintenance Cost of Container Wagons 3.85 11.17 15.02
Logistics Hub
e) Capital Cost of Logistics Hub 60.93 3.26 64.19
f) O & M Cost of Logistics Hub 33.08 53.36 86.44
Total 199.42 117.06 316.48
Source: JICA Study Team
Water
Current Situation
At the 50 km upstream of Penna River from Nellore City, there is Somasila Dam which is planned to be a stable water resource of Nellore City in the future. Also, there is Kandaleru Reservoir at about 50km west of Krishnapatnam Node, which can supply enough irrigational water and domestic water of Gudur City. Both Somasila Dam and Kandaleru Reservoir are stable water resources for the existing irrigation activity and domestic water supply schemes.
Even though the ground water classification status is “safe” for Chillakur & Kota taluks / mandals in Nellore district, where the Krishnapatnam Node is situated, it will be ideal to limit the ground water usage for the sustainable development of the node and the surrounding areas.
Framework for Infrastructure Development
To realize sustainable development of the Krishnapatnam Node, stable water supply, good sanitary conditions, preservation of water environment and prevention of flood event are imperative. Development framework of water infrastructure including the one for water supply, wastewater management and stormwater management are proposed as follows:
24x7 supply of water to 100% industries and households with direct water supply connection will be achieved.
100% connection of industries and households to sewer network and 100% coverage of primary and secondary treatment of the sewage will be achieved.
100% coverage of road network with stormwater drainage network will be achieved. Because of the very limited surface water resource and ground water resource around Krishnapatnam
Node, water recycling of the treated wastewater from the Nellore City and the Node area will be introduced.
78 MLD of surface water from Kandaleru Reservoirs which is located at abut 50km west of Krishnapatnam Node will be allocated and utilized for domestic and industrial purpose.
Final Report - Krishnapatnam Industrial Node Development Plan PwC/Nippon Koei 38

Water Balance
Based on the above-mentioned framework, the ultimate water balance of Krishnapatnam Node for the phase 3 is estimated as described in the following Figure.
Figure 1.10: Water Balance for the Phase 3
WTP: Water Treatment Plant, STP: Sewage Treatment Plant, ETP: Effluent Treatment Plant, TTP: Tertiary Treatment Plant for Recycling of sewage and industrial wastewater
Source: JICA Study Team
Development Plan
The capital costs and O&M costs for the three phases are summarized in the following Table.
Table 1.13: Summary of Capital Cost and O&M Cost for Water Sector
Source: JICA Study Team
Solid Waste Management
Current Situation
The only one regional TSDF (landfill and incinerator) in Andhra Pradesh is located at Pharma city, the linear distance of around 500 km away from Krishnapatnam Node, and it’s located outside of CBIC area. The amount of hazardous waste for incineration in the Node is estimated so few that construction of a new incineration facility would be not effective.
Development Framework
Appropriate solid waste management is essential for providing a safe and hygienic living environment. It also helps to promote sustainable development of the node and reduces the impact on the environment. Development concept and policies for solid waste management in the node, as well as the programs of which activities to be conducted by responsible parties to achieve those policies are proposed as follows.
38.0 MLD
(Recovery Ratio =
151.9 MLD
80 %)
151.9 MLD
ETPIndustrial water (non-potable) 157.6 MLD110.3 MLD
39.4 MLDDomestic water (potable) - 49.3 MLD
39.4 MLD
TTP
39.4 MLD
KandaleruReservoir
(10% of leakage)
40.2 MLD
(10% of leakage)
23.2 MLD
54.8 MLD
STP
STPs in NelloreCity
WTP
78.0 MLD Treat &sludgedisposal
capital costAvg. annualO&M cost capital cost
Avg. annualO&M cost capital cost
Avg. annualO&M cost
1 Potable water supply system 5,710 278 2,147 429 2,379 6082 Non-potable water supply system 1,842 105 2,727 346 7,477 9093 Sewerage system 347 14 594 41 804 804 Treated sewage & effluent colletion system 695 27 1,214 78 5,283 1755 Stormwater drainage system 853 43 2,033 144 2,767 283
9,447 466 8,716 1,038 18,710 2,054* All figures are in million INR
Total
No ComponentPhase-1 (2016-18) Phase-2 (2019-23) Phase-3 (2024-33)
Final Report - Krishnapatnam Industrial Node Development Plan PwC/Nippon Koei 39
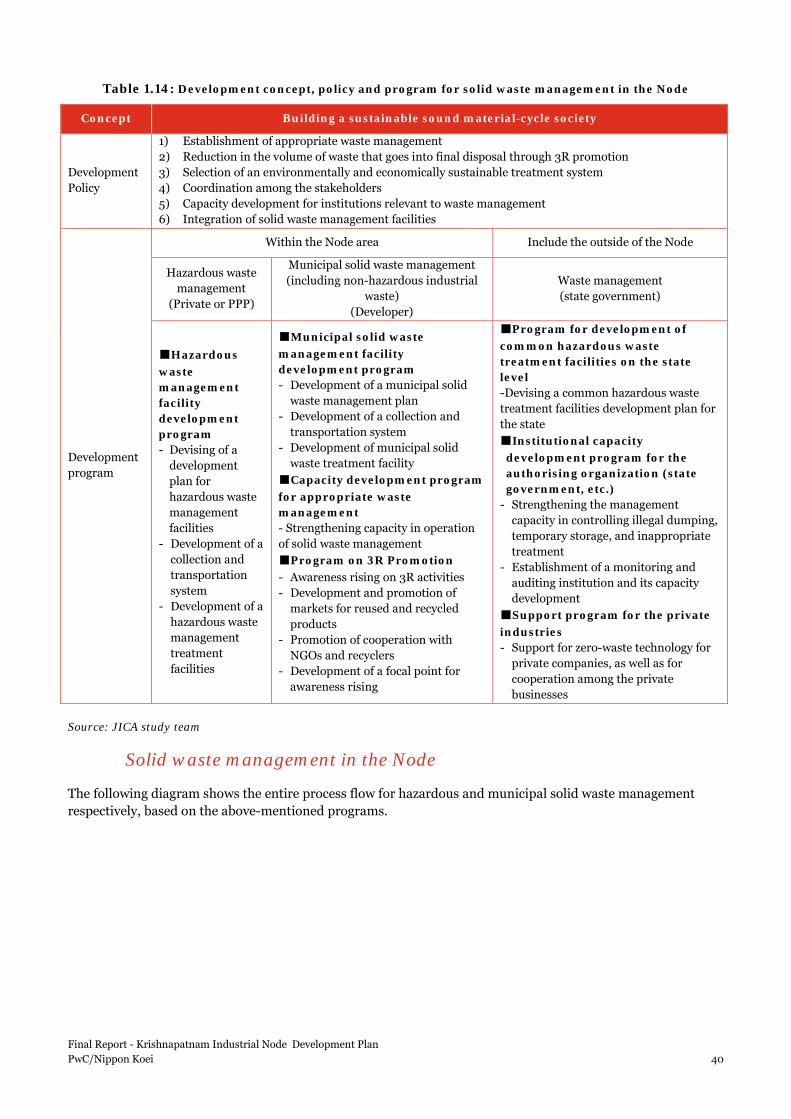
Table 1.14: Development concept, policy and program for solid waste management in the Node
Concept Building a sustainable sound material-cycle society
Development Policy
1) Establishment of appropriate waste management 2) Reduction in the volume of waste that goes into final disposal through 3R promotion 3) Selection of an environmentally and economically sustainable treatment system 4) Coordination among the stakeholders 5) Capacity development for institutions relevant to waste management 6) Integration of solid waste management facilities
Development program
Within the Node area Include the outside of the Node
Hazardous waste management
(Private or PPP)
Municipal solid waste management (including non-hazardous industrial
waste) (Developer)
Waste management (state government)
■Hazardous waste management facility development program - Devising of a
development plan for hazardous waste management facilities
- Development of a collection and transportation system
- Development of a hazardous waste management treatment facilities
■Municipal solid waste management facility development program - Development of a municipal solid
waste management plan - Development of a collection and
transportation system - Development of municipal solid
waste treatment facility ■Capacity development program for appropriate waste management - Strengthening capacity in operation of solid waste management ■Program on 3R Promotion - Awareness rising on 3R activities - Development and promotion of
markets for reused and recycled products
- Promotion of cooperation with NGOs and recyclers
- Development of a focal point for awareness rising
■Program for development of common hazardous waste treatment facilities on the state level -Devising a common hazardous waste treatment facilities development plan for the state ■Institutional capacity development program for the authorising organization (state government, etc.)
- Strengthening the management capacity in controlling illegal dumping, temporary storage, and inappropriate treatment
- Establishment of a monitoring and auditing institution and its capacity development
■Support program for the private industries - Support for zero-waste technology for
private companies, as well as for cooperation among the private businesses
Source: JICA study team
Solid waste management in the Node
The following diagram shows the entire process flow for hazardous and municipal solid waste management respectively, based on the above-mentioned programs.
Final Report - Krishnapatnam Industrial Node Development Plan PwC/Nippon Koei 40
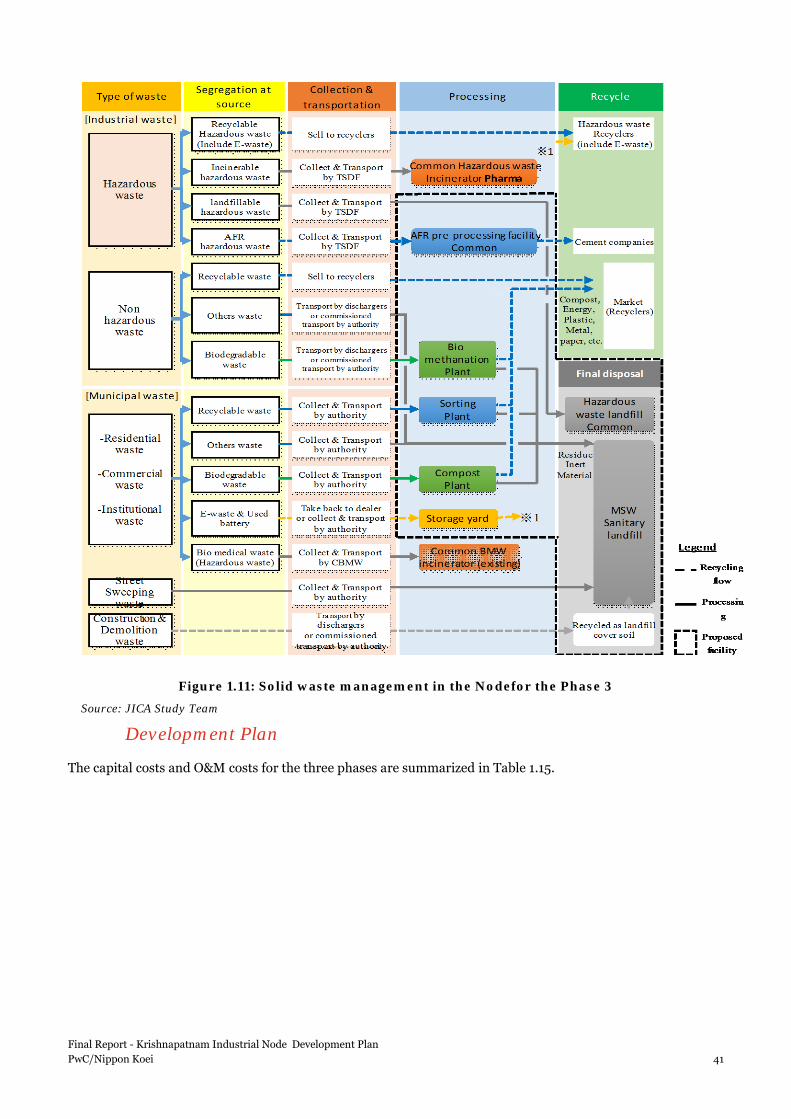
Figure 1.11: Solid waste management in the Nodefor the Phase 3
Source: JICA Study Team
Development Plan
The capital costs and O&M costs for the three phases are summarized in Table 1.15.
Final Report - Krishnapatnam Industrial Node Development Plan PwC/Nippon Koei 41

Table 1.15: Summary of Capital Cost and O&M Cost for Solid waste management Sector
Source: JICA Study Team
Power Power infrastructure planning for the node has been undertaken keeping in mind the overall objective of ensuring round the clock power for consumers at affordable rates while ensuring smart elements of the power network are integrated with other infrastructure networks.
Based on primary and secondary interactions with the key stakeholders and investors, it was found that reliable and quality power at affordable rates was one of the important considerations for any node investments. Corresponding to these needs, the characteristics of the power systems was designed. Redundancy of operations, maximum efficiency, operations via multiple IT systems etc. were found to be the key determinants of a successful design. This was integrated in the “Smart” approach for undertaking the actual design of the network.
Power Demand and Generation
The upcoming power demand expected in the node has been compared with existing power infrastructure availability on ground to assess gaps for meeting the objective. The consultant found that from the distribution and transmission perspective additional capacities would be needed on ground for meeting the upcoming demand. We see that for meeting the demand at varying scenarios the node needs close to 233 MW in phase II which increases to 540 MW in phase III.
When the consultant considered the available sources for meeting the gap, only two sub stations (Chendodu- 132kV, 2X150 MVA and the proposed Nidiguntapalem- 132 kV, 2X150 MVA) form a viable source of power transmission into the node. Chendodu has close to 60 MVA available for the node transmission. In case adequate generation is available, this S/S can provide enough supply for Phase I demand of the node. In the Phase II also, this can partially meet the demand. As per the plans of transmission utility, the second sub-station (Nidiguntapalem) will be available in the phase II for supply to the node. Post the availability of the second sub-station, the region would have enough transmission capacity for meeting the phase III demand as well.
Considering the load requirement at the node for ensuring robustness, two Main Receiving Sub Stations (MRSS – 132kV, 2X 150 MVA sub-station) has been planned for taking up the entire supply from the other transmission S/S outside the node. MRSS would be responsible for distribution of electricity within the node in the phase II and phase III. As per the requirement of the power system, a gas insulated sub-station with spare capacity has been planned in node. This sub-station provides the maximum reliability and efficiency for power transmission. The technical details of the MRSS have been attached as an appendix to the report.
Phase Total Phase Total Phase TotalO&M cost O&M cost O&M cost
1) Hazardous waste landfill 24 7 58 45 297 4182) AFR pre-processing facility 150 68 101 201 554 1,2881) Composting plant 9 3 20 16 83 1242) Biomethanation plant 42 19 62 83 143 3943) Sorting plant 3 2 8 15 30 1084) Sanitary landfill 6 1 28 14 169 1725) Stockyards for e-waste, etc. 8 8 86) Collection vehicle 21 12 26 45 88 2367) Garage & workshop 7 7 21
Period Phase Total Period Phase Total Period Phase Total
1 year 54
2 years 107
■Program on 3R Promotion
Cost: INR mil.
■Institutional capacity development program for the authorizing organization2 years 107 1 year 54
Item ComponentPhase 1(2014-2018) Phase 2 (2019-2023)
Capital cost Capital cost
Hazardous wasteinfrastructure
MSWinfrastructure
Phase 3 (2024-2033)
Capital cost
2 years
soft component
■Capacity development program for appropriate waste management
■Program for development of common hazardous waste treatment facilities on the state level
■Support program for the private industries
1293 years431 year86
Final Report - Krishnapatnam Industrial Node Development Plan PwC/Nippon Koei 42

Distribution
On the distribution side, based on the load requirement around 34 sub stations of 16 MVA each have been planned for taking up the load by phase III. All these distribution sub-stations would be connected via 33 kV lines to MRSS sub station and would have 11kV feeders for consumer load. These are standard underground sub stations that have been used in previous city design and provide robustness in design as well as are efficient in preventing losses and pilferage. We have also estimated the tentative tapping points as well as total land requirement for MRSS as well as distribution sub stations. Benchmarking of the design has also been undertaken with similar initiatives by private players for improving distribution network performance e.g. NDPL in Delhi, Torrent Power in Agra, Power grid in Vishakhapatnam etc. This is important for assessing the practicality of the design on ground.
Table 1.16: Substation requirement in the node area
Characteristics 2016-19 2020-24 2025-32
Total demand expectation for system design (MW) 59.33 163.36 351.56
System design for 80% loading condition in the node 74.16 204.20 439.45
System power factor 0.80 0.80 0.80
Total installed capacity (MVA) 92.70 255.24 549.31
Capacity of each distribution sub- station (MVA) 16 16 16
Additional distribution sub-station requirement (Nos.) 6 10 18
Procurement
From the generation perspective, in order to ensure robust availability of supply to consumers around 550 MW would be needed in the phase III for the node. Considering the nature of electricity, it is not necessary that generation for the entire capacity needs to be within the node. Through regulatory norms provided we have transmission availability and commercials of the arrangement make sense, power can easily be procured from outside the node at delivery points of transmission sub stations. The same has also been estimated for the node. Around 80% of the power would be procured from the Southern Grid via Chendodu and Nidiguntapalem sub-stations. Several regulatory provisions like allowance of open access at transmission level as well as reduction in cross subsidy for the node can enable cheaper power for the node as an incentive for the consumers.
Most of the power procured from outside the node is expected to be from conventional power stations. However, considering the regulatory provisions for open access consumers, a certain percentage of power needs to come through renewable sources. This can be enabled in the node via local renewable energy sources like solar and wind. The node has been assessed to fall in a region in AP which is conducive to solar as well as wind energy. Hence, around 42 MW of solar and wind generation would be expected in phase II which will increase to 98 MW in phase III. The key objective of the generation design has been to ensure adequate power availability for consumers at the transmission delivery point of the node (MRSS bay).
Investment Requirement
Total investment requirement in transmission and distribution is estimated to be around Rs. 1,31,594 lakh (with cost escalation) for the node all three phases. For in node generation, the investment would be undertaken for specific industries which are looking to set up the capacities and for procured generation from outside the node, no additional investment in generation is envisaged to meet the node requirement. Lastly on the smart metering front, the meters at consumer end would be paid for by consumers only as is the industry norms. Hence, these have also not been taken in the analysis.
Final Report - Krishnapatnam Industrial Node Development Plan PwC/Nippon Koei 43
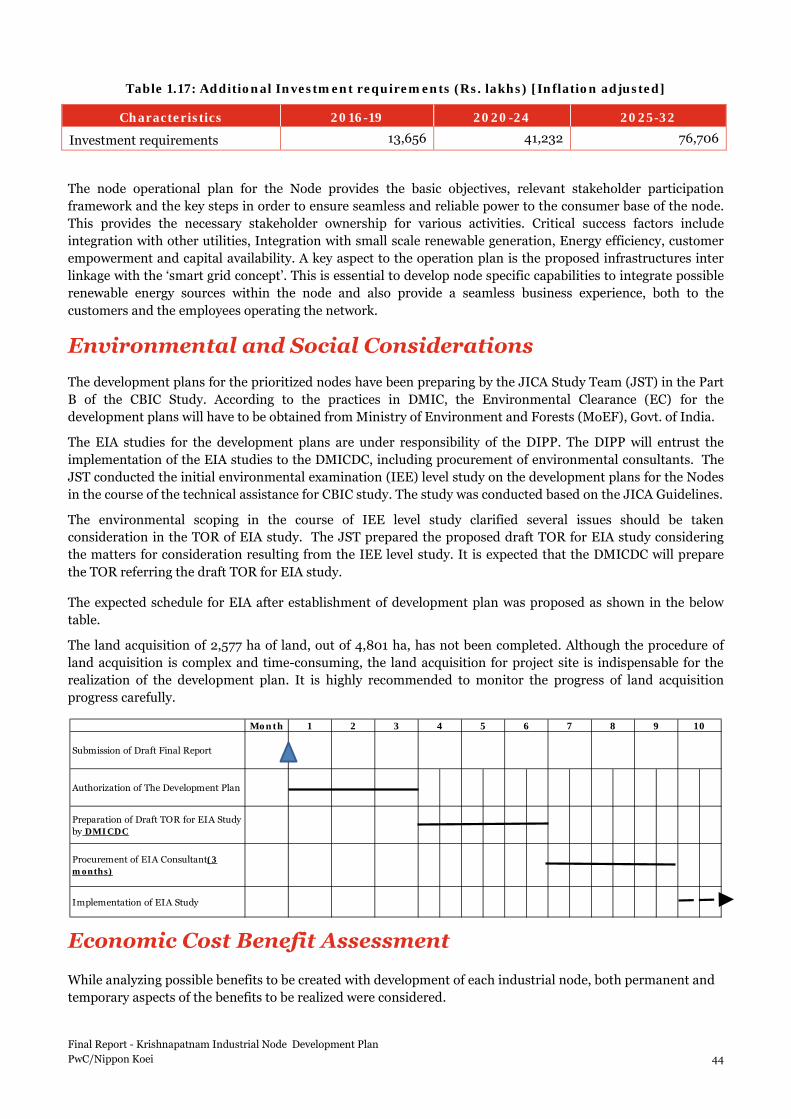
Table 1.17: Additional Investment requirements (Rs. lakhs) [Inflation adjusted]
Characteristics 2016-19 2020-24 2025-32
Investment requirements 13,656 41,232 76,706
The node operational plan for the Node provides the basic objectives, relevant stakeholder participation framework and the key steps in order to ensure seamless and reliable power to the consumer base of the node. This provides the necessary stakeholder ownership for various activities. Critical success factors include integration with other utilities, Integration with small scale renewable generation, Energy efficiency, customer empowerment and capital availability. A key aspect to the operation plan is the proposed infrastructures inter linkage with the ‘smart grid concept’. This is essential to develop node specific capabilities to integrate possible renewable energy sources within the node and also provide a seamless business experience, both to the customers and the employees operating the network.
Environmental and Social Considerations The development plans for the prioritized nodes have been preparing by the JICA Study Team (JST) in the Part B of the CBIC Study. According to the practices in DMIC, the Environmental Clearance (EC) for the development plans will have to be obtained from Ministry of Environment and Forests (MoEF), Govt. of India.
The EIA studies for the development plans are under responsibility of the DIPP. The DIPP will entrust the implementation of the EIA studies to the DMICDC, including procurement of environmental consultants. The JST conducted the initial environmental examination (IEE) level study on the development plans for the Nodes in the course of the technical assistance for CBIC study. The study was conducted based on the JICA Guidelines.
The environmental scoping in the course of IEE level study clarified several issues should be taken consideration in the TOR of EIA study. The JST prepared the proposed draft TOR for EIA study considering the matters for consideration resulting from the IEE level study. It is expected that the DMICDC will prepare the TOR referring the draft TOR for EIA study.
The expected schedule for EIA after establishment of development plan was proposed as shown in the below table.
The land acquisition of 2,577 ha of land, out of 4,801 ha, has not been completed. Although the procedure of land acquisition is complex and time-consuming, the land acquisition for project site is indispensable for the realization of the development plan. It is highly recommended to monitor the progress of land acquisition progress carefully.
Economic Cost Benefit Assessment
While analyzing possible benefits to be created with development of each industrial node, both permanent and temporary aspects of the benefits to be realized were considered.
Submission of Draft Final Report
Authorization of The Development Plan
Preparation of Draft TOR for EIA Studyby DMICDC
Procurement of EIA Consultant(3months)
Implementation of EIA Study
Month 2 4 5 9 1031 6 7 8
Final Report - Krishnapatnam Industrial Node Development Plan PwC/Nippon Koei 44

Key Economic Benefits Some of the key benefits that would be expected include:
Table 1.18: Direct and Indirect Benefits
Direct benefits: Indirect benefits:
• Gross economic value added • Employment generation • Land development and monetization in
industrial node • Industrial investments in industrial node • Taxes collection by the state/central
government
• Indirect potential employment generation by sector
• Exports promotion prospects • Availability of quality industry/infrastructure
o Enhanced mobility and alternate transportation
o Efficient and responsible infrastructure use
o Availability of work-life balance benefits o Intangibles such as social welfare change
Direct Benefits
Direct potential employment generation by sector
Employment generated in proposed industrial nodes will comprise of direct and indirect employment opportunities. Direct employment refers to employment directly related to the production of products or services across sectors identified as focus sectors in each industrial node. By the end of phase 3, the total number of employment opportunities will be 233,082.
Table 1.19: Direct potential employment of Krishnapatnam Industrial Node
Total direct employment Traditionally strong sectors 148,331
Metallurgy 14,304
Food Processing 49,712
Textiles & Apparels 33,234
Electrical Machinery 37,888
Chemicals & Petrochemicals 11,830
Pharma 1,363
Potential sectors 84,751 Total 233,082
Source: JICA Study Team for CBIC
Industrial investment
Industrial land is expected to attract tenants from various sectors identified for Krishnapatnam Industrial Node as focus sectors. Total land for traditionally strong sectors with higher probability to get occupancy is 6,228 acres. Potential sectors are projected to occupy 1,557 acres of industrial land in Krishnapatnam IN. Together these tenants are expected to infuse Rs. 50,596 crore (USD 8,433 million) of investment in the by the end of projected period.
Final Report - Krishnapatnam Industrial Node Development Plan PwC/Nippon Koei 45

Table 1.20: Industrial Investment in Krishnapatnam Industrial Node
Industrial Investment, Rs. crore Traditionally strong sectors 34,935
Metallurgy 9,673
Food Processing 9,477
Textiles & Apparels 3,261
Electrical Machinery 7,746
Chemicals & Petrochemicals 4,447
Pharma 332
Potential sectors 15,661 Total 50,596
Source: PwC projections
Indirect benefits Direct employment results in generation of employment in the businesses that supply goods and services to the manufacturing/service sectors of the node, i.e. indirect employment. Finally, when these directly and indirectly generated incomes are spent and re-spent on a variety of items in the broader economy (e.g., food, clothing, entertainment), it gives rise to induced employment effects. For the purpose of this analysis both indirect and induced potential employment is called indirect potential employment.
The total indirect employment generated due to the Krishnapatnam Industrial Node development is expected to be 1.5 times the direct job creation equal to 349,623 indirect jobs. The number of jobs created within Krishnapatnam Industrial Node would be a portion of above indirect employment creation due to integrated nature of economies in the region.
Indirect benefits Impact
Indirect potential employment generation
Indirect employment in industrial node is expected to amount to 349,623
Availability of quality industrial infrastructure
State-of-the-art industrial infrastructure facilities within the node. It also envisages development/enhancement of transportation system in the vicinity of the node and its proper connection to the major logistics and trade hubs
Enhanced mobility and alternate transportation
Introduction of efficient transportation network to connect the node to the trade, residential, retail and other commercial centers in the vicinity of the node. Residential area is envisaged to have interconnected streets and provision for future expansion of roads and transportation facilities in case of further incremental development
Efficient and responsible infrastructure use
CBIC will make available affordable and accessible sustainable technologies in various areas, including manufacturing process, support services and habitant development.
Availability of work-life balance benefits
Holistic and inclusive development approach gives people the option of living near work and also provides them with opportunities to avail better facilities for their families, including healthcare, residential, shopping, education and recreation facilities
Summary of cost-benefit analysis for Krishnapatnam IN Permanent benefits include potential gross value added from various manufacturing activities across sectors identified as highly potential for Krishnapatnam IN as well as some relevant services. Total permanent
Final Report - Krishnapatnam Industrial Node Development Plan PwC/Nippon Koei 46

employment adjusted to deadweight and displacement assumptions (net employment) till 2052 is anticipated to be 249,107 and total direct GVA contribution is expected to amount to USD 46,331 million.
Table 1.21: Permanent net employment to be generated in Krishnapatnam Industrial Node
Total permanent net employment Nos Direct permanent net employment 99,643 Indirect permanent net employment 149,464 Total permanent net employment 249,107
Table 1.22: Projected GVA benefits, Krishnapatnam Industrial Node
Total GVA USD mn Net additional direct GVA 1,981 Net additional indirect GVA 2,971 Total additional net GVA 4,951
Benefit-cost ratio
The industrial node is assumed as ongoing concern till 2052 for the purpose of NPV calculation. Total net present value of benefits is expected to be USD 1,206 million. The summary of costs and benefits is given in the table below.
Table 1.23: Summary of Net Present Costs and Benefits, Krishnapatnam Industrial Node
Summary of costs and benefits Total projected costs, USD mn 1,645
Total projected benefits GVA, USD mn 4,951
Total net benefits, USD mn 3.3073,362
Having calculated the net present value of projected costs and benefits till 2052, the project is estimated to have a benefit-cost ratio of 1.6 ignoring any optimism bias in the estimated costs and benefits.
Table 1.24: Benefits-Cost Ratio for Krishnapatnam Industrial Node Development
Full-term NPV NPV of projected costs USD mn 759
NPV of projected benefits USD mn 1,206
Benefit - Cost Ratio (BCR) 1.6x Thus, development of Krishnapatnam Industrial Node can be considered economically beneficial given the costs anticipated for development of this industrial node, without taking Optimism Bias under consideration.
Financial Planning and Assessment The financial model has been built for the master SPV which will be responsible for undertaking the development of the Krishnapatnam Industrial node. The development of the node will entail land acquisition and development for let out to industry and support infrastructure, creation and operation of support infrastructure, collection of revenues from the occupants of the land towards upfront land lease, infrastructure usage fee. Alternately, the SPV also has the option of managing just land acquisition, development and sale of land with only none or some or all of the support infrastructure facilities. This means that the SPV has the option of offloading specific infrastructure components to separate SPV’s which will be independent entities. The two options provided in the financial model are as under.
Final Report - Krishnapatnam Industrial Node Development Plan PwC/Nippon Koei 47

Table 1.25: Financial model options
Financial Model Option Description
Option -1 – Master SPV only
Only one SPV (Master SPV) that controls land acquisition and development together with creation, operation and maintenance and revenue appropriation from all support infrastructure like road, rail, water, power solid waste management etc.
Option – 2 – Master SPV and multiple SPVs
Master SPV controls land acquisition, development and operations and also chooses to retain some or none of the support infrastructure facilities. The one’s not under the control of the master SPV will function as separate SPVs.
Costs Based on detailed technical assessment and master planning, cost estimates for developing Krishnapatnam Industrial Node have been arrived at using national and international benchmarks for unit costs.
Table 1.26: Capital cost components
Item Rs. crore % share of TPC
Land acquisition cost 7648 41% Land development 795 4% Roads 2845 15% Railway 112 1% Water and Effluent Treatment Facilities 4760 25%
Solid Waste Management 288 2% Power infrastructure cost 1316 7% Contingency (7% of cost excl. land) 506 3% Interest During Construction 484 3% Total 18753 100%
When represented phase wise, the distribution of projected capex spending is as follows:
Table 1.27: Phase wise capital cost components
Item Phase I Upto FY 19
Phase II FY 20-24
Phase III FY 25 onwards
Land acquisition cost 7,648 0 0
Land development cost 90 165 540
Roads 886 669 1,290
Railway 80 5 27
Water and Effluent Treatment Facilities
837 843 3,080
Solid Waste Management 28 39 220
Power infrastructure cost 137 412 767
Final Report - Krishnapatnam Industrial Node Development Plan PwC/Nippon Koei 48

Contingency 103 107 296
Interest During Construction 138 143 203
Total 9,946 2,383 6,423
Both the above tables pertain to the first scenario which envisages all development and delivery by one master SPV.
Financing Structure Aligned to the DMIC model, it has been assumed that the Master Developer SPV will be constituted with centre and state government participation (and private sector, in cases where the state wishes) and land is brought into the SPV as equity contribution. Base case financing structure for development of Krishnapatnam Industrial Node:
Table 1.28: Financing Structure
Financing component Rs. crore % contribution of TPC
Equity (Infusion into proposed SPV through land)) 8404 45%
Debt (Land development & infrastructure cost) 8064 43%
Internal Accruals 2285 12%
Total 18753
Scenario Analysis for Project Viability Under the current financing structure, and cost and revenue assumptions, the project IRR stands at 7.5% and Equity IRR at 6.35%. Other scenarios of unbundling entities for independent operation have been assumed
1. Land lease rentals: Currently the ongoing lease rentals at Krishnapatnam have been assumed with a 10% y-o-y escalation. It is to be noted that the Master Developer can sell land only to the extent of total area under industrial and residential land- use. Other areas such as road, green space, water body etc are essentially non- saleable areas and form around 18% of total land area under proposed project.
2. Land acquisition price falls by 10% and 20%: The impact on Equity IRR was assessed for this scenario and presented in the chart below.
3. Fall in land sale price by 10% and 20%
4. Fall in water tariffs for both industrial and potable water by 10% and 20%. This scenario has been assumed as water tariffs are a sensitive issue.
5. Land absorption in KPT Industrial Node is extended to 5 more years (Till March 2038).
Final Report - Krishnapatnam Industrial Node Development Plan PwC/Nippon Koei 49

Figure 1.12: Sensitivity Analysis – Master SPV
The above sensitivity analysis has been performed for the scenario of the Master SPV managing the entire infrastructure without unbundling of SPV. From the above, it may be observed that the financial model is most sensitive to the EPC cost fluctuations, land acquisition price and the land sale price.
The scenario pertaining to unbundling of roads is not envisaged as there is no revenue model for the road utility. Hence, under all circumstances, it should be assumed that the road utility is to be vested with the master SPV.
The other sensitivity analysis has been performed by assuming unbundling of individual infrastructure services through separate SPV’s from the Master SPV (assumed that each time sensitivity analysis is performed only one utility is unbundled and the others remain with the Master SPV).
Figure 1.13: Sensitivity Analysis – unbundling of utilities
From the above, it may be observed that the unbundling of all utilities (except road) results in an increase in project IRR from 8.31% to 9.26%. The highest impact is in case of unbundling of water SPV or Power SPV, followed by rail SPV.
Unbundling infrastructure components may be possible given the fact that the demand build-up for individual utilities is sufficient in later years. Based on current projections, only SWM and power SPVs are analyzed to be viable as standalone SPVs. Other infra such as rail, road and water are not viable as standalone SPVs and fall
0.00%-0.60%
-0.29%-1.14%
-0.70%-1.33%
-2.13%-1.04%
-2.50% -2.00% -1.50% -1.00% -0.50% 0.00% 0.50%
Land offtake extended to 5 more years
Water tariff decreases by 10%
Land acquisition cost increases by 10%
Land lease price falls by 20%
Sensitivity in Equity IRR (Base - 8.76%)
0.34%-0.51%
-0.25%-0.93%
-0.55%-1.06%
-1.75%-0.85%
-2.00% -1.50% -1.00% -0.50% 0.00% 0.50%
Land offtake extended to 5 more years
Water tariff decreases by 10%
Land acquisition cost increases by 10%
Land lease price falls by 20%
Sensitivity in Project IRR (Base -8.31%)
-0.14%
2.14%
0.16%
-1.73%
0.95%
-2.00% -1.50% -1.00% -0.50% 0.00% 0.50% 1.00% 1.50% 2.00% 2.50%
Rail SPV Unbundled
Water SPV Unbundled
SWM SPV Unbundled
Power SPV Unbundled
All (except Road unbundled)
Unbundling of Utilities - Sensitivity on Project IRR
Final Report - Krishnapatnam Industrial Node Development Plan PwC/Nippon Koei 50

short of Equity IRR below market expectations (18%). Thus unbundling such components will require infusion of any additional government grant/ sub-ordinate loan etc (if applicable)
.Institutional and Financing Framework
Based on assessment of relevant acts for development of large industrial areas in India as elaborated above, a summary of learnings has been presented for CBIC to help formulate a robust institutional and financing structure for development of industrial nodes and the industrial corridor in its entirety. Incorporating these learnings and through extensive stakeholder consultations with DIPP, JICA, and relevant AP state government departments such as Dept. of Industries, Commerce & Export Promotion, Municipal Administration & Urban Development, the institutional framework for Krishnapatnam Node has been formulated.
Proposed Institutional structure for development of Krishnapatnam Node and CBIC in Andhra Pradesh Taking into key considerations the key learnings for CBIC and suggestions from GoAP, the following institutional structure has been proposed for Krishnapatnam Node:
Figure 1.14: Central level institutional structure for CBIC in Andhra Pradesh
The role of State Governments is critical at every stage of the node development starting with land acquisition, development of trunk infrastructure like power and water within the node, and executing critical external infrastructure projects for the success of the node. Given that it is the state government who will have to drive node and CBIC development in the state, strong commitment from the state is of utmost importance.
• Proposed National Industrial Corridor Development Authority (NICDA) to oversee all industrial corridor development in India including DMIC
• NICDA will act as a project development partner to all SPVs and State Government agencies for implementation of industrial cities/projects in the various industrial corridors
• CBIC corridor unit to be formed below NICDA • Key central agencies such as NHAI, Ministry of Shipping & Railway Board will be represented
on the NICDA Board. They may form special cells within each department to facilitate planning, implementing and monitoring of critical external infrastructure projects
• Monitoring cell comprising of PMO and Japan embassy to form the apex level monitoring body
Final Report - Krishnapatnam Industrial Node Development Plan PwC/Nippon Koei 51

Figure 1.15: State level institutional structure for CBIC in Andhra Pradesh
Finally, each component of the Corridor development has different implementing agencies, and competes with several projects. The National Industrial Corridor Development Authority (NICDA) would have the challenging task of coordinating across Central and State Government agencies to prioritise the corridor projects. There are lessons in the Early Bird Projects planned in DMIC, which faced challenges in bringing relevant stakeholders on board. Therefore it is recommended to have a “Corridor Projects’ Unit” in each line department in the State Governments. They would need adequate institutional capability and empowerment, and a separate budget. Such focused “Units”, in coordination with the NICDA, could provide the priority and impetus needed for the corridor and the nodes to be delivered in tandem.
Financing Framework Two options for financing framework have been considered for CBIC development in Andhra Pradesh. First option is similar to current practice in DMIC and incorporates recommendations of NICDA.
Final Report - Krishnapatnam Industrial Node Development Plan PwC/Nippon Koei 52
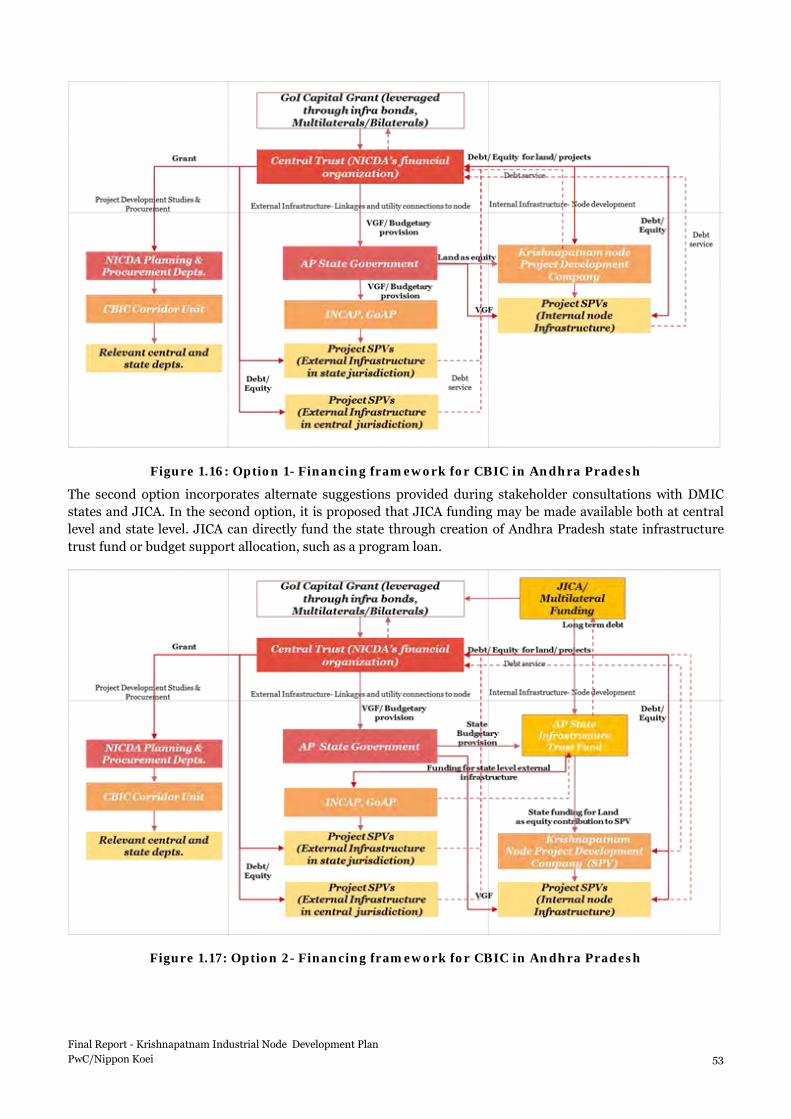
Figure 1.16: Option 1- Financing framework for CBIC in Andhra Pradesh The second option incorporates alternate suggestions provided during stakeholder consultations with DMIC states and JICA. In the second option, it is proposed that JICA funding may be made available both at central level and state level. JICA can directly fund the state through creation of Andhra Pradesh state infrastructure trust fund or budget support allocation, such as a program loan.
Figure 1.17: Option 2- Financing framework for CBIC in Andhra Pradesh
Final Report - Krishnapatnam Industrial Node Development Plan PwC/Nippon Koei 53

Investment Environment Improvement
Recommendation for Andhra Pradesh Government Andhra Pradesh has enhanced the investment environment through various policies and ranked high among the India states. However, the states still need to take policy –related action to improve the environments, especially in order to enhance the power supply capacity which is still behind the other states.
Table 1.29: Recommendation for Andhra Pradesh
Perspectives Detail of the Recommendations Infrastructure Promote systems like installation of smart metering systems and smart grid systems
Spread power saving awareness and set measures to achieve the purpose
Ensure rolling out road improvement/new road construction projects in order to connect proposed nodes to the main highways and ensure seamless connectivity. This will help taking forward the nodes development at higher speed
Land Acquisition/Building approval
Expand the information provided through the online system, such as the price, detailed description of the land, development status etc.
Enhance the usability of the online land information system by developing key factors, such as interface, functions, support process, software and tools
Promote the system to increase awareness across the states and boost the usage ratio
Establish submission manual for building plans to mitigate construction approval process
Skill Development
Collaborate with private sector and higher educational institute to enhance the curriculum, especially to develop sector specific curriculum, which can be fully utilized right after the course completion to increase number of qualified workforce
Vocational training institutes in collaboration with private educational group and industry should be also proposed, since the majority of employment is expected to be skilled (engineering, management graduates) and also semi-skilled.
Collaboration between a private institution, government and industrial units should be in line with newly introduced Industrial Development Policy of AP 2015-20)
Business Process Further empower the authority of the mechanism to be more comprehensive and govern the process over the various department as one agency
Increase the functions of the transparent system to help investors monitor and track the application status online and assure single window mechanism until the approval and during the operational stage (not only at the application stage but also during the following up stage)
Develop skills to deal with IT and computer for implementation of the single window system
Industrial park/Cluster
Establish detailed industrial park guideline on the key factors such as base infrastructure, environment standard, minimum level operation standard, and maintenance operation based on the private sectors’ needs and strengthen its enforcement with empowered authority institutionally and financially with self- governance system.
Create an annual plan on the budget and for cluster’s sustainable development
Collaborate with the private sector to develop higher level of infrastructure service that can meet the demand of the foreign companies
Provide customized fiscal incentives for primary industrial sectors
Fiscal incentives can be proposed for MSMEs, which are primarily in the engineering sector. This will help building the necessary vendor base in the node where major output is expected to come from engineering sector. Such sectors as electrical machinery, machinery, automobiles require presence of large vendor base in the immediate proximity. Hence, such incentives can be proposed.
Way forward The following activities need to be undertaken by the Government of Andhra Pradesh (GoAP) for moving project towards implementation of Krishnapatnam Node.
Final Report - Krishnapatnam Industrial Node Development Plan PwC/Nippon Koei 54

Legal/Regulatory Framework
Basic legal/regulatory framework needs to be developed and enacted.
a) Declaration of Industrial Township of the proposed Krishnapatnam node as aligned to Article 243Q
b) Review of samples of State Support Agreement (SSA) and Share Holder Agreement (SHA) and starting a dialogue with DIPP to discuss and sign the agreements
− Need to identify the role and responsibilities of each stakeholder, i.e. NICDA, State, and private sector
Institutional Framework
Based on the legal/regulatory framework, details of roles and responsibilities among central and state governments, and private sectors, setting up necessary organizations and building organization structure, hiring appropriate human resource will be required.
a) Issue of Government Order for Establishment of Institutional Structure as agreed by GoAP
b) Setting up Development Authority which will assume the role of the municipal body for the node
c) KPIL representation in node development SPV needs to be decided
d) Setting up a node development SPV
e) Developing a framework on the involvement of additional private sector to the node and infrastructure development
− Set up a strategy to have effective involvement of private sector − Conduct market soundings with potential private developers − Develop action plan and road map
f) Establishment of Program Management Unit within [APIIC or an appropriate organization] as a
transition unit to lead coordination with Central Govt and State Govt Agencies and facilitate the implementation of the role of State under SSA and SHA
Financial Framework
Since the node development includes the large area development and various infrastructure developments, an integrated financial strategy will be required.
a) Prioritizing node and infrastructure development projects
b) Development of a funding plan considering economic and financial implication of prioritized projects on competitiveness of the node
c) Identification of alternatives on funding source including own budget, funds from central government, donor support funding (a project specific loan, a budget support loan) etc.
d) Developing necessary monitoring mechanism of project progress
Operation
Following steps will be required for physical node development and improvement of soft infrastructure.
a) EIA (to be initiated by DIPP)
b) Land assessment of the node to identify the details of necessary land development work
Final Report - Krishnapatnam Industrial Node Development Plan PwC/Nippon Koei 55
c) Preparation for land acquisition plan for the part of land which is not owned by GoAP currently within
Master Plan Area so as to avoid the higher acquisition price due to speculation
d) Identification and preparation of priority projects under State responsibility
e) Developing a framework to implement necessary steps in response to recommendation on investment environment improvement including assurance of infrastructure services, supply of skilled labour, streamlining of business process etc.
•
Final Report - Krishnapatnam Industrial Node Development Plan PwC/Nippon Koei 56

2 Introduction
2.1 Context of Industrial Corridors for Sustainable Growth
The need to raise the global competitiveness of the Indian manufacturing sector is imperative for the country’s long term-growth. Government of India (GoI) envisages manufacturing sector is key economic driver which contributes to its GDP growth and creation of additional employment opportunities. In the past 10 years, Indian manufacturing has grown at an average rate of 7.3%.
National Manufacturing Policy is a prominent initiative taken by GoI for development of manufacturing sector.
Figure 2.1: Vision and Objective of National Manufacturing Policy
Looking back at the trend of some fast growing emerging economies in the past 10 years, it seems that these countries inherently have strong manufacturing presence. Economies like Thailand, Indonesia and Malaysia have increased their manufacturing GDP contribution by 15-21% in the past 45 years. The challenge for India is to achieving that in much shorter time frame as compared to 45 years.
Source: World Bank Statistics Figure 2.2: Trend in manufacturing contribution to GDP across developing countries
Given the concern about the stagnant and low share of manufacturing sector in India’s GDP, the national Manufacturing Policy was framed with a view to accelerated development, inclusive growth and provision of
Increase manufacturing sector growth to 12-14% over the medium term
Create 100 million additional jobs by 2022Create appropriate skill sets among rural migrant and urban poorIncrease domestic value addition and technological depthEnhance global competitiveness through policy support
Ensure sustainability of growth
DIPP’s Vision -National
Manufacturing Policy
Objectives of the Policy
Increase share of manufacturing in GDP from 16% to 25% by 2022
Final Report - Krishnapatnam Industrial Node Development Plan PwC/Nippon Koei 57

gainful employment2. Realisation of primary objectives of the policy, such as increasing manufacturing sector growth to 12-14% over the medium term, enhancing share of manufacturing in GDP from 16-25% and increasing the rate of job creation in manufacturing to 100 million additional jobs by 2022, is envisioned through measures such as business process simplification, industrial training and skill up- gradation, and most importantly by large- scale clustering and aggregation of industrial units.
Furthermore, GoI has recently come up with a national programme, “Make-In-India” to promote manufacturing sector in a comprehensive manner. The program aims to facilitate investment, foster innovation, enhance skill development, protect intellectual property, and build best-in-class manufacturing infrastructure. On the other hand, contribution of manufacturing sector to overall GDP in India is still lower as compared to that of fast developing economies in the region like Thailand, China, Indonesia and Malaysia.
Thus, what is seen is that at the national level, there is clearly an opportunity to steer industrial corridor development in a collective & coordinated fashion.
Figure 2.3: Industrial Corridor Development Projects
In the state level in Karnataka, there is an opportunity for aligning industrial development with national targets with the right set of critical projects that enable attainment of the collective vision; thereby necessitating the need for induced cooperation between stakeholders at the national & state levels. The strategy to develop the Chennai-Bengaluru Industrial Corridor (CBIC) is aligned to this plan to achieve accelerated development and regional industry agglomeration in the states of Tamil Nadu, Karnataka and Andhra Pradesh.
2.2 Objective of the Study Joint Statement between Government of Japan (GoJ) and Government of India (GoI) in December 2011 emphasized the importance of hard and soft infrastructure at Chennai-Bengaluru area, and Japan offered to provide with financial and technical support for the preparation of the comprehensive master plan for this area.
Based on the request from GOI to formulate “Infrastructure Development Program for Chennai-Bengaluru Industrial Corridor” (the Program), GOI and JICA agreed to develop “Comprehensive Regional Perspective Plan for Chennai-Bengaluru Industrial Corridor Region,” (the Perspective Plan) in May 2013.
In addition to the development of the Perspective Plan, the Program consists of: (i) feasibility studies for prioritized infrastructure projects; (ii) development of infrastructure; (iii) technical assistance for performance improvement support.
JICA study was conducted in consultation with related stakeholders with the following objectives:
2 Excerpts from National Manufacturing Policy, Annex to Press Note 2 (2011 series)
1 2
3 4
1: Delhi Mumbai Industrial Corridor 3: Chennai- Vizag- Kolkata 2: Amritsar- Delhi- Kolkata 4: Chennai- Bengaluru & Bengaluru- Mumbai
Final Report - Krishnapatnam Industrial Node Development Plan PwC/Nippon Koei 58

To prepare a Comprehensive Regional Perspective Plan for the Chennai-Bengaluru Industrial Corridor Region, along with developing Strategy for transforming the region into a globally competitive investment destination
Identify suitable nodes to be taken up for industrial development within the project influence area (states of Karnataka, Andhra Pradesh and Tamil Nadu) and prepare Master Plan and Development Plan for at least two selected Industrial nodes (amongst the various nodes identified under the study)
The scope of work is divided to two parts, Part A and Part B which correlate to the study objectives. Part A aimed to prepare comprehensive regional perspective plan for CBIC region, which was conducted during October 2013-June 2014. The main steps include (i) defining the delineation of the Corridor; (ii) reviewing industry and infrastructure; (iii) shortlisting of nodes; and (iv) developing a comprehensive regional plan. After the completion of Part A, GoJ and GoI selected three nodes for the further study under Part B, namely Ponneri in Tamil Nadu, Tumakuru in Karnataka, and Krishnapatnam in Andhra Pradesh.
Figure 2.4: Study Framework
2.3 Selection of Nodes One of the objectives for the JICA CBIC study is to identify suitable nodes to be taken up for industrial development within the CBIC area.
As per the discussions undertaken with the respective state governments to understand their broad views on land availability and suitability of potential zones, the following locations have been suggested as the proposed destinations for industrial nodes.
Spanning over a length of 560 km, the CBIC covers an area of about 91,000 sq. km (about 3% of area of all of India) covering around 17 districts in the three states of Tamil Nadu, Karnataka and Andhra Pradesh under its influence area.
Identified nodes for industrial development along CBIC, range between 25- 70 sq. km, and are comparable to the size and functioning of satellite cities such Cyberabad (A.P) and Kengeri (Karnataka), complete with all municipal functions
The above potential zones (including other surrounding / neighboring areas in the states) have been further analyzed using a set of important factors reflecting key attributes such as:
• Presence of existing city development plans / urban master plans
• Distribution of existing industrial development
Comprehensive Regional Perspective Plan for the CBIC region Strategy for transforming the region into a globally competitive investment destination Identification of suitable nodes
Master Plan and Development Plan for 3 nodes
Part A Part B
Target year:
Target Area:
20 years (2014-2033)
States of Karnataka, Andhra Pradesh and Tamil Nadu, along the corridor between Chennai-Bengaluru-Chitradurga spanning around 560 km (linear length)
Final Report - Krishnapatnam Industrial Node Development Plan PwC/Nippon Koei 59

• Accessibility to regional trunk road infrastructure
• Proposed land acquisition plans for future industrial development
Based on the above analysis, the potential broad zones were classified into two categories:
Category A: High priority regions with the potential to provide faster return on investments
Category B: Regions with low potential to provide faster return on investments
For the Category A area, further analyses at Sub-District level were conducted with a set of eight assessment criteria that includes the following:
• Accessibility to regional trunk roads
• Existence of protected/restricted areas
• Government land availability and availability of proposed industrial development areas
• Water availability
• Assessment of urban planning strategy
• Existing and planned industrial areas
• Accessibility to major transport facilities (port and airport)
• Accessibility to electricity network
According to the information as previously mentioned, additional information of eight shortlisted nodes were provided to JICA and three nodes are recommended for the master plan and development plan study to be implemented under Part B.
Final Report - Krishnapatnam Industrial Node Development Plan PwC/Nippon Koei 60

Figure 2.5: Nodes selected for CBIC including three nodes selected for Master plan development
Selection of Krishnapatnam Node
Krishnapatnam Industrial Node (KPT IN) is located in the south of Nellore District and has been identified as a high development potential area since it is close to Krishnapatnam port. A trunk road network (access road from NH-5) and railway connectivity have already been developed by Krishnapatnam Port Company limited. As the proposed node is near the port, it will also enjoy significant benefit from the port for industrial purposes. Additionally, KPCT has plans to develop plant facilities (power plant, water treatment plant and waste water plant) near this area, and it is expected to provide stable operational environment for the factories in the future.
2.4 Approach & Methodology A concept master plan and development plan for three nodes in about 10-12 months and consist of the following key modules / stages for the three selected nodes.
Figure 2.6: Study Framework
Identify possible development area and delineation of nodes
Conduct market potential and critical gap assessment study of industries and infrastructure
Evolve concept master plan with block cost estimates
Prepare development plan for the industrial node
Recommendation of suitable institutional structure for the node
1
2
3
Final Report - Krishnapatnam Industrial Node Development Plan PwC/Nippon Koei 61

2.4.1 Approach for analysis of Traditional and Potential Sectors
An in depth analysis for identifying potential industries for the corridor was undertaken as a part of Interim Report I. The parameters used for the analysis is as indicated in the figure below.
Figure 2.7: Parameters used for short-listing of potential sector in the corridor
Global industrial analysis
Policy level analysis
National and state industrial
analysis
Corridor level industrial analysis
Upcoming industry sub-segments
analysis
• Global trade analysis (analysis of commodities)
• Cross border transactions
• Foreign Direct Investment
• National level manufacturing policy
• FDI Policy
• Foreign trade policy
• State level industrial policies
• Investment–completed and upcoming
• Performance of the sector (Contribution to GDP and project growth)
• FDI analysis• IEM analysis• Trade
performance (Export and Import)
• State’s contribution to national output
• Analysis of industries in the corridor
• MSME’s in the corridor
• Key companies in the region
• Projected growth rate globally till 2020
• Projected growth rate in India till 2020
• Size of the sector globally and in India
Final Report - Krishnapatnam Industrial Node Development Plan PwC/Nippon Koei 62

As per the analysis undertaken, the following sectors are the key drivers of industrial growth in the CBIC region;
Figure 2.8: Industry Sectors to be promoted within the corridor
2.4.2 Approach for Infrastructure Development for the Node The necessary infrastructure support will induce private participation in node development and encourage creating world class industrial node which will enable to attract companies producing high value products or to support producing higher value added products. The increase in value added would contribute to increase competitiveness of the industrial cluster at the region and lead to further increase in private sectors development to the region.
Figure 2.9: Public Private Partnership in Node Development
TOP SECTORS
Food processing Electronics
Automobiles Textiles
Chemicals and petrochemicals Pharmaceuticals
Metallurgical industries Electrical machinery
Machinery Medical equipment
Master Plan development and support in hard/soft infrastructure by public sector
Final Report - Krishnapatnam Industrial Node Development Plan PwC/Nippon Koei 63
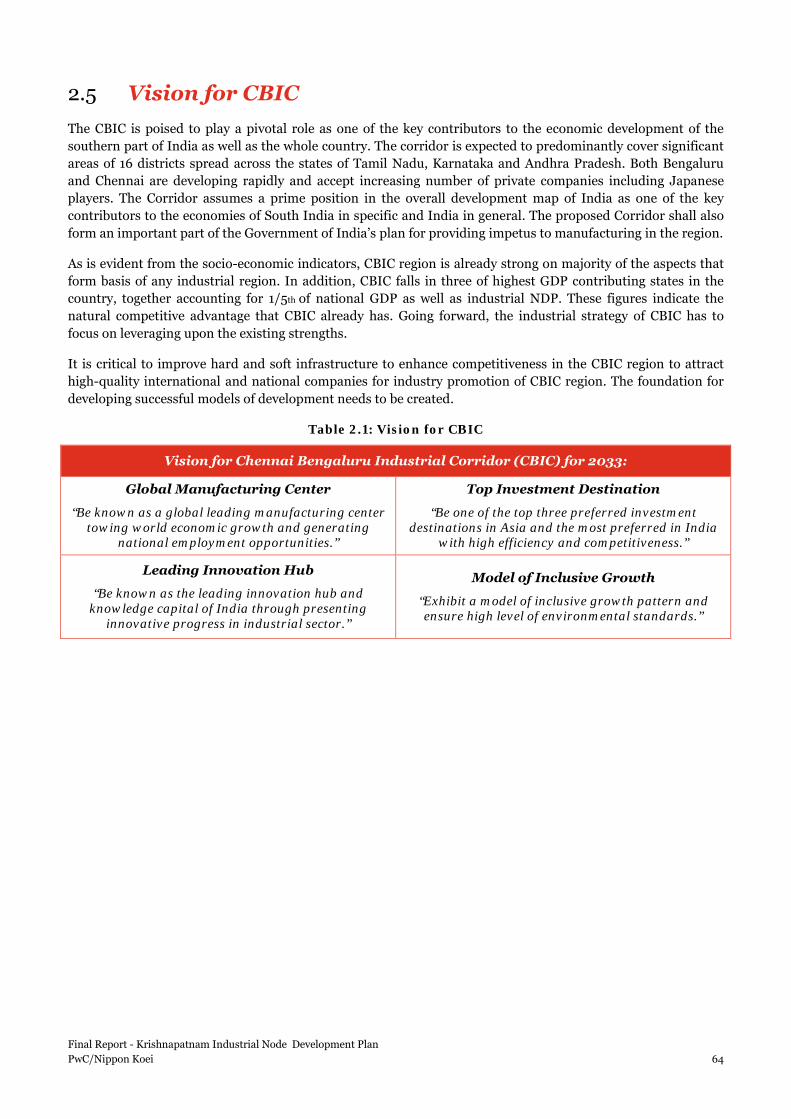
2.5 Vision for CBIC The CBIC is poised to play a pivotal role as one of the key contributors to the economic development of the southern part of India as well as the whole country. The corridor is expected to predominantly cover significant areas of 16 districts spread across the states of Tamil Nadu, Karnataka and Andhra Pradesh. Both Bengaluru and Chennai are developing rapidly and accept increasing number of private companies including Japanese players. The Corridor assumes a prime position in the overall development map of India as one of the key contributors to the economies of South India in specific and India in general. The proposed Corridor shall also form an important part of the Government of India’s plan for providing impetus to manufacturing in the region.
As is evident from the socio-economic indicators, CBIC region is already strong on majority of the aspects that form basis of any industrial region. In addition, CBIC falls in three of highest GDP contributing states in the country, together accounting for 1/5th of national GDP as well as industrial NDP. These figures indicate the natural competitive advantage that CBIC already has. Going forward, the industrial strategy of CBIC has to focus on leveraging upon the existing strengths.
It is critical to improve hard and soft infrastructure to enhance competitiveness in the CBIC region to attract high-quality international and national companies for industry promotion of CBIC region. The foundation for developing successful models of development needs to be created.
Table 2.1: Vision for CBIC
Vision for Chennai Bengaluru Industrial Corridor (CBIC) for 2033:
Global Manufacturing Center
“Be known as a global leading manufacturing center towing world economic growth and generating
national employment opportunities.”
Top Investment Destination
“Be one of the top three preferred investment destinations in Asia and the most preferred in India
with high efficiency and competitiveness.”
Leading Innovation Hub
“Be known as the leading innovation hub and knowledge capital of India through presenting
innovative progress in industrial sector.”
Model of Inclusive Growth
“Exhibit a model of inclusive growth pattern and ensure high level of environmental standards.”
Final Report - Krishnapatnam Industrial Node Development Plan PwC/Nippon Koei 64

2.6 Coverage of Final Report Final Report (FR) covers the critical gap assessment between industry development scenario and infrastructure and block cost estimates along with concept master plan and development plan of each node. Suitable institutional framework for the development of CBIC region will be analyzed and discussed.The main contents of the final report are summarized in the table below.
• Overview of Nellore District and Vision for the Node including the socio-economic profile of the district
• Analysis of Traditional and Potential Industrial Sectors for Krishnapatnam including benchmarking against the global best practices in the industry and key policy implications
• Land Use Plan for the selected Industrial node with detailed land use and precise details of activity
zones, industrial and infrastructure facilities, detailed development control, regulations, etc.
• Infrastructure Development Plan for the Node including the plan for roads, water supply, power, railway connectivity, logistics and civic infrastructure.
Final Report - Krishnapatnam Industrial Node Development Plan PwC/Nippon Koei 65

3 Overview of Nellore District and Krishnapatnam Industrial Node
3.1 Regional Assessment of Krishnapatnam Area Krishnapatnam node (KPT IN) is located in the south of Nellore District and has been identified as an area with high development potential since it is close to Krishnapatnam port. Trunk road access from NH-5 and railway connectivity for the port have already been developed by Krishnapatnam Port Company limited; industries developed at the proposed node will enjoy significant benefits from the port and the transport infrastructure.
The access from NH-5 is currently a 4-lane road; however Krishnapatnam Port Company Ltd (KPCL) is planning to widen this to 6-lanes to satisfy future road demand.
Additionally, Naidupeta SEZ and Sri City are also located along NH-5. These areas, along with the proposed node and the cluster of developments around the urban core of Nellore city are expected to contribute to the further development of the south of Nellore District.
Table 3.1: Overview of the Krishnapatnam Area
Particular Description
District/ State • Nellore district/ Andhra Pradesh state
Distance from Metropolitan/major city
• 170 km from Chennai city centre along NH-5 and the access road to Krishnapatnam port
• 40 km from Nellore city
Accessibility to trunk road network
• 20 km from NH-5, however no direct access from the national highway (only via Krishnapatnam Port)
• 90 km from Tirupati airport
Accessibility to railway network • Railway access connects Krishnapatnam port
to the mainline; however no railway access to the node area so far
Accessibility to major transport facilities (port, airport) • 10 km from Krishnapatnam port
Major industrial locations in the surrounding area
• 80 km from the proposed SEZ at Naidupeta on NH-5
• 130 km from Sri City on NH-5
Source: JICA Study Team
Final Report - Krishnapatnam Industrial Node Development Plan PwC/Nippon Koei 66

Source: JICA Study Team
Figure 3.1: Infrastructure map of Krishnapatnam
Most of the sub-districts in the south of Nellore District have a low population density (less than 200 people /sq.km). Only Nellore sub-district, which includes the district capital Nellore, has a density higher than 1,000 people /sq.km. The node area is 40 km away from Nellore.
Source: JICA Study Team
Figure 3.2: Population density in 2013 of Krishnapatnam and the surrounding area
As mentioned above, Nellore city is the most populous city near the node which has the potential to provide skilled and unskilled labour to industrial areas nearby. In addition to Krishnapatnam Node, Sri City and the proposed Naidupeta SEZ, also located along NH-5, are expected to be developed as a core of urban/industrial development, and therefore these cluster developments have to be linked together to enhance the future growth of this area. The concept of cluster developments in the Nellore area is illustrated below:
Naidupeta
Sri city
Nellore
Final Report - Krishnapatnam Industrial Node Development Plan PwC/Nippon Koei 67

Source: JICA Study Team
Figure 3.3: Cluster development of South Nellore
As shown in the above figure, an access road from Naidupeta to Krishnapatnam node will be proposed. This will reduce distance and time for freight movements and will also improve connectivity to Bengaluru.
In this section economic and social profile of the adjourning areas of the Node and the Node (Nellore district with focus on 50-100 km radius from the Node) will be analyzed. The section will also cover major industrial hubs/clusters and status of industrial infrastructure at the state level and located in adjoining areas to KPT IN.
Final Report - Krishnapatnam Industrial Node Development Plan PwC/Nippon Koei 68

3.2 Socio-Economic Profile of Nellore District
3.2.1 Vital Social Characteristics Nellore district is lower than state and national average on urbanization levels. Population of Nellore district is 2,966,082 as per Census 2011 data, out of which 1,493,254 (50.3%) are males and 1,472,828 (49.7%) are females. Its share in total population of Andhra Pradesh3 is 3.5%. Density of population is relatively low – 227 persons per sq. km – if compared with Andhra Pradesh (308 persons per sq. km) and India (382 persons per sq. km).
Literacy rate in the district is higher than in overall Andhra Pradesh, but below national average. Nellore district is not urbanized; its urbanization level is lower than AP’s average and event below national average level. Number of towns is about 3% of total towns in Andhra Pradesh, villages amount to more than 4% of total villages in the state.
Source: Census 2011, Statistical abstract of Andhra Pradesh, 2012, DES, GoAP, PwC analysis
Figure 3.4: Demographic profile of Nellore district
3.2.2 Employment Majority of population is engaged in agricultural sector; need to increase employment opportunities in manufacturing sector Employable population (15-59 years) in Nellore district was 1,939,521 in 2011, which is 4% of total employable population of Andhra Pradesh.
Share of employable population in total population in Nellore district is 65%, higher than the same in Andhra Pradesh. However, share of workers in total employable population in Nellore district is lower (68%) than in Andhra Pradesh (73%).
3 Andhra Pradesh before bifurcation is considered for population related analysis
Final Report - Krishnapatnam Industrial Node Development Plan PwC/Nippon Koei 69
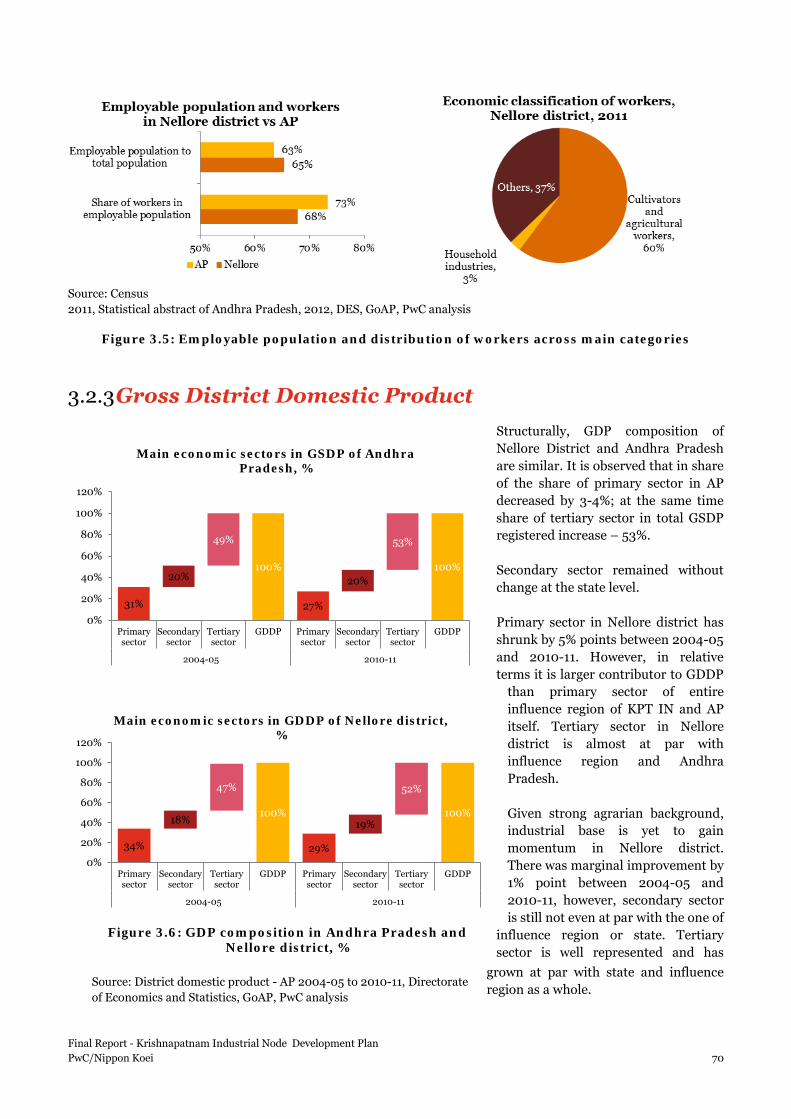
Source: District domestic product - AP 2004-05 to 2010-11, Directorate of Economics and Statistics, GoAP, PwC analysis
Source: Census 2011, Statistical abstract of Andhra Pradesh, 2012, DES, GoAP, PwC analysis
Figure 3.5: Employable population and distribution of workers across main categories
3.2.3 Gross District Domestic Product Structurally, GDP composition of Nellore District and Andhra Pradesh are similar. It is observed that in share of the share of primary sector in AP decreased by 3-4%; at the same time share of tertiary sector in total GSDP registered increase – 53%. Secondary sector remained without change at the state level. Primary sector in Nellore district has shrunk by 5% points between 2004-05 and 2010-11. However, in relative terms it is larger contributor to GDDP
than primary sector of entire influence region of KPT IN and AP itself. Tertiary sector in Nellore district is almost at par with influence region and Andhra Pradesh. Given strong agrarian background, industrial base is yet to gain momentum in Nellore district. There was marginal improvement by 1% point between 2004-05 and 2010-11, however, secondary sector is still not even at par with the one of
influence region or state. Tertiary sector is well represented and has
grown at par with state and influence region as a whole.
Figure 3.6: GDP composition in Andhra Pradesh and Nellore district, %
31%
100%
27%
100%20% 20%
49% 53%
0%
20%
40%
60%
80%
100%
120%
Primarysector
Secondarysector
Tertiarysector
GDDP Primarysector
Secondarysector
Tertiarysector
GDDP
2004-05 2010-11
Main economic sectors in GSDP of Andhra Pradesh, %
34%
100%
29%
100%18% 19%
47% 52%
0%
20%
40%
60%
80%
100%
120%
Primarysector
Secondarysector
Tertiarysector
GDDP Primarysector
Secondarysector
Tertiarysector
GDDP
2004-05 2010-11
Main economic sectors in GDDP of Nellore district, %
Final Report - Krishnapatnam Industrial Node Development Plan PwC/Nippon Koei 70
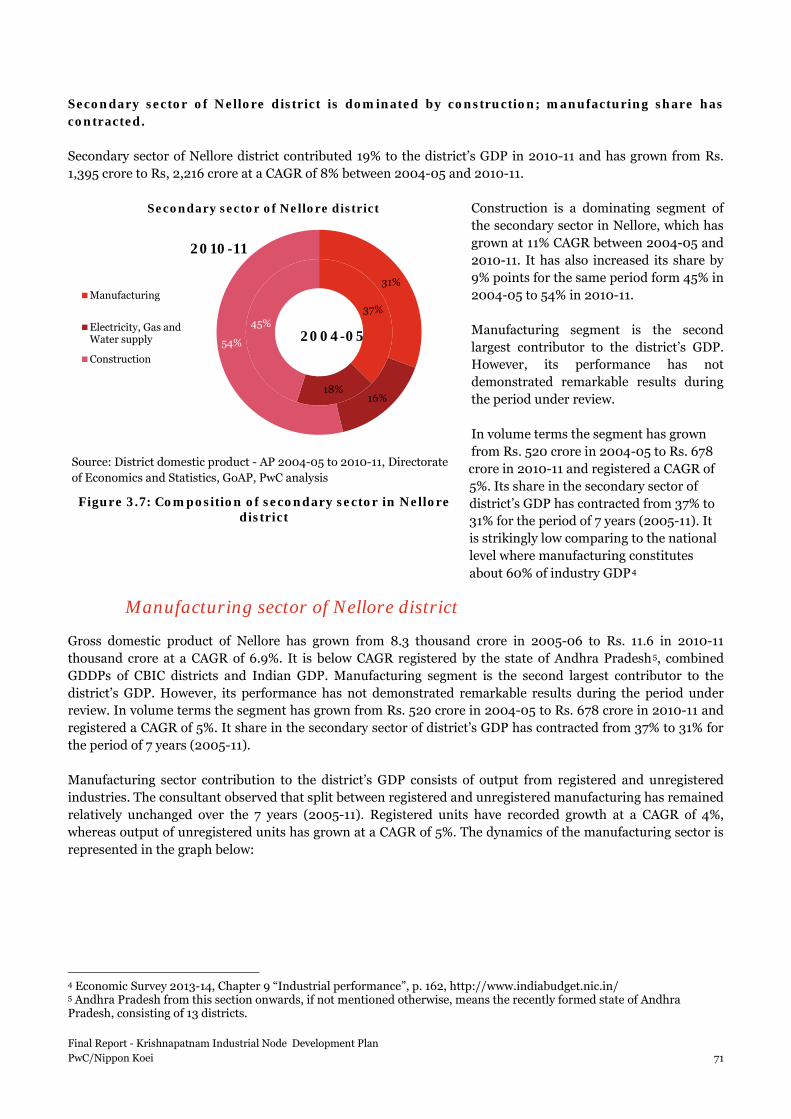
Source: District domestic product - AP 2004-05 to 2010-11, Directorate of Economics and Statistics, GoAP, PwC analysis
Secondary sector of Nellore district is dominated by construction; manufacturing share has contracted. Secondary sector of Nellore district contributed 19% to the district’s GDP in 2010-11 and has grown from Rs. 1,395 crore to Rs, 2,216 crore at a CAGR of 8% between 2004-05 and 2010-11.
Construction is a dominating segment of the secondary sector in Nellore, which has grown at 11% CAGR between 2004-05 and 2010-11. It has also increased its share by 9% points for the same period form 45% in 2004-05 to 54% in 2010-11. Manufacturing segment is the second largest contributor to the district’s GDP. However, its performance has not demonstrated remarkable results during the period under review. In volume terms the segment has grown from Rs. 520 crore in 2004-05 to Rs. 678 crore in 2010-11 and registered a CAGR of 5%. Its share in the secondary sector of district’s GDP has contracted from 37% to 31% for the period of 7 years (2005-11). It is strikingly low comparing to the national level where manufacturing constitutes about 60% of industry GDP4
Manufacturing sector of Nellore district
Gross domestic product of Nellore has grown from 8.3 thousand crore in 2005-06 to Rs. 11.6 in 2010-11 thousand crore at a CAGR of 6.9%. It is below CAGR registered by the state of Andhra Pradesh5, combined GDDPs of CBIC districts and Indian GDP. Manufacturing segment is the second largest contributor to the district’s GDP. However, its performance has not demonstrated remarkable results during the period under review. In volume terms the segment has grown from Rs. 520 crore in 2004-05 to Rs. 678 crore in 2010-11 and registered a CAGR of 5%. It share in the secondary sector of district’s GDP has contracted from 37% to 31% for the period of 7 years (2005-11). Manufacturing sector contribution to the district’s GDP consists of output from registered and unregistered industries. The consultant observed that split between registered and unregistered manufacturing has remained relatively unchanged over the 7 years (2005-11). Registered units have recorded growth at a CAGR of 4%, whereas output of unregistered units has grown at a CAGR of 5%. The dynamics of the manufacturing sector is represented in the graph below:
4 Economic Survey 2013-14, Chapter 9 “Industrial performance”, p. 162, http://www.indiabudget.nic.in/ 5 Andhra Pradesh from this section onwards, if not mentioned otherwise, means the recently formed state of Andhra Pradesh, consisting of 13 districts.
Figure 3.7: Composition of secondary sector in Nellore district
37%
18%
45%
31%
16%
54%
Secondary sector of Nellore district
Manufacturing
Electricity, Gas andWater supply
Construction
2004-05
2010-11
Final Report - Krishnapatnam Industrial Node Development Plan PwC/Nippon Koei 71

Source: District domestic product - AP 2004-05 to 2010-11, Directorate of Economics and Statistics, GoAP
Figure 3.8: GDP at constant 2004-05 prices, Nellore district vs CBIC districts, Andhra Pradesh and India
Analysis of large segments of GDP of Nellore district reveals that Manufacturing is a very modest player – only 6% contribution to GDDP by 2010-11. Among major economic segments its growth rate was also one of the lowest, which influenced outpaced performance of Nellore district compared to growth of AP state and India as a whole.
Source: District domestic product - AP 2004-05 to 2010-11, Directorate of Economics and Statistics, GoAP, PwC analysis
Figure 3.9: Major components of GDDP of Nellore district
The total manufacturing output of Nellore is around Rs, 678 crore out of which only Rs. 250 crore of output comes from registered manufacturing units.
6.9%8.0%
10.4%
8.6%
0.0%
2.0%
4.0%
6.0%
8.0%
10.0%
12.0%
-
1,000.0
2,000.0
3,000.0
4,000.0
5,000.0
6,000.0
Nellore district Andhra Pradesh CBIC districts India
Gross Domestic Product (constant prices 2004-05), Rs. thousand crore
2005-06 2007-08 2010-11
47%
34%
12%7%
0.1%
52%
28%
13%
6%1%
9%
4%
10%
5%
36%
0%
5%
10%
15%
20%
25%
30%
35%
40%
0%
10%
20%
30%
40%
50%
60%
Services Agriculture and allied Electricity, Gas,Watersupply and
Construction
Manufacturing Mining
Breakup of GDDP of Nellore district
2004-05 2010-11 CAGR
Final Report - Krishnapatnam Industrial Node Development Plan PwC/Nippon Koei 72

Source: District domestic product - AP 2004-05 to 2010-11, Directorate of Economics and Statistics, GoAP, PwC analysis
Figure 3.10: Composition of manufacturing sector of Nellore district
Majority of employees are engaged in low value adding non-engineering sectors. 82% of employment in registered sector in Nellore district is concentrated in 3 sectors: leather (35%), food processing (31%), basic metals (16%). These sectors are characterised by low value addition in their final output. Number of employees engaged in in engineering sectors is very low.
Source: ASI, Nellore district, 2010-11
Figure 3.11: Distribution of employees in registered sector
3.2.4 Per Capita Income Per capita income in Nellore district has increased from Rs. 24,959 in 2004-05 t0 Rs. 35,939 in 2010-11 and has grown at a CAGR of 6.3%.
201 230 181
360 208 233 256
318 343
366
388
395 409 422
520 573 547
748
603 642
678
-
100
200
300
400
500
600
700
800
2004-05 2005-06 2006-07 2007-08 2008-09 2009-10 2010-11
Manufacturing sector in Nellore district
Registered Un-registered Total Manufacturing
7,875 6,870
3,641
796 756 682 645 410 288 110 88 80 52 32 -
2,000 4,000 6,000 8,000
10,000
Leat
her
Food
pro
duct
s
Bas
ic m
etal
s
Ele
ctri
cal
equi
pmen
t
Che
mic
als
and
petr
oche
m
Non
-met
alic
min
eral
s
Text
iles
and
appa
rel
Phar
mac
euti
cals
Woo
d pr
oduc
tsan
d fu
rnit
ure
Pape
r an
d pa
per
prod
ucts
Mac
hine
ry
Toba
cco
Bev
erag
es
Prin
ting
Sectorwise distribution of employees in registered sector, Nellore district, numbers
82% of employees are in low value adding sectors
Final Report - Krishnapatnam Industrial Node Development Plan PwC/Nippon Koei 73

Source: District domestic product - AP 2004-05 to 2010-11, Directorate of Economics and Statistics, GoAP, PwC analysis
Figure 3.12: Per capita income of Nellore district vs Andhra Pradesh and India
Per capita income of Nellore district is below of per capita income of Andhra Pradesh and national estimates both in terms of actual amount and growth percentage. It is on account of large primary sector and underdeveloped manufacturing sector, engagement of majority of registered employees in low value adding segments of manufacturing sector.
3.2.5 Foreign Direct Investment Break-up of FDI inflows (cumulative as on December 2012) reveals that Andhra Pradesh received the highest inflow in construction and power project (36% of total cumulative FDI inflows of the state). Power sector in Andhra Pradesh alone received more than 15% of the national cumulative FDI in power projects.
Other sectors that are prominent FDI recipients are services sector (10%), drugs and pharma (6%), computer hardware and software (5%) and metallurgical industries (4%).
Nellore has strong base of metallurgy and construction linked companies; and this can be leveraged for attracting FDI in future
Source: SIA NEWSLETTER - ANNUAL ISSUE, 2012, DIPP
24,959 25,204 24,143
35,939 36,798 36,342
6.3%
6.5% 6.5%
6.1%
6.2%
6.2%
6.3%
6.3%
6.4%
6.4%
6.5%
6.5%
6.6%
-
5,000
10,000
15,000
20,000
25,000
30,000
35,000
40,000
Nellore Andhra Pradesh India
Per capita income at constant prices (2004-05), Rs., and CAGR in Nellore district and AP
2004-05 2010-11 CAGR
Figure 3.13: Cumulative FDI in AP sector wise
Services sector
781 10%
Metallurgical Industries
344 4%
Drugs and
pharma461 6%
Construction development
1,540 20%
Computer hardware
and software378 5%
Power1,192 16%
Hotel and Tourism148.01
2%Others2,820 37%
Sectorwise break-up of cumulative investments in AP (cumulative as on
Dec 2012)
Final Report - Krishnapatnam Industrial Node Development Plan PwC/Nippon Koei 74
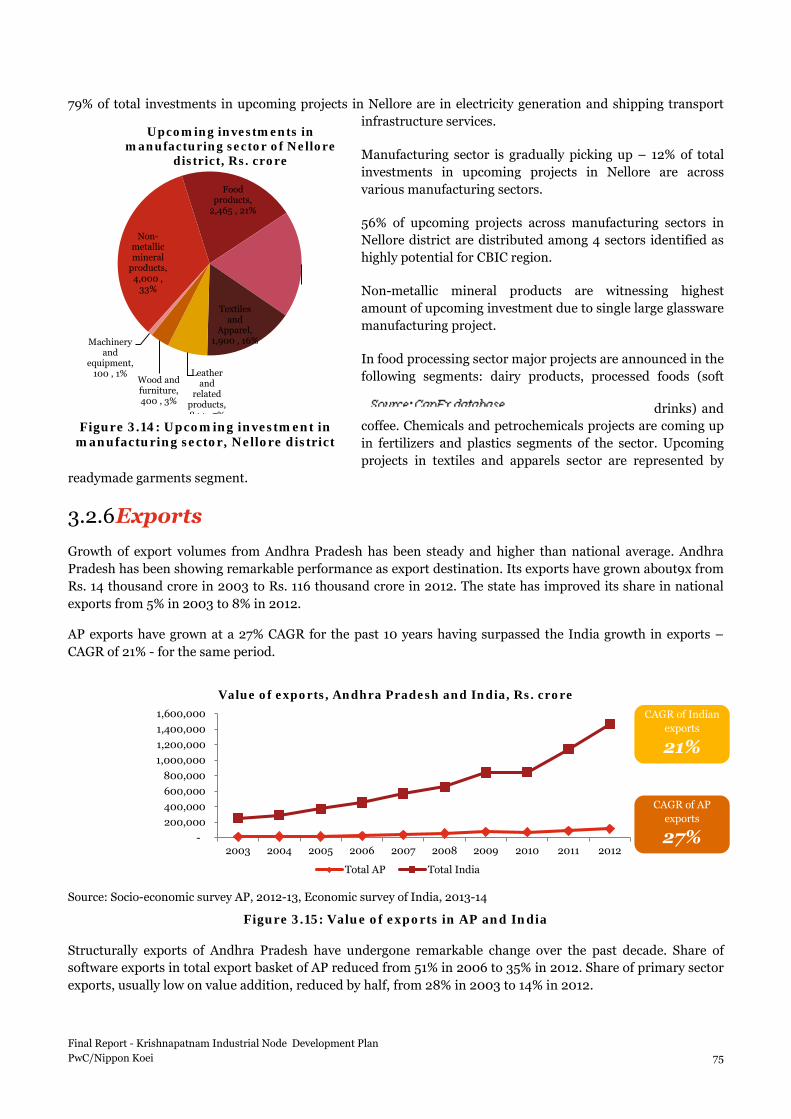
79% of total investments in upcoming projects in Nellore are in electricity generation and shipping transport infrastructure services.
Manufacturing sector is gradually picking up – 12% of total investments in upcoming projects in Nellore are across various manufacturing sectors.
56% of upcoming projects across manufacturing sectors in Nellore district are distributed among 4 sectors identified as highly potential for CBIC region.
Non-metallic mineral products are witnessing highest amount of upcoming investment due to single large glassware manufacturing project.
In food processing sector major projects are announced in the following segments: dairy products, processed foods (soft
drinks) and coffee. Chemicals and petrochemicals projects are coming up in fertilizers and plastics segments of the sector. Upcoming projects in textiles and apparels sector are represented by
readymade garments segment.
3.2.6 Exports Growth of export volumes from Andhra Pradesh has been steady and higher than national average. Andhra Pradesh has been showing remarkable performance as export destination. Its exports have grown about9x from Rs. 14 thousand crore in 2003 to Rs. 116 thousand crore in 2012. The state has improved its share in national exports from 5% in 2003 to 8% in 2012.
AP exports have grown at a 27% CAGR for the past 10 years having surpassed the India growth in exports – CAGR of 21% - for the same period.
Source: Socio-economic survey AP, 2012-13, Economic survey of India, 2013-14
Figure 3.15: Value of exports in AP and India
Structurally exports of Andhra Pradesh have undergone remarkable change over the past decade. Share of software exports in total export basket of AP reduced from 51% in 2006 to 35% in 2012. Share of primary sector exports, usually low on value addition, reduced by half, from 28% in 2003 to 14% in 2012.
- 200,000 400,000 600,000 800,000
1,000,000 1,200,000 1,400,000 1,600,000
2003 2004 2005 2006 2007 2008 2009 2010 2011 2012
Value of exports, Andhra Pradesh and India, Rs. crore
Total AP Total India
CAGR of Indian exports 21%
CAGR of AP exports 27%
Figure 3.14: Upcoming investment in manufacturing sector, Nellore district
Non-metallic mineral
products, 4,000 ,
33%
Food products,
2,465 , 21%
Chemicals and
petrochemicals,
2,250 , 19%
Textiles and
Apparel, 1,900 , 16%
Leather and
related products, 844 7%
Wood and furniture, 400 , 3%
Machinery and
equipment, 100 , 1%
Upcoming investments in manufacturing sector of Nellore
district, Rs. crore
Final Report - Krishnapatnam Industrial Node Development Plan PwC/Nippon Koei 75

On the other hand, manufacturing sector has increased its presence in AP exports, having increased its share from 45% in 2003 to 51% in 2012. 80% of exported manufacturing goods include engineering items (46%), drugs and pharmaceuticals (35%).
Composition of manufacturing exports has undergone changes as well. In 2003 pharma was the leading sector with 39% share in total manufacturing exports, followed by leather, animal and marine products (31%) and engineering items (19%). One decade later 80% of exported manufacturing goods include engineering items (46%), drugs and pharmaceuticals (35%).
Source: Socio-economic survey AP, 2012-13
Figure 3.16: AP exports by major economic groups and dynamics of manufacturing sector exports in AP
Nellore district has low per capita income as majority of employable population is engaged in low value added non-engineering sectors, primarily agriculture, food
processing and basic metals
Manufacturing in Nellore district is set to pick up – 12% of total upcoming investments are in manufacturing sector
3.3 Industrial Infrastructure Profile
3.3.1 Existing Industrial Infrastructure Although a number of industrial parks and industrial estates exist in Nellore district, most of them are saturated, by both foreign and local factories. Industrial infrastructure in Nellore district is developed by
28%
17%
11%
9%
20%
15%
13%
13%
16%
14%
45%
50%
44%
40%
35%
39%
45%
41%
46%
51%
27%
33%
45%
51%
46%
46%
42%
46%
38%
35%
0% 20% 40% 60% 80% 100%
2003
2004
2005
2006
2007
2008
2009
2010
2011
2012
Share of AP exports by major economic groups, %
Exports of primary sector (agri, forest,minerals)Exports of manufacturing sector
Software (IT & ITES)
0%
10%
20%
30%
40%
50%
60%
70%
80%
90%
100%
2003 2004 2005 2006 2007 2008 2009 2010 2011 2012
Dynamics of manufacturing exports in AP, %
Electronics & Electronics PartsEngineering ItemsDrugs & Pharmaceuticals and allied Chemical PlasticsHandloom & TextilesLeather, Animal and Marine Products
Final Report - Krishnapatnam Industrial Node Development Plan PwC/Nippon Koei 76

Andhra Pradesh Industrial Infrastructure Corporation Limited (APIIC), or by private developers with APIIC’s assistance via PPP schemes.
APIIC is a government organisation whose objective is to provide industrial infrastructure for the development of industrial areas. Previously developed industrial areas have ranged from 15 acres to 2500 acres. The Corporation has a presence in each and every mandal of Nellore district. These industrial areas have approved layouts equipped with internal roads, water and power supply facilities.
Table 3.2: Industrial park details, Nellore district
Name of park Total extent/allotable land, acres
Vacant plots, acres
Ownership
IP Naidupeta 1,601 698 APIIC IP Pynampuram 1,826 324 APIIC IP Attivaram 406 219 APIIC Krishnapatnam International Leather Park
314 (412) PPP
IP Ankulapatur (SBQ Steels)
152
IP Mambattu 980 218 APIIC Sri City 7,156 692 Private developer IP Tada 98.5 - APIIC
Source: APIIC, DIC Nellore district, official websites of selected parks
Andhra Pradesh hosts 115 SEZs at various stages of development. Out of these 115 SEZs, 8 are located in Nellore district. The details of those SEZs are as follows:
Table 3.3: SEZ details in Nellore district by Developer
Name of Developer
Type of SEZ
Location Total
extent, acres
Vacant plots, acres
Status Role of GoAP
Employment
potential
APIIC Ltd. Multi Product
Dwarakapuram, Pallepalem, Menkuru, Konetrajupalem & Palluchuru(V), Naidupeta (M)
2,550 368 Operational APIIC 3,000
Bharatiya International SEZ
Leather Product TADA (M) 250 - Operational APIIC Joint
venture
APACHE SEZ Development India Pvt. Ltd.
Footwear TADA (M) 257 - Operational Assisted by APIIC 15,000
MAS Fabric Park (India) Pvt. Ltd.
Textile and Apparel
Chintavaram (V), Chilakur (M) 583 - Operational Assisted by
APIIC 30,000
Krishnapatnam Infratech Pvt. Ltd. SEZ (Phase I)6
Multi Product
Chillakur, Kota(M) 11,864 Under
plan Formally approved
Assisted by APIIC
Indian Farmers Fertilisers Co-operation Ltd. (IFFCO)
Multi Product Naidupeta 2,527 Operational Private
developer 5,000
Mambattu SEZ Multi Product Sulurpeta 564 -
APIIC 10,000
6 Area of proposed KPT IN
Final Report - Krishnapatnam Industrial Node Development Plan PwC/Nippon Koei 77

Name of Developer
Type of SEZ
Location Total
extent, acres
Vacant plots, acres
Status Role of GoAP
Employment
potential South Coast Infrastructure Development Co. of Andhra Pradesh Private Limited (SCIDCAP)
Building material
NH-5 between Prakasam and Nellore District
292 N/A In principal approval
Private developer
Source: APIIC, DIC Nellore district, official websites of selected SEZs, Nellore.com
3.3.2 Industrial Cluster Existing industrial parks around the proposed node may provide supply chain advantages for certain industries, since the node is located close to the industrial cluster that has formed around Krishnapatnam port. Also, there are several industrial clusters along NH5 within 50 km of the node. The area around the port also hosts a number of operational and upcoming power projects. Major industrial zones in the vicinity include the following:
The main industries around the city of Nellore are food processing and beverages, pharma, chemicals and petrochemicals, steel and metal products, wood, leather, etc.
Areas North and North-east of Nellore host aquaculture units, hatcheries, ponds for shrimp cultivation and related processing units.
The Gudur area has food processing units, steel and metal products and electronics.
Naidupeta is a large agglomeration of industrial units; APIIC estates and an SEZ are located there as well. Industries including food processing and beverages, textiles, electrical machinery and non-mineral based products are located there.
The area around Krishnapatnam port has food processing, steel and metal products and a sizable leather cluster with the upcoming Krishnapatnam International Leather Park.
Sulurpeta is another prominent industrial area (which is beyond 50km from the node) hosting textiles, steel and metal products, electrical machinery, chemical and petrochemicals, leather industries etc.
Most industrial areas are currently operational with limited vacant space. The details are shown below:
Final Report - Krishnapatnam Industrial Node Development Plan PwC/Nippon Koei 78

Table 3.4: Vacant land of SEZ in Nellore district
Source: APIIC, DIC Nellore district, official websites of selec ted SEZs, Nellore.com
Industrial park/SEZ Total extent, acres Vacant land, acres
Operational
IP Naidupeta APIIC 1,601 698
APIIC SEZ 2,550 368
IP Attivaram, APIIC 406 219
IP Pynapuram, APIIC 1,826 324
MAS Fabric Park (India) Private Limited (MFP) 583 -
IFFCO Kisan SEZ Limited 2,527 Upcoming
Krishnapatnam International Leather Park 314 (412)
Final Report - Krishnapatnam Industrial Node Development Plan PwC/Nippon Koei 79

Figure 3.17: Industrial Hubs in proximity to Krishnapatnam Industrial Node
OPERATIONAL IPs/SEZs
IP1 IP Naidupeta APIIC
IP2 APIIC SEZ
IP3 IP Attivaram, APIIC
IP4 IP Pynapuram, APIIC
IP5 MAS Fabric Park (India) Private Limited (MFP)
IP6 IFFCO Kisan SEZ Limited
UPCOMING IPs/SEZs
IP1 Krishnapatnam International Leather Park
Food processing (Vegetable oils, marine food, diary products)
Beverages
Chemicals
Pharma
Non-mineral based products (Glass and glassware)
Other electronics
Leather
Wood
Steel and metal products
Textiles
Electrical machinery
Electricity generation, yellow highlight – upcoming projects
Port
IP1 IP2 IP3 IP2 221 IP1
50 km
NH
5
IP3
Krishnapatnam
port
Krishnapatnam
Industrial Node
IP4
IP6
IP5
IP3 IP2
IP1
IP1
Final Report - Krishnapatnam Industrial Node Development Plan PwC/Nippon Koei 80

3.4 Overview of the Krishnapatnam Industrial Node
3.4.1 Delineation of the Node In addition to the area covered by Phase 1 and Phase 2 of the proposed Krishnapatnam SEZ, additional 1,567 Acre of land in the south have additionally been identified as a part of the node in Krishnapatnam. As a result, an area of 5,654 ha (13,971 acres) was finalized for the node. There are some other land parcels to be acquired by APIIC in the surrounding area. However the most of them are not suitable for development as part of the node since they are smaller and non-contiguous with the node area. But APIIC land parcel(1,332 Acre) in the north shown as yellow color in the figure below is identified as future expansion area for the Krishnapatnam Node.
Source: JICA Study Team
Figure 3.18: Node Boundary of Krishnapatnam
Table 3.5: Breakdown of Node Area
Area
(Acre) (ha) Phase-1 5,501 2,226 Phase-2 8,470 3,428 Total 13,971 5,654
Source: APIIC, JICA Study Team
Final Report - Krishnapatnam Industrial Node Development Plan PwC/Nippon Koei 81

3.4.2 Topography The locations of the selected three nodes in the CBIC region including Krishnapatnam are illustrated below:
Source: Global Map
Figure 3.19: Location of Nodes
The Krishnapatnam node was defined based on the boundary of the proposed Krishnapatnam SEZ (Phase I & II). The SEZ is located within Kota and Chillakur mandals of Nellore district in the southeast of Andhra Pradesh state. Nellore district is bordered by Prakasam district to the north, Y.S.R. district to the west, and Chittoor district to the southwest as shown in the following figure.
Figure 3.20: Location of Nellore District
Figure 3.21: Geography of Krishnapatnam SEZ
Source: Global Map Note: only phase-1 area is shown Source: ASTER GDEM( METI and NASA)
The node is located approximately 30 km from Nellore city and about 10 km south of Krishnapatnam port. The node area runs parallel to the coastline of the Bay of Bengal. Most of the area is flat and the elevation varies from 10 to 20 meters above sea level. Final Report - Krishnapatnam Industrial Node Development Plan PwC/Nippon Koei 82

3.4.3 Natural conditions The climatic seasons are classified as follows: Winter – January and February, Summer – March to May, Southwest Monsoon – June to September and Northeast Monsoon – October to December.
The climate of Nellore is a typical tropical maritime climate, with warm and humid summers as well as mild winters. April and May are the hottest months and the hot conditions generally last till the end of June, while December, January and February are the coolest months. As Krishnapatnam is near the Bay of Bengal, the sea breeze contributes to moderation of climate both in winter and summer. The maximum temperature is 36-46°C during summer and the minimum temperature is 23-25°C during winter.
The humidity level is high due to its proximity to the coast. Nellore does not receive much rainfall during the Southwest Monsoon season, although rainfall occurs between the months of October and December. The rainfall ranges from 700–1,000 mm and about 60 percent of the annual rainfall will occur during that season. Cyclones are common in Nellore during the Southwest Monsoon period and accordingly cause floods at places across the area. It is noted that Nellore has both drought and flood risks depending on the seasons.
3.4.4 Current Land Use / Distribution of Settlement and Social Facilities
Land Use & Settlement The current land use pattern and distribution of settlements are shown in the following figure and findings are summarised below.
Figure 3.22: Distribution of Settlements in Krishnapatnam Node
Source: JICA Study Team
Most of the land within the Krishnapatnam node area is vacant. However, a few settlements are located and scattered inside of the area. (See yellow circles in above figure) The area of the existing settlements inside Node is roughly measured as 243 Acre on the satellite image. R&R plan is needed to be prepared during DPR stage.
Forest
Bay of Bengal
Settlement
Final Report - Krishnapatnam Industrial Node Development Plan PwC/Nippon Koei 83
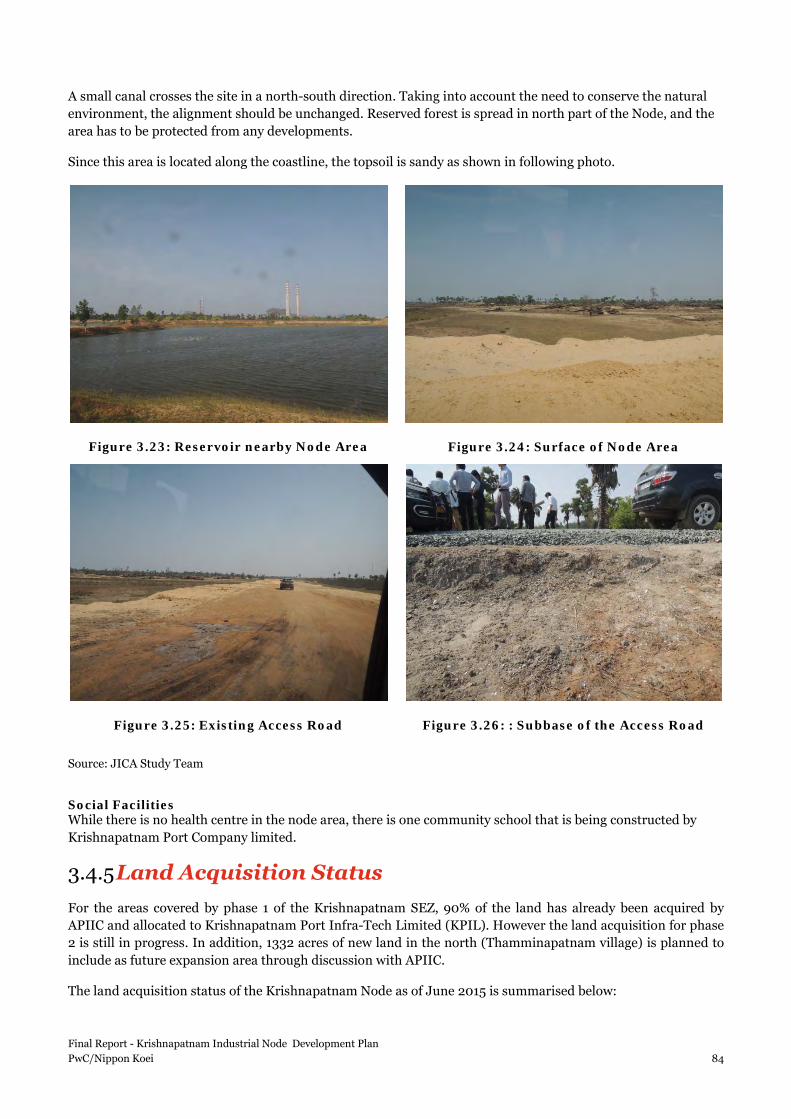
A small canal crosses the site in a north-south direction. Taking into account the need to conserve the natural environment, the alignment should be unchanged. Reserved forest is spread in north part of the Node, and the area has to be protected from any developments.
Since this area is located along the coastline, the topsoil is sandy as shown in following photo.
Figure 3.23: Reservoir nearby Node Area
Figure 3.24: Surface of Node Area
Figure 3.25: Existing Access Road
Figure 3.26: : Subbase of the Access Road
Source: JICA Study Team
Social Facilities While there is no health centre in the node area, there is one community school that is being constructed by Krishnapatnam Port Company limited.
3.4.5 Land Acquisition Status For the areas covered by phase 1 of the Krishnapatnam SEZ, 90% of the land has already been acquired by APIIC and allocated to Krishnapatnam Port Infra-Tech Limited (KPIL). However the land acquisition for phase 2 is still in progress. In addition, 1332 acres of new land in the north (Thamminapatnam village) is planned to include as future expansion area through discussion with APIIC.
The land acquisition status of the Krishnapatnam Node as of June 2015 is summarised below:
Final Report - Krishnapatnam Industrial Node Development Plan PwC/Nippon Koei 84

Table 3.6: Land Acquisition Status of Krishnapatnam Node as of June 2015
Node Area Govt. Land Pvt. Land Acquisition Status Remarks
Kri
shn
apat
nam
Nod
e Total 5,654 ha (13,971 Acre)
656 ha (1,620 Acre)
4,998 ha (12,350 Acre)
Phase-1 2,226 ha (5,501 Acre)
312 ha (770 Acre)
1,914 ha (4,730 Acre) Completed
312 ha are owned by APIIC and 1,914 ha has been handed over to KPIL.
Phase 2 3,428 ha (8,470 Acre)
344 ha (850 Acre)
3,084 ha (7,620 Acre)
Under acquisition
The concessionaire or APIIC is in the process of land acquisition.
Source: JICA Study Team Note: Figures in the table are approximate numbers. The field survey has to be done and confirm the exact figures for each land.
Final Report - Krishnapatnam Industrial Node Development Plan PwC/Nippon Koei 85

4 Node Development Vision – Krishnapatnam
4.1 Analytical Framework for Development of Node Vision
As part of vision for development of Industrial corridors, it is envisaged that each of the industrial nodes should provide the incoming industries and companies a competitive edge when compared to similar industrial nodes domestically as well globally. It is recognised that global investors tend to zoom into their investment destination decision, firstly based on the country’s macro environment, followed by careful consideration amongst regional and local options before deciding on the final investment location. In this regard, it is important to develop an appropriate vision for the development of the node based on its strengths and potential for attracting particular industries. This should be followed by structured building up of core competencies to enhance the regional, national and global competitiveness of the node.
The vision for Krishnapatnam Industrial Node was similarly developed through structured analysis of its strengths, weaknesses and the vision set out to develop the industrial node and future agglomeration of diversified economic, commercial and civic activities.
As a first step, a SWOT analysis was conducted based on existing and potential infrastructure and industries present in the region and the brownfield development at the node. Based on a Competitiveness Framework, target functions were identified as part of the identified Node Development Vision.
4.2 Potential as an Industrial Hub for Resource-driven Industries
Krishnapatnam Industrial Node’s Unique Selling Proposition is its proximity to the Krishnapatnam Port, established connectivity to NH-5 and good rail connectivity at Krishnapatnam port. It is a greenfield location which provides flexibility to plan adequate logistical facilities.
Strategically located in 140 km of Chennai and only 10 km away from Krishnapatnam port, the node is has high potential to develop as a hub for resource-driven industries servicing both exports and import. It can facilitate development of port-based industries as well.
The node is aimed at becoming a new center of economic activity of Nellore district given its potential for employment generation, which will support improvement of socio-economic profile for the area as well as the Nellore district.
4.2.1 SWOT Analysis The following matrix summarizes current strategic positioning of Krishnapatnam Industrial Node with analysis of the strength, weakness, opportunity and threat. It is useful for evaluating development potential of the region which could lead to the future vision, direction and strategy for the further development.
The analysis is based on the survey result shown in the subsequent chapters on existing condition in each sector, i.e., land use, infrastructure and industry.
Final Report - Krishnapatnam Industrial Node Development Plan PwC/Nippon Koei 86

Table 4.1: SWOT Analysis for Krishnapatnam Node
Strengths Areas for improvement
Inte
rna
l
Strength: • Proximity to Krishnapatnam Port • No confirmed disputes on land acquisition, and
relation with local residents due to CSR activities • Connectivity to NH5 as a part of GQ Highway • Flat land suitable for road and building construction • Good railway connectivity at Krishnapatnam port • Presence of development plan and capable private
developer • Broad area enabling strategic allocation of waste
management facilities • Benefits as Special Economic Zone • Small environment influence due to distance from
main road and no protected forestry area • Availability of potential water resources from
Kandaleru reservoir, recycling plant of Nellore city, and desalination plant
• Greenfield location which provides flexibility to plan adequate logistical facilities and multimodal parks
Weakness: • Distance form highly populated area, i.e., Chennai
(140km) and Bangalore (310 km) • Existence of sensitive areas, i.e., agricultural land and
local villages • Unavailability of ground water due to high level of
salinity concentration • Lack of appropriate logistical facilities and good
connectivity • Weak access to the internal area (Only an access road
to port is not enough at peak time of traffic congestion.)
• Lack of disposal facilities and monitoring capacity for waste occurred from the Krishnapatnam node in the future
• Limited usage of land along the coastal area (Phase II) • Possibility of salt and wind damage
Ext
ern
al
Opportunity: • Growing interest of potential investors to the
Krishnapatnam node due to overall policy direction of Andhra Pradesh Government to enforce the investment environment
• Growing interest of foreign investors to India due to expectation to initiatives of new regime and prime minister
• Existence of solid waste management plan for Krishnapatnam Port
• Recent momentum of 3R in the region
Threat: • Change of land law in 2013, which may cause delay of
land acquisition to planned area due to the increased compensation to local people
• Possibility of cost elevation for land acquisition due to the master planning
• Uncertainty in current master plan which extends resident and commercial areas to a coastal line
• Necessity of disaster mitigation measures
Source: JICA Study Team
4.2.2 View of Andhra Pradesh State Government The study team has undertaken consultation meetings with the Andhra Pradesh State Government for developing the Master Plan. The following views for the Krishnapatnam Industrial Node development have been adopted for the development of the Node Vision through these stakeholder consultations:
The Krishnapatnam Node shall:
• Attract foreign investors through establishing best investment environment among other industrial parks at east coast area of CBIC including the Chennai region.
• Provide the best business environment for foreign investors through maximizing advantage as the closest industrial park to Krishnapatnam port.
• Solve the issue of solid waste management currently most of the major Indian cities are facing. • Show a success model of smart city beyond the current broad definition in India, so that the Government
can study and develop the most suitable concept for India. • Become a major manufacturing city led by private sector in India, especially one or two globally major
companies
Final Report - Krishnapatnam Industrial Node Development Plan PwC/Nippon Koei 87

4.3 Vision for Krishnapatnam – Building a Competitive Node
In the Master Plan’s context, the Competitiveness of Node means comparative advantages, which enable it to attract high quality human and capital resources, investments, technologies and knowledge base. To build and strengthen the competitiveness of the Node, key factors providing a comparative advantage against similar investment destinations both in India and globally were identified.
Based on SWOT analysis above, inputs from state government and key requirements for industrial and urban growth, it is envisaged that the Krishnapatnam Industrial Node should have the following characteristics to build Node Competitiveness:
• Industry Competitiveness - Technological Advancement, Cost Competitiveness, Ease of doing business, Enhanced Connectivity, Logistics Services, Skilled Manpower
• Infrastructure Quality - Assurance on utility services (24 x 7), Mobility and Connectivity, Efficiency, Effectiveness and Sustainability of all infrastructure services
• Sustainability - Environmental Sustainability, Economic Sustainability, Waste management, Water Management and Recycling, Renewable Energy, Skill Development, Organic Growth
• Quality of Life – Responsive Governance, Civic Services, Affordable, Public Facilities, Parks & Recreation facilities, Leisure and Retail facilities.
Industry Competitiveness
Cost Competitiveness, Ease of doing Business, Enhanced connectivity,
Logistics services, Skilled Manpower
Quality of Life Responsive
Governance, Civic Services,
Affordable Housing Public Facilities,
Parks & Recreation, Leisure and Retail
facilities
Infrastructure Quality Assurance on 24 x 7 utility services,
Mobility Planning Efficiency, Effectiveness and Sustainability
Sustainability Economic and Environmental Sustainability,
Waste management, Recycled water, Renewable energy, Skill Development, Organic
Growth
Qu
ality
of i
Infrastructure Quality
Industry Competitivenes
Sustainability
Final Report - Krishnapatnam Industrial Node Development Plan PwC/Nippon Koei 88

4.3.1 Planned Growth Strategy The industrial development at Krishnapatnam is proposed to become the seed for organic growth of the node into a fully functional industrial township with all the necessary ingredients for fueling further economic development of the township through urban agglomeration. The Master Plan envisages the development, i.e., competitiveness enhancement, of the node occurs through the following organic development phases:
• First phase, as Inception stage, where the node development is focused on ensuring availability of core infrastructure to meet essential industrial needs, such as 24x7 utilities services (water, power, waste management, effluent treatment); mobility, connectivity and skilled workforce. In addition, the foundation is laid for future organic development of the node in terms of infrastructure, economic competitiveness, quality of life and environment sustainability.
In addition, the nodes will also start accommodating a proportion of workers within the nodes as Resident Workers. In this stage, the Node is trying to provide the basic infrastructure so as to be able to attract investors to take industrial land parcels and create a seed development. The land allocation in this stage should ideally be closely placed so that the core infrastructure is efficiently utilized. However, large anchor tenants should also be given preference to choose appropriate locations within the node which best suit their requirements. The node development strategy at this stage is to become attractive industrial hub for attracting core tenants and provide effective infrastructure to make the node viable to live, work and do business.
• Second phase, i.e. the Growth Stage, after accumulation of set of core tenants, the node infrastructure should be enhanced by building soft infra such as healthcare, primary and secondary education, enhanced transport connectivity within a city and to surrounding areas. In addition, the node should also build other technical institutions which are required to meet other functional needs of the tenant firms. At this stage, the node development strategy is to become a fully functional industrial township with resident workers and other commercial activities within the township to support sustainable living
• Third phase, i.e. the Advanced Stage, the infrastructure development is geared more toward improving economic growth and productivity enhancement to gain competitiveness and economic efficiency. This may include mass transit, commercial property development, introduction of knowledge based service industries, global connectivity, advanced university education and research, and enhanced natural-disaster risk management etc. At this stage, the node development becomes more proactive as a town which is able to drive economic activity in and around the node boundary through organic growth i.e., setting the pace, ahead of the demand curve, and becoming more attractive place in which to live, work and do business.
• Future Organic Growth of the town through urban agglomeration or city development will focus on more advanced human needs to improve all aspects of quality of life and sustainability, including elderly care, green space, leisure and cultural assess, and environmental infrastructure.
The proposed masterplan envisages the above growth through a planned and controlled development in of the node in initial phases. However it is envisaged that as the node matures into a functional industrial township, it will further fuel economic activity in and around the node to allow for more organic growth of the node into vibrant agglomeration of industrial and economic activities.
Final Report - Krishnapatnam Industrial Node Development Plan PwC/Nippon Koei 89
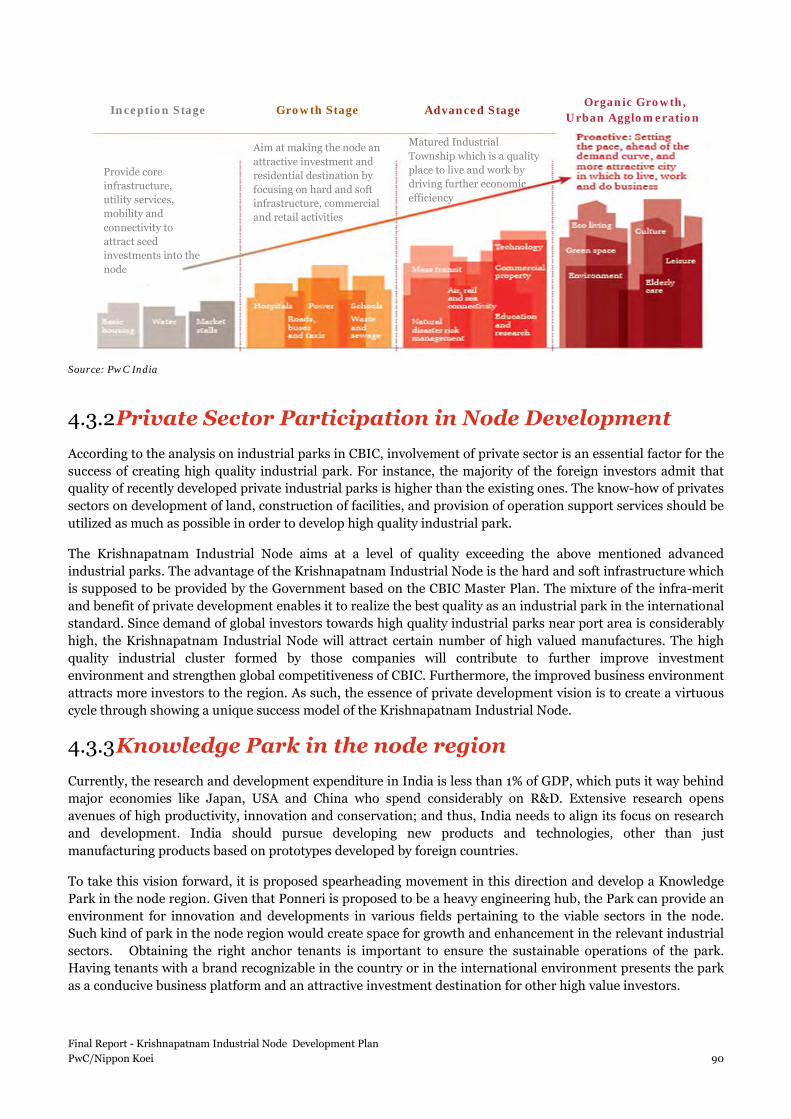
Source: PwC India
4.3.2 Private Sector Participation in Node Development According to the analysis on industrial parks in CBIC, involvement of private sector is an essential factor for the success of creating high quality industrial park. For instance, the majority of the foreign investors admit that quality of recently developed private industrial parks is higher than the existing ones. The know-how of privates sectors on development of land, construction of facilities, and provision of operation support services should be utilized as much as possible in order to develop high quality industrial park.
The Krishnapatnam Industrial Node aims at a level of quality exceeding the above mentioned advanced industrial parks. The advantage of the Krishnapatnam Industrial Node is the hard and soft infrastructure which is supposed to be provided by the Government based on the CBIC Master Plan. The mixture of the infra-merit and benefit of private development enables it to realize the best quality as an industrial park in the international standard. Since demand of global investors towards high quality industrial parks near port area is considerably high, the Krishnapatnam Industrial Node will attract certain number of high valued manufactures. The high quality industrial cluster formed by those companies will contribute to further improve investment environment and strengthen global competitiveness of CBIC. Furthermore, the improved business environment attracts more investors to the region. As such, the essence of private development vision is to create a virtuous cycle through showing a unique success model of the Krishnapatnam Industrial Node.
4.3.3 Knowledge Park in the node region Currently, the research and development expenditure in India is less than 1% of GDP, which puts it way behind major economies like Japan, USA and China who spend considerably on R&D. Extensive research opens avenues of high productivity, innovation and conservation; and thus, India needs to align its focus on research and development. India should pursue developing new products and technologies, other than just manufacturing products based on prototypes developed by foreign countries.
To take this vision forward, it is proposed spearheading movement in this direction and develop a Knowledge Park in the node region. Given that Ponneri is proposed to be a heavy engineering hub, the Park can provide an environment for innovation and developments in various fields pertaining to the viable sectors in the node. Such kind of park in the node region would create space for growth and enhancement in the relevant industrial sectors. Obtaining the right anchor tenants is important to ensure the sustainable operations of the park. Having tenants with a brand recognizable in the country or in the international environment presents the park as a conducive business platform and an attractive investment destination for other high value investors.
Inception Stage Growth Stage Advanced Stage Organic Growth,
Urban Agglomeration
Provide core infrastructure, utility services, mobility and connectivity to attract seed investments into the node
Aim at making the node an attractive investment and residential destination by focusing on hard and soft infrastructure, commercial and retail activities
Matured Industrial Township which is a quality place to live and work by driving further economic efficiency
Final Report - Krishnapatnam Industrial Node Development Plan PwC/Nippon Koei 90

Knowledge Park can be integrated and developed as a part node establishment. Along with the four components (Infrastructure quality, industry competitiveness, sustainability and quality of life) taken care in the node, human capital establishment with right combination of skills for the industries would enhance the livability and sustainability in the region.
Industry-academia collaboration (primarily with universities and public research organizations) plays a pivotal role in developing a successful Knowledge park. The emphasis on the exploitation of technology has given universities a new relevance to the global economy, and ST parks act as a bridge between research and the marketplace. They are also sites where interaction and networks leading to innovation are fostered. Synergies can emerge between research institutions and companies through the sharing of premises and the sharing of knowledge. Access to well qualified work force can be fulfilled with the synergy created.
Apart from work force creation, the other three components showed in the above picture are aligned with node development strategy. When these components are fulfilled the high-value adding personnel will eventually be enthralled to be a part of node and offer their services.
Positioning of Krishnapatnam based on these four components is shown below:
Infrastructure Business Environment
Human Capital Livability
Weak access to internal areas Distance form highly populated area, i.e.,
Chennai (140km) and Bangalore (310 km)
Growing interest of potential investors to
the Krishnapatnam node due to overall policy direction of Andhra Pradesh Government to enforce the investment environment
Growing interest of foreign investors to India due to expectation to initiatives of new regime and prime minister
Change of land law in 2013, which may cause delay of land acquisition to planned area due to the increased compensation to local people
Andhra Pradesh has more than 50 prestigious and central and state R&D laboratories
Strong base for engineering colleges
Significant efforts may be required to reach required standards of labour skill and productivity
Proximity to Krishnapatnam Port Connectivity to NH 5 as a part of GQ
highway Existing solid waste management plan for
Krishnapatnam port Green field plan-flexibility to plan adequate
logistical facilities and multimodal parks
Strengths & Opportunities
Strengths & Opportunities
Strengths & Opportunities
Challenges Challenges
Challenges
Availability of Potential water resources from Kandaleru reservoir, recycling plant in Nellore city and desalination plant
Existing solid waste management plan for Krishnapatnam port
Flat land suitable for road, building and amenities construction
Possibility of cost elevation for land acquisition due to the master planning
Strengths & Opportunities
Challenges
Final Report - Krishnapatnam Industrial Node Development Plan PwC/Nippon Koei 91

Successful Science and Technology parks in the World
Research Triangle Park, North Carolina, USA •Area: 7,000 acres •Type of activities: Micro-electronics, telecommunications, biotechnology, chemicals, pharmaceuticals, and environmental sciences •Business Environment: Drawing upon the strengths and synergies between North Carolina’s academic, government and industry base, RTP was created to attract and grow R&D operations. •The Research Triangle Foundation is a private, financially independent not-for-profit. •Tenants: The park houses over 190 organisations. High profile tenants at the RTP include IBM, Nortel, GlaxoSmithKline, SAS, Cisco Systems and Bayer CropScience.
Surrey Research Park, UK •Area: 70 acres •Type of activities: Technology, Science, Health, and Engineering •Business Environment: worked together with the local and county planning authorities. Three stakeholders were envisaged from the outset: the University, the planning authority and tenant companies •Tenants: The park houses 118 tenants.
Berlin Adlershof, Germany •Area: 1,038 acres •Type of activities: Photonics and Optics, Renewable Energies and Photovoltaics, Microsystems and Materials, IT and Media, Biotechnology and Environment Analytics •Business Environment: Successful model of how public subsidies can stimulate sustainable development of private industry. Government funding accounts for only 6.4% of the park’s budget. •Tenants: Focuses on small tenants. Currently, there are 996 companies and 17 scientific institutes.
Tsukuba Science City, Japan •Area: 6,672 acres •Type of activities: Electronics, Biotechnology, Mechatronics, New materials, Information engineering, Space development, Environmental science, Natural resources and energy, Earth sciences, Civil engineering and construction, Agriculture •Business environment: In early 1960s, the Government decided to move research institutions affiliated to the government offices and national educational institutes to TSC. •Given the concentration of national research institutes, this forms a “pull” factor for private sector to establish themselves in the City, especially after the Tsukuba International Science and Technology Exposition in 1985. •Tenants: Houses about 60 educational and research organisations
Hsinchu Science and Industrial Park, Taiwan •Area: 3,316 acres •Type of activities: IT-focused (Semiconductor, Optoelectronics), Biotechnology, Technology, Avionics and aviation, Biomedical. Solar energy industries. Knowledge-based services. Pharmaceuticals, Medical, R&D, production •Business Environment: Government policies to attract firms into the Park included a 5-year tax holiday; a maximum income tax rate of 22%; duty-free imports of machinery, equipment, raw material and semi-finished products; and capitalisation of investors’ patents and know-how as equity shares. •The Government also directly entered into industrial production, establishing joint venture companies with private capital. •Tenants: The park houses many Taiwanese heavyweights such as Taiwan Semiconductor Manufacturing Co. (TSMC) and United Microelectronics Corp. (UMC) — the world's two largest contract chip-makers
Final Report - Krishnapatnam Industrial Node Development Plan PwC/Nippon Koei 92

Knowledge parks in India
Keystone Knowledge park 7 is a state of art R &D building with 20,500 sq. meters of lab space with 4.5 meters floor to floor height and having Bio-Safety Provision upto BSL3 level. This is conceptualized to drive research and innovation oriented companies to North India. This is established with well-versed amenities. Keystone Central is LEED Gold rated, enabling tenants to optimize their operational costs while demonstrating their commitment to sustainability. It is associated with private funding. This attracts industries from pharmaceutical, biotechnology, petrochemicals, new materials, crop protection, Agri Biotech labs, chemicals, Nanotechnology sectors along with plug and play office space. Key stone SEZ is well connected to this park.
Innovation Knowledge Progress (IKP) knowledge park 8 has been receiving continuous support from both State and the Central Government. 600 sq.km has been designated by Andhra Pradesh in three blocks in Genome valley for life sciences development. It is recognised by SIRO (Scientific & Industrial Research Organisation) is entitled to customs and excise duty waivers. The Park has received partial funding from National Science and Technology Entrepreneurship Development Board (NSTEDB), Department of Science & Technology (DST) to establish the Life Science Incubator and from Department of Scientific & Industrial Research (DSIR), Government of India, to establish the Virtual Information Centre. The park has promoted 65 companies so far. It leases ready-to-use laboratories for short periods (3 years). Some of the companies have set up their own facilities in the park. It is armed with in-house funding support and also some grant programs.
7 http://www.keystonesez.com/ 8 http://www.ikpknowledgepark.com/
Keystone Knowledge park for Research &
Development in Sohna, Gurgaon
Innovation Knowledge
Progress knowledge park
in Genome valley,
Hyderabad
Final Report - Krishnapatnam Industrial Node Development Plan PwC/Nippon Koei 93

5 Industrial Development Analysis
5.1 Proposed Industries Mix for Krishnapatnam Industrial Node
5.1.1 Focus sectors selected for CBIC region Initial study identified focus sectors for CBIC region. In depth analysis for identifying potential industries for the corridor was undertaken as a part of Interim Report 1 under Part A of this study. As per the analysis undertaken, the following manufacturing sectors are the key drivers of industrial growth in the CBIC region:
Rationale for initial viable sectors for KPT node
Viable sectors for KPT IN were chosen based on industrial based and existing FoPs. The consultant has analysed the manufacturing output of Nellore district and arrived at the top industries pertaining to the district. The leading sector is food processing (including beverages), followed by metallurgy and allied industries, electrical machinery and leather sectors. Food processing sector of Nellore in percentage terms is more than double of the same of Andhra Pradesh. It is also the largest contributor to the district’s output of manufacturing sector. Share of each of the top sectors in Nellore and AP, is given in the figure below:
Source: ASI reports of 2009, 2010, 2011, PwC analysis
Figure 5.2: Top sectors in Nellore district vs AP
54%
24%
19%
16%
11%
6%
6%
0.12%
4%
23%
3%
8%
2%
4%
1%
8%
1%
11%
0% 10% 20% 30% 40% 50% 60% 70% 80% 90% 100%
Nellore
AP
Top industries in Nellore vs AP, % to total of top manufacturing sectors (avg. 2009-11)
Food products and beverages Metallurgy Electrical equipment
Leather and related products Chemicals and petrochem Other non-metallic mineral products
Textiles and Apparel Pharmaceuticals Others
TOP SECTORS
Food processing Electronics
Automobiles Textiles
Chemicals and petrochemicals Pharmaceuticals
Metallurgical industries Electrical machinery
Machinery Medical equipment
Figure 5.1: Sectors shortlisted as potential sectors for the corridor
Final Report - Krishnapatnam Industrial Node Development Plan PwC/Nippon Koei 94
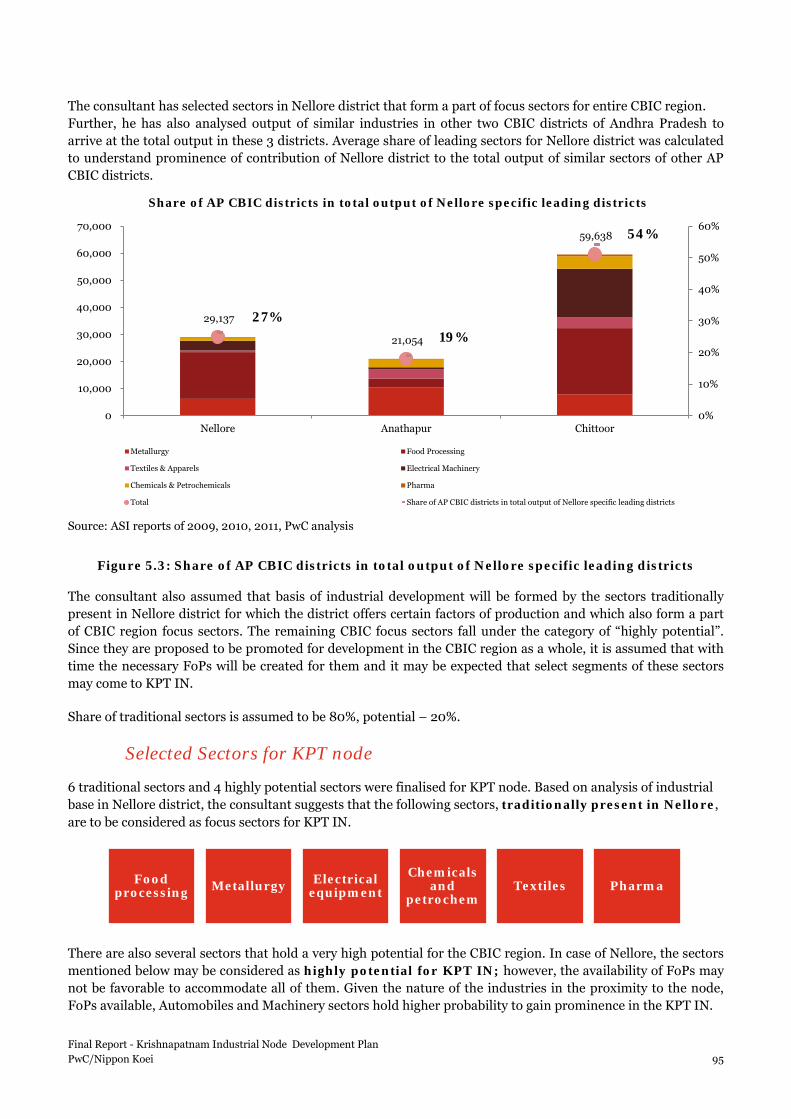
The consultant has selected sectors in Nellore district that form a part of focus sectors for entire CBIC region. Further, he has also analysed output of similar industries in other two CBIC districts of Andhra Pradesh to arrive at the total output in these 3 districts. Average share of leading sectors for Nellore district was calculated to understand prominence of contribution of Nellore district to the total output of similar sectors of other AP CBIC districts.
Source: ASI reports of 2009, 2010, 2011, PwC analysis
Figure 5.3: Share of AP CBIC districts in total output of Nellore specific leading districts
The consultant also assumed that basis of industrial development will be formed by the sectors traditionally present in Nellore district for which the district offers certain factors of production and which also form a part of CBIC region focus sectors. The remaining CBIC focus sectors fall under the category of “highly potential”. Since they are proposed to be promoted for development in the CBIC region as a whole, it is assumed that with time the necessary FoPs will be created for them and it may be expected that select segments of these sectors may come to KPT IN.
Share of traditional sectors is assumed to be 80%, potential – 20%.
Selected Sectors for KPT node
6 traditional sectors and 4 highly potential sectors were finalised for KPT node. Based on analysis of industrial base in Nellore district, the consultant suggests that the following sectors, traditionally present in Nellore, are to be considered as focus sectors for KPT IN.
There are also several sectors that hold a very high potential for the CBIC region. In case of Nellore, the sectors mentioned below may be considered as highly potential for KPT IN; however, the availability of FoPs may not be favorable to accommodate all of them. Given the nature of the industries in the proximity to the node, FoPs available, Automobiles and Machinery sectors hold higher probability to gain prominence in the KPT IN.
29,137
21,054
59,638
27%19%
54%
0%
10%
20%
30%
40%
50%
60%
0
10,000
20,000
30,000
40,000
50,000
60,000
70,000
Nellore Anathapur Chittoor
Share of AP CBIC districts in total output of Nellore specific leading districts
Metallurgy Food Processing
Textiles & Apparels Electrical Machinery
Chemicals & Petrochemicals Pharma
Total Share of AP CBIC districts in total output of Nellore specific leading districts
Food processing Metallurgy Electrical
equipmentChemicals
and petrochem
Textiles Pharma
Final Report - Krishnapatnam Industrial Node Development Plan PwC/Nippon Koei 95

5.2 Planning development of industry sectors for KPT Industrial node
5.2.1 Food processing
Sector performance
The global Food Processing industry was estimated to be USD 3,200 billion in the year 20109. The US and EU and together account for over 60% share of the global food processing industry. In the Asian region Japan is the largest food processing market.
Top 2o exporting countries in food processing sector contribute about 70% to total exports of the sector globally. In terms of value of exports in 2013, USA, France and Netherlands are the top three exporting countries. 5 Asian countries are present in the top 20 list; China ranks the 4th, followed by Thailand at 10th and Indonesia at 12th positions. India secured the 14th position in the list of top exporting countries in 201310.
Source: Trade statistics for international business development, International Trade Centre, intracen.org, PwC analysis
Figure 5.4: Top exporting countries based on value of exports
Across all regions, the major sub-sectors on the basis of demand are Meat, Poultry, Fruits and Vegetables and Sugar. These sub-sectors contribute to more than 70% of the demand of Food Processing sector. The major regions that contribute to more than 60% of the global retail sales of processed foods are United States and the European Union. Currently, around 58% of produced food is consumed by developing countries. This is expected to increase to over 70% by 2050 supported by the fact that over 35% of the world’s population currently lives in China and India. Over the past 10 years (between 2003 and 2013) there have been insignificant changes in terms of top exporters, across major food processing sub-sectors.
India has improved its position on the global food processing exports arena by from 1.1% to 2.1% share in total food processing exports (22nd to 14th rank). Improvement in export volumes has been remarkable in meat and
9 Gyan Research and Analytics Pvt. Ltd, 2012 10 Trade statistics for international business development, International Trade Centre, intracen.org
Automobiles Machinery Electronics Medical equipment
0.0%1.0%2.0%3.0%4.0%5.0%6.0%7.0%8.0%9.0%
- 10 20 30 40 50 60 70 80
USA
Net
herl
ands
Ger
man
y
Chi
na
Bra
zil
Fran
ce
Spai
n
Bel
gium Ital
y
Indo
nesi
a
Can
ada
Thai
land
Mal
aysi
a
Indi
a
New
Zea
land
Pola
nd
Mex
ico
Aus
tral
ia
Den
mar
k
UK
百万
Top exporting countries based on value of exports, 2003 vs 2013
Exports 2003, USD thousand Exports 2013, USD thousand
% to global FP exports, 2003 % to global FP exports, 2013
Final Report - Krishnapatnam Industrial Node Development Plan PwC/Nippon Koei 96

edible meat offal (from 23rd rank in 2003 it secures 8th rank globally) fish, crustaceans, molluscs, aquatic invertebrates (from 12th to 4th rank), animal vegetable fats and oils, cleavege products (from 47th to 17th rank). However, some in large segments of food processing, such as meat, fish and seafood preparations, dairy products, cereal, floor, starch, milk preparations, etc., it still lags behind, thought these sub-sectors are among the highest in terms of value added.
Table 5.1: Trade competitiveness ranking, 2003 vs 2013, Food processing11
Rank Meat and
Edible Meat Offal
Fish, Crustaceans,
Molluscs, Aquatic
Invertebrates
Meat, Fish and Seafood Preparations
Dairy products,
Eggs, Honey and
Animal Products
Animal Vegetable Fats and
Oils, Cleavege Products
Cereal, Flour,
Starch, Milk Preparations
and Products
Vegetable, Fruit, Nut etc Food
preparations
Miscellaneous Edible
Preparations
1 USA (1)
China (2)
China (1)
Germany (1)
Indonesia (2)
Germany (1)
China (2)
USA (1)
2 Brazil (3)
Norway (1)
Thailand (2)
N. Zealand (4)
Malaysia (1)
Italy (2)
USA (4)
Germany (2)
3 Germany (7)
USA (3)
Germany (3)
Netherlands (2)
Netherlands (6)
France (3)
Netherlands (1)
Netherlands (3)
4 Netherlands (2)
India (12)
USA (4)
France (3)
Argentina (3)
Netherlands (8)
Belgium (6)
France (4)
5 Australia (5)
Viet Nam (5)
Netherlands (6)
USA (13)
Spain (5)
USA (5)
Italy (3)
China (13)
India 8
(23) 4
(12) 43
(44) 21
(39) 17
(47) 28
(38) 25
(38) 28
(32)
Source: Trade statistics for international business development, International Trade Centre, intracen.org, PwC analysis
Food processing industry is one of the largest industries in India and is estimated to be worth USD 121 billion in 2012 and accounts for 32% of country’s total food market12. With a huge agriculture sector, abundant livestock, and cost competitiveness, India is fast emerging as a sourcing hub for processed food.
Around 90% of the output of food processing sector is contributed by four sub-sectors - vegetable oil, grain mill and starch, dairy and other food products. Output of the sector has increased from over USD 62 billion in 2008-09 to over USD 90 billion in 2010-1113 and is expected to grow at a CAGR of about10% till 201514.
Food processing industry in India is increasingly seen as a potential source for driving the rural economy as it brings about synergy between the consumer, industry and agriculture. A well-developed food processing industry is expected to increase farm gate prices, reduce wastages, ensure value addition, promote crop diversification, generate employment opportunities as well as export earnings.
Between January 2000 and November 2014, foreign direct investment in food processing sector in India stood at USD 6.1 billion. The FDI spike has been registered in 2013 having marked the entry of several large foreign players such as Nestle, Coca Cola, Hershey’s, McCormick, etc.
11 Numbers in brackets represents rank in 2003 12 D&B Research 13 Annual Survey of Industries (Conversion 1USD = 60 Rupees) 14 D&B Research Final Report - Krishnapatnam Industrial Node Development Plan PwC/Nippon Koei 97

Source: Fact sheet on foreign direct investment (FDI), DIPP
Figure 5.5: FDI in food processing sector, India
The rate at which sub-sectors are expected to grow over the next few years is as shown in the table below.
Table 5.2: Sub-sector wise projected growth rates – Food processing sector
Segment Growth rate Marine 4% Fruits and vegetables 6% Vegetable oil 5% Dairy 8% Grain mill and starch15 10%
Source: D&B Research, ASSOCHAM, Feedback consulting
The Ministry of Food Processing Industries (MOFPI) has formulated a Vision 2015 Action Plan that includes trebling the size of the food processing industry, raising the level of processing of perishables from 6 per cent to 20 per cent, increasing value addition from 20 per cent to 35 per cent, and enhancing India's share in global food trade from 1.5 per cent to 3 per cent.
Some of the other key measures undertaken by the Government include: amendment of the Agriculture Produce Marketing Committee Act, rationalization of food laws, implementation of the National Horticulture mission etc. The government has also outlined a plan to address the low scale of processing activity in the country by setting up the mega food parks, with integrated facilities for procurement, processing, storage and transport. To promote private sector activity and invite foreign investments in the sector the Government allows 100% FDI in the food processing & cold chain infrastructure.
Despite of continual efforts and initiatives by the Government to provide the required stimulus to the food processing sector, processing activity is still at a nascent stage in India with low penetration. At the same time, though India is a key producer of food products, having an adequate production base for inputs, productivity levels are very low in the country.
Viability drivers for future investments
There is number of growth drivers fuelling the processed food sector in India and Nellore.
15 Average growth rate of food processing sector
2.5%0.5% 0.4% 0.5% 0.7% 1.0% 0.7% 1.4%
17.5%
3.2%
0.0%2.0%4.0%6.0%8.0%10.0%12.0%14.0%16.0%18.0%20.0%
- 500
1,000 1,500 2,000 2,500 3,000 3,500 4,000 4,500
2000-05 2006 2007 2008 2009 2010 2011 2012 2013 2014
Y-o-y FDI in food processing sector, India, USD mn
FDI in food processing sector, USD mn % in total FDI, USD mn
Final Report - Krishnapatnam Industrial Node Development Plan PwC/Nippon Koei 98

(i) National level related
(ii) KPT IN level related
Nellore district, and KPT, in particular, has certain drivers that make food processing as one of the most prominent sectors for this site:
Increasing disposable incomes, rapid urbanisation and changing eating habits
•Increasing demand for functional food coupled with awareness about healthy/nutritional foods has increased spending on health foods. Further, changing lifestyles has resulted in willingness to pay premium prices for quality products
Policy drivers
•Government of India has been promoting the concept of Mega Food Parks and is anticipated to set up 50 such parks across the country by the end of 12th Five Year Plan, to attract FDIs
•Low entry barriers•Various tax incentives and policy initiatives taken by the government to increase the share of India processed food industry in the global market has encouraged entrepreneurs to set up food processing units, specially export oriented units
•Sops to private sector participation; 100 per cent FDI under automatic route •Agri Export Zones have been set up; under the government’s Vision 2015 plan, mega food parks to be established
•Approval of National Mission on Food Processing •Launch of Infrastructure Development scheme to increase investments in food processing infrastructure
Availability of resources
•India has numerous advantages like availability of abundant raw materials, the second largest arable land in the world, low labour costs
•Diverse agro-climatic conditions making it suitable for practicing different crops
India emerging as a procurement hub
•India is gradually emerging as a procurement hub for agri related produce. There has been a gradual but significant improvement in product and packaging quality over a period of time, which has infused greater confidence in the importing nations for Indian products
High input base of raw material
Well established food processing
sector in the districtGovernment
supportFavorable location
for exports
Final Report - Krishnapatnam Industrial Node Development Plan PwC/Nippon Koei 99
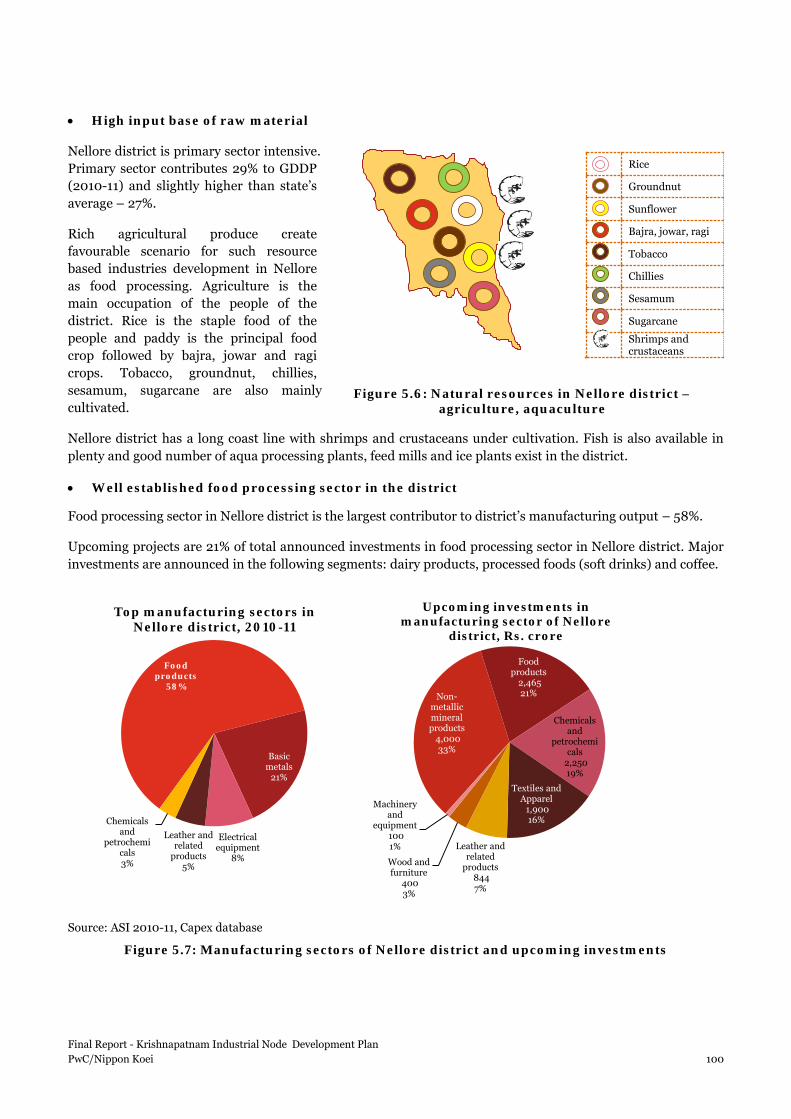
Figure 5.6: Natural resources in Nellore district – agriculture, aquaculture
• High input base of raw material
Nellore district is primary sector intensive. Primary sector contributes 29% to GDDP (2010-11) and slightly higher than state’s average – 27%.
Rich agricultural produce create favourable scenario for such resource based industries development in Nellore as food processing. Agriculture is the main occupation of the people of the district. Rice is the staple food of the people and paddy is the principal food crop followed by bajra, jowar and ragi crops. Tobacco, groundnut, chillies, sesamum, sugarcane are also mainly cultivated.
Nellore district has a long coast line with shrimps and crustaceans under cultivation. Fish is also available in plenty and good number of aqua processing plants, feed mills and ice plants exist in the district.
• Well established food processing sector in the district
Food processing sector in Nellore district is the largest contributor to district’s manufacturing output – 58%.
Upcoming projects are 21% of total announced investments in food processing sector in Nellore district. Major investments are announced in the following segments: dairy products, processed foods (soft drinks) and coffee.
Source: ASI 2010-11, Capex database
Figure 5.7: Manufacturing sectors of Nellore district and upcoming investments
Food products
58%
Basic metals
21%
Electrical equipment
8%
Leather and related
products5%
Chemicals and
petrochemicals3%
Top manufacturing sectors in Nellore district, 2010-11
Non-metallic mineral products
4,000 33%
Food products
2,465 21%
Chemicals and
petrochemicals
2,250 19%
Textiles and Apparel
1,900 16%
Leather and related
products844 7%
Wood and furniture
400 3%
Machinery and
equipment100 1%
Upcoming investments in manufacturing sector of Nellore
district, Rs. crore
Rice
Groundnut
Sunflower
Bajra, jowar, ragi
Tobacco
Chillies
Sesamum
Sugarcane
Shrimps and crustaceans
Final Report - Krishnapatnam Industrial Node Development Plan PwC/Nippon Koei 100

• Government support
Food processing has been announced as one of the thrust sectors for Andhra Pradesh under Industrial Investment Promotion Policy 2010-2015 with special focus on MSMEs
To give a special focus on Food Processing industry the state of Andhra Pradesh has announced Food Processing Policy of Andhra Pradesh 2010-15. Units of horticulture, agriculture, animal husbandry, fisheries, agro food processing industries, allied industries are beneficiaries of the incentives announced under this policy
The Food Parks sanctioned under Mega Food Park scheme of Government of India would be considered for Tailor-made benefits on case to case basis.
• Proximity to port – favorable location for exports
KPT IN is favorably located in immediate vicinity to the Krishnapatnam port. The export oriented units in food processing sector can leverage proximity to the markets of the leading processed food importing countries. The distance to the ports of the some top food processing products importing nations varies from 8.0 days to 22.0 days.
KPT port Port in potential importing country
Average distance by sea route, days
Krishnapatnam port
Port of Shanghai, China 19.3
Port of Toky0, Japan 23.8
Port of Chinae, South Korea 21.6
Port of Hanoi, Vietnam 15.3
Bongkot Terminal, Thailand 10.2
Jurong Port, Singapore 8.0
Anyer Terminal, Indonesia 9.5
Source: ports.com
The figure below depicts the proximity of the node to the leading importing countries of various product groups in food processing sector.
Final Report - Krishnapatnam Industrial Node Development Plan PwC/Nippon Koei 101

Source: intracen.org, ports.com, PwC analysis
Figure 5.8: Share of world imports in food processing product groups of top importing countries in the Southeast Asia; proximity from KPT port
For example, Japan is the largest importer of meat, fish and seafood products in the world. The top exporter contributes 26% to total exports in this product group, whereas India has only 2% share.
Assuming unconstrained scenario, the consultant has taken an example Japan and analyzed India’s exports position in food processing sector exports to this country vs top two exporting nations.
Table 5.3: Share of top exporting countries vs India to Japan in food processing sector
Food processing sub-sector
Exporter - Top 1 % of total FP
imports to Japan
Exporter – Top 2 % of total FP
imports to Japan
India % of total
FP imports to Japan
Time to
reach from Top 1, days
Time to
reach from
Top 2, days
Time to
reach from
India, days
Meat and edible meat offal US 32% Australia 18% 0% 60.3 13.6 23.8
Fish, crustaceans, molluscs, aquatic invertebrates nes
Chile 11% US 11% 4% 67.2 60.3 23.8
Dairy products, eggs, honey, edible animal product nes
Australia 23% New Zealand 22% 1% 13.6 28.2 23.8
Edible vegetables and certain roots and tubers
China 58% US 11% 0% 3.2 60.3 23.8
Edible fruit, nuts, peel of citrus fruit, melons US 33% Philippines 30% 2% 60.3 7.1 23.8
Coffee, tea, mate and Brazil 22% Colombia 13% 3% 59.8 66.2 23.8
Russia
MongoliaKazakhstan
China
North Korea
South Korea
Japan
Taiwan
Singapore
Indonesia
Brunei
Philippines
East Timor
Sri Lanka
Nepal
Myanmar
Vietnam
Laos
Thailand
Cambodia
Malaysia
Pakistan
Afghanistan
Iran
Turkmenistan
Uzbekistan
Tajikistan
Kyrgyzstan
Australia
Bangladesh
Bhutan
17%
56%
12%
12%2%
6%6%
11%
27%
7%34%
1%
2%
3%
1%
1%
2%
3%
6%
12%
4%
4%
3%
4%
5%
2%2%
8%
5%
KPT IN
India
Product group Legend
Meat, fish and seafood food and its preparations
Vegetable, fruit, nut, etc and its food preparations
Cereal, milling products and its preparations
Animal,vegetable fats and oils, cleavage products, etc
Miscellaneous edible preparations
Final Report - Krishnapatnam Industrial Node Development Plan PwC/Nippon Koei 102

Food processing sub-sector
Exporter - Top 1 % of total FP
imports to Japan
Exporter – Top 2 % of total FP
imports to Japan
India % of total
FP imports to Japan
Time to
reach from Top 1, days
Time to
reach from
Top 2, days
Time to
reach from
India, days
spices
Cereals US 67% Canada 11% 0% 60.3 62.2 23.8 Milling products, malt, starches, inulin, wheat gluten
Canada 19% Australia 12% 0% 62.2 13.6 23.8
Oil seed, oleagic fruits, grain, seed, fruit, etc, nes
US 34% Canada 29% 0% 60.3 62.2 23.8
Animal, vegetable fats and oils, cleavage products, etc
Malaysia 38% Italy 11% 3% 9.9 41.9 23.8
Meat, fish and seafood food preparations nes China 44% Thailand 29% 0% 3.2 13.7 23.8
Sugars and sugar confectionery Thailand 38% Australia 19% 0% 13.7 13.6 23.8
Cocoa and cocoa preparations Singapore 22% Malaysia 13% 0% 14.3 9.9 23.8
Cereal, flour, starch, milk preparations and products
China 21% Singapore 15% 0% 3.2 14.3 23.8
Vegetable, fruit, nut, etc food preparations China 43% US 18% 1% 3.2 60.3 23.8
Miscellaneous edible preparations US 17% Thailand 12% 1% 60.3 13.7 23.8
Source: intracen.org, ports.com, PwC analysis
It is evident that India’s share in food processing exports to Japan is quite modest; in spite of it having locational advantage in 12 product groups out of 16.
Key challenges and issues
While India remains a top producer of food, production yield levels are among the lowest amongst the BRIC countries. Even though India is the largest producer of several agricultural commodities, there are high levels of losses in the supply chain. A study conducted by the Central Institute of Post-Harvest Engineering and Technology (CIPHET) in 2010 put the losses in the range of 0.8% to 18% and attributed them to several factors including non-availability of facilities for aggregation, packaging, storage, transportation, and cold chain and low level of processing of agricultural produce.16
There is number of challenges/issues hampering the growth of the food processing sector across the value chain across the country:
16 Economic Survey 2013-14, Agriculture and Food Management, Chapter 8, p. 152, http://indiabudget.nic.in/es2013-14/echap-08.pdf Final Report - Krishnapatnam Industrial Node Development Plan PwC/Nippon Koei 103

Figure 5.9: Value chain in food processing sector
Indian food processing sector has one of the lowest levels of processing activities vis-a-vis other countries.
Table 5.4: Percentage of food processed in India vis-a-vis in developed countries, 2010
Segment India Developed countries Fruits and Vegetables 2.2% 65% Marine 27% 60% Poultry 6% NA Meat 20% 70%
Source: Emerging Markets Insight
This is reflected in the exports basket of the country which is low in high-value added items.
Inputs
Seeds, fertilizers and farm
equipment
Production
Farmers, cooperatives and private companies
Procurement and Storage
Warehouses, cold storage
and silos
Processing
Grading, sorting,
milling and packing
Storage
Warehouses, cold storage
Retailling
Retail shops, malls, cash and carry
Inefficient procurement and aggregation of raw material
Low labour productivity Availability of trained manpower
Food safety laws & inconsistency in state and central policies
ISS
UE
S
Final Report - Krishnapatnam Industrial Node Development Plan PwC/Nippon Koei 104

Source: International Trade Centre (intracen.org), PwC analysis
Figure 5.10: Constitution of food processing exports basket in India – level of processing complexity (value addition), 2003 vs 2013
There is substantial increase in exports of low value added, basic products, from 50% in 2003 to 63% in total food exports. It was mostly on account of increase of low value added exports of meat, fish and seafood product group. Also the dominant share of low value added exports in cereal, milling products and its preparations increased from 90% in 2003 to 93% in 2013.
Below the consultant details and summarizes the issues and challenges of the food processing sector:
• Inadequate Infrastructure Facilities
The inadequate support infrastructure which is the biggest bottleneck in expanding the food processing sector, in terms of both investment and exports includes: long and fragmented supply chain, inadequate cold storage and warehousing facilities, road, rail and port infrastructure. Lack of modern logistics infrastructure such as logistics parks, integrated cold chain solutions, last mile connectivity, dependence on road over rail, customized transportation, technology adoption (barcoding, RFIDs) and government support via incentivizing private public partnerships are some of the gaps that exist in supply chain & logistics sector in India.
Status of current regulated markets by Agricultural Produce Market Committees (APMC) is discouraging in terms of infrastructure facilities. Gaps in Marketing Infrastructure:
- Cold Storage units exist only in 9% of markets - Grading facilities exist in less than 1/3rd of markets
31%
69%
90%
10%
43%
57%
50% 50%56%
44%
93%
7%
44%56%
63%
37%
0%
10%
20%
30%
40%
50%
60%
70%
80%
90%
100%
Basic Medium andHigh
Basic Medium andHigh
Basic Medium andHigh
Basic Medium andHigh
Meat, fish and seafood foodand its preparations
Cereal, milling products andits preparations
Vegetable, fruit, nut, etc andits food preparations
Food processing, total
Levels of complexity (value addition) in major exported food processing sub-sectors in India, 2003 vs 2013
2003 2013
Inadequate infrastructure
facilities
Inefficient procurement and
aggregation of raw material
Food safety laws and Inconsistency in central and state
policies
Productivity levels and availability of trained manpower
Final Report - Krishnapatnam Industrial Node Development Plan PwC/Nippon Koei 105

- Scientific storage is only 30 per cent of the required capacity - Only 11 States have taken initiative under NHM in establishing cold storages and eight states have
established 51 apni mandis, there is virtually no progress in the setting up of wholesale markets except in Kerala
- Lack of cleaning, grading, electronic weighing and quality certification facilities17.
Cold Storage & Warehousing:
According to government estimates, India has 6,300 cold storage facilities (only around 10% in the domain of co- operative/ public sector), with a combined capacity of 30.11 million metric tons that can store less than 11% of what is produced, bulk of which are utilized for a single commodity, such as potatoes. As seen in the chart below, CBIC states have a gap of around 11 million MT in cold storage capacity.
Source: National Spot Exchange (NSE) and DMI
Figure 5.11: Gap in cold storage capacity, 2010, CBIC states, million MT
− A major barrier to cold chain implementation in India is cost. The operating cost for Indian cold chain
storage units are double those of the Western countries (US$ 60 per cubic meter compared to less than US$ 30 in the Western countries). And, a major cost contributor is energy expenses which account for 28% of total expenses in India ass against 10% in Western countries.
− Coupled with cost, are other issues such as lack of backward & forward linkages to supplement cold chain such that commodities which are transported and stored in the cold chain have enough market value to absorb the added cost
− Because of fragmented backward linkages (processor with farmers), the cold chain industry in India is still seen by investors as high on capital, low on volume and requiring a long payback period for the investment
− The warehousing capacity available in India is about 108.75 million MTs, and is projected short by at-least 30% required during the 12th Five Year Plan period.
• Inefficient procurement and aggregation of raw material
Agriculture in India is characterized by highly fragmented land holdings. Fragmented and dispersed nature of crop production leads to lack of predictability of supply and homogeneity in quality required for large- scale food processors. Agricultural trade is characterized by a long supply chain with multiple market intermediary participation.
Identifying the current challenge, Govt. of India has introduced the concepts of Terminal Markets 18 and Contract Farming19. However, until recently, very few states have made reforms at state level in the APMC Act
17 Report of the working group on agricultural marketing infrastructure, secondary agriculture and policy required for internal and external trade, for the 12 Five year Plan 2012-17
Gap1.4
Gap2.0
Gap7.72.3 2.4
7.9
- 1 2 3 4 5 6 7 8 9
Andhra Pradesh Karnataka Tamil Nadu
Gap in cold storage capacity, CBIC states, million MT
Present Capacity Gap Cold Storage Requirement
Final Report - Krishnapatnam Industrial Node Development Plan PwC/Nippon Koei 106
Currently processors need to comply with numerous laws and enforcement agencies at the State level. Multiplicity of legislations has led to conflicting approach, lack of coordination and administrative delays.
On the export front the biggest hurdle for growth in export has been the mismatch in quality between what is produced in India and what is required in the importing countries.
There is lack of adoption of practices such as traceability and certification, which, if followed, could substantially increase trust in Indian food products. Also certain Indian food standards are dated and require revision to improve the quality of Indian processed foods, e.g- the Meat Food Products Order, 1973 (MFPO) is rarely applicable to the current industry.
to enact these concepts. Private sector is also reluctant about participation in such reforms due to excessive politics involved in procurement and operations of such facilities.
• Food safety laws and inconsistency in state and central policies
The Indian food regulations comprise various food policies that have been enacted at different points of time, and are under the ambit of various ministries of government of India. Historically they were introduced to complement and supplement each other in achieving total food sufficiency, safety and quality. The result is that the food sector in India is governed by a number of different statutes rather than a single comprehensive enactment. This incremental approach has led to incoherence and inconsistency in the food sector regulatory scenario. In addition the multiplicity of ministries and administering authorities at both the central and state level has resulted in a complex regulatory system that is not well integrated adding an additional burden on the food industry.
Another challenge is the multiple tax regimes. Commission charges, market fee(varies generally between 0.50% to 2.00%), octroi/ entry tax imposed by certain states, sales tax, weighing charges, labour charges for handling ,loading and unloading, though varying from state to state and commodity to commodity is estimated to be approximately more than 12% of the total value of produce marketed . Also the 12% excise duty on packaging material for food processing industry is high considering that packaging material constitutes a significant proportion of the cost of the processed foods (50-55% in case of packaged juices, 35-40% for jams and potato chips). In contrast, several countries like Ireland, UK etc. provide a differential treatment to food products and do not levy any taxes on these segments. In Germany, the overall tax burden on corporates has reduced below 30% and corporate income tax is only 15% on all corporate taxable incomes as against above 30% in India. Such competitive tax regime has facilitated huge foreign investments in the country.
• Low labour productivity
Another critical issue in India hampering food processing industry is low labour productivity. The level and structure of the Indian food processing industry reflects that food production is mainly constrained due to lack of productivity augmenting technologies, low capacity utilization of plant, low level of processing technology, over staffed operations and poor management of seasonal variations. Compared to other countries labour productivity in the food processing sector in India in 2012 was USD 10,1o3, which is twice lower than in China and almost three times lower than in Brazil.20
Most of the food processing units in India are small scale and their inability to scale up has often resulted in inefficiencies in operations. Small scale units find it capital intensive to invest in critical areas of efficiency such as state of art technology and manufacturing equipment, trained manpower, quality and certification systems, marketing & promotion.
18 Terminal markets operate on a hub and spoke model where the markets form the hubs, and are linked to different collection centres (spokes) that are located close to the production centres. It serves as an assembly, processing and trading place for agricultural commodities. 19 Contract Farming is an agreement between the food processor (contractor), typically a large organized player, and the farmer, whereby the farmer is contracted to plant the contractor’s crop on his land and deliver a quantum of produce, based upon anticipated yield and contracted acreage at a pre-agreed price. The food processor provides inputs in terms of technology and training to the farmer, to improve the yield and quality of the produce. 20 Agro-Industries for Development, UNIDO Final Report - Krishnapatnam Industrial Node Development Plan PwC/Nippon Koei 107

• Lack of adequate trained manpower
Many positive developments in the food processing sector have also resulted in the apprehension about the emerging skill shortages due to mismatch between the demand for specific skills and available supply. In fact, of late, shortage of skilled, semi-skilled and unskilled workers has emerged as a critical factor impacting the competitiveness of Indian food industry. At each level in the value chain, there are strong deficiencies in technical knowhow and support.
Apart from the above major challenges hampering the growth of sector include constraints in raw material production, taxation, access to credit, processing plants with obsolete technologies, lack of applied research etc.
Benchmarking Against International Competition
The consultant has studied various parameters that are critical to achieve competitiveness in the manufacturing sector along with the progression of India vis-à-vis competing countries on the competitiveness protocol. The consultant presents the results of the benchmarking exercise below:
Cost Structure
Cost structure encompasses all the expenses that a firm must take into account when manufacturing and selling a product. Various types of costs that are benchmarked in this section are: Raw material costs, labour costs (including wages), Energy costs, Interest charges, distribution expenses (including transportation & logistics, etc.)
Source: www.enterprisesurveys.org, The World Bank
Figure 5.12: Cost structure – food processing sector
India has very high raw material costs though slightly better than Thailand but lagging behind China and Brazil by a huge margin. Energy costs in India which are affected more by government action than by market forces are almost at par with the competing countries.
There is lack of raw-material standardization in Indian food processing industry. Very few units have developed linkages with the farmer to get assured supply of the required standard of raw material. There is the need to not only develop linkages with the raw material supplier but also ensuring complete post harvesting infrastructure necessary to keep the produce in a standardized form which is cost efficient for the industry. As a result, raw-materials for fruits and vegetable processing like pulps, dried vegetables etc. are imported. Most of the firms who are engaged in exports of processed food rely on imports for their critical raw-material. For meat & poultry industry as well, there is lack of standardization of inputs.
58%
5% 8%0.6% 1.4%
4%
38%
-
12%
- 4%9%
37%
5%
22%
- -
12%
62%
7%12%
- - -0%
10%20%30%40%50%60%70%
Raw material cost Energy cost Labour cost Land & building cost Interest charges Transportation /logistics
Cost break-up as % of total sales, Food processing sector
India China Brazil Thailand
Final Report - Krishnapatnam Industrial Node Development Plan PwC/Nippon Koei 108

Productivity
Labour productivity is the measure taken for benchmarking the productivity of Indian food processing industry vis-à-vis competing countries. Labour productivity has been estimated as a ratio of Gross value added (GVA) to the number of workers.
Source: UNIDO
Figure 5.13: Labour productivity for food processing (fish & seafood) sector
Higher labour productivity of competing countries is one of the sources of competitive advantage over India, as shown in the figure above.
India has slight advantage over Thailand in terms of labour productivity in fish and seafood segment, while China emerges as a leader having labour productivity more than double against competing countries (both in fish and seafood and fruits and vegetables sub-sectors. China has a huge labour force as compared to India but manages to have very high gross value added.
The primary reason is lack of processing in all the food segments in India due to which overall value addition is minimized. Another reason is lack of technology available for food processing. There is limited availability of food processing machinery, most of which has to be imported. Food processing sector, being dominated by MSMEs; very few of these firms are able to afford imported machinery and hence reliance is on manual processing.
Process time
Process time is a very important parameter for competitiveness as it is indicative of the overall time a firm uses for production and reach to the target market. Countries which are able to achieve faster turnaround time and have quicker time to market will enjoy competitive advantage in the market.
10,103 20,702 8,052
29,710
126,079
-
50,000
100,000
150,000
India China Thailand Brazil USA
Labour productivity in food processing, (USD per employee)
Labour productivity in food processing, (USD per employee)
Final Report - Krishnapatnam Industrial Node Development Plan PwC/Nippon Koei 109

Source: Study on Innovative Interventions required in Manufacturing Sectors to make them Globally Competitive, Dun & Bradstreet Information Services India Private Limited, Mumbai [2013], http://dsir.csir.res.in/webdsir/#files/reports/isr1/food_processing.html
India stands at clear point of disadvantage as compared to competing countries (China, Brazil & Thailand) because of higher process time as depicted in the figure above.
While overall process time is almost same in all the countries, time to market for Indian companies especially in export markets is higher primarily because of longer time taken for both custom clearances for exports of finished goods and import of raw materials in India.
India’s disadvantage implies that, the delivery of imported raw material to the factory is delayed which could delay the entire production process. Further, delay in custom clearance of exports means that the delivery to the overseas market is delayed by a fair margin which means delivery with tight schedules would have to suffer and markets would look for other supplier countries for such kind of products.
Case studies – Success factors in select leading countries in food processing
NETHERLANDS
The Netherlands is the world's second largest exporter of agricultural products, after the USA. Together with the USA and France, the Netherlands is one of the world's three leading producers of vegetables and fruit. It supplies a quarter of the vegetables that are exported from Europe. The agri-business is one of the driving forces behind the Dutch economy.
At the same time, it poses challenges to the environment. In recent decades, farms became larger in scale and production became more intensive. As a result, fertilizers and manure made more impact on the countryside.
Farming had to become more sustainable, the Dutch government said. Today, the Dutch agricultural sector is strongly focused on sustainability: it is a source of healthy, safe food that is produced with respect for the landscape and the environment.21
Key success factors of food processing sector in Netherlands
MALAYSIA
Malaysia is one of the leading countries in term of food processing sector. The food-processing sector account for about 10% of Malaysia’s manufacturing output.
21 http://www.hollandtrade.com/sector-information/agriculture-and-food/?bstnum=4909
Expertise, infrastructureand logistics are all on an extremely high level in the Netherlands
Continually investing in the renewal of agricultural production chains
Farmers and growers are full partners in the agricultural production chain
Substantial ivestments in environmental protection and implemented improvements in animal welfare
Figure 5.14: Process time taken for production and reaching to market
3.5 3.5
1.5 1.51.5 1.51.5 1.5
0
2
4
Days taken for custom clearence for exports Days taken for custom clearence for imports
Number of days for EXIM custom clearance
India China Brazil Thailand
Final Report - Krishnapatnam Industrial Node Development Plan PwC/Nippon Koei 110

Processed foods are all over the world. Especially, Malaysia is the world’s largest exporter and the second world’s largest producer of palm oil in the world.
Malaysia and Indonesia account for more than 85 % of the world palm oil output and about 93% of global exports of palm oil22.
Key success factors of food processing sector in Malaysia
• Support for Integrated Logistic Service Given that the need to ensure that the service providers subscribe to industry practices such as “just-in-time” and to point deliveries The Government has introduced the ILS incentive in 2002 to encourage logistics service providers to consolidate or integrate their activities and become Third Party Logistics Service Providers (3PLs). As at 31 December 2007, a total of 20 companies have been granted the Integrated Logistics Services (ILS) incentives23.
• Quality Control encouragement Food manufacturers are certified by the internationally recognized MS ISO 9001:2000 Certification of Quality Systems in terms of production, installation and servicing. SIRIM QAS, a wholly-owned subsidiary of SIRIM Bhd., acts as a leading certification, inspection and testing body in Malaysia. For the purpose of health certification, MOH is putting continuous efforts in upgrading of laboratories in the MOH and Department of Chemistry with sophisticated and advanced instrumentation.
• Storing Marketing Support Marketing support is provided by agencies such as the Malaysia External Trade Development Corporation (MATRADE) and FAMA (Federal Agricultural Marketing Authority) through their wide network of local and international offices.
• Dedicated R&D facilities The Malaysian Agricultural Research and Development Institute (MARDI) focuses on the development of value-added products, with some of its research projects ready for commercialization. In addition, there are research institute for food processing including product specific research institutes, The Malaysian Agricultural Research and Development Institute (MARDI), The Malaysian Palm Oil Board (MPOB), Malaysian Cocoa Board (MCB), The Forest Research Institute of Malaysia (FRIM), The Fisheries Research Institute (FRI).
22 Food Industry in Malaysia 23 OCCUPATIONAL STRUCTURE Integrated Logistics Services Industry
Support for services sector including logistics
Quality control encouragement
Strong marketing support
Dedicated R&D facilities
Final Report - Krishnapatnam Industrial Node Development Plan PwC/Nippon Koei 111

Key Design Implications
Based on the previous reports and discussions above, the top issues and implications for the node design that need to be resolved to ensure Krishnapatnam emerges as a top destination for food processing can be broadly classified around the three main areas:
Specific issues identified by food processing units located in close proximity to the proposed node in Nellore district and implications to be considered in design of the industrial node are summarized below:
Table 5.5: Key design implications for food processing sector
Components Issues Design Implication
Economic enhancers
Connectivity
• Lack of last mile connectivity • Access road from Krishnapatnam port to
Node area is an unpaved single lane road • Connectivity to the node from the highway
is a single lane road
• Access road to Krishnapatnam and connectivity to NH-5 has to be improved. Krishnapatnam port trust has acquired land across the highway and widening activity is proposed
• Access to South (6 lane road) running from Naidupet (NH 5) via Kota and new industrial park to Krishnapatnam Port with length of about 50 km are proposed
• A grid type road network will be followed • Three north-south trunk roads and east-west trunk roads each are planned
Water
• Water shortages in the Nellore district are persistent especially due to monsoon failures
• Availability of water to the production (units located in government industrial parks are facing this issue)
• Salinity of ground water due to proximity to the seaside
• Marine food specific: − High tide affects water quality & salinity
• Creation of water management facilities • Maintenance of creeks/water sources, creation of canals, etc. • Quality water supply assurance by the node development and management authorities is required.
The following arrangement has been proposed for the node: o APIIC has requested for the allocation water of 1.5 TMC from Kandaleru reservoir through
letter vide CE-I/APIIC/CBIC/08/2015-16 dated 23-05-2015 o Krishnapatnam Water Supply Company (KPWSC) has proposed to supply 0.5 TMC out of this
1 TMC water to the Krishnapatnam node through the newly-developed distinct pipeline. If this proposal is approved, 39 MLD (0.5 TMC/year) of water would be allocated to the Krishnapatnam Node, thus water will be in abundance
Economic enhancers
•Development of quality integrated industrial infrastructure
•Easy acess to consumption markets and gateways to markets
•Reliable availability of FoPs
Value enhancers
•Productivity enhancement•Efficiency in resource use•Technological readiness and upgradation•Skill development•Researc h and development•Value addition
Administrative enhancers
•Institutional reforms and eash of doing business•Regulatory and policy support
Final Report - Krishnapatnam Industrial Node Development Plan PwC/Nippon Koei 112

Components Issues Design Implication severely affects the growth of shrimps
− Ineffective maintenance of canals doesn’t allow water from the sea to come inside and mix with fresh river waters
• It is expensive to convey the treated sewage from Nellore City to Krishnapatnam Node given 35 km distance. However, treated sewage from the STPs can be a reliable potential water resource for industrial water in Krishnapatnam Node
• A desalination plant has been identified by the food processing units as one of the utmost requirements for the area. Desalination plant would be considered if the planned water supply project and the recycling system cannot satisfy the future water demand in the node
• Drainage system may require a pumping system because the node area is wide flat land
Environment
• Development of port, other industries disrupts production
• Lack of drainage for common water for the industries
• Careful planning of new industries is required as the segment is highly sensitive to water contamination
• Introduction of green principles in manufacturing is to be promoted • Common effluent treatment plant can be developed by the government for similar industries
within the district
Power
• For certain segments of food processing sector power cost is around 10-20% variable cost
• Stakeholders are of the opinion that power tariffs are high in the region
• In medium term, power tariff subsidies for food processing industries in the corridor (for example, for the first 10 years of operation) can be considered.
• After bifurcation of Andhra Pradesh into Andhra and Telangana, AP is a power surplus state. Stakeholders of Nellore district noted improvement of power supply scenario compared to the situation 1-1.5 years back. Further, regular vigilance on demand and supply of power on par with the growth in industries is required.
Logistics facilities
• Existing units experience issues with availability of trucks and tankers in vicinity • Introduction of logistics hub in the node should facilitate
Storage facilities • Manufacturing capacities of processing
units have increased, but storage facilities are inadequate
• Support to units to create additional cold storage facilities is expected • Government can develop cold storage facilities in close vicinity of the markets and end consumers • To encourage investment in cold chain infrastructure, government may consider providing
incentive 5 years for construction of modern automated warehouses and cold chains.
Value enhancers
R&D facilities
• International practice suggests availability of R&D facilities for new product development within industrial park
• Marine related: The initial component of the value chain is imported; R&D facilities for breeding SFP breeders are not available
• R&D laboratories can be proposed to serve the product development requirement of this industrial node as well as other food processing units within CBIC/country
• Marine food related: Though almost the entire value chain is present in the country, it would be beneficial to develop indigenous capabilities for breeding SPF species
Manufacturing/ Processing Skills
• At present only unskilled labour is utilized in the processing units given the nature of job and lack of processing capacities of raw food products
• Processing of the raw food articles can help improve the overall value of the product but
• Processing can improve the value of the end product and fetch better prices for the food articles in the international market
• Investment in training and skilled labour will help achieving the above • Training centre can be proposed to be setup for training existing employees
Final Report - Krishnapatnam Industrial Node Development Plan PwC/Nippon Koei 113

Components Issues Design Implication this will require skilled labour
Value addition activity
• Since majority of industry consists of small units, it is difficult to access advanced technology and machinery. Lack of technology adaption causes low labour productivity and low value additions.
• Government of Andhra Pradesh may consider additional financial scheme to encourage procurement of upgraded machinery
• Development of research center/center of excellence for value addition in food processing sector can be proposed in KPT IN. The center can explore tie ups with various organizations and research institutions abroad to emerge as a hub for new product development. It will help catering to the requirement of new products development higher on value addition
• New Product Development Center Development of research center for value addition in food processing sector can be proposed in KPT IN. The center can explore tie ups with various organizations and research institutions abroad to emerge as a hub for new product development. It will help catering to the requirement of new products development higher on value addition
Administrative enhancers
Ease of doing business
• 65 departments (pollution related, food safety related, labour related) are to be approached for clearances by an industrial unit. Labor issues are also being dealt by different departments
• Simplification of licensing system and reduction of the number of licenses is necessary. • Duplicating licenses is to be removed. Single window system is to be promoted. • In the opinion of existing units in the area, Factories department may act as a single point of
contact and take care of all industries required by any industrial unit.
Policy and regulatory framework
• Existing policies to facilitate food processing sector in Andhra Pradesh have expired this year
• Power related: no adequate mechanisms for the companies buying power from open access
• Provide policy extension/introduce new policies/schemes for the sector • In case of power holiday for entire day, companies that should be given incentives to trade power
for the whole day and get compensated. mechanisms for companies which buy power from open access should be established
Quality Control
• The lack of adherence to international food standards and quality norms restricts imports of processed food
• The existing Indian standards are outdated and not harmonized with international standards.
• Lack of in-house quality control and testing facilities in conformity with the international standards. This is proving to be critical bottleneck in exports of products
• GoAP should promote awareness on quality standards needs to be created through seminars, newsletters and training programmes
• Food Processing units should be encouraged to implement Standards such as ISO, HACCP etc
Final Report - Krishnapatnam Industrial Node Development Plan PwC/Nippon Koei 114

5.2.2 Metallurgy
Sector performance
In 2012, Indian metallurgy sector registered an output of around US$ 140 billion24 and contributed to around 2% of the national GDP25. In terms of sub-sectoral contribution, Iron and Steel industry contributes to around 80% of the sectoral GDP. At constant prices, the sector has registered growth of around 14% CAGR between 2003-04 and 2011-12. The high growth rate has been primarily driven by Iron and steel industry, which grew at 14.6% during the period.
Source: Annual survey of Industries, PwC Analysis
Figure 5.15: Contribution of sub-sectors to metallurgy sector GDP
However, between 2011-12 and 2013-14, India registered a slow growth rate in manufacturing sector as a whole, with 2.7%, 1% growth rates in successive periods from 2012-13 to 2013-14. In line with national GDP and manufacturing GDP, the growth rates during these two years are expected to be around 1%. Going forward, the national demand for the sector is expected to grow between 6-8%26.
Source: ASI data, PwC analysis, Rajya Sabha replies
Figure 5.16: Growth rate of India’s GDP vs. Metallurgy sector
Globally, metallurgy sector comprising iron & steel, aluminium, copper, nickel, lead, zinc, tin, silver and other basic metals, provides key inputs for a number of industries in the manufacturing sector. In 2012, at around US$ 855 billion, metallurgical sector constituted around 5% of global trade. The sectoral demand also drives the
24 Exchange rate of 60 Rs = 1 US$ 25 Annual survey of industries data, MOSPI and PwC Analysis 26 Based on long term India GDP projections by IMF and Standard chartered, and sectoral elasticity co-eff to GDP as indicated by Working group on Iron and Steel,2012
0
20
40
60
80
100
120
140
160
180
2003-04 2004-05 2005-06 2006-07 2007-08 2008-09 2009-10 2010-11 2011-12 (p)
Iron and steel contributes around 80% of sectoral GDP
Basic Iron & Steel Other precious & non-ferrous metal Casting of metals
5%
6%
6%
7%
7%
8%
8%
2014 2015 2016 2017 2018 2019 2020 2021 2022 2023 2024 2025 2026 2027 2028 2029 2030 2031 2032 2033
Growth rate of India’s GDP vs. Metallurgy sector
India GDP growth rate Sector growth rate
Final Report - Krishnapatnam Industrial Node Development Plan PwC/Nippon Koei 115
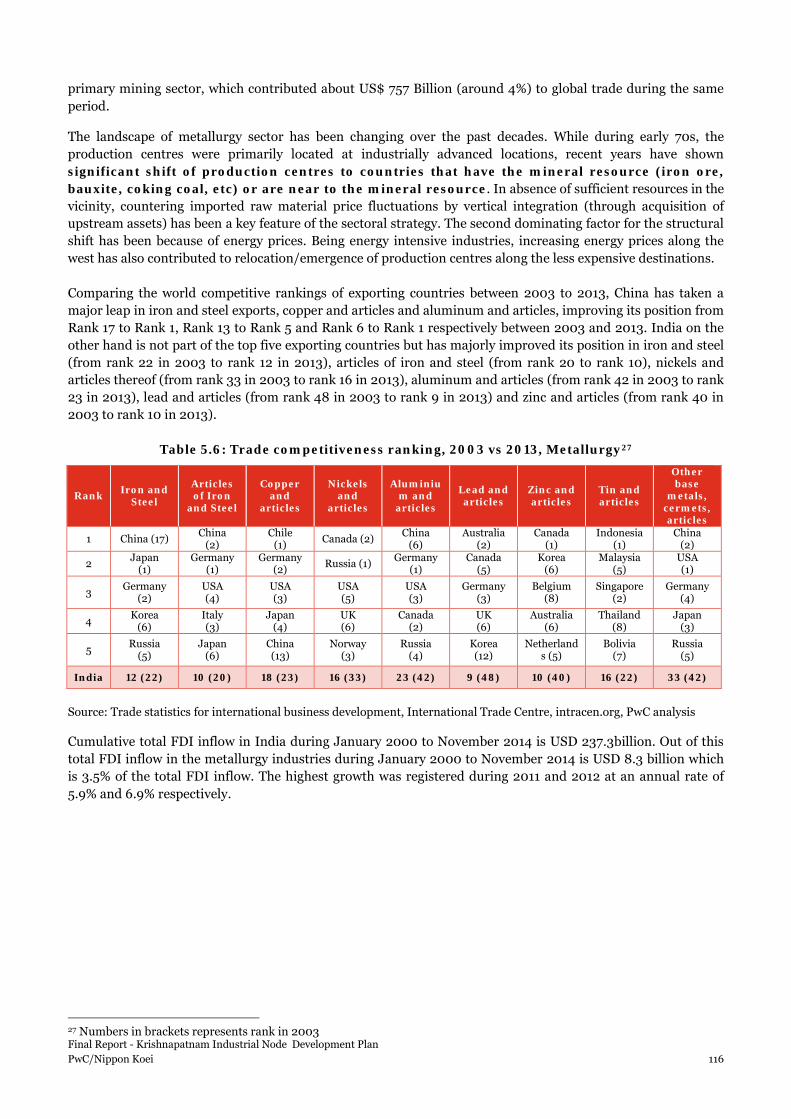
primary mining sector, which contributed about US$ 757 Billion (around 4%) to global trade during the same period.
The landscape of metallurgy sector has been changing over the past decades. While during early 70s, the production centres were primarily located at industrially advanced locations, recent years have shown significant shift of production centres to countries that have the mineral resource (iron ore, bauxite, coking coal, etc) or are near to the mineral resource. In absence of sufficient resources in the vicinity, countering imported raw material price fluctuations by vertical integration (through acquisition of upstream assets) has been a key feature of the sectoral strategy. The second dominating factor for the structural shift has been because of energy prices. Being energy intensive industries, increasing energy prices along the west has also contributed to relocation/emergence of production centres along the less expensive destinations. Comparing the world competitive rankings of exporting countries between 2003 to 2013, China has taken a major leap in iron and steel exports, copper and articles and aluminum and articles, improving its position from Rank 17 to Rank 1, Rank 13 to Rank 5 and Rank 6 to Rank 1 respectively between 2003 and 2013. India on the other hand is not part of the top five exporting countries but has majorly improved its position in iron and steel (from rank 22 in 2003 to rank 12 in 2013), articles of iron and steel (from rank 20 to rank 10), nickels and articles thereof (from rank 33 in 2003 to rank 16 in 2013), aluminum and articles (from rank 42 in 2003 to rank 23 in 2013), lead and articles (from rank 48 in 2003 to rank 9 in 2013) and zinc and articles (from rank 40 in 2003 to rank 10 in 2013).
Table 5.6: Trade competitiveness ranking, 2003 vs 2013, Metallurgy27
Rank Iron and Steel
Articles of Iron
and Steel
Copper and
articles
Nickels and
articles
Aluminium and
articles
Lead and articles
Zinc and articles
Tin and articles
Other base
metals, cermets, articles
1 China (17) China (2)
Chile (1) Canada (2) China
(6) Australia
(2) Canada
(1) Indonesia
(1) China
(2)
2 Japan (1)
Germany (1)
Germany (2) Russia (1) Germany
(1) Canada
(5) Korea
(6) Malaysia
(5) USA (1)
3 Germany (2)
USA (4)
USA (3)
USA (5)
USA (3)
Germany (3)
Belgium (8)
Singapore (2)
Germany (4)
4 Korea (6)
Italy (3)
Japan (4)
UK (6)
Canada (2)
UK (6)
Australia (6)
Thailand (8)
Japan (3)
5 Russia (5)
Japan (6)
China (13)
Norway (3)
Russia (4)
Korea (12)
Netherlands (5)
Bolivia (7)
Russia (5)
India 12 (22) 10 (20) 18 (23) 16 (33) 23 (42) 9 (48) 10 (40) 16 (22) 33 (42)
Source: Trade statistics for international business development, International Trade Centre, intracen.org, PwC analysis
Cumulative total FDI inflow in India during January 2000 to November 2014 is USD 237.3billion. Out of this total FDI inflow in the metallurgy industries during January 2000 to November 2014 is USD 8.3 billion which is 3.5% of the total FDI inflow. The highest growth was registered during 2011 and 2012 at an annual rate of 5.9% and 6.9% respectively.
27 Numbers in brackets represents rank in 2003 Final Report - Krishnapatnam Industrial Node Development Plan PwC/Nippon Koei 116
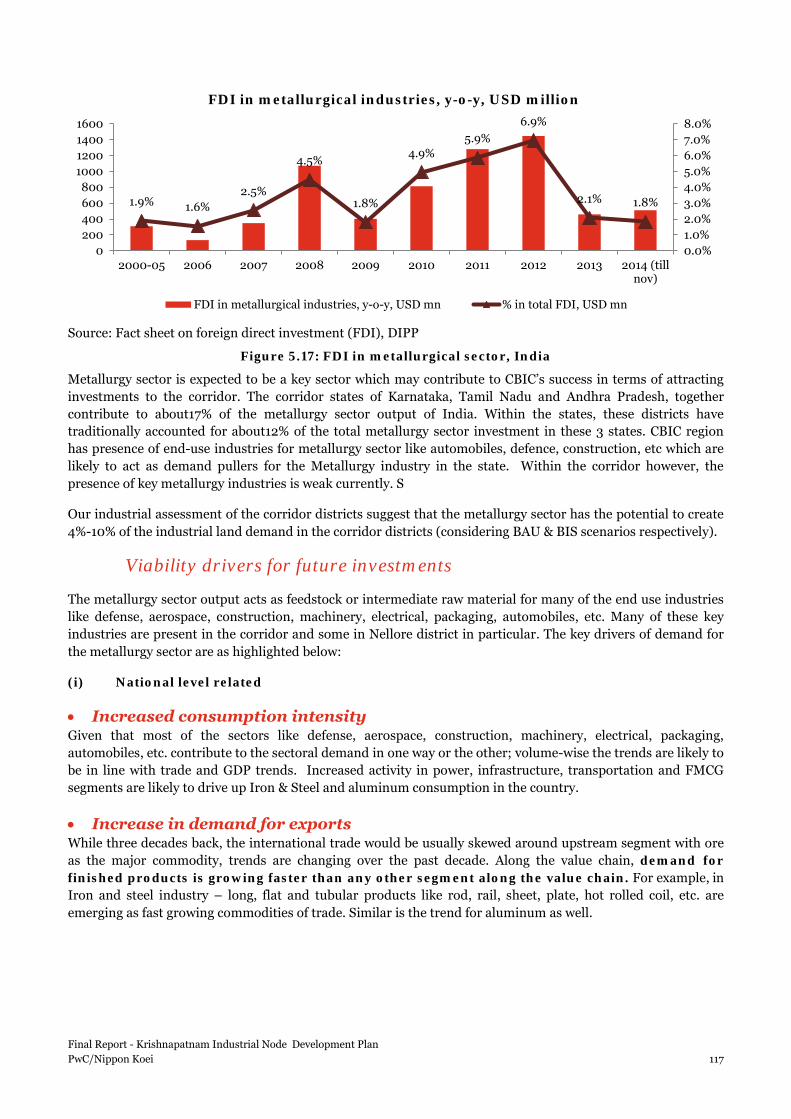
Source: Fact sheet on foreign direct investment (FDI), DIPP
Figure 5.17: FDI in metallurgical sector, India
Metallurgy sector is expected to be a key sector which may contribute to CBIC’s success in terms of attracting investments to the corridor. The corridor states of Karnataka, Tamil Nadu and Andhra Pradesh, together contribute to about17% of the metallurgy sector output of India. Within the states, these districts have traditionally accounted for about12% of the total metallurgy sector investment in these 3 states. CBIC region has presence of end-use industries for metallurgy sector like automobiles, defence, construction, etc which are likely to act as demand pullers for the Metallurgy industry in the state. Within the corridor however, the presence of key metallurgy industries is weak currently. S
Our industrial assessment of the corridor districts suggest that the metallurgy sector has the potential to create 4%-10% of the industrial land demand in the corridor districts (considering BAU & BIS scenarios respectively).
Viability drivers for future investments
The metallurgy sector output acts as feedstock or intermediate raw material for many of the end use industries like defense, aerospace, construction, machinery, electrical, packaging, automobiles, etc. Many of these key industries are present in the corridor and some in Nellore district in particular. The key drivers of demand for the metallurgy sector are as highlighted below:
(i) National level related
• Increased consumption intensity Given that most of the sectors like defense, aerospace, construction, machinery, electrical, packaging, automobiles, etc. contribute to the sectoral demand in one way or the other; volume-wise the trends are likely to be in line with trade and GDP trends. Increased activity in power, infrastructure, transportation and FMCG segments are likely to drive up Iron & Steel and aluminum consumption in the country.
• Increase in demand for exports While three decades back, the international trade would be usually skewed around upstream segment with ore as the major commodity, trends are changing over the past decade. Along the value chain, demand for finished products is growing faster than any other segment along the value chain. For example, in Iron and steel industry – long, flat and tubular products like rod, rail, sheet, plate, hot rolled coil, etc. are emerging as fast growing commodities of trade. Similar is the trend for aluminum as well.
1.9% 1.6%2.5%
4.5%
1.8%
4.9%5.9%
6.9%
2.1% 1.8%
0.0%1.0%2.0%3.0%4.0%5.0%6.0%7.0%8.0%
0200400600800
1000120014001600
2000-05 2006 2007 2008 2009 2010 2011 2012 2013 2014 (tillnov)
FDI in metallurgical industries, y-o-y, USD million
FDI in metallurgical industries, y-o-y, USD mn % in total FDI, USD mn
Final Report - Krishnapatnam Industrial Node Development Plan PwC/Nippon Koei 117

ource: World Steel Organisation, PwC analysis
The government has also provided strong policy level support to the sector to ensure higher investment and growth of the sector:
(i) FDI up to 100% is permitted under the Automatic Route to explore and exploit all non-fuel and non-atomic minerals and process all metals as well as for metallurgy
(ii) Government of India is encouraging private ownership for steel operations and other high priority industry
(iii) Profits of companies producing specified metals are given tax concession under the Income Tax Act (iv) Government of India significantly reduced the duty payable on finished steel products and has
streamlined the associated approval process
(ii) KPT IN level related
• High input base of raw material
Source: District domestic product - AP 2004-05 to 2010-11, Directorate of Economics and Statistics, GoAP, PwC analysis
Nellore district has a rich mineral base and an industrial setup for metallurgy products. Major minerals available in the district include Mica, Quartz, Feldspar, Iron Ore and Barytes. Other major constituents are Silica Sand and Latarite occurring in major parts of the district.
Natural resources - minerals
Laterite
Mica
Quartz
Iron ore
Barytes
Silicasand
Nellore district
Figure 5.19: Natural resources of Nellore district
Figure 5.18: Growth in trade of iron and steel commodities
0
2
4
6
8
10
12
14
2003 2004 2005 2006 2007 2008 2009 2010 2011 2012
Yearly trade volume of Iron and steel commodities expressed as 'x' times of 2003 trade volume
Iron Ore Pig Iron Ingots and semis Long, flat and tubular products World Indirect Import of Steel
Final Report - Krishnapatnam Industrial Node Development Plan PwC/Nippon Koei 118

Figure 5.20: Manufacturing sectors of Nellore district, 2010-11
• Well established Metallurgy sector in the district
Mining and Metallurgy sector as part of the primary sector is the smallest contributor to the district’s GDP. However, it has rapidly grown over the 7 years of present analysis (2005-2011) at 41% CAGR. In 2010-11, 21% of the manufacturing share was of the basic metals sector.
• Proximity to port – favorable location for exports
KPT IN is favorably located in immediate vicinity to the Krishnapatnam port. The export oriented units in metallurgy sector can leverage proximity to the markets of the leading metallurgy importing countries. The distance to the ports of the some top metallurgy products importing nations varies from 8.0 days to 22.0 days.
KPT port Port in potential importing country
Distance, days
Krishnapatnam port
Port of Shanghai, China 19.3
Port of Tokyo, Japan 23.8
Port of Chinae, South Korea 21.6
Port of Hanoi, Vietnam 15.3
Bongkot Terminal, Thailand 10.2
Jurong Port, Singapore 8.0
Anyer Terminal, Indonesia 9.5
The figure below depicts the proximity of the node to the leading importing countries of various product groups in metallurgy sector and the size of opportunity present for the Node.
Food products
58%
Basic metals21%
Electrical equipment
8%
Leather and related products
5%
Chemicals and petrochemicals
3%
Top manufacturing sectors in Nellore district, 2010-11
Final Report - Krishnapatnam Industrial Node Development Plan PwC/Nippon Koei 119

Source: intracen.org, ports.com, PwC analysis
Figure 5.21: Share of world imports in metallurgy product groups of top importing countries in the Southeast Asia; proximity from KPT port
For example, China is the major importer of metallurgy sector products in the world. The top exporter contributes 17% to total exports in this segment, whereas India has only 2.5% share.
Assuming unconstrained scenario, the consultant has taken an example of China and analyzed India’s position in metallurgy sector exports to this country vs top two exporting nations.
Table 5.7: Share of top exporting countries vs India to China in metallurgy sector
Food processing sub-sector
Exporter - Top 1 % of total FP
imports to China
Exporter – Top 2 % of total FP
imports to China
India % of total
Metallurgy
imports to Japan
Time to
reach from Top 1, days
Time to
reach from
Top 2, days
Time to
reach from
India, days
Iron and Steel Japan 38% Korea 19% 2% 10.6 7.6 19.3 Articles of iron or steel Japan 23% Germany 19% 1% 10.6 47.3 19.3
Copper and articles thereof Chile 20% Japan 8% 4% 47.3 10.6 19.3
Nickel and articles thereof Russia 27% Australia 17% 0% 15.7 23.1 19.3
Aluminum and articles thereof USA 20% Korea 12% 1% 78.7 7.6 19.3
Russia
MongoliaKazakhstan
China
North Korea
South Korea
Japan
Taiwan
Singapore
Indonesia
Brunei
Philippines
East Timor
Sri Lanka
Nepal
Myanmar
Vietnam
Laos
Thailand
Cambodia
Malaysia
Pakistan
Afghanistan
Iran
Turkmenistan
Uzbekistan
Tajikistan
Kyrgyzstan
Australia
Bangladesh
Bhutan
9%
29%
5%
3%1%
4%
1%8% 4%
1%
4%
5%
6%
2%
2%
3%3%
1%
4%1%
1%
KPT IN
India
Product group Legend
Iron and Steel and its articles
Copper and its articles
Aluminum and its articles
Final Report - Krishnapatnam Industrial Node Development Plan PwC/Nippon Koei 120

Food processing sub-sector
Exporter - Top 1 % of total FP
imports to China
Exporter – Top 2 % of total FP
imports to China
India % of total
Metallurgy
imports to Japan
Time to
reach from Top 1, days
Time to
reach from
Top 2, days
Time to
reach from
India, days
Lead and articles thereof Canada 17% Vietnam 14% 0% 56 2.8 19.3
Zinc and articles thereof Australia 23% Kazakhstan 16% 4% 23.1 NA 19.3
Tin and articles thereof Indonesia 30% Bolivia 14% 0% 9.6 55.8 19.3
Other base metals, cermets, articles thereof
Congo 31% USA 14% 0% 42.8 78.7 19.3
Source: intracen.org, ports.com, PwC analysis
It is evident that India’s share in metallurgy exports to China is quite modest; in spite of it having locational advantage in 7 product groups out of 9. However, only three products can be considered viable for exports as the remaining constitute insignificant share in total metallurgy export basket from India.
Key challenges and issues
Power supply
Metallurgy is a power intensive industry and about 16-18% of the production cost is dedicate to power. In Nellore district, as we understand from manufacturers, the availability of power is the major issue. They observe almost 40% power cuts as well as peak hour restriction (6-10 PM). If the operations are interrupted, the furnace takes about 2 hours to start which affects the overall efficiency of the plant.
Poor connectivity
The inadequacy of infrastructure is related to the absence of proper transportation and logistics facilities. The railway connectivity in most key mining states is poor and it has inadequate capacity for volumes to be transported which adds to the overall supply chain cost. Significant initiatives are required from Indian Railways through private participation to address the anticipated logistics requirement of the mining and manufacturing industries, the risk foreseen is too significant in magnitude to hamper the growth of industry.
High cost of capital
A substantial amount of working capital is required by metallurgy machine manufacturer as the cycle time is long, running sometimes into a few years. The Indian Capital Goods industry suffers a major disadvantage on interest rates when compared with foreign manufacturers. This in itself adds to the cost of Indian Capital, making them non-competitive against imports by at least 10%.
In addition, foreign manufacturers are offered deferred LC payments of 1-2 years placing Indian manufacturers at a major disadvantage. While foreign companies can raise working capital loans at 2-4 % interest on LCs, Indian companies do not get such LCs from buyers, and raising finance even at 14-16% becomes difficult.
Low level of value addition
Value addition in metallurgy products is still low in India when compared to other major exporting countries in the world. 94% of total exports in metallurgy from India are from iron and steel and its articles, copper and its articles and aluminum and its articles. When metallurgy products complexity levels (value addition) of the Indian export are compared with the one of the world top three exporting countries, viz. China, Germany and USA, there is a high percentage of products in the basic level of product complexity category being exported
Final Report - Krishnapatnam Industrial Node Development Plan PwC/Nippon Koei 121
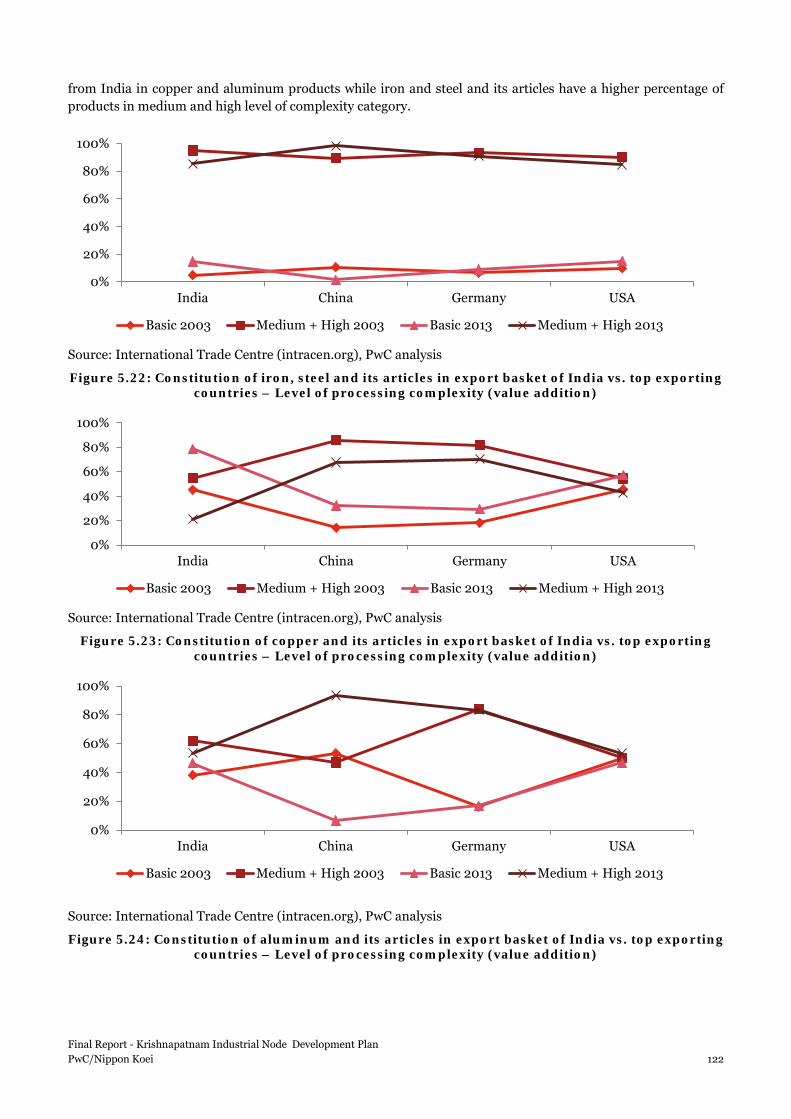
from India in copper and aluminum products while iron and steel and its articles have a higher percentage of products in medium and high level of complexity category.
Source: International Trade Centre (intracen.org), PwC analysis
Figure 5.22: Constitution of iron, steel and its articles in export basket of India vs. top exporting countries – Level of processing complexity (value addition)
Source: International Trade Centre (intracen.org), PwC analysis
Figure 5.23: Constitution of copper and its articles in export basket of India vs. top exporting countries – Level of processing complexity (value addition)
Source: International Trade Centre (intracen.org), PwC analysis
Figure 5.24: Constitution of aluminum and its articles in export basket of India vs. top exporting countries – Level of processing complexity (value addition)
0%
20%
40%
60%
80%
100%
India China Germany USA
Basic 2003 Medium + High 2003 Basic 2013 Medium + High 2013
0%
20%
40%
60%
80%
100%
India China Germany USA
Basic 2003 Medium + High 2003 Basic 2013 Medium + High 2013
0%
20%
40%
60%
80%
100%
India China Germany USA
Basic 2003 Medium + High 2003 Basic 2013 Medium + High 2013
Final Report - Krishnapatnam Industrial Node Development Plan PwC/Nippon Koei 122

Other issues that are affecting the growth of the sector are:
• Lack of Research & Development, design and new / expansion of existing manufacturing capabilities.
• Skill gaps and shortage of skilled manpower for manufacturing sector and R&D.
• Hesitance on part of customers to use machinery manufactured on the basis of indigenously developed technology.
Benchmarking against International Competition
Globally, the mining and metals sector has a $1.5 trillion annual value (June 2013)28. For many years, it grew more or less in step with global GDP. Starting with the turn of the millennium, the sector and demand for commodities started to grow significantly faster than global GDP. The main reason for that was the takeoff of the Chinese economy, particularly infrastructure and manufacturing. Currently, between 40% and 60% of every mineral that gets dug up anywhere in the world ends up in China. So the slowdown in China’s economic growth now has caused softening of the sector worldwide.
Source: www.intracen.org – International Trade Centre
Figure 5.25 Change in the value of exports of iron and steel products between 2003 and 2013 among top exporting countries in the world
China has gone from being roughly 15% of global steel production and consumption at the turn of the millennium to close to 50% today. That’s particularly important because, unlike coal, when it comes to raw materials, China lacks the necessary quality and size of iron ore reserves. The reserves are in Australia, Brazil, and to a lesser extent, India and South Africa.
Case studies – Success factors in select leading metallurgy manufacturing countries
CHINA
Technological innovation
In recent years, the technological innovation system of iron and steel industry of China has been developing rapidly. Research institutions have been set up by the companies in the sector to sustain competition. As a result, the industry’s capability of technological innovation has been enhanced, and many technological achievements have been made.
28 As per article published by Yale school of management, US
05000000
1000000015000000200000002500000030000000350000004000000045000000
China Japan Germany Korea, Republicof
RussianFederation
United States ofAmerica
India
2003 2013
Final Report - Krishnapatnam Industrial Node Development Plan PwC/Nippon Koei 123
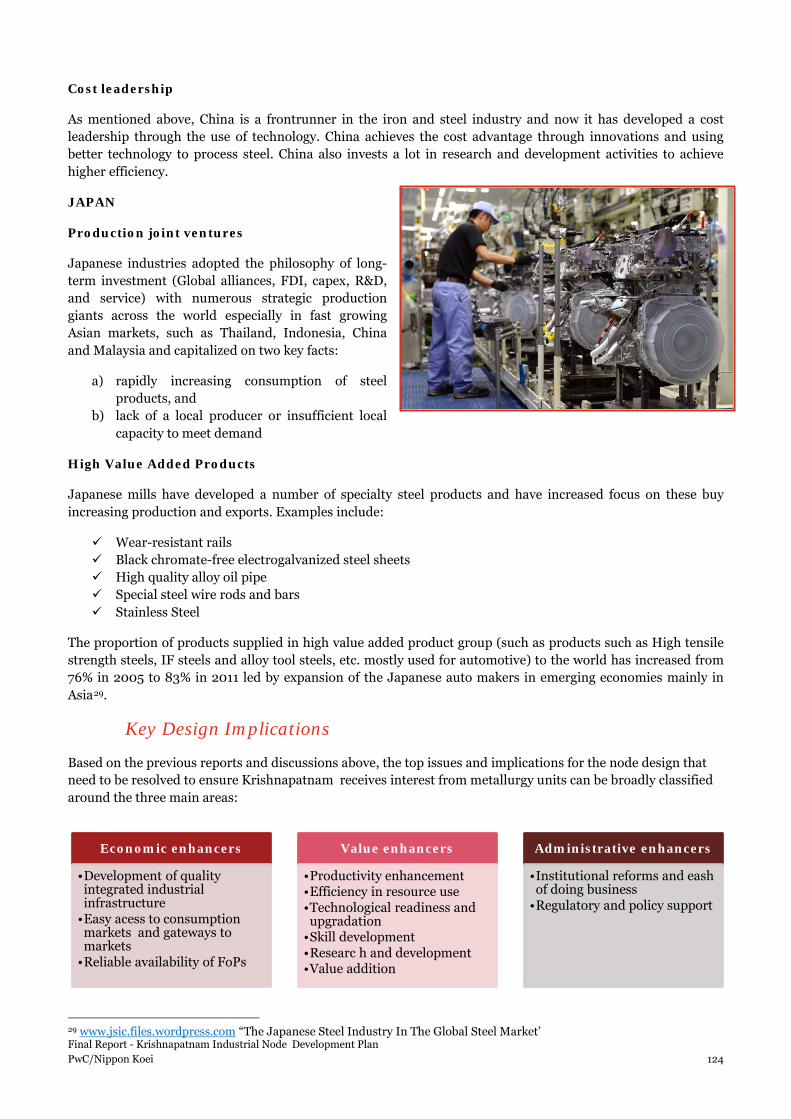
Cost leadership
As mentioned above, China is a frontrunner in the iron and steel industry and now it has developed a cost leadership through the use of technology. China achieves the cost advantage through innovations and using better technology to process steel. China also invests a lot in research and development activities to achieve higher efficiency.
JAPAN
Production joint ventures
Japanese industries adopted the philosophy of long-term investment (Global alliances, FDI, capex, R&D, and service) with numerous strategic production giants across the world especially in fast growing Asian markets, such as Thailand, Indonesia, China and Malaysia and capitalized on two key facts:
a) rapidly increasing consumption of steel products, and
b) lack of a local producer or insufficient local capacity to meet demand
High Value Added Products
Japanese mills have developed a number of specialty steel products and have increased focus on these buy increasing production and exports. Examples include:
Wear-resistant rails Black chromate-free electrogalvanized steel sheets High quality alloy oil pipe Special steel wire rods and bars Stainless Steel
The proportion of products supplied in high value added product group (such as products such as High tensile strength steels, IF steels and alloy tool steels, etc. mostly used for automotive) to the world has increased from 76% in 2005 to 83% in 2011 led by expansion of the Japanese auto makers in emerging economies mainly in Asia29.
Key Design Implications
Based on the previous reports and discussions above, the top issues and implications for the node design that need to be resolved to ensure Krishnapatnam receives interest from metallurgy units can be broadly classified around the three main areas:
29 www.jsic.files.wordpress.com “The Japanese Steel Industry In The Global Steel Market’
Economic enhancers
•Development of quality integrated industrial infrastructure
•Easy acess to consumption markets and gateways to markets
•Reliable availability of FoPs
Value enhancers
•Productivity enhancement•Efficiency in resource use•Technological readiness and upgradation
•Skill development•Researc h and development•Value addition
Administrative enhancers
•Institutional reforms and eash of doing business
•Regulatory and policy support
Final Report - Krishnapatnam Industrial Node Development Plan PwC/Nippon Koei 124

Specific issues identified by metallurgy units located in close proximity to the proposed node in Nellore district and implications to be considered in design of the industrial node are summarized below:
Table 5.8: Key design implications for metallurgy sector
Components Issues Design Implication
Economic enhancers
Power • Stakeholders are of the
opinion that power tariffs are high in the region
• In medium term, power tariff subsidies for metallurgy industries in the corridor (for example, for the first 10 years of operation) can be considered.
• After bifurcation of Andhra Pradesh into Andhra and Telangana, AP is a power surplus state. Stakeholders of Nellore district noted improvement of power supply scenario compared to the situation 1-1.5 years back. Further, regular vigilance on demand and supply of power on par with the growth in industries.
Connectivity
Road
• Connectivity to domestic bauxite and alumina sources to be enhanced
• Access road from Krishnapatnam port to Node area is an unpaved 1-lane road. It is limited to local residents and few heavy vehicles
• Access to South (6 lane road) running from Naidupet (NH 5) via Kota and new industrial park to Krishnapatnam Port with length of about 50 km are proposed
• A grid type road network will be followed
• Three north-south trunk roads and east-west trunk roads each are planned
• Access road to Krishnapatnam and connectivity to NH-5 has to be improved
• Further allocation of Bauxite mines to companies setting up alumina and aluminum industries in Nellore region
Railway
• There is no rail connectivity to the node at present
• Nearest rail head is Venkatachalam located 25 (approx.) km away from the node
• Rail access to the Node area is proposed i.e., o 13.7 km spur line from the port
access line, with the expectation to have considerable spare capacity
o 55.7 km link from the port access line that would pass through the node (and the logistics hub itself) continue further south to connect Chennai – Nellore main line at Naidupeta
Value enhancers
Final Report - Krishnapatnam Industrial Node Development Plan PwC/Nippon Koei 125

Components Issues Design Implication
Development of new sub-sectors of metallurgy in the node
• Large food-processing and textile industries in the corridor may give rise to packaging requirements in aluminium in Nellore district and KPT IN in particular.
• Further allocation of Bauxite mines to companies setting up alumina and aluminium industries in Nellore region
• In aluminium subsector, Nellore district is closest to bauxite sources. KPT IN also will have access to Krishnapatnam port. Further leases to Bauxite mining may be allocated to only those companies who intend to set up alumina and primary aluminium production units in the corridor.
Pelletization
• There are limited reserves of high-grade Iron-ore lumps in the region. However, iron-ore fines are available and are currently exported in high quantities due to non-availability of pellet units to treat and use fines.
• Pelletization can help to an extent in better usage of iron-ores fines and can also help ramp up export revenue by moving up the value chain.
Final Report - Krishnapatnam Industrial Node Development Plan PwC/Nippon Koei 126

Components Issues Design Implication
Technology linkages, research and development initiatives
• Outdated technology, lack of research and development activities in the sector
• State and central government should focus on initiatives to establish technological linkages internationally with countries like Japan and investing in R&D can help in procuring cost effective technologies for modernizing – A world class research center
• Government led initiatives inform of Knowledge Transfer Partnership, where students get more industry exposure, can play a key role in creating the right institute-industry linkages
Center of excellence Creation of the center can be proposed in KPT node to enable the technology linkages, create industry-academia connect in the metallurgy sector, attract leading international research institutions to open research labs in the node. The center can cater to the requirement of the entire CBIC region and beyond and facilitate technology upgradation in metallurgy sector.
Apart from the above, the center can also include:
• One of the major issues of the sector is low productivity. One of the wings of the center can become a training facility for retraining and redevelopment of the labor force
• Quality testing laboratory can become another element of the partnership center to work upon improvement of inferior quality of goods persistent in the sector at the moment.
Administrative enhancers
Policy
• Policy level support is lacking to the metallurgy sector in India and Andhra Pradesh in particular
• The sector is guided by the national level policies, where the draft National Steel Policy 2012 is yet to come out in concrete form
• Andhra Pradesh does not have any specific policy dedicated to the metallurgy sector
• A dedicated committee may be appointed comprising members from all stakeholder agencies
• Government of AP should propose a dedicated policy for the sector, which may increase the attractiveness of the sector along in the state as well as in the CBIC districts – Nellore, in particular
Final Report - Krishnapatnam Industrial Node Development Plan PwC/Nippon Koei 127

5.2.3 Electrical Machinery
Sector performance
Globally robust economic growth in developing countries, such as China and India, along with rapid urbanization trends and growth in fixed investment spending (especially in infrastructure such as roads and electricity generation) boosted demand for electric machinery and machinery in the region. Demand in these sectors is fuelled by end-use sectors, like construction, power, infrastructure development, and supported by large size of Asia Pacific economies which are also home for 55% of the world’s population.
Global trade in electrical equipment products accounts for about 4% of the total global trade. Global exports reached USD 688 billion in 2013, with China being the leading exporter of electrical equipment – 20% share, followed by Germany, USA and Japan.
Source: Trade statistics for international business development, International Trade Centre, intracen.org, PwC analysis
Figure 5.26: Top exporting countries based on value of exports
Analysis of global electrical machinery exports reveals that India’s share is very modest and didn’t significantly improve over the past decade: from 0.3% to 0.9% share in global exports of electrical machinery in 2003 and 2013 respectively.
The consultant analyzed India’s position in electrical machinery exports having taken into consideration top 7 product groups that constitute above 70% of global electrical machinery exports. The country is not in top 20 for most of the product groups, except one (Part suitable for use solely / with boards, panels, etc.). However, India’s exports rank has improved 5 out of 7 top exported product groups.
0%
5%
10%
15%
20%
25%
020406080
100120140160
Chi
na
Ger
man
y
USA
Japa
n
Kor
ea
Fran
ce
Cze
ch UK
Sing
apor
e
Taip
ei,
Chi
nese
Indi
a
百万
Top exporting countries based on value of exports, electrical machinery, 2003 vs 2013
Exports 2003, USD thousand Exports 2013, USD thousand
% of global metallurgy export, 2003 % of global metallurgy export, 2013
Final Report - Krishnapatnam Industrial Node Development Plan PwC/Nippon Koei 128

Table 5.9: Trade competitiveness ranking, 2003 vs 2013, Food processing30
Rank Insulated
wire/cable
Electric transformer, static
converter
Electrical app for switchg
not exceedg
1000 volt
Board & panels,
equipped with
two/more switches,
fuses
Electric motors
and generators
(excl. generating
sets)
Electrical machinery
and app having
individual function,
nes
Part suitable for use solely /
with boards, panels,
etc.
Electric accumu-
lators
1 China (4)
China (1)
Germany (1)
Germany (1)
China (2)
China (7)
Germany (1)
China (2)
2 Mexico (1)
Germany (3)
China (7)
China (12)
Germany (1)
Korea (18)
USA (2)
Korea (7)
3 USA (2)
USA (4)
USA (2)
USA (4)
USA (4)
USA (2)
Korea (18)
USA (6)
4 Germany (3)
Japan (6)
Japan (3)
Mexico (3)
Mexico (3)
Germany (3)
China (9)
Japan (1)
5 Romania (16)
Mexico (5)
France (4)
Japan (2)
Japan (5)
Japan (1)
Japan (3)
Germany (4)
India 34 (49)
21 (31)
25 (39)
27 (50)
23 (34)
32 (37)
15 (38)
27 (30)
Source: Trade statistics for international business development, International Trade Centre, intracen.org, PwC analysis
The Indian electrical machinery sector output grew at 23% CAGR between 2008-09 and 2010-11 and reached USD 33 billion (Rs. 198,395 crore) by 2010-1131. Its share in total national manufacturing output amounted to 4%. Exports of electrical machinery for the corresponding period were USD 3.5 billion (Rs. 20,742 crore) and contributed around 2% to the total exports of goods from India. 32 There are four major sub-sectors that contribute 88% of the sector’s output in India. They include electric motors, generators and transformers, batteries and accumulators, wiring and wiring devices and domestic appliances.
Source: ASI
There is a strong demand for electrical machinery in the domestic market with gradual reduction of reliance on imports; however, India’s exports performance has not been very strong.
30 Numbers in brackets represents rank in 2003 31 Annual Survey of Industries 32 International Trade Center
Figure 5.27: Composition of electrical machinery output, India
Electric motors,
generators, tranformers,
etc45%
Batteries and accumulators
9%
Wiring and wiring devices
22%
Electric Lightning Equipment
5%
Domestic appliances
12%
Other electrical equipment
7%
Electrical machinery 3-year average output (2009-11), India
Final Report - Krishnapatnam Industrial Node Development Plan PwC/Nippon Koei 129

According to the Department of Heavy Industries projections, overall growth of the sector is forecast around 13-14% till 2022.
Between January 2000 and November 2014, foreign direct investment in electrical machinery sector in India stood at USD 3.08 billion. Key players like Mitsubishi, Hitachi, Alstom and Toshiba have entered the Indian market mostly through JV route.
Source: Fact sheet on foreign direct investment (FDI), DIPP
Figure 5.28: FDI in electrical machinery sector, India
The corridor states of Tamil Nadu, Karnataka and Andhra Pradesh together contribute to 26% of electrical machinery output in India. The districts of these states that fall under influence of CBIC, have traditionally accounted for 90% of the total electrical machinery investments in these three states.
Given the high growth trajectory of the sectors and huge domestic market potential and strong performance of the sectors in the districts under corridor’s influence, electrical machinery sector is poised to emerge as key sectors which may contribute to CBIC’s success in terms of attracting investments to the corridor. In Nellore district Sri City along the border of Andhra Pradesh and Tamil Nadu is one of the examples in attracting investments in electrical machinery sector.
0.0%
1.0%
2.0%
3.0%
4.0%
0.00
200.00
400.00
600.00
800.00
Y-o-y FDI in electrical machinery sector, India, USD mn
FDI in EE (USD mn) % of total FDI
Final Report - Krishnapatnam Industrial Node Development Plan PwC/Nippon Koei 130

Viability drivers for future investments
The growth drivers for the electrical machinery sectors are as highlighted below:
(i) National level related
Growing power sector
Capacity addition plans of Government for Indian power sector is the key growth driver for the sector. Total installed capacity as on January 2015, including renewable energy sources of the country is 259 GW. By the end of 12th and 13th Five Year Plans it is envisaged to add 89 GW and 94 GW of installed capacities respectively.
Mandatory standards were recently stipulated by BEE for Distribution Transformers unto 200 kVA, which fuelled the growth of the sub segment along with massive capacity additions in power transmission and distribution sector.
Accelerated infrastructure expansion and growing urbanization
The Indian Government's investment in infrastructure projects is a major factor driving the growth of the electrical machinery market in India. During the 11th Five Year Plan (2007-2012) investment on infrastructure projects amounted to US$436 billion. The Indian Planning Commission has estimated a total investment of more than US$1 trillion for infrastructure projects during the 12th Five Year Plan (2012-2017). The various infrastructure projects undertaken by the government such as road and railway construction, mining, irrigation, urban infrastructure, and real estate development require extensive use of electrical machinery.
Growing telecom industry
The growing telecom industry in India is the second largest telecommunications market in the world, closely following China, which is the largest in the world. In 2013, around 500,000 telecom towers were installed in the country. Internet traffic is expected to touch around 2.8 Exabyte's per month in 2018. The increasing penetration of telecommunications technology in the rural areas and the advent of 3G and 4G facility, has spurred the growth of the Telecom industry in India. This steady growth rate has increased the demand for electrical equipment such as cables and generators. For instance, generators are installed in towers to run the radio frequency transceivers. Electrical equipment is also used in the generation and transmission of signals. Thus, the increasing growth of the Telecom industry increases the market potential for the Electrical Equipment market in India.
Increasing FDI
The Government of India has allowed a 100% FDI in the electrical machinery sector. The FDI in the electrical machinery sector has grown at a CAGR of 28% from 2006 to 2014. Cumulative FDI (2000-2014 (till November)) in electrical machinery sector amounted to USD 3.08 billion with FDI of USD 462 million added in 2014 alone.
Growing power sector
Accelerated infrastructure expansion and growing urbanization
Growing telecom Industry
Farm mechanization
Increasing FDI
Nuclear capacity addition
Final Report - Krishnapatnam Industrial Node Development Plan PwC/Nippon Koei 131

Nuclear capacity addition
Nuclear capacity expansion will provide significant business opportunities to the electrical machinery industry and with the completion of the Indo-US nuclear deal, India is set to receive huge investments in this industry.
(ii) KPT IN level related
• Availability of MSME base (Engineering)
One of the most important FoPs for electrical machinery sector to establish a new unit is availability of ancillary base in the area. In case of Krishnapatnam Industrial Node, engineering MSME units are the second largest group of MSMEs present in Nellore district (12% in terms of number and 17% in terms of investment); hence, may serve as an ancillary base for the interested large tenants in electrical machinery sector.
• Locational advantage – proximity to port
− Proximity to ports – proximity to imports
The segments dependent on electrical steel require proximity to ports as their raw material is imported; hence, location of KPT IN in immediate proximity to KPT port will become at attractive proposition for the electrical machinery units dependent on raw material imports.
− Favorable location for exports
KPT IN is favorably located in immediate vicinity to the Krishnapatnam port. The export oriented units in electrical machinery sector can leverage proximity to the markets of the leading electrical machinery importing countries. The distance to the ports of the some top electrical machinery products importing nations varies from 8.0 days to 22.4 days.
KPT port Port in potential importing country Distance, days
Krishnapatnam port
Port of Shanghai, China 19.3
Port of Tokyo, Japan 23.8
Port of Chinae, South Korea 21.6
Jurong Port, Singapore 8.0
Port of Hong Kong, Hong Kong 15.7
The figure below depicts the proximity of the node to the leading importing countries of various product groups in electrical machinery sector and share of imports to the global imports in electrical machinery sector. (For calculation, we have taken top five product groups which form 57% of total world exports).
Availability of MSME base (Engineering)
Locational advantage:•Imports of raw material
•Exports
Final Report - Krishnapatnam Industrial Node Development Plan PwC/Nippon Koei 132

Source: intracen.org, ports.com, PwC analysis
Figure 5.29: Share of world imports in electrical machinery product groups of top importing countries in the Southeast Asia; proximity from KPT port
For example, China is a major importer of electrical machinery products in the world. The top exporter contributes 18% to total exports in electrical machinery, whereas India has only 1.8% share.
Assuming unconstrained scenario, the consultant has taken an example of China and analyzed India’s position in electrical machinery sector exports to this country vs top two exporting nations.
Table 5.10: Share of top exporting countries vs India to China in electrical machinery sector
Food processing sub-sector
Exporter - Top 1 % of total FP
imports to China
Exporter – Top 2 % of total FP
imports to China
India % of total Metallurgy imports to Japan
Time to reach from
Top 1, days
Time to reach from
Top 2, days
Time to reach from India, days
Insulated wire/cable Korea 11% Japan 11% 0.2% 2.3 3.2 19.3
Electric transformer, static converter
Japan 14% USA 9% 0.4% 3.2 85.8 19.3
Electrical app for switching not exceeding 1000 volt
Japan 26% Korea 11% 0.3% 3.2 2.3 19.3
1%
1%
Russia
MongoliaKazakhstan
China
North Korea
South Korea
Japan
Taiwan
Singapore
Indonesia
Brunei
Philippines
East Timor
Sri Lanka
Nepal
Myanmar
Vietnam
Laos
Thailand
Cambodia
Malaysia
Pakistan
Afghanistan
Iran
Turkmenistan
Uzbekistan
Tajikistan
Kyrgyzstan
Australia
Bangladesh
Bhutan
5%
13%
14%
4%4%
6%6%
2%
3%
2%6%
1%
2%
1%
1%
4%
1%
3%
2%
3%
1% 2%
2%
KPT IN
India
KPT IN
Hong Kong
Product group Legend
Insulated wire/cable
Electric transformer, static converter Electrical app for switching not exceeding 1000 volt Board & panels, equipped with two/more switches, fuses Electric motors and generators (excluding generating sets)
Final Report - Krishnapatnam Industrial Node Development Plan PwC/Nippon Koei 133

Food processing sub-sector
Exporter - Top 1 % of total FP
imports to China
Exporter – Top 2 % of total FP
imports to China
India % of total Metallurgy imports to Japan
Time to reach from
Top 1, days
Time to reach from
Top 2, days
Time to reach from India, days
Board & panels, equipped with two/more switches, fuses
Japan 18% USA 10% 0.3% 3.2 85.8 19.3
Electric motors and generators (excluding generating sets)
Germany 17% Japan 15% 0.5% 50.8 3.2 19.3
Source: intracen.org, ports.com, PwC analysis
It is evident that India’s share in electrical machinery exports to China is quite modest; in spite of it having locational advantage in 3 product groups out of 5. Entering KPT IN will provide locational advantage for the export oriented units of electrical machinery sector. German companies in the sector having existing JV / looking for JV partner to establish base in India, can be approached as potential tenants for the node.
Focus on export oriented units of electrical machinery sector is in line with the vision of the government of India to boost country’s share in electrical machinery exports
Key challenges and issues
Import oriented trade
While exports and imports of electrical machinery in India have grown at a CAGR of 19% and 18% respectively between 2001 and 2013. Share of electrical machinery exports as a percentage of total national trade in electrical machinery is about 37%. It is low as compared to global exports of electrical machinery and it is around 49% of total global trade in this product segment. Share of electrical machinery exports of China in total electrical machinery trade has increased from 51% in 2001 to 66% in 2013.
The trade deficit in India needs to be addressed through focus on improving exports by creating necessary infrastructure support along with policy level reforms.
Availability of raw materials
Constrained availability of certain critical raw materials such as Cold Rolled Grain Oriented (CRGO)/ Cold Rolled Non-Grain Oriented (CRNGO) Steel, Amorphous Steel etc. and volatility in raw material prices is hurting domestic industry.
Electrical industry is largely dependent on imported CRGO/ CRNGO electrical grade steel due to very limited manufacturing capacities within India. CRGO and Boiler quality plates are presently imported by domestic manufactures from very few suppliers worldwide (only 14 mills are operating worldwide). Out of 14 only 3 mills are BIS certified; currently it is mandatory to obtain BIS certification for all the suppliers. Any delay in the registration of foreign suppliers with BIS leads to supply constraints to domestic industry.
Infrastructural constraints
The sector players face issues in transporting heavy and over dimensional consignments (ODC) >98 MT on NHAI bridges. As per procedure, various zonal railways are involved to give clearance for the movement of such ODCs. This leads to delay in projects, as highlighted by electrical machinery manufacturers of Nellore district. Congestion at ports further delays delivery.
Uninterrupted power supply
Final Report - Krishnapatnam Industrial Node Development Plan PwC/Nippon Koei 134

Power shortages are prevalent in many of the Indian states, including Andhra Pradesh and Nellore district in particular. Electricity rates are another point of concern of various stakeholders in Nellore district.
Availability of indigenous testing facilities
The electrical equipment testing facilities available in India are quite inadequate. Vendors have to send their equipment to foreign countries for testing which is time-consuming and expensive.
The process results in increased prices and directly affects the end-users. Moreover, the local players do not have enough capital to set up testing facilities as the investment required is huge.
Benchmarking Against International Competition
As per the “Study on Innovative Interventions required in Manufacturing Sectors to make them Globally Competitive” by Dun & Bradstreet, there are various stages of competence protocol to ascertain competitiveness level of any given sector. Most of the Indian firms are still in the Stage 1 (initial) of the competence protocol and targeting basic conveniences & cleaning up of operations to achieve competitiveness in capital goods. Raw-materials and labour productivity are the key issues highlighted by the Indian firms. Some of the aspects in Stage 1 like energy conservation, clean & safe working environment, etc. are still to be looked up as measures for competitiveness.
Amongst the competing countries, China has already crossed the first stage managing basic clean-up of operations by managing backward linkages effectively and setting up component and raw-material industries supplying to Chinese firms at very competitive rates. Italy and Germany counterparts have already crossed the second stage and focus is on total improvement in systems & business processes by achieving total quality enrichment and enhanced value addition.33
Cost Structure
Cost structure encompasses all the expenses that a firm must take into account when manufacturing and selling a product. Various types of costs that are benchmarked in this section are: raw material costs, labour costs (including wages), energy costs, interest charges, distribution expenses (including transportation & logistics etc.)
Source: “Capital goods: Productivity and Efficiency Benchmarking”, Study on Innovative Interventions required in Manufacturing Sectors to make them Globally Competitive, Dun & Bradstreet Information Services India Private Limited, Mumbai [2013]
Figure 5.30: Cost breakup (as a % of total sales) in India vs leading manufacturers of electrical machinery
33 “Capital goods: Productivity and Efficiency Benchmarking”, Study on Innovative Interventions required in Manufacturing Sectors to make them Globally Competitive, Dun & Bradstreet Information Services India Private Limited, Mumbai [2013]
56%
3%11%
0.4% 2% 5%
46%
-12%
- 3% 4%
41%
- - - - 2%0%
20%
40%
60%
Raw material cost Energy cost Labour cost Land and buildingcost
Interest charges Transportation /logistics
Cost structure in electrical machinery sector (as a % of total sales)
India China Germany
Final Report - Krishnapatnam Industrial Node Development Plan PwC/Nippon Koei 135
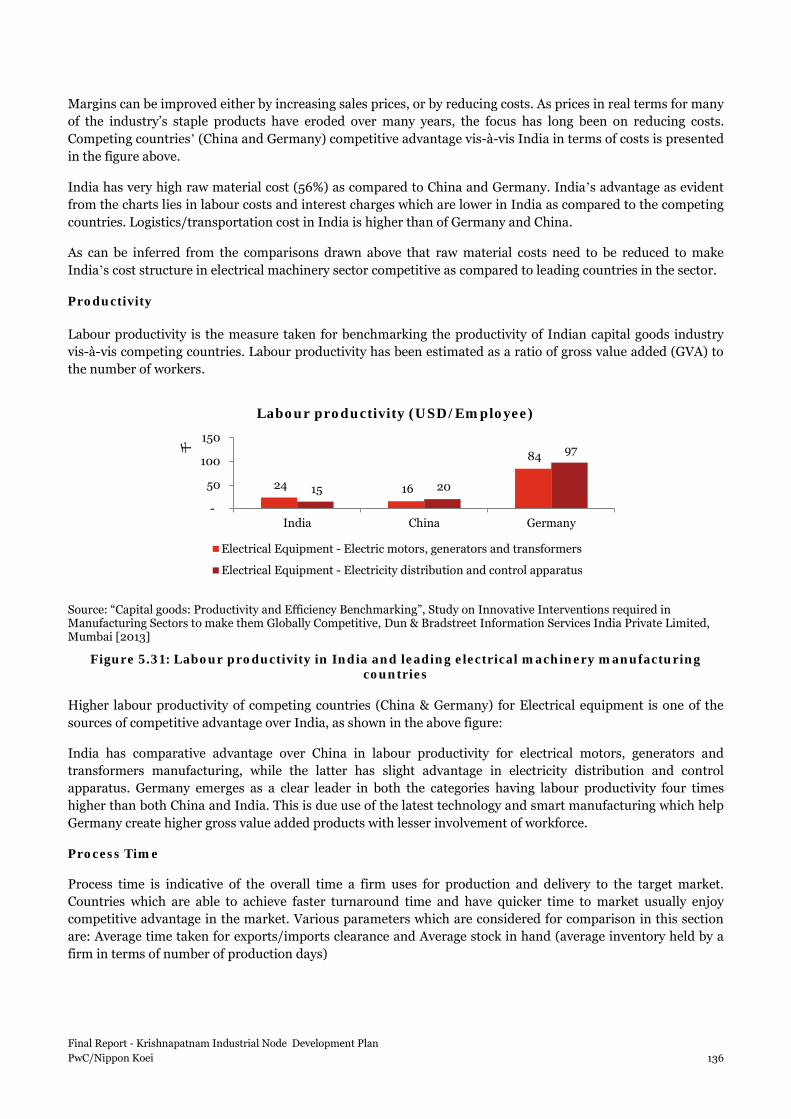
Margins can be improved either by increasing sales prices, or by reducing costs. As prices in real terms for many of the industry’s staple products have eroded over many years, the focus has long been on reducing costs. Competing countries’ (China and Germany) competitive advantage vis-à-vis India in terms of costs is presented in the figure above.
India has very high raw material cost (56%) as compared to China and Germany. India’s advantage as evident from the charts lies in labour costs and interest charges which are lower in India as compared to the competing countries. Logistics/transportation cost in India is higher than of Germany and China.
As can be inferred from the comparisons drawn above that raw material costs need to be reduced to make India’s cost structure in electrical machinery sector competitive as compared to leading countries in the sector.
Productivity
Labour productivity is the measure taken for benchmarking the productivity of Indian capital goods industry vis-à-vis competing countries. Labour productivity has been estimated as a ratio of gross value added (GVA) to the number of workers.
Source: “Capital goods: Productivity and Efficiency Benchmarking”, Study on Innovative Interventions required in Manufacturing Sectors to make them Globally Competitive, Dun & Bradstreet Information Services India Private Limited, Mumbai [2013]
Figure 5.31: Labour productivity in India and leading electrical machinery manufacturing countries
Higher labour productivity of competing countries (China & Germany) for Electrical equipment is one of the sources of competitive advantage over India, as shown in the above figure:
India has comparative advantage over China in labour productivity for electrical motors, generators and transformers manufacturing, while the latter has slight advantage in electricity distribution and control apparatus. Germany emerges as a clear leader in both the categories having labour productivity four times higher than both China and India. This is due use of the latest technology and smart manufacturing which help Germany create higher gross value added products with lesser involvement of workforce.
Process Time
Process time is indicative of the overall time a firm uses for production and delivery to the target market. Countries which are able to achieve faster turnaround time and have quicker time to market usually enjoy competitive advantage in the market. Various parameters which are considered for comparison in this section are: Average time taken for exports/imports clearance and Average stock in hand (average inventory held by a firm in terms of number of production days)
24 16
84
15 20
97
-
50
100
150
India China Germany
千
Labour productivity (USD/Employee)
Electrical Equipment - Electric motors, generators and transformers
Electrical Equipment - Electricity distribution and control apparatus
Final Report - Krishnapatnam Industrial Node Development Plan PwC/Nippon Koei 136

Source: “Capital goods: Productivity and Efficiency Benchmarking”, Study on Innovative Interventions required in Manufacturing Sectors to make them Globally Competitive, Dun & Bradstreet Information Services India Private Limited, Mumbai [2013]
Figure 5.32: Process time in electrical machinery sector for India and leading electrical machinery manufacturing countries, days
India stands at clear point of disadvantage as compared to competing countries (China, Italy and Germany) because of higher process time as depicted in the above figure.
As can be seen from the graph, the average time taken to market electrical equipment in India in the domestic market as well as international market is high as compared to China and Germany. Also the total cycle time in India is high. This clearly depicts India’s competitive disadvantage in the sector.
The insufficient logistics support to the industry in terms of transportation of raw materials and aggregates, lack of quality power supply, lack of quality water supply etc. have added to the operating cost and eroded the competitive advantage of the domestic players with respect to overall production cycle time and overall time to market.
Capacity utilization
Capacity utilization is a metric used to measure the rate at which potential output levels are being met or used. Displayed as a percentage, capacity utilization levels give insight into the overall slack that is in the economy or a firm at a given point in time and refers to the extent to which an enterprise or a nation actually uses its installed productive capacity. Thus, it refers to the relationship between actual output that 'is' produced with the installed equipment and the potential output which 'could' be produced with it, if capacity was fully used.
Source: “Capital goods: Productivity and Efficiency Benchmarking”, Study on Innovative Interventions required in Manufacturing Sectors to make them Globally Competitive, Dun & Bradstreet Information Services India Private Limited, Mumbai [2013]
Figure 5.33: Capacity utilization in electrical machinery sector for India and leading electrical machinery manufacturing countries
90
7080
100
7080
110
85 90
0
20
40
60
80
100
120
India China Germany
Process time, days
Total Cycle Time Time to market in domestic Time to market in international market
68.87%83.41% 93%
0%
50%
100%
India China Germany
Capacity Utilisation
Final Report - Krishnapatnam Industrial Node Development Plan PwC/Nippon Koei 137

India’s disadvantage as compared to top competing countries (China and Germany) in capacity utilization is shown in the figure above.
Case study – Nashik Electrical Machinery Cluster
Electrical machinery is a sector where final products are majorly assembled and require sizable ancillary base industries in vicinity. Nashik electrical machinery cluster is one such example. Many OEM players have been attracted to a cluster on account of presence of large number of ancillary base industries.
Source: PwC
Figure 5.34: Electrical machinery cluster in Nashik
In case of Krishnapatnam IN, engineering MSME units are the second largest group of MSMEs present in Nellore district (12% in terms of number and 17% in terms of investment); hence, may serve as an ancillary base for the interested large tenants in electrical machinery sector.
Key Design Implications
Based on the previous reports and discussions above, the top issues and implications for the node design that need to be resolved to ensure Krishnapatnam receives interest from electrical machinery units can be broadly classified around the three main areas:
Specific issues identified by electrical machinery units located in proximity to the proposed node in Nellore district and implications to be considered in design of the industrial node are summarized below:
SUPPLY INDUSTRIES
Ancillary unitsInputs to ancillary units
OEMs
Capacitor ManufacturersCorrugated Boxes manufacturers
Electro Plating CompaniesHot Dip Galvinizing companies
Nuts and Bolts ManufacturersWires and crimping tool manufacturers
Meter manufacturersFuse Manufacturers
Abrasive ManufacturerBall Bearing Manufacturers
A cluster of over 100 Ancillary units
• Heavy industrial facilities construction
• Power plant facilities
• Machinery Manufacturing
Downstream Industry
Nashik Electrical Machinery cluster
Economic enhancers
•Development of quality integrated industrial infrastructure
•Easy acess to consumption markets and gateways to markets
•Reliable availability of FoPs
Value enhancers
•Productivity enhancement•Efficiency in resource use•Technological readiness and upgradation
•Skill development•Researc h and development•Value addition
Administrative enhancers
•Institutional reforms and eash of doing business
•Regulatory and policy support
Final Report - Krishnapatnam Industrial Node Development Plan PwC/Nippon Koei 138

Table 5.11: Key design implications for electrical machinery sector
Components Issues Design Implication Economic enhancers
Connectivity
Rail
• Nearest rail head is Venkatachalam located 25 (approx.) km away from the node
• There is no rail connectivity to the node at present
• Rail connectivity is necessary to transport over dimensional consignments (ODC) and avoid problems in transporting heavy and ODC >98 MT on NHAI bridges.
• Availability of rail sidings as a last mile connectivity to the main rail network is also essential
• Creation of rail network connectivity as necessary requirement to transport ODC cargoes
• Rail access to the Node area is proposed i.e., − 13.7 km spur line from the port
access line, with the expectation to have considerable spare capacity
− 55.7 km link from the port access line that would pass through the node (and the logistics hub itself) continue further south to connect Chennai – Nellore main line at Naidupeta
Road
• Availability of port infrastructure is essential FoP for the electrical machinery units
• The segments dependent on electrical steel require proximity to ports as their raw material is imported
• Ensure seamless connectivity to port
• Access to South (6 lane road) running from Naidupet (NH 5) via Kota and new industrial park to Krishnapatnam Port with length of about 50 km are proposed
• Access road to Krishnapatnam and connectivity to NH-5 has to be improved
• It is also important to promote the vision of the GoI to boost country’s share in electrical machinery exports
Power supply • Electricity rates are a point of concern of various stakeholders
• In medium term, power tariff subsidies for engineering industries in the corridor (for example, for the first 10 years of operation) can be considered.
• After bifurcation of Andhra Pradesh into Andhra and Telangana, AP is a power surplus state. Stakeholders of Nellore district noted improvement of power supply scenario compared to the situation 1-1.5 years back. Further, regular vigilance on demand and supply of power on par with the growth in industries.
Value enhancers
Availability of indigenous testing facilities
• Inadequate electrical equipment testing facilities in the country
• Local players do not have enough capital to set up testing facilities as the investment required is huge.
• Facilitate setting up of indigenous testing and calibrating facility for equipment testing in the node, which can become a testing facility centre for the state as well as neighbouring states
Final Report - Krishnapatnam Industrial Node Development Plan PwC/Nippon Koei 139
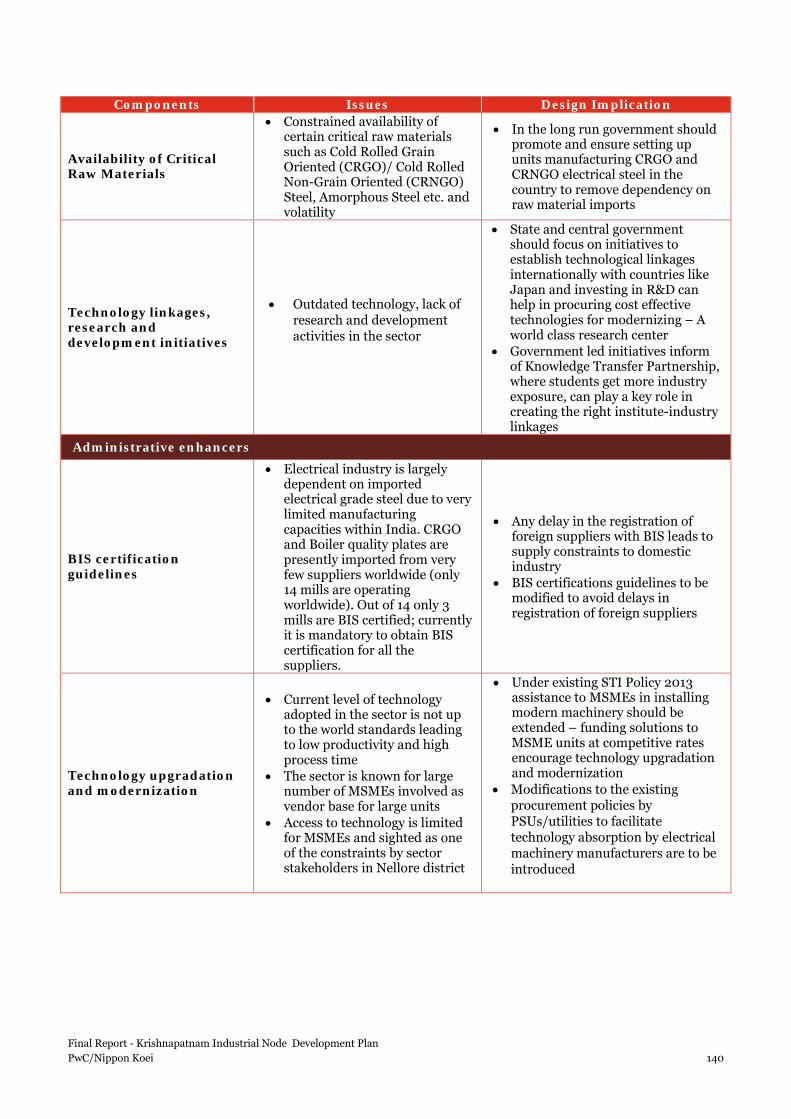
Components Issues Design Implication
Availability of Critical Raw Materials
• Constrained availability of certain critical raw materials such as Cold Rolled Grain Oriented (CRGO)/ Cold Rolled Non-Grain Oriented (CRNGO) Steel, Amorphous Steel etc. and volatility
• In the long run government should promote and ensure setting up units manufacturing CRGO and CRNGO electrical steel in the country to remove dependency on raw material imports
Technology linkages, research and development initiatives
• Outdated technology, lack of research and development activities in the sector
• State and central government should focus on initiatives to establish technological linkages internationally with countries like Japan and investing in R&D can help in procuring cost effective technologies for modernizing – A world class research center
• Government led initiatives inform of Knowledge Transfer Partnership, where students get more industry exposure, can play a key role in creating the right institute-industry linkages
Administrative enhancers
BIS certification guidelines
• Electrical industry is largely dependent on imported electrical grade steel due to very limited manufacturing capacities within India. CRGO and Boiler quality plates are presently imported from very few suppliers worldwide (only 14 mills are operating worldwide). Out of 14 only 3 mills are BIS certified; currently it is mandatory to obtain BIS certification for all the suppliers.
• Any delay in the registration of foreign suppliers with BIS leads to supply constraints to domestic industry
• BIS certifications guidelines to be modified to avoid delays in registration of foreign suppliers
Technology upgradation and modernization
• Current level of technology adopted in the sector is not up to the world standards leading to low productivity and high process time
• The sector is known for large number of MSMEs involved as vendor base for large units
• Access to technology is limited for MSMEs and sighted as one of the constraints by sector stakeholders in Nellore district
• Under existing STI Policy 2013 assistance to MSMEs in installing modern machinery should be extended – funding solutions to MSME units at competitive rates encourage technology upgradation and modernization
• Modifications to the existing procurement policies by PSUs/utilities to facilitate technology absorption by electrical machinery manufacturers are to be introduced
Final Report - Krishnapatnam Industrial Node Development Plan PwC/Nippon Koei 140

5.2.4 Other industries
Glass, ceramics and building materials
Granular, Glassy, Semi-glassy and Massive Quartz/Quratzites deposits occur extensively in southern part of Andhra Pradesh. Nellore district is one amongst them. Quartz finds usage in Ferro-Alloys, Ceramic and Glass Industries. Presently Quartz is being mined from Ranga Reddy, Mahabubnagar, Medak, Kurnool & Nellore districts and exported from Chennai port to various countries34. Depending on the quality of the mineral, scope exists for setting up industrial units for the manufacture of Glass, Silicon Carbide, Fibreglass, Silica Gel, Quartz Wool, Ceramic Glass, Silicon Wafers and Refractories.
Nellore district hosts sizable base of ceramic, glass and leather units. Mineral based and building material industries in MSME structure of Nellore district secure the second position (more than 15%) after food and agro based industries in terms of employment and the third position (~ 13%) in terms of investments.
Glass sector has substantial potential for the node as it is one of the support industries for anticipated automobile sector. Building materials and ceramics hold equal potential due to upcoming construction activities both for industrial and residential units. Proximity to port provides opportunities for export oriented units in this sector to explore potential destinations overseas.
Leather industries
Leather sector is one of the prominent sectors in the manufacturing structure of Nellore district. As per ASI, it contributes 6% of total manufacturing output of the district and employs the largest number of people (2010-11).
Krishnapatnam International leather complex is coming up in Nellore district with unique solution for waste management. It is planned to be located a kilometer away from the Bay of Bengal into which the treated effluents can be disposed. Private contractors are being encouraged to built, own and operate an effluent treatment plant. Water source is planned from desalination plant budgeted in Rs.313 crore. The project received environmental clearance and the amount of Rs. 125 crore is expected from DIPP shortly along with Rs. 50 core from GoAP. The location of the complex in immediate proximity/within the KPT node will create potential for leather units to become a part of the proposed facility.
5.3 Implementation of recommendations In order to build a comprehensive eco-system for the success of proposed industries within the node, while economic enhancers (critical infrastructure projects in rail/ road etc) may be taken up by the State/ Centre depending on the jurisdiction of the project, other soft components under Value enhancers suggested in the above sections may be developed by the proposed Node Authority through self or by contracting to third party, some others may be developed by formation of Industries Association.
Funding and incentives for some of the proposed value enhancing facilities may be availed through existing schemes or worked out based on existing precedents in relevant sectors:
5.3.1 Food Processing The Scheme of Research & Development in Processed Food Sector35 can be utilized to creation of this center.
34 Department of mines and geology, Andhra Pradesh 35 http://www.mofpi.nic.in/H_Dwld.aspx?KYEwmOL+HGpVvrjs+CYNME2/tuH1AhSoew1yuW4ovCA1fRgaNSPkXg==
Final Report - Krishnapatnam Industrial Node Development Plan PwC/Nippon Koei 141

ELIGIBLE INSTITUTIONS
All Universities, IITs, Central/State Government Institutions, Public Funded Organisations, R&D laboratories and CSIR recognized R&D units in private sector
ELIGIBLE PURPOSES
Ministry supports research proposals preferably of applied nature with commercial value resulting in development of innovative products, processes and manufacturing practices, which lead to development of food processing industry in the country.
FUNDING PATTERN
Government organizations: 100% of cost of equipment, consumables and expenditure.
Institutional Charges equal to 10% of project cost subject to maximum of Rs. 3 lakh for non-academic institutions and Rs. 5 Lakh for academic institutions.
For Private organizations / universities / institutions, grant is given to the tune of 50% of equipment cost.
The SPV can tie up with some leading eligible institutions (both government and private) and work out the structure of the center on PPP mode.
5.3.2 Metallurgy Collaboration between the KPT SPV, government / private institution and the central/state government can be proposed to establish the center of excellence. The case study of the similar establishment between IIT Bombay and the central government which sponsored the project is presented below.
The SPV can contribute the infrastructure related components, academic institution can bring in R&D personnel and faculties, funding requirement can be made by government. In case of private institution additional funds can be envisaged.
For the quality testing laboratory:
Existing private testing laboratories can be approached by the developer with the following proposition:
• The developer provides necessary building and infrastructure facilities. The testing unit brings in the required testing equipment and personnel. User charges can be proportionally distributed between the KPT SPV and the testing facility.
In case of government testing facility, the possibility of support from the state government can be explored to expand the capacity of the existing unit and preference of locating this facility can be given to KPT Industrial node.
Final Report - Krishnapatnam Industrial Node Development Plan PwC/Nippon Koei 142

5.3.3 Electrical Machinery Existing private testing units can be approached by the developer with the following proposition:
• The developer provides necessary building and infrastructure facilities. The testing unit brings in the required testing equipment and personnel. User charges can be proportionally distributed between the KPT SPV and the testing facility.
• In case of government testing facility, the possibility of support from the state government can be explored to expand the capacity of the existing unit and preference of locating this facility can be given to KPT Industrial node.
CASE IN HAND
Centre of Excellence in Steel Technology at IIT Bombay (CoEST)
Indian Institute of Technology Bombay (IIT Bombay) has established a Centre of Excellence in Steel Technology (CoEST) in its premises, inaugurated on 25th July, 2014. The center is sponsored by the Ministry of Steel.
Focus of the center: creation of high quality manpower for the steel industry and R&D on steel technology.
Organizational structure of CoEST
As per the model of CoEST, industries are invited to join CoEST as Corporate Members at a reasonable membership fee and avail membership benefits. The benefits of being a Corporate Member include prioritising and deciding R&D and other activities of the Centre; priority access to Centre facilities (at discounted charges); participation in training programmes organized by the Centre and consultancy services at discounted rates in alloy development; manufacturing process optimization, Corrosion and Protection, Tool design, Material and Process Selection etc
IIT Bombay will provide the infrastructure/building for the proposed Center – a new building about 3000 sq. m.
Source: http://www.iitbombay.org/iitb_dean_acr/august-2014-newsletter/Centre%20of%20Excellence%20in%20Steel%20Technology%20inaugurated%20at%20IIT%20Bombay.pdf
CoEST
Advisory body (senior members from industry, academia and government)
Research Committee (corporate members, IIT BOmbay officials from R&D labs and faculty
members)
Final Report - Krishnapatnam Industrial Node Development Plan PwC/Nippon Koei 143

6 Land Use Plan
6.1 Review of Existing Development Plan The master plan for Krishnapatnam Node was formulated by KIPL(Krishnapatnam Infratech Private Limited) and the layout plan is illustrated in the following figure. As per that plan, “coal & coke industries”, “light engineering”, “carbon black industries”, “auto mobile industries” and “food agro industries” were the main industries to be developed, along with an area for logistics, in the phase-1 area of Krishnapatnam Node. In addition to industrial development, plots for residential and commercial use were also planned to promote the “Walk to Work” concept.
Source: Krishnapatnam Port Company Limited MP
Figure 6.1: Existing Master Plan of Krishnapatnam Port
Further to the existing plan, the following points on transportation and land use should be considered to improve the attractiveness of the area for foreign investors.
Final Report - Krishnapatnam Industrial Node Development Plan PwC/Nippon Koei 144

Table 6.1: Items to be considered in the existing plan (Krishnapatnam)
Observation in the Existing Plan Proposed Revision Transportation • Access road from Krishnapatnam port to
Node area is an unpaved 1-lane road. • Access road to Krishnapatnam and connectivity to
NH-5 has to be improved • No public transport system is proposed • A bus system is necessary to transport workers from
the nearest railway station to individual factories Land Use • Nellore city, which is expected to be the
main source of labour, is 40km from the Node.
• Residential complexes for middle/low income workers should be built to ensure availability of manpower within the node.
Source: JICA Study Team 6.1.1 Existing Infrastructure Projects As of Dec 2014, these are no large scale infrastructure projects proposed in Krishnapatnam Node or the surrounding areas. However, KPIL is planning to develop an access road and railway from the south of Krishnapatnam Node to NH-5 to improve connectivity towards Bengaluru. This road will enhance the connectivity of the node in conjunction with other projects such as developing the access road from Krishnapatnam port to the Node, building a loop road network inside the Node and improving NH-5 between Naidupeta and the junction of the port access road.
Source: JICA Study Team
Figure 6.2: Road Connectivity of Krishnapatnam Node
Krishnapatnam Node
Naidupeta
NH-5
Krishnapatnam Port
Final Report - Krishnapatnam Industrial Node Development Plan PwC/Nippon Koei 145

Table 6.2Existing Infrastructure Projects in Krishnapatnam Node
Category Project Name Specification Remarks Road Naidupeta-Krishnapatnam
Port Access Road (Tentative Name)
Naidupeta (NH 5) via Durgarajapatnam and new industrial park to Krishnapatnam Port
Proposed by Krishnapatnam Port Company Limited
Railway Naidupeta-Krishnapatnam Port Railway (Tentative Name)
55.72 km Proposed by Krishnapatnam Port Company Limited
Source: JICA Study Team
6.2 Development Framework
6.2.1 Land for Infrastructure Development The target year for completion of the node’s development is 2033. Taking into account appropriate development scales and after discussion with nodal agencies, JICA Study Team proposes to develop the node in three phases: Phase-1 (2014-2018), Phase-2 (2019-2023) and Phase-3 (2024-2033).
Based on industrial analysis for Krishnapatnam Node by JICA Study Team, major future industries are likely to be from traditionally strong sectors including “Metallurgy”, “Food Processing”, “Textile & Apparels”, “Electrical Machinery”, “Chemical & Petrochemicals”, “Pharma” and other potential industries. The estimated land demand of those industries was examined and the following scenario was assumed to be the effective scenario for necessary infrastructure development.
Table 6.3: Land for Infrastructure Development on Krishnapatnam Node
(unit: acre) Phase-1
(2014-2018) Phase-2
(2019-2023) Phase-3
(2024-2033) Traditionally Strong Sectors
Metallurgy 234 587 1,402 Food Processing 424 1,063 2,540 Textiles & Apparels 76 190 453 Electrical Machinery 212 532 1,270 Chemicals & Petrochemicals
83 207 494
Pharma 12 29 69 (Sub-total) 1,041 2,608 6,159
Potential Sectors Medical Equipment 65 163 389 Machinery 65 163 389 Auto 65 163 389 Computer, electronic and optical products - CMIE
65 163 389
(Sub-total) 260 652 1,556 Total 1,300 3,258 7,785
Source: JICA Study Team
6.2.2 Future Population The future population of the node, consisting of the working population and residential population, was projected according to the land demand shown in Section 5.2.1 as well as the following conditions.
The estimation is based on the population projection which JICA Study Team carried out in the Part-A study.
Final Report - Krishnapatnam Industrial Node Development Plan PwC/Nippon Koei 146

Residential area should be developed in each phase, with a plan for a final total of 200,000 residents to live in Krishnapatnam Node.
There will be workers who will live outside the Node; their families will live in the surrounding sub-districts. Their population is estimated by subtracting the number of workers living within the node from the total number of workers.
As a result, the working population is projected as 582,700 people with a residential population of 200,000 people in the Krishnapatnam Node in 2033.
Table 6.4: Population Framework
Phase-1 Phase-2 Phase-3 Working Population 101,720 243,848 582,706
Residential Population
33,408 93,695 200,000
Source: JICA Study Team
6.3 Land Use Plan
6.3.1 Spatial Development Concept As described in Section 5.1, a layout plan for Krishnapatnam Node has been formulated by KPIL. Taking this plan into consideration, JICA Study Team prepared a new layout plan for Krishnapatnam Node according to the following development concepts.
[Road Network] b. The main road which connects to Krishnapatnam port and NH-5 passes through the centre of the node in a
north-south direction (shown as a blue line in the figure on right). c. Diamond junctions are proposed at 2 major intersections in the south of Node to ensure a smooth and
efficient flow of traffic.
[Logistics] d. The logistics sector (i.e. transport of freight) will be served by developing a new railway access line to
Krishnapatnam Node from the existing Krishnapatnam port railway line. e. A logistics hub is planned in the north of Node along the main road.
[Grid Pattern for the Developable Area] f. The whole area will be framed in a grid pattern of roads forming large blocks of 500m-1km size.
[Residential Area Development] g. Residential area will not be surrounded by industrial areas but will rather be located at three places, centre
of the node, and the northern area. The residential area in each phase should be located at different places. h. Residential areas will be developed in the Node to support 200,000 people by 2033. The residential area
will be divided into three phases, with a projected population of 33,000 people in phase-1, 50,000 people in phase-2 and 117,000 people in phase-3.
i. Residential area and resort development on the beach side is proposed in Phase-3 area. But flood and tsunami prevention is required for the area.
[Environmental Reservation] j. The canal will be maintained, along with a buffer zone. k. The northern part of the Node is adjacent to a reserved forest. The appropriate buffer zone should be
allocated around the forest area as per existing guidelines (URDPFI Guidelines 2014, Ministry of Urban Development).
Final Report - Krishnapatnam Industrial Node Development Plan PwC/Nippon Koei 147

l. Highly hydrophilic parkland with a clean and green environment will be designed by maintaining a 100m wide buffer zone along the canal within Krishnapatnam Node.
m. Land development is required to prevent flooding due to cyclones or high tides. For this reason, a road dyke is to be adopted for the development of the main road.
Figure 6.3: Road Network in Krishnapatnam Node
Residential/ Resort development
SWM facility
Logistics hub
Reserved forest
Source: JICA Study Team
Final Report - Krishnapatnam Industrial Node Development Plan PwC/Nippon Koei 148

6.3.2 Land Use and Phasing Plan Based on the development framework and the development concepts above, the required area for each land use category is estimated as shown in the following table.
Table 6.5: Proposed Area by Land Use in Krishnapatnam Node
(Acre) Phase-1 Phase-2 Phase-3 Total Industrial area 1,300 1,957 4,527 7,785 Residential area 284 428 987 1,699 Existing settlement 164 94 261 519 Infrastructure(road & plant)
770 643 1095 2,508
Water body, green area and others
91 570 799 1,460
Total 2,609 3,692 7,669 13,971
Source: JICA Study Team
Final Report - Krishnapatnam Industrial Node Development Plan PwC/Nippon Koei 149

Considering the land acquisition status and accessibility to Krishnapatnam port, the following phased developments are proposed.
Figure 6.4: Phasing Plan
Source: JICA Study Team
Final Report - Krishnapatnam Industrial Node Development Plan PwC/Nippon Koei 150

6.4 Development Plan for Residential Area The development plans for residential areas are proposed according to “NATIONAL BUILDING CODE OF INDIA (NBCoI) 2005, GoI”. The specifications are shown in the following table.
Table 6.6: Specification of Housing Building
Content Amount Planed Population
Residential area is planned along the boundary on the western side and southern side
200,000 (persons)
Household Member
National Family health survey (NFHS) 2007 3.9(persons/family)
Number of families (2033)
(Population of Krishnapatnam)/3.9 (HM) 51,282(a) (families)
Specification of residence
Plot area of one house 38.82 (m2) 8 units form one floor of house 310.56 (m2) Common space per one floor 61.21 (m2) Area of one floor (coverage) 371.77 (m2) Area of three floors 1,115.31 (m2) Number of buildings
=51,282(a) / 8(per floor)*3(three floors) 2,137 (building)
Area volume (one building) Coverage = 35%,Floor volume = 100%
(National Building Code of India 9.6.2 Table 4 No. iv)
1,062.2 (m2)
Total area volume 2,269,658.12 (m2) 226.97 (ha) Open Space (15%) 34.00 (ha)
District Road (10%) 26.10ha Total 287.11 (ha)
Source: JICA Study Team
In addition to the residential areas above, the number of and required area for necessary public facilities (e.g. educational facilities, health centres, offices, civic centre etc.) are estimated based on the residential population and “National Building Code of India”. The estimated results indicate that the minimum requirement is a total of 180 ha for public facilities. According to the Indian standard, accommodations (hotel, service apartment, guest house etc.) are not considered, however these facilities are also required to accommodate short stay investors. Additionally, development of advanced educational facility such as international school and general hospital serving high quality medical care are recommended to make this area more livable and attractive. The required public facilities in Japanese standard are listed below:
Administrative facility Detached office of the municipal office Convention facility Assembly hall, Civic centre Cultural facility Library, Museum, Art Museum Educational facility Kinder garden, Primary school, Junior high school, High school,
Vocational training school, College, University Welfare facility Nursery centre, Day-care centre Healthcare facility Medical clinic, Health Centre, General hospital Security service facility Police office, Fire station Telecommunication Post office, Telecom centre Commercial facility Supermarket, Shopping mall Others Bank, Hotel, Research centre, Sport stadium(Play ground)
Final Report - Krishnapatnam Industrial Node Development Plan PwC/Nippon Koei 151
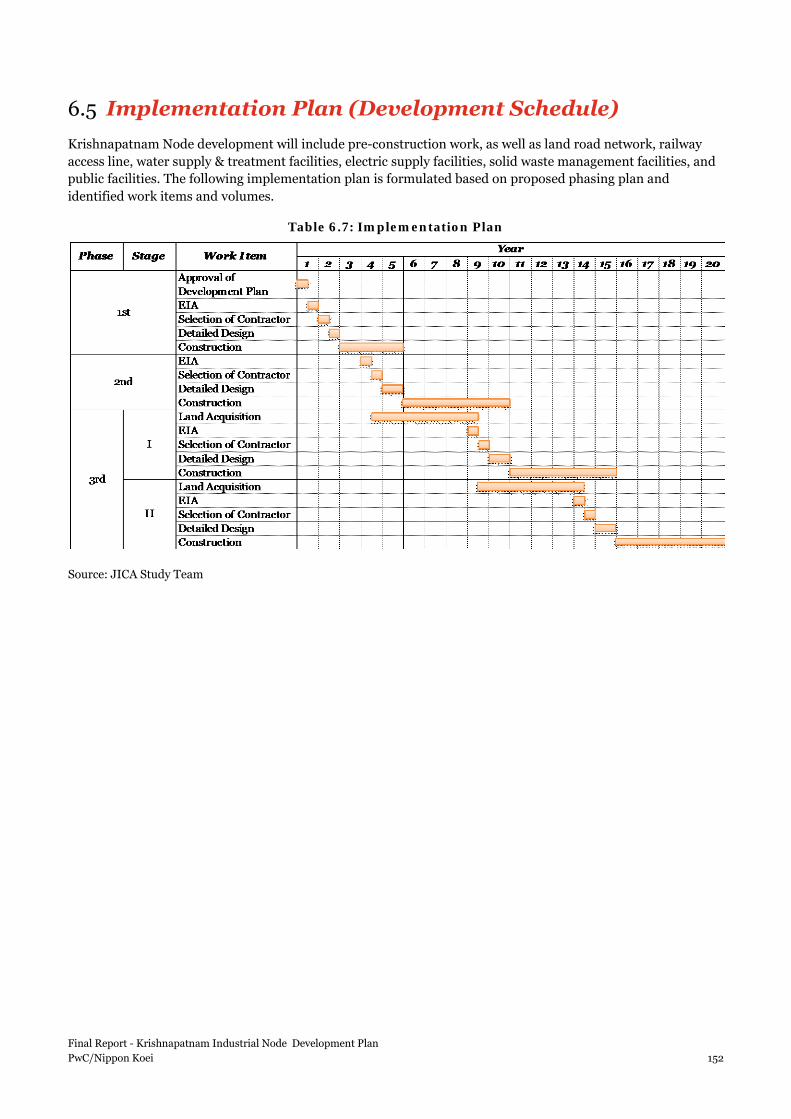
6.5 Implementation Plan (Development Schedule) Krishnapatnam Node development will include pre-construction work, as well as land road network, railway access line, water supply & treatment facilities, electric supply facilities, solid waste management facilities, and public facilities. The following implementation plan is formulated based on proposed phasing plan and identified work items and volumes.
Table 6.7: Implementation Plan
Source: JICA Study Team
Final Report - Krishnapatnam Industrial Node Development Plan PwC/Nippon Koei 152

6.6 Cost Estimate Land Development
This cost estimation is based on the presumption that land development at Krishnapatnam Node will require only land grading works without requiring additional soil from outside the node, since the elevation of Krishnapatnam Node is higher than the designed ground level of Krishnapatnam port (3.5m above sea level). It means the land development costs will be relatively low. The total land development cost is estimated as INR 48,834 Lakh and the cost for each phase is shown below.
Table 6.8: Cost Estimate of Land Development (Krishnapatnam Node)
Source: JICA Study Team
Flood analysis is recommended to identify the risk of disasters in this area and to prepare a disaster prevention plan.
Housing Development
Based on the proposed plan of housing development, total development cost including construction of housing buildings, pavement and open space is estimated as INR 291,186 Lakh. The details are shown as below:
Table 6.9: Cost Estimate for Housing Development Plan (Krishnapatnam Node)
Source: JICA Study Team
Public Facility Development
Based on the proposed plan for public facilities, total development cost including construction of hospital, commercial centres, sport ground, schools, and fire station is estimated as 97,113 Lakh INR. The details are shown as below:
Table 6.10: Cost Estimate for Public Facilities Development Plan (Krishnapatnam Node)
Source: JICA Study Team
Quantity Cost Quantity Cost Quantity Cost(INR) (INR Lakh) (INR Lakh) (INR Lakh) (INR Lakh)
Excavation 1m per 1 sq.m on half of site cu.m 120 2,631,366 3,158 3,960,810 4,753 9,160,617 10,993 18,903Soil Transportation & Embankment 1m per 1 sq.m on half of site cu.m 190 2,631,366 5,000 3,960,810 7,526 9,160,617 17,405 29,930
5,262,732 8,157 7,921,620 12,279 18,321,234 28,398 48,834Total
Phase 3 (2024-2033)Total
Land Development Works
UnitDescriptionItemUnit Rate
Phase 1(2014-2018) Phase 2 (2019-2023)
LAND DEVELOPMENT WORKS
Quantity Cost Quantity Cost Quantity Cost(INR) (INR Lakh) (INR Lakh) (INR Lakh) (INR Lakh)
sq.m 12,163 794,380 96,624 794,380 96,624 794,380 96,624 289,872 sq.m 63 692,246 438 692,246 438 692,246 438 1,314
1,486,626 97,062 1,486,626 97,062 1,486,626 97,062 291,186
TotalDescription
HousingOpen Space
Total
UnitUnit Rate
Phase 1(2014-2019) Phase 2 (2019-2023) Phase 3 (2024-2033)Item
Cost of Housing Area Construction
Residential Area Development
Quantity Cost Quantity Cost Quantity Cost(INR) (INR Lakh) (INR Lakh) (INR Lakh) (INR Lakh)
sq.m 12,163 265,441 32,287 265,441 32,287 265,441 32,287 96,860 sq.m 63 133,333 84 133,333 84 133,333 84 253
398,774 32,371 398,774 32,371 398,774 32,371 97,113
TotalDescription
Construction of Public FacilitiesTransportation & Embankment
Total
UnitUnit Rate
Phase 1(2014-2019) Phase 2 (2019-2023)
Cost of Public Facilities Construction
Public Facilities
Phase 3 (2024-2033)Item
Final Report - Krishnapatnam Industrial Node Development Plan PwC/Nippon Koei 153