Comprehensive Annual Financial Report Oregon Public ...
118
Comprehensive Annual Financial Report Oregon Public Employees Retirement System An Agency of the State of Oregon For the Fiscal Year Ended June 30, 2012
Transcript of Comprehensive Annual Financial Report Oregon Public ...

Comprehensive Annual Financial ReportOregon Public Employees Retirement System
An Agency of the State of Oregon
For the Fiscal Year Ended June 30, 2012

Oregon Public EmployeesRetirement System
An Agency of the State of Oregon
Comprehensive AnnualFinancial Report
For the Fiscal Year Ended June 30, 2012
Paul R. ClearyExecutive Director
Jon E. DuFreneChief Financial Officer
11410 SW 68th Parkway, Tigard OR 97223Mailing Address – PO Box 23700, Tigard OR 97281-3700 – Phone 503-598-7377
Website – http://oregon.gov/pers

Table of Contents
INTRODUCTORY SECTION 2 Letter of Transmittal 5 Public Employees Retirement Board 6 Organizational Chart 7 Certificate of Achievement 8 Public Pension Standards Award
FINANCIAL SECTION 10 Independent Auditor’s Report 12 Management’s Discussion and Analysis Basic Financial Statements 20 Statement of Fiduciary Net Assets - Pension and
Other Postemployment Plans 22 Statement of Changes in Fiduciary Net Assets -
Pension and Other Postemployment Plans 24 Statement of Net Assets - Proprietary Fund 25 Statement of Revenues, Expenses, and Changes in
Net Assets - Proprietary Fund 26 Statement of Cash Flows - Proprietary Fund 27 Notes to the Financial Statements Required Supplementary Information 53 Schedules of Funding Progress 54 Schedules of Employer Contributions 55 Schedule of Claims Development Information Other Supplementary Information 56 Schedule of Plan Net Assets - Defined Benefit
Pension Plan 57 Schedule of Changes in Plan Net Assets -
Defined Benefit Pension Plan 58 Schedule of Administrative Expenses - All Funds 58 Schedule of Payments to Consultants and
Contractors 59 Summary of Investment Fees, Commissions, and
Expenses
INVESTMENT SECTION 62 Investment Officer’s Report 63 Description of Investment Policies 64 Investment Results 65 Investment Target and Actual Allocations 66 List of Largest Assets Held 67 Schedule of Fees and Commissions 67 Schedule of Broker Commissions 68 Investment Summary
ACTUARIAL SECTION 70 Actuary’s Certification Letter 74 Actuarial Assumptions and Methods Actuarial Schedules 82 Schedule of Active Member Valuation Data 82 Schedule of Retirees and Beneficiaries Added to
and Removed From Rolls 83 Schedules of Funding Progress by Rate Pool 84 Analysis of Financial Experience 85 Solvency Test Plan Summary 86 Summary of Plan Provisions
STATISTICAL SECTION 94 Statistical Notes 95 Fiscal Year Revenues by Source - Retirement
Programs 96 Fiscal Year Expenses by Type - Retirement
Programs 97 Fiscal Year Changes in Net Assets - Retirement
Programs 98 Fiscal Year Revenues by Source - OPEB 99 Fiscal Year Expenses by Type - OPEB 100 Fiscal Year Changes in Net Assets - OPEB 101 Calendar Year Revenues by Source - Retirement
Programs 102 Calendar Year Expenses by Type - Retirement
Programs 103 Calendar Year Changes in Net Assets - Retirement
Programs 104 Calendar Year Revenues by Source - OPEB 105 Calendar Year Expenses by Type - OPEB 106 Calendar Year Changes in Net Assets - OPEB 107 Schedule of Benefit Expenses by Type 107 Schedule of Earnings and Crediting 107 Schedule of Average OPEB Benefits for
Retirement Health Insurance Account 107 Schedule of Average OPEB Benefits for Retiree
Health Insurance Premium Account 108 Schedule of Average Defined Benefit Pension
Payments 108 Schedule of Benefit Recipients by Benefit Type 109 Schedule of Retirement System Membership -
Calendar Year 109 Schedule of Retirement System Membership -
Fiscal Year 109 Schedule of Principal Participating Employers 110 Schedule of Participating Employers
• i •

Introductory Section

Oregon Public Employees Retirement System
• 2 •
Letter of Transmittal
Public Employees Retirement SystemHeadquarters:
11410 S.W. 68th Parkway, Tigard, ORMailing Address:
P.O. Box 23700Tigard, OR 97281-3700
(503) 598-7377TTY (503) 603-7766
ht tp: / /oregon.gov/PERS/
Oregon John A. Kitzhaber, M.D., Governor
December 18, 2012
Public Employees Retirement BoardOregon Public Employees Retirement System11410 SW 68th ParkwayTigard, Oregon 97223
We are pleased to submit the Comprehensive Annual Financial Report (CAFR) of the Oregon Public Employees Retirement System (PERS or “the System”) for the fiscal year ended June 30, 2012. This report includes all funds over which the Public Employees Retirement Board (Board) exercises authority. These funds were established to provide retirement, death, and disability benefits to members; administer retiree health insurance programs; and oversee the state-sponsored deferred compensation program. As of June 30, 2012, PERS provided services to 902 employers and to more than 331,000 active, inactive, and retired members and beneficiaries.
The CAFR is intended to fulfill the legal requirements of Oregon Revised Statute (ORS) 238.630. PERS management is responsible for both the accuracy of the data and the completeness and fairness of the presentation, including all disclosures.
Macias Gini & O’Connell LLP (MGO) has audited the accompanying financial statements in accordance with generally accepted auditing standards, and its opinion is included in this report.
Management’s Discussion and AnalysisManagement’s Discussion and Analysis (MD&A) provides a narrative introduction, overview, and analysis to accompany the
basic financial statements. This letter of transmittal is designed to complement MD&A and should be read in conjunction with it. We would like to direct your attention to MD&A, which begins on page 12.
Economic Condition and Major InitiativesThe economic condition of PERS is affected primarily by investment earnings. A comparative analysis of investment rates of
return is presented on page 64 of this report.
Major Initiatives
Strategic Management System
PERS is developing an outcome-based management system to improve its operational performance and organizational alignment. The system utilizes a process-based orientation that integrates problem solving and decision making with active engagement from the front-line staff that perform the daily work.
This new management system will allow PERS to better align its strategic planning and organizational development in support of its Mission, Vision, Values, and Operating Principles. The agency identified six key goals that, as achieved, will advance those ideals:
1. Collaborative and transparent leadership,
2. Engaged and empowered workforce,
3. Efficient, effective, adaptable organization,
4. Engaged and educated stakeholders,
5. Timely and accurate service, and
6. Trusted and credible agency.

Oregon Public Employees Retirement System
• 3 •
Supporting our key goals are six core operating processes and six core supporting processes. Each process has an owner and outcome measures to monitor and document our progress. Quarterly target review meetings are held to review our progress and identify areas for improvement.
Customer Satisfaction Survey
Our member and employer customer satisfaction surveys conducted in fiscal year 2011 show overall improvement from 2010, continuing the positive trend of year-to-year improvement over the six-year survey period. Over 90 percent of the member survey respondents and nearly 80 percent of the employer survey respondents rated our overall customer service as “good” or “excellent.”
Member Data Verifications
Active and inactive members can now request verification of certain employment history and potential benefit calcula-tion data based on the information that has been reported to PERS by the members’ employer(s).
The verification includes the member’s accrued creditable service or retirement credit and the member’s “final average salary.”
If PERS produces a verification, a member’s retirement benefit will be calculated using data that is not less than the amounts provided in the verification, except in certain circumstances. For example, account balances will be adjusted for earnings or losses credited up to the member’s effective retirement date and accumulated unused sick leave will be adjust-ed for leave accrued and used after the date specified in the verification.
Benefit Overpayment Recovery Project
Based on recent Oregon Supreme Court decisions, PERS is preparing to begin recovery of approximately $165 mil-lion from nearly 29,000 PERS benefit recipients. Overpayments resulted from applying 1999 earnings crediting rates to affected member accounts that were later revised as directed by courts and legislation. The project objective is to either complete the collection process or have repayment plans in place for all affected benefit recipients by July 1, 2013.
Financial InformationThe basic financial statements have been prepared in accordance with accounting principles generally accepted in the United
States of America.
Internal ControlsManagement is responsible for establishing and maintaining a system of internal controls to protect PERS’ assets from
loss, theft, or misuse and to ensure that adequate accounting data is compiled for the preparation of financial statements in conformity with generally accepted accounting principles. There are inherent limitations in the effectiveness of any system of internal controls, including the possibility of human error and the circumvention or overriding of controls. Accordingly, even an effective internal control system may not prevent or detect misstatements and can provide only reasonable assurance with respect to financial statement preparation.
FundingMember contributions are set by statute at 6.0 to 7.0 percent of covered salary. Employer contributions are established by
actuarial valuations conducted biennially in odd-numbered calendar years. PERS’ funding objective is to meet long-term benefit promises through contributions that fund benefits as they accrue. An adequate contribution level, when combined with investment earnings, will result in the full funding of benefits as they come due. If the level of funding is adequate, the ratio of assets accumulated to total liabilities will increase, and more income will be available for investment. Prudent investment of assets and returns on those investments should increase the funding base and allow for a more stable employer contribution rate. As of the December 31, 2011 actuarial valuation, PERS has a funded ratio of 82.0 percent for the defined benefit plan it administers (see page 53).
InvestmentsThe Oregon Investment Council (OIC) has statutory authority (ORS 293.701) to establish policies for the investment and
reinvestment of PERS funds. The OIC’s primary investment objective is to make PERS’ investment funds as productive as possible. At the same time, the OIC acts as a prudent investor in the management of the PERS portfolio.
An integral part of investment policy is the strategic asset allocation policy. The target investment portfolio mix at fair value as of June 30, 2012, is 43 percent public equity, 16 percent private equity, 25 percent debt securities, 11 percent real estate, and 5 percent alternative equity.
In addition to approved asset classes, target asset allocation ranges, and rebalancing policies, other safeguards on investments include the use of an independent custodian, defined limits of delegated authority, and independent audits. The System’s long-

Oregon Public Employees Retirement System
• 4 •
term investment outlook allows the portfolio to take advantage of the favorable risk-return characteristics of equities by placing more emphasis on this category. The OIC primarily uses external portfolio managers, employing both passive (indexed) and active strategies. The portfolio is broadly diversified among equities, debt securities, real estate, and private equities, with additional diversification achieved through domestic and international investing. PERS securities are held by a custodian, State Street Bank and Trust Company.
PERS’ Regular investment portfolio exhibited a modest gain in fiscal year 2012 with a rate of return of 1.6 percent. This compares with a rate of return of 22.3 percent for fiscal year 2011. The fund’s trailing 10-year return was 7.4 percent, 0.6 percent lower than the System’s actuarial assumed rate of 8.0 percent. Descriptions of specific OIC policies regarding diversification, performance objectives, fees, and asset allocation are found on pages 63 through 68.
Awards and AcknowledgementsCertificate of Achievement
The Government Finance Officers Association of the United States and Canada (GFOA) awarded a Certificate of Achievement for Excellence in Financial Reporting to PERS for its Comprehensive Annual Financial Report (CAFR) for the fiscal year ended June 30, 2011. The Certificate of Achievement is a prestigious national award that recognizes conformance with the highest standards of preparation of state and local government financial reports.
To be awarded a Certificate of Achievement, a government unit must publish an easily readable and efficiently organized CAFR, whose contents conform to program standards. The CAFR must satisfy both generally accepted accounting principles and applicable legal requirements. A Certificate of Achievement is valid for one year only. PERS has received a Certificate of Achievement for the last 21 consecutive years. We believe our current report continues to conform to the Certificate of Achievement program requirements, and we are submitting it to the GFOA.
Public Pension Standards AwardThe Public Pension Coordinating Council (PPCC) awarded the 2012 Public Pension Standards Award to PERS for its plan
design and administration.
The PPCC is a coalition of three associations representing public pension funds that cover the vast majority of public employees in the United States. The associations are: the National Association of State Retirement Administrators (NASRA), the National Conference on Public Employee Retirement Systems (NCPERS), and the National Council on Teacher Retirement (NCTR). Public pension standards are intended to reflect minimum expectations for public retirement system management and administration and to serve as benchmarks by which all defined benefit public plans are measured.
This is the tenth year the PPCC has offered the award to public retirement systems and the ninth consecutive year PERS has applied for and received the award.
AcknowledgmentsPERS strives to provide complete and reliable information as a basis for making management decisions, to demonstrate
responsible stewardship of assets contributed by members and their employers, and to comply with legal provisions. The compilation of this report reflects the combined efforts of the PERS staff.
This report is available on the PERS website at http://oregon.gov/pers, and a link to this document will be e-mailed to all PERS employers. Summary financial information and the website link will be reported in the PERS newsletter, Perspectives, which is distributed to active and retired members.
The cooperation of PERS employers contributes significantly to PERS’ success and is greatly appreciated. We would also like to express our gratitude to the PERS Board and staff, the OIC, the Oregon State Treasury staff, our advisors and consultants, and the many other people who work diligently to ensure the successful operation of PERS.
Respectfully submitted,
Paul R. Cleary Jon E. DuFreneExecutive Director Chief Financial Officer

Oregon Public Employees Retirement System
• 5 •
Public Employees Retirement BoardThe Oregon Legislature has delegated authority to the PERS Board of Trustees to administer the System. The Board is
comprised of five trustees who administer retirement (service and disability), death, and retiree health insurance benefits. PERS also administers the Oregon Savings Growth Plan, a deferred compensation program for state government employees.
All members of the Board are appointed by the governor and confirmed by the state Senate. The governor designates the chairperson.
One member must be a public employer manager or a local elected official, one member must be a union-represented public employee or retiree, and three members must have experience in business management, pension management, or investing.
As of June 30, 2012, the three Board members representing business management, pension management, or investing are James Dalton, John Thomas, and Rhoni Wiswall. Pat West was appointed to represent public employees and retirees, and Laurie Warner was appointed to represent public employers. James Dalton is Board chair.
Terms for each member begin and expire with staggered dates.
James Dalton (chair)James Dalton was a senior vice president of Tektronix, Inc., a leading test and measurement technology company. He
retired in 2008 after Tektronix was acquired by Danaher Corporation. He was a past member of the board of directors of RadiSys Corporation and the Multnomah County Library Foundation. Dalton received his bachelor’s degree in economics from the University of Massachusetts and his JD from Boston College Law School.
John ThomasJohn Thomas co-founded Pacific Benefit Consultants, Inc. in 1993 and served as its president when it was selected as
the second-ranked company in Oregon by Oregon Business Magazine. He currently serves as vice president of Advantage Dental and also serves as a divisional vice president and chair of the Finance Committee of MDRT, an international association of insurance and financial service professionals located in Chicago. Thomas previously served as chair of the McKenzie-Willamette Hospital Board of Trustees and was chair of Lane County Boundary Commission. He is also the past president of the Springfield Area Chamber of Commerce. Thomas holds a BA from Willamette University and an MS in financial services from the American College in Bryn Mawr, Pennsylvania. He holds professional designations of Chartered Life Underwriter, Chartered Financial Consultant, and Certified Financial Planner.
Laurie Warner (vice-chair)Laurie Warner began working in state government in 1988 when she was hired as assistant director of the Federal
Child Nutrition Programs with the Department of Education. In 1991 she was hired as a budget analyst in the Department of Administrative Services (DAS) and was later promoted to budget section manager. In 1999 she left DAS to become deputy director of the Oregon State Parks and Recreation Department, where she later served as acting director. Warner returned to DAS in July 2001 to serve first as the Internal Audits manager and then the Facilities Division administrator. In October 2003 she was asked to serve as the acting director for PERS as it went through Board and program changes required by 2003 legislation. In June 2004, Warner returned to DAS as the deputy director and served as the acting direc-tor from September 2004 through December 2005. In January 2006, she was appointed the director of the Employment Department. Warner has a bachelor’s degree from Oregon State University and an MBA from Willamette University’s Atkinson Graduate School of Management.
Pat WestPat West began his career as a Salem firefighter in 1975 and retired as a captain in 2001. Pat was also the legislative
director of the Oregon State Firefighters Association from 1987 to 1998 and president from 1998 to 2008. He served on the Oregon Workers’ Compensation Management Labor Advisory Committee, the Governor’s Fire Policy Committee, PERS’ Legislative Advisory Committee, and the Board of Oregon PERS Retirees, Inc. Pat is a graduate of South Salem High School and Chemeketa Community College. He attended Oregon State University and was in the U.S. Army from 1968 to 1970.
Rhoni WiswallRhoni Wiswall has been with Texas-based Crestline Investors since 2009. She currently serves as managing director
and head of Consultant Relations. She spent 23 years with Invesco where her positions included managing director and senior account manager. She is a member of the Board of Trustees for Jesuit High School, Loaves and Fishes (Meals on Wheels), and Bridge Meadows. Wiswall previously served on the Oregon Food Bank Board of Directors and is a member of the Oregon Community Foundation Metro Leadership Council. She received a BA in business administration from George Fox University.

Oregon Public Employees Retirement System
• 6 •
Public Employees Retirement System Organizational Chart
Retirement Services
Benefit Application and Intake
Specialty Services
Brian C. HarringtonAdministrator, Benefit
Payments Division
Public Employees Retirement Board
Jeffrey M. MarecicAdministrator, Information
Services Division
Business Information and Technical Services
Enterprise Application
Technical Operations
VacantAdministrator, Policy, Planning,
and Legislative Analysis Division
Research and Risk Management
Contested Case Hearings
Administrative Rules
Legislative Issues
Yvette S. ElledgeAdministrator, Customer
Service Division
Publications and Communications
Member/Employer Relations
Member Account Priority Processing
Jon E. DuFreneAdministrator, Fiscal
Services Division
Financial Reporting
Actuarial Analysis
Business Operations
Contributions and Banking
Facilities Services
Public Employees Retirement System ConsultantsActuaryMilliman, Inc.
Legal CounselOregon Department of JusticeOrrick Herrington & Sutcliffe LLPIce Miller LLPHarrang Long Gary Rudnick PC
Insurance ConsultantButler Partners & Associates LLC
Medical AdvisorF. William Miller, MD
TechnologyHP Enterprise ServicesProvaliant, Inc.
AuditorMacias Gini & O’Connell LLP
Strategic and Organizational PlanningMass Ingenuity
InvestmentsInvestment managers are reported in the Summary of Investment Fees, Commissions, and Expenses on page 59.
Internal AuditorExecutive Support
Steven P. RodemanDeputy Director
Information Center
Oregon State Social Security Administration
Paul R. Cleary Executive Director
Health Insurance
Deferred Compensation
Contracts and Procurement
Human Resources
Project Management Office

Oregon Public Employees Retirement System
• 7 •
Certificate of Achievement

Oregon Public Employees Retirement System
• 8 •
Public Pension Standards Award

Financial Section

Oregon Public Employees Retirement System
• 10 •
Walnut Creek
Oakland
LA/Century City
Newport Beach
San Diego
Seattle
www.mgocpa.com
Sacramento3000 S Street, Suite 300Sacramento, CA 95816
916.928.4600
· 10 ·
To Honorable John A. Kitzhaber, M.D. Governor of Oregon
To the Public Employees Retirement Board of the Oregon Public Employees Retirement System Tigard, Oregon
INDEPENDENT AUDITOR’S REPORT
We have audited the accompanying financial statements of the fiduciary activities and proprietary activities of the Oregon Public Employees Retirement System (the System), a pension trust fund of the State of Oregon, as of and for the fiscal year ended June 30, 2012, which collectively comprise the System’s basic financial statements as listed in the table of contents. These financial statements are the responsibility of the System’s management. Our responsibility is to express opinions on these financial statements based on our audit. The prior year summarized comparative information has been derived from the System’s 2011 financial statements and, in our report dated December 29, 2011, we expressed unqualified opinions on the respective financial statements of the fiduciary activities and the proprietary activities.
We conducted our audit in accordance with auditing standards generally accepted in the United States of America and the standards applicable to financial audits contained in Government Auditing Standards,issued by the Comptroller General of the United States. Those standards require that we plan and perform the audit to obtain reasonable assurance about whether the financial statements are free of material misstatement. An audit includes consideration of internal control over financial reporting as a basis for designing audit procedures that are appropriate in the circumstances, but not for the purpose of expressing an opinion on the effectiveness of the System’s internal control over financial reporting. Accordingly, we express no such opinion. An audit also includes examining, on a test basis, evidence supporting the amounts and disclosures in the financial statements, assessing the accounting principles used and significant estimates made by management, as well as evaluating the overall financial statement presentation. We believe that our audit provides a reasonable basis for our opinions.
In our opinion, the financial statements referred to previously present fairly, in all material respects, the respective financial position of the fiduciary activities and the proprietary activities of the Oregon Public Employees Retirement System as of June 30, 2012, and the respective changes in financial position and, where applicable, cash flows thereof for the fiscal year then ended in conformity with accounting principles generally accepted in the United States of America.
As discussed in Note 3(B) to the basic financial statements, based on the most recent pension plan actuarial valuations as of December 31, 2011, the System’s independent actuary determined that the value of the System’s actuarial accrued liability exceeded the actuarial value of its assets by $11.0 billion.
Also discussed in Note 3(B) to the basic financial statements, based on the most recent actuarial valuations for the post-employment healthcare benefit plans as of December 31, 2011, the System’s independent actuary determined that the value of the System’s actuarial accrued liabilities exceeded the actuarial value of its assets by $221.5 million for the Retirement Health Insurance Account plan, and $29.9 million for the Retiree Health Insurance Premium Account plan.
As discussed in Note 10 to the basic financial statements, the System is not in compliance with the Oregon Revised Statutes, Chapter 238.660, which requires that all moneys paid to the System “shall be deposited with the State Treasury.” As of June 30, 2012, a total of $75.0 million is held by the third-party administrator of the Standard Retiree Health Insurance Account.
www.mgocpa.com

Oregon Public Employees Retirement System
• 11 •
· 11 ·
The financial statements include summarized prior year comparative information. Such information does not include all of the information required to constitute a presentation in conformity with accounting principles generally accepted in the United States of America. Accordingly, such information should be read in conjunction with the System’s basic financial statements for the fiscal year ended June 30, 2011, from which such summarized comparative information was derived.
In accordance with Government Auditing Standards, we have issued our report dated December 18, 2012, on our consideration of the System’s internal control over financial reporting and on our tests of its compliance with certain provisions of laws, regulations and contracts and other matters. The purpose of that report is to describe the scope of our testing of internal control over financial reporting and compliance and the results of that testing, and not to provide an opinion on the internal control over financial reporting or on compliance. That report is an integral part of an audit performed in accordance with Government Auditing Standards and should be considered in assessing the results of our audit.
Accounting principles generally accepted in the United States of America require that the Management’s Discussion and Analysis, the Schedules of Funding Progress, the Schedules of Employer Contributions, and Schedule of Claims Development Information, as listed in the table of contents, be presented to supplement the basic financial statements. Such information, although not a part of the basic financial statements, is required by the Governmental Accounting Standards Board, who considers it to be an essential part of financial reporting for placing the basic financial statements in an appropriate operational, economic, or historical context. We have applied certain limited procedures to the required supplementary information in accordance with auditing standards generally accepted in the United States of America, which consisted of inquiries of management about the methods of preparing the information and comparing the information for consistency with management’s responses to our inquiries, the basic financial statements, and other knowledge we obtained during our audit of the basic financial statements. We do not express an opinion or provide any assurance on the information because the limited procedures do not provide us with sufficient evidence to express an opinion or provide any assurance. The Schedule of Employer Contributions presents the annual required contributions (ARC) and the percentage of the ARC recognized as contributions from employers for the past six calendar years rather than the past six consecutive fiscal years as required by accounting principles generally accepted in the United States of America. This departure from prescribed guidelines does not affect our opinion on the basic financial statements.
Our audit was conducted for the purpose of forming opinions on the System’s basic financial statements. The other supplementary information, introductory, investment, actuarial and statistical sections are presented for purposes of additional analysis and are not a required part of the financial statements. Such information is the responsibility of management and was derived from and relates directly to the underlying accounting and other records used to prepare the basic financial statements. The other supplementary information has been subjected to the auditing procedures applied in the audit of the basic financial statements and certain additional procedures, including comparing and reconciling such information directly to the underlying accounting and other records used to prepare the basic financial statements or to the basic financial statements themselves, and other additional procedures in accordance with auditing standards generally accepted in the United States of America. In our opinion, the other supplementary information is fairly stated in all material respects in relation to the basic financial statements as a whole. The introductory, investment, actuarial and statistical sections have not been subjected to the auditing procedures applied in the audit of the basic financial statements, and accordingly, we do not express an opinion or provide any assurance on them.
Sacramento, California December 18, 2012

Oregon Public Employees Retirement System
• 12 •
MANAGEMENT’S DISCUSSION AND ANALYSIS
This section presents management’s discussion and analysis of the Oregon Public Employees Retirement System’s (PERS or “the System”) financial performance during the fiscal year that ended June 30, 2012. It is a narrative overview and analysis that we present in con-junction with the Letter of Transmittal, included in the Introductory Section of this Comprehensive Annual Financial Report. It should also be read in conjunction with the basic financial statements of PERS, as presented in this report.
PERS is primarily responsible for administering retire-ment benefits, health benefits, and supplemental retire-ment savings plans. PERS comprises six funds: a defined benefit pension plan, including an account-based ben-efit program, two other postemployment benefit plans, a deferred compensation plan, and a proprietary fund.
OVERVIEW OF THE FINANCIAL STATEMENTS AND ACCOMPANYING INFORMATION
Management’s discussion and analysis provides an introduction to and overview of the basic financial state-ments, which comprise the following components: Fund Financial Statements, Notes to the Basic Financial Statements, Required Supplementary Information, and Other Supplementary Information. Collectively, this infor-mation presents the combined net assets held in trust for pension benefits, other postemployment benefits (OPEB), deferred compensation, and the unrestricted net assets for the proprietary fund administered by PERS as of June 30, 2012. It also summarizes the combined changes in net assets held in trust for pension and other postemployment benefits, the changes in unrestricted net assets and the cash flows of the proprietary fund for the year then ended, along with an actuarial view of the funded status of the defined benefit pension and other postemployment benefit plans. The information available in each of these sections is briefly summarized below:
Fund Financial Statements
At June 30, 2012, financial statements are presented for the two types of funds administered by PERS: fiduciary funds, where PERS acts in a fiduciary capacity as a trustee for others and is responsible for handling the assets placed under its control; and proprietary fund, where fees are charged for services provided and the focus is on deter-mining financial position, operating and non-operating income, cash flows and changes in net assets.
Fiduciary Funds – include the Defined Benefit Pension Plan, the Individual Account Program (IAP), the Retirement Health Insurance Account (RHIA), the Retiree Health Insurance Premium Account (RHIPA), and the Deferred Compensation Plan. Fiduciary funds are used to account for resources held for the benefit of PERS participants. A statement of fiduciary net assets and a statement of changes in fiduciary net assets are presented for the fiduciary funds
as of and for the year ended June 30, 2012, along with com-parative total information as of and for the year ended June 30, 2011. These financial statements reflect the resources available to pay benefits to retirees and other beneficiaries as of year end, as well as the changes in those resources during the year.
Proprietary Fund – includes the Standard Retiree Health Insurance Account (SRHIA), an enterprise fund. A statement of net assets, a statement of revenues, expenses, and changes in net assets, and a statement of cash flows are presented for the proprietary fund as of and for the year ended June 30, 2012, along with information as of and for the year ended June 30, 2011. These financial statements reflect the net assets, changes in net assets, and cash flows resulting from PERS business-type activities.
Notes to the Basic Financial Statements
Note 1 – provides a general description of PERS as well as a description of each of the funds administered by PERS. Information regarding employer and member participation in the pension plans administered by PERS is also provided.Note 2 – provides a summary of significant accounting policies, including the basis of accounting for each of the fund types—investment accounting policies, management’s use of estimates, and other significant accounting policies.Note 3 – provides information about member and employer contributions to the pension and other postemployment benefit plans administered by PERS.Note 4 – provides information about the System’s accounts receivable and payable as of June 30, 2012.Note 5 – provides information about capital assets used in plan operations.Note 6 – provides information on cash and cash equivalents. The note also describes investments, including investing authority, investment risk categorizations, and additional information about unfunded investment commitments, securities lending, and derivatives.Note 7 – provides information about PERS’ long-term debt.Note 8 – provides information about the potential contingencies of PERS.Note 9 – provides information about the estimated claims liability of the SRHIA.Note 10 – provides information about a legal provision violation.Note 11 – provides information about the adoption of new pension-related GASB standards.
Required Supplementary Information
In addition to the financial statements and notes explained above, this CAFR includes three additional Required Supplementary Information schedules with his-torical trend information and other supplementary infor-mation as described on the following page.

Oregon Public Employees Retirement System
• 13 •
• The Schedules of Funding Progress, page 53, contain actuarial information about the status of the plan from an ongoing, long-term perspective, showing whether there are sufficient assets to pay pension and postemployment ben-efits when due.
• The Schedules of Employer Contributions, page 54, contain historical trend information regarding the value of the total annual contributions employers must pay and the actual contributions made to meet this requirement.
• The Schedule of Claims Development Information for SRHIA, page 55, shows earned revenues and expenses over the past two years.
Other Supplementary Information
The Schedule of Plan Net Assets and Schedule of Changes in Plan Net Assets, pages 56 through 57, display the components of the defined benefit pension plan.
• The Schedule of Administrative Expenses and Schedule of Payments to Consultants and Contractors on page 58 show the costs of managing the System. The Summary of Investment Fees, Commissions, and Expenses on page 59 provides the detail of investment-related expens-es included in the line item Investment Expense reported in the Statement of Changes in Fiduciary Net Assets.
FIDUCIARY FUNDS• PERS’ assets exceed its liabilities at the close of fiscal
year 2012, with $59,456.3 million held in trust for pen-sion, Oregon Public Service Retirement Plan Individual Account Program (IAP), other postemployment benefits, and deferred compensation benefits.
• Fiduciary net assets decreased by $1,733.5 million, or 2.8 percent, during the fiscal year as investment returns were out-paced by increased benefit expenses.
• PERS’ funding objective is to meet long-term benefit obligations. As of December 31, 2011, the date of the lat-est actuarial valuation, the funded ratio of the defined ben-
efit pension plan was 82.0 percent. In general, this means that for every dollar of pension benefits due, PERS has approximately $0.82 of net assets available for payment.
• Revenues (additions to fiduciary net assets), which include member and employer contributions of $1,493.3 million and net income from investment activities total-ing $462.0 million, fell 84.9 percent to $1,958.5 million, for fiscal year 2012, compared to $12,941.3 in fiscal year 2011.
• Expenses (deductions from fiduciary net assets) increased to $3,692.0 million, or 5.8 percent, during the fiscal year from $3,491.2 million in fiscal year 2011.
FIDUCIARY NET ASSETSThe condensed comparative summaries of Fiduciary Net
Assets on pages 13 and 14 demonstrate that the pension trust funds are primarily focused on investments and net assets (reserves).
• Declining financial markets produced lower returns on PERS investments than those of the previous fiscal year, and benefit payments continued to grow. The net assets of the defined benefit pension plan decreased approximately $2,135.4 million, or 3.8 percent, during the year ended June 30, 2012.
• The net assets of the OPSRP IAP increased approxi-mately $355.3 million, or 8.8 percent, during the year ended June 30, 2012, as member contributions and modest investment returns outweighed benefit payments.
• The net assets of the deferred compensation plan increased approximately $28.6 million, or 2.6 percent, during the year ended June 30, 2012. Benefit expenses were slightly exceeded by member contributions and investment income.
• The net assets of the Retirement Health Insurance Account increased approximately $18.6 million, or 7.5 percent, during the year ended June 30, 2012, as increases in employer contributions more than offset increases in healthcare premium subsidies.
TABLE 1FIDUCIARY NET ASSETS, PENSION(in thousands) As of June 30:
Defined Benefit Pension Plan Individual Account Program Deferred Compensation Plan2012 2011 2012 2011 2012 2011
Cash and Receivables $ 3,196,807 $ 3,497,925 $ 306,519 $ 310,840 $ 79,308 $ 63,489Investments at Fair
Value 52,614,382 55,007,311 4,280,807 3,907,072 1,054,975 1,042,986Securities Lending
Collateral 2,247,245 2,512,073 186,303 184,566 216 160Other 46,568 47,721 865 988 — — Total Assets 58,105,002 61,065,030 4,774,494 4,403,466 1,134,499 1,106,635
Investment Purchases 2,072,276 2,670,037 185,581 173,971 521 332Securities Lending
Payable 2,261,127 2,528,403 187,450 185,746 215 160Other Payables 112,175 71,741 9,343 6,912 195 1,167 Total Liabilities 4,445,578 5,270,181 382,374 366,629 931 1,659Total Net Assets $ 53,659,424 $ 55,794,849 $ 4,392,120 $ 4,036,837 $ 1,133,568 $ 1,104,976

Oregon Public Employees Retirement System
• 14 •
• The net assets of the Retiree Health Insurance Premium Account decreased approximately $0.6 million, or 11.0 percent, during the year ended June 30, 2012, as increases in employer contributions and investment income did not surpass increases in healthcare premium subsidies.
CHANGES IN FIDUCIARY NET ASSETS Revenues – Additions to Fiduciary Net Assets
Additions to Fiduciary Net Assets needed to finance retirement benefits are accumulated through the collection of employer and member contributions and through invest-ment income.
• Member contributions to the defined benefit pension plan increased $2.5 million, or 17.9 percent, from fiscal year 2011 to fiscal year 2012, due to increases in service credit purchases. Member contributions to the defined benefit pension plan have been closed since 2004 except for Judge members.
• Member contributions to the IAP increased $2.5 mil-lion, or 0.5 percent, due to employee salary increases and an increase in eligible employees during the year.
• Member contributions to the deferred compensation plan increased $7.3 million, or 10.0 percent, in fiscal year 2012, as participants increased voluntary contributions.
• Employer contributions to the defined benefit pension plan increased $406.0 million, or 95.7 percent, in fiscal year 2012, due to a significant rise in employer contribution rates.
• Employer contributions to the Retirement Health Insurance Account increased dramatically in fiscal year 2012 as employer contribution rates more than doubled. Employer contributions were $46.5 million in fiscal year 2012 compared to $22.2 million in fiscal year 2011, a 109.5 percent increase.
• Employer contributions to the Retiree Health Insurance
Premium Account increased in fiscal year 2012 due to an increase in contribution rates. Employer contributions were $3.4 million in fiscal year 2012 compared to $1.4 million in fis-cal year 2011, a 136.5 percent increase.
The significant increase in employer rates for all defined benefit plans is due in part to the partial recognition in the 2009 actuarial valuation of 2008 investment losses. Additional 2008 losses were included in the 2011 actuarial valuation used to set employer rates which will go into effect July 1, 2013.
• Net investment and other income in the defined benefit pension plan was $380.8 mil-lion, a $10,550.6 million, or 96.5 percent, decrease from the fiscal year 2011 gain of $10,931.4 million, due to a down-turn in financial markets.
• Net investment and other income in the IAP was $71.5 million in fiscal year 2012, a 90.3 percent decrease from the fiscal year 2011 gain of $735.7 million. Fiscal year 2012 investment returns were weak compared to the strong returns of fiscal year 2011.
• Net investment and other income in the Retirement Health Insurance Account was $3.0 million, a $44.3 mil-lion, or 93.6 percent, decrease from the fiscal year 2011 gain of $47.4 million, due to lagging market performance.
• Net investment and other income in the Retiree Health Insurance Premium Account was $17 thousand, a 98.5 per-cent decrease from the fiscal year 2011 gain of $1.1 million, due to lower investment returns.
• Net investment and other income in the deferred com-pensation plan was $9.8 million, a $167.2 million, or 94.4 percent, decrease from the fiscal year 2011 gain of $177.0 million as a result of weak investment returns.
Expenses – Deductions from Fiduciary Net Assets
Benefit payments, refunds of contributions by members who terminate employment, health insurance premium subsidies, deferred compensation payments, and adminis-trative costs comprise the System’s expenses.
• Pension benefit and other payments from the defined benefit pension plan were $3,362.8 million in fiscal year 2012, a $103.2 million, or 3.2 percent, increase over fiscal year 2011 expenses of $3,259.7 million. An increase in service retirements during the year produced an increase in deductions to net assets.
• IAP benefit and other payments increased $91.6 million, or 65.1 percent, during the year, from $140.8 million in fis-cal year 2011 to $232.4 million in fiscal year 2012. Accounts withdrawn rose due to higher cumulative contributions, posi-
TABLE 2FIDUCIARY NET ASSETS, OPEB (in thousands) As of June 30:
Retirement Health Insurance Account
Retiree Health Insurance Premium Account
2012 2011 2012 2011Cash and Receivables $ 21,480 $ 18,519 $ 631 $ 466Investments at Fair Value 255,398 240,350 4,115 4,940Securities Lending Collateral 11,183 11,311 190 241Other 29 36 — 1 Total Assets 288,090 270,216 4,936 5,648
Investment Purchases 10,156 10,764 164 222Securities Lending Payable 11,252 11,383 190 243Other Payables 102 78 23 61
Total Liabilities 21,510 22,225 377 526Total Net Assets $266,580 $ 247,991 $ 4,559 $ 5,122

Oregon Public Employees Retirement System
• 15 •
TABLE 4CHANGES IN FIDUCIARY NET ASSETS, OPEB (in thousands) For the Years Ending June 30:
Retirement Health Insurance Account
Retiree Health InsurancePremium Account
2012 2011 2012 2011Additions:Employer Contributions $ 46,465 $ 22,177 $ 3,378 $ 1,428Net Investment and Other Income 3,024 47,360 17 1,136 Total Additions 49,489 69,537 3,395 2,564
Deductions: Healthcare Premium Subsidies 29,936 29,252 3,886 3,024Other 964 1,040 72 162 Total Deductions 30,900 30,292 3,958 3,186Net Increase/(Decrease) 18,589 39,245 (563) (622)
Net Assets Beginning of year 247,991 208,746 5,122 5,744 End of year $ 266,580 $ 247,991 $ 4,559 $ 5,122
TABLE 3CHANGES IN FIDUCIARY NET ASSETS, PENSION(in thousands) For the Years Ending June 30:
Defined Benefit Pension Plan Individual Account Program Deferred Compensation Plan2012 2011 2012 2011 2012 2011
Additions:Employer Contributions $ 830,123 $ 424,101 $ — $ — $ — $ —Plan Members 16,535 14,024 516,175 513,716 80,633 73,292Net Investment and
Other Income 380,750 10,931,392 71,536 735,695 9,842 176,999 Total Additions 1,227,408 11,369,517 587,711 1,249,411 90,475 250,291
Deductions:Pension Benefits 3,295,710 3,203,939 224,730 133,971 61,465 55,930Other 67,123 55,744 7,698 6,810 418 1,326 Total Deductions 3,362,833 3,259,683 232,428 140,781 61,883 57,256Net Increase/(Decrease) (2,135,425) 8,109,834 355,283 1,108,630 28,592 193,035 Net Assets Beginning of year 55,794,849 47,685,015 4,036,837 2,928,207 1,104,976 911,941 End of year $ 53,659,424 $ 55,794,849 $ 4,392,120 $ 4,036,837 $ 1,133,568 $ 1,104,976
tive earnings, and an increase in retirements for the year.
• Deferred compensation benefits and other expenses increased $4.6 million, or 8.1 percent, from $57.3 mil-lion in fiscal year 2011 to $61.9 million fiscal year 2012. Benefit payments were higher due to investment gains and increased retirement activity.
• Retirement Health Insurance Account benefit and other payments increased $0.6 million, or 2.0 percent, from $30.3 million in fiscal year 2011 to $30.9 million in fiscal year 2012, as a result of increases in premium pay-
ments due to additional retirements.
• Retiree Health Insurance Premium Account benefit payments increased $0.8 million, or 24.2 percent, from $3.2 million in fiscal year 2011 to $4.0 million in fiscal year 2012, as a result of increases in premium payments due to additional retirements.
The tables below show condensed comparative summa-ries of the changes in fiduciary net assets and reflect the activities of the plans administered by the System.

Oregon Public Employees Retirement System
• 16 •
PROPRIETARY FUNDThe Standard Retiree Health Insurance Account uses
an enterprise fund to account for the activities of PERS’ healthcare program, a public entity risk pool.
NET ASSETS• The net assets of the Standard Retiree Health
Insurance Account as of June 30, 2012, are $80.3 million, a $16.2 million, or 25.3 percent increase over fiscal year 2011. The increase is primarily due to a change in estimat-ed healthcare claims payable and an increase in cash and cash equivalents due to increased premium revenue and Federal Government Reimbursements.
CHANGES IN NET ASSETS• Standard Retiree Health Insurance Account insurance
premium and other revenue for the year ended June 30, 2012, are $189.0 million, a $14.9 million, or 8.5 percent, increase from fiscal year 2011. This change resulted from an increase in both premium rates and the number of retir-ees participating in the healthcare program.
• Standard Retiree Health Insurance Account health-care and other payments for the year ended June 30, 2012 increased $0.2 million, or 0.1 percent, from $172.6 million in fiscal year 2011 to $172.8 million in fiscal year 2012. Increases in claims expense were offset by decreases in estimated liabilities.
The tables below show the condensed summary of net assets and the condensed summary of changes in revenues, expenses, and net assets for SRHIA.
TABLE 5NET ASSETS, ENTERPRISE FUND(in thousands) As of June 30:
Standard Retiree HealthInsurance Account
2012 2011Cash and Receivables $ 96,623 $ 88,184Securities Lending Collateral 757 794 Total Assets 97,380 88,978
Claims Payable 13,959 23,492Other Payables 2,321 566Securities Lending Payable 757 794 Total Liabilities 17,037 24,852
Total Net Assets $ 80,343 $ 64,126
TABLE 6REVENUES, EXPENSES, AND CHANGES IN NET ASSETS, ENTERPRISE FUND(in thousands) For the Years Ending June 30:
Standard Retiree Health Insurance Account
2012 2011
Revenues:
Insurance Premiums $ 186,682 $ 174,089
Federal Government Reimbursements 2,158 —
Investment Income 130 82
Other Income 20 19
Total Revenues 188,990 174,190
Expenses:
Claims 160,152 150,422
Increase/(Decrease) in Estimated Liabilities (9,533) 2,130
Administrative Expense 22,154 20,007
Total Expenses 172,773 172,559
Net Increase 16,217 1,631
Net Assets
Beginning of Year As Previously Reported 64,126 —
Prior Period Adjustment — 62,495
Net Assets as Restated 64,126 62,495
End of Year $ 80,343 $ 64,126

Oregon Public Employees Retirement System
• 17 •
PLAN MEMBERSHIPThe table below reflects the defined benefit pension plan membership as of the beginning and end of the fiscal year.
SERVICE RETIREMENTSService retirements rose for the third consecutive year due to a significant increase in members eligible to retire. Service
retirements in fiscal year 2012 were 7,473 compared to 6,972 in fiscal year 2011, an increase of 7.2 percent.
TABLE 8SERVICE RETIREMENTS
By Fiscal Year
TABLE 7CHANGES IN PLAN MEMBERSHIP
As of June 30: 2012 2011 Percentage Change
Retirees and beneficiaries receiving benefits: General 110,279 105,717 4.3 % Police and Fire 9,067 8,535 6.2 Total
119,346 114,252 4.5
Current and terminated employees entitled to benefits but not yet receiving them:Vested: General 192,091 203,070 (5.4) Police and Fire 16,026 16,204 —
Nonvested: General 3,772 5,674 (33.5) Police and Fire 178 233 (23.6)
Total 212,067 225,181 (5.8) %
-
2,000
4,000
6,000
8,000
10,000
12,000
14,000
2003
2004
2005
2006
2007
2008
2009
2010
2011
2012
Fiscal Year
Ret
irem
ents

Oregon Public Employees Retirement System
• 18 •
FUNDED STATUSThe System’s Unfunded Actuarial Liability (UAAL) for pension benefits increased by $3,284.2 million, going
from $7,746.0 million in 2010 to $11,030.2 million as of December 31, 2011. The UAAL was derived using the pro-jected unit credit method. Investment gains through December 31, 2011, fell short of actuarially assumed earnings leading to a decline in the System’s funded status.
TABLE 9SCHEDULE OF FUNDING PROGRESS
FUNDED RATIOAs of December 31
INVESTMENT ACTIVITIESDuring fiscal year 2012 investments decreased 3.3 percent from the prior fiscal year as markets retreated after two years
of growth. Positive investment returns in real estate, private equity, alternative equity, and opportunity portfolio asset classes helped offset declines in public equity and debt investments. Public equity decreased approximately $3,224.2 million. While domestic equity exhibited positive returns, international equity fell sharply on European debt fears. Investments in debt securities decreased $391.0 million as a result of sales made in accordance with the Oregon invest-ment Council’s asset allocation policy. Additionally fixed income yields for the fiscal year were broadly lower than those of the previous year. Private equity investments were up approximately $795.8 million for the year. The Opportunity Portfolio increased approximately $4.5 million during the fiscal year, and the newly established Alternative asset class increased $196.7, or 92.1 percent. The fair value of real estate investments increased by $625.2 million due to gains in both real property and real estate investment trusts. One-year returns on asset classes and comparative benchmarks are presented in the table on page 19.
0%
20%
40%
60%
80%
100%
120%
Perc
enta
ge
2002
2003
2004
2005
2006
2007
2008
2009
2010
2011
Calendar Year

Oregon Public Employees Retirement System
• 19 •
1 Morgan Stanley Capital International All Country World Index ex-US Investable Market Index Net Index2 90% Barclays Capital Universal/10% Solomon Smith Barney Inc. Non-US World Government Bond Hedged3 Returns are lagged one quarter.4 Returns are lagged one quarter.
TABLE 10INVESTMENT RETURNPeriods Ending June 30:
2012 2011Total Portfolio, Excluding Variable 1.6% 22.3%Policy Benchmark 2.6 20.4 Variable Account (6.4) 31.1Variable Account Blended Index (6.9) 31.0Domestic Stocks 1.9 34.0 Benchmark: Russell 3000 Index 3.8 32.4 International Stocks (13.4) 30.9Benchmark: Custom Index1 (14.8) 30.3 Fixed Income Segment 7.4 8.8Benchmark: Custom Index2 6.9 4.2 Real Estate3 8.7 20.8 Benchmark: NCREIF 13.4 16.0NAREIT Equity REIT Index 12.5 34.1Private Equity4 6.7 21.4Benchmark: Russell 3000 + 300 bps 10.4 20.9
EFFECT OF ECONOMIC FACTORSThe financial position of the System declined during
the fiscal year due to higher benefit payments and weaker investment returns. Table 10 above shows portfolio returns and indexes, which are reflective of the market environ-ment.
Benefit payments increased in fiscal year 2012 due to an increase in the number of retirees. The majority of retirees retiring elected to transfer out of the variable account at retirement. Retirees who elected to continue participat-ing in the variable account after retirement experienced a decrease in related benefits of approximately 5.8 percent, effective February 1, 2012, compared to an increase of 9.0 percent effective February 1, 2011. This decrease in ben-efits was due to investment losses in the variable account for the period of November 1, 2010, through October 31, 2011.
UAL rates calculated in the December 31, 2011 actuarial valuation increased compared to the contribution rates cal-culated in the December 31, 2009 valuation and effective July 1, 2011. This is due both to cumulative investment returns below assumption during 2010-2011 and the func-tioning of the rate collar contribution stabilization policy. The rate collar restricts the change in contribution rates from one biennium to the next to within a specified bound. When the calculated contribution rate is outside of the rate collar boundaries, a portion of the contribution increase or decrease is deferred to subsequent biennia. The contribu-tion rates effective July 1, 2011, were calculated by the
December 31, 2009 actuarial valuation and were the first rates to reflect the large investment losses that occurred during the financial crisis. A significant portion of the cal-culated contribution rate increase from the December 31, 2009 valuation was deferred due to the rate collar. These increases deferred by the rate collar are the primary cause of the increase in the UAL rates for the period July 1, 2013, through June 30, 2015.
CONTACTING THE SYSTEM’S FINANCIAL MANAGEMENT
This financial report is designed to provide plan partici-pants, employers, citizens, taxpayers, and others with a gen-eral overview of the System’s finances and to demonstrate the Board’s oversight of the System. If you have questions about this report or need additional financial information, please contact the Fiscal Services Division Administrator at P.O. Box 23700, Tigard, Oregon 97281-3700.

Oregon Public Employees Retirement System
• 20 •
Oregon Public Service
Retirement PlanIndividualAccount Program
Defined Benefit OPEB Plans
Defined Benefit
Pension Plan
RetirementHealth
InsuranceAccount
Retiree Health Insurance Premium Account
Assets:Cash and Cash Equivalents $ 1,649,293,115 $ 172,678,939 $ 12,416,311 $ 447,271
Receivables: Employer 27,673,284 — 1,474,104 41,343 Plan Member — 12,106,007 — — Interest and Dividends 309,044,576 25,510,885 1,522,008 24,525 Member Loans — — — — Investment Sales and Other Receivables 1,209,122,153 90,499,868 5,403,780 86,967 Total Receivables 1,545,840,013 128,116,760 8,399,892 152,835
Due from Other Funds 1,673,822 5,723,641 663,542 31,259
Investments: Debt Securities 13,227,221,333 1,091,875,260 65,142,495 1,049,665 Public Equity 18,561,756,367 1,469,844,527 87,692,563 1,413,022 Real Estate 6,216,323,529 513,142,534 30,614,655 493,305 Private Equity 13,373,158,704 1,103,922,038 65,861,219 1,061,246 Alternative Equity 377,223,961 31,138,929 1,857,783 29,936 Opportunity Portfolio 858,697,756 70,883,431 4,228,985 68,143 Total Investments 52,614,381,650 4,280,806,719 255,397,700 4,115,317
Securities Lending Collateral 2,247,245,078 186,303,405 11,183,170 189,212Prepaid Expenses and Deferred Charges 6,985,544 486,709 29,037 470Capital Assets at Cost, Net 39,582,259 377,950 — — Total Assets 58,105,001,481 4,774,494,123 288,089,652 4,936,364
Liabilities:Investment Purchases and Accrued Expenses 2,072,276,543 185,581,133 10,155,963 163,648Deposits and Other Liabilities 102,505,507 8,204,730 1,438 1,036Due to Other Funds 6,297,579 1,139,155 100,938 21,984COPs Payable 3,072,196 — — —Deferred Revenue 299,322 — — —Securities Lending Collateral Due Borrowers 2,261,126,764 187,449,305 11,251,536 190,314 Total Liabilities 4,445,577,911 382,374,323 21,509,875 376,982
Net Assets Held in Trust for Benefits $ 53,659,423,570 $ 4,392,119,800 $ 266,579,777 $ 4,559,382
Statement of Fiduciary Net Assets Pension and Other Postemployment Plans As of June 30, 2012, with Comparative Totals as of June 30, 2011
The accompanying notes are an integral part of the financial statements.

Oregon Public Employees Retirement System
• 21 •
Deferred Compensation
Plan 2012 2011
$ 69,062,567 $ 1,903,898,203 $ 2,728,502,710
— 29,188,731 9,095,242— 12,106,007 10,873,975
315,258 336,417,252 343,494,360 9,731,566 9,731,566 8,670,995 79,412 1,305,192,180 780,005,868
10,126,236 1,692,635,736 1,152,140,440
119,704 8,211,968 10,595,410
256,699,954 14,641,988,707 15,032,999,409798,275,085 20,918,981,564 24,143,158,791
— 6,760,574,023 6,135,410,153— 14,544,003,207 13,748,214,554— 410,250,609 213,528,016— 933,878,315 929,347,550
1,054,975,039 58,209,676,425 60,202,658,473
215,793 2,445,136,658 2,708,351,161— 7,501,760 9,428,919 — 39,960,209 39,317,145
1,134,499,339 64,307,020,959 66,850,994,258
520,974 2,268,698,261 2,855,325,98411,215 110,723,926 65,356,916
183,726 7,743,382 10,226,193— 3,072,196 3,615,368— 299,322 759,052
215,793 2,460,233,712 2,725,935,938931,708 4,850,770,799 5,661,219,451
$ 1,133,567,631 $ 59,456,250,160 $ 61,189,774,807

Oregon Public Employees Retirement System
• 22 •
Oregon Public Service
Retirement PlanIndividual Account Program
Defined Benefit OPEB Plans
DefinedBenefit
Pension Plan
Retirement Health
Insurance Account
Retiree Health Insurance Premium Account
Additions:Contributions: Employer $ 830,123,405 $ — $ 46,464,958 $ 3,378,230 Plan Member 16,534,650 516,174,983 — — Total Contributions 846,658,055 516,174,983 46,464,958 3,378,230
Investment Income: Net Appreciation/(Depreciation) in Fair Value of Investments (786,652,250) (37,008,710) (2,519,592) (82,941)
Interest, Dividends, and Other Investment Income 1,448,874,733 135,643,648 6,903,176 123,117 Total Investment Income 662,222,483 98,634,938 4,383,584 40,176
Less Investment Expense 302,690,669 28,436,818 1,441,405 25,216 Net Investment Income 359,531,814 70,198,120 2,942,179 14,960
Securities Lending Income/(Expense): Securities Lending Income 24,524,006 1,761,682 108,844 2,356 Less Securities Lending Expense (5,571,008) (443,679) (27,470) (593) Net Securities Lending Income/(Expense) 18,952,998 1,318,003 81,374 1,763 Other Income 2,264,943 19,788 — — Total Additions 1,227,407,810 587,710,894 49,488,511 3,394,953
Deductions:Benefits 3,291,791,650 224,729,644 — —Death Benefits 3,918,168 — — —Refunds of Contributions 34,020,450 — — —Administrative Expense 33,102,667 7,698,098 963,843 71,981Healthcare Premium Subsidies — — 29,935,920 3,885,769 Total Deductions 3,362,832,935 232,427,742 30,899,763 3,957,750
Net Increase (Decrease) (2,135,425,125) 355,283,152 18,588,748 (562,797)
Net Assets Held in Trust for Benefits Beginning of Year as Previously Reported 55,794,848,695 4,036,836,648 247,991,029 5,122,179
Prior Period Adjustment — — — —Net Assets as Restated 55,794,848,695 4,036,836,648 247,991,029 5,122,179 End of Year $ 53,659,423,570 $ 4,392,119,800 $ 266,579,777 $ 4,559,382
Statement of Changes in Fiduciary Net Assets Pension and Other Postemployment Plans For the Year Ended June 30, 2012, with Comparative Totals for the Year Ended June 30, 2011
The accompanying notes are an integral part of the financial statements.

Oregon Public Employees Retirement System
• 23 •
Deferred Compensation Plan 2012 2011
$ — $ 879,966,593 $ 447,706,83380,632,698 613,342,331 601,032,12480,632,698 1,493,308,924 1,048,738,957
3,264,884 (822,998,609) 10,747,329,815
8,271,166 1,599,815,840 1,510,371,784 11,536,050 776,817,231 12,257,701,599
2,569,620 335,163,728 364,687,6808,966,430 441,653,503 11,893,013,919
2,593 26,399,481 7,250,420(2,593) (6,045,343) (8,847,906)
— 20,354,138 (1,597,486)
875,400 3,160,131 1,163,86590,474,528 1,958,476,696 12,941,319,255
61,465,377 3,577,986,671 3,386,231,957— 3,918,168 7,606,867— 34,020,450 26,487,226
417,776 42,254,365 38,594,620— 33,821,689 32,276,153
61,883,153 3,692,001,343 3,491,196,823
28,591,375 (1,733,524,647) 9,450,122,432
1,104,976,256 61,189,774,807 51,747,943,735
— — (8,291,360)1,104,976,256 61,189,774,807 51,739,652,375
$ 1,133,567,631 $ 59,456,250,160 $ 61,189,774,807

Oregon Public Employees Retirement System
• 24 •
Enterprise Fund
Standard Retiree Health Insurance Account
2012 2011
Assets:Current Assets Cash and Cash Equivalents $ 96,586,516 $ 87,999,852 Plan Member Receivables — 183,882 Due from Other Funds 36,846 — Securities Lending Collateral 756,993 794,102
Total Assets 97,380,355 88,977,836Liabilities:Current Liabilities
Estimated Insurance Claims Due 13,959,000 23,492,372Accrued Expenses 1,815,955 177,414Due to Other Funds 505,432 369,218Securities Lending Collateral Due Borrowers 756,993 794,102 Total Current Liabilities 17,037,380 24,833,106
Long-Term LiabilitiesOther Liabilities 423 18,534 Total Long-Term Liabilities 423 18,534
Total Liabilities 17,037,803 24,851,640Total Unrestricted Net Assets $ 80,342,552 $ 64,126,196
The accompanying notes are an integral part of the financial statements.
Statement of Net Assets - Proprietary Fund As of June 30, 2012 and 2011
Oregon Public Employees Retirement System
• 25 •
Statement of Revenues, Expenses, and Changes in Net Assets - Proprietary Fund For the Years Ended June 30, 2012 and 2011
Enterprise Fund
Standard Retiree Health Insurance Account
2012 2011
Operating Revenues: Insurance Premium Revenue $ 186,681,811 $ 174,088,647 Federal Government Reimbursements 2,158,326 — Other Income 20,361 19,470 Total Operating Revenues 188,860,498 174,108,117
Operating Expenses: Claims Expense 160,152,655 150,422,466 Increase/(Decrease) in Estimated Liabilities (9,533,372) 2,130,215 Administrative Expense 22,154,403 20,006,526 Total Operating Expenses 172,773,686 172,559,207
Operating Income 16,086,812 1,548,910
Non-Operating Revenues: Interest, Dividends, and Other Investment Income 129,544 82,455
Securities Lending Income 9,096 1,473 Less Securities Lending Expense (9,096) (1,473) Net Securities Lending Income — —
Total Non-Operating Revenue 129,544 82,455
Changes in Unrestricted Net Assets 16,216,356 1,631,365
Total Unrestricted Net Assets Beginning of Year as Previously Reported 64,126,196 —
Prior Period Adjustment — 62,494,831Beginning Net Assets as Restated 64,126,196 62,494,831 End of Year $ 80,342,552 $ 64,126,196
The accompanying notes are an integral part of the financial statements.
Oregon Public Employees Retirement System
• 26 •
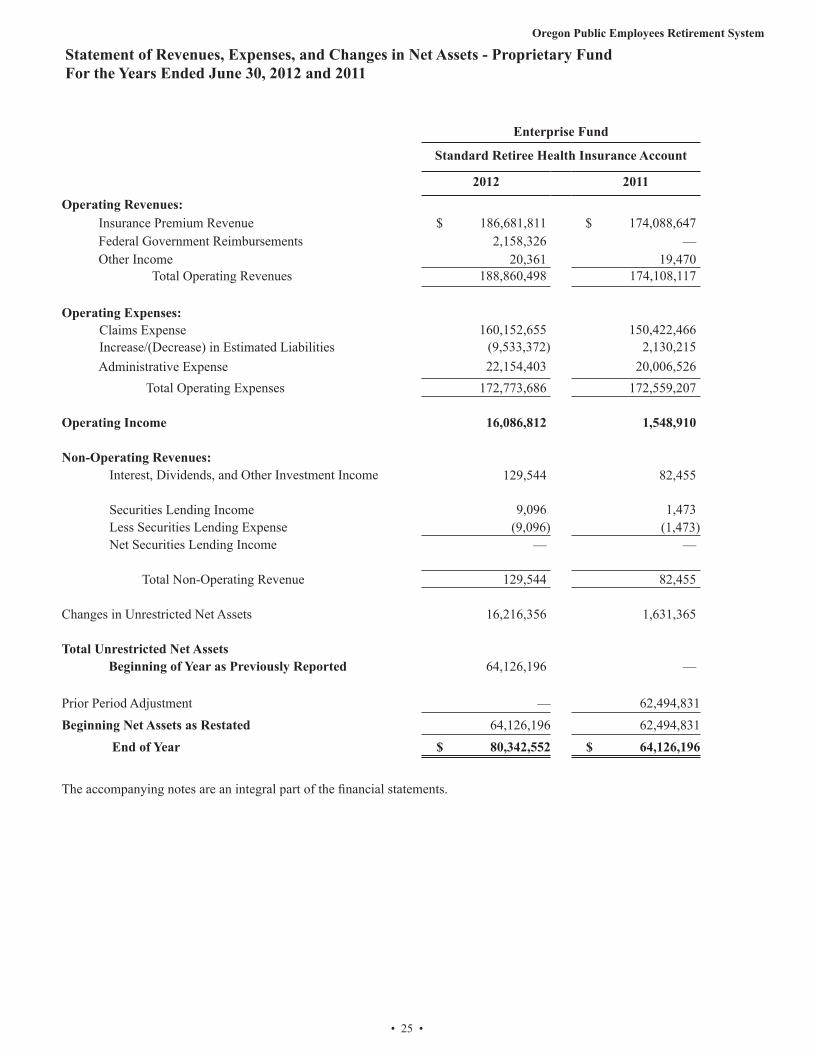
Statement of Cash Flows - Proprietary Fund For the Years Ended June 30, 2012 and 2011
Enterprise Fund
Standard Retiree Health Insurance Account
2012 2011
Cash Flows from Operating Activities: Insurance Premiums Collected $ 186,865,693 $ 171,481,966 Federal Government Reimbursements 2,158,326 — Claims Paid (160,152,655) (150,422,466) Other Receipts 20,361 19,470 Other Payments (20,434,605) (16,957,487)Net Cash Provided by Operating Activities 8,457,120 4,121,483
Cash Flows from Investing Activities Interest and Dividends Received 129,544 82,455
Net Increase in Cash and Cash Equivalents 8,586,664 4,203,938
Cash and Cash Equivalents Beginning of Year as Previously Reported 87,999,852 —
Prior Period Adjustment — 83,795,914
Cash and Cash Equivalents Beginning of Year as Restated 87,999,852 83,795,914
Cash and Cash Equivalents End of Year $ 96,586,516 $ 87,999,852
Reconciliation of Operating Income to Net Cash Provided by Operating Activities Operating Income $ 16,086,812 $ 548,910Changes in Assets and Liabilities Plan Member Receivables 183,882 (78,568) Due from Other Funds (36,846) — Estimated Insurance Claims Due (9,533,372) 2,130,215 Accrued Expenses 1,638,541 174,599 Due to Other Funds 136,215 344,013 Other Liabilities (18,112) 2,314Net Cash Provided by Operating Activities $ 8,457,120 $ 4,121,483
The accompanying notes are an integral part of the financial statements.

Oregon Public Employees Retirement System
• 27 •
Notes to the Financial Statements June 30, 2012
Note 1 - Description of Plan A. Pension Plan Membership
The Oregon Public Employees Retirement System (PERS or “the System”) provides statewide defined benefit retire-ment plans for units of state government, political subdivi-sions, community colleges, and school districts. PERS is administered under Oregon Revised Statutes (ORS) Chapter 238, Chapter 238A, and Internal Revenue Code Section 401(a) by the Public Employees Retirement Board (Board). For state agencies, community colleges, and school districts, PERS is a cost-sharing, multiple-employer system. PERS is
an agent multiple-employ-er system for political subdivisions that have not elected to join the State and Local Government Rate Pool. Participation by state government units, school districts, and com-munity colleges is manda-tory. Participation by most political subdivisions is optional, but irrevocable if elected. Plan assets of the defined benefit pension, postemployment health-care, deferred compensa-tion plans, and asset-based account may legally be used to pay benefits only to plan members or plan beneficiaries for which the assets were accumulated.
The 1995 Legislature enacted Chapter 654, Section 3, Oregon Laws 1995, which has been codified into ORS 238.435. This legislation cre-ated a second tier of benefits for those who established membership on or after January 1, 1996. The second tier does not have the Tier One assumed earnings rate guar-antee and has a higher normal retirement age of 60, com-pared to 58 for Tier One. As of June 30, 2012, there were 45,629 active and 20,017 inactive for a total of 65,646 Tier One members and 48,150 active and 16,902 inactive for a total of 65,052 Tier Two members in the System.
The 2003 Legislature enacted HB 2020, codified as ORS 238A, which created the Oregon Public Service Retirement Plan (OPSRP). OPSRP consists of the Pension Program (defined benefit) and the Individual Account Program. Membership includes public employees hired on or after August 29, 2003. As of June 30, 2012, there were 76,002 active and 5,367 inactive members for a total of 81,369 OPSRP Pension Program members.
Beginning January 1, 2004, PERS active Tier One and Tier Two members became members of the Individual
Account Program (IAP) of OPSRP. PERS members retain their existing PERS accounts, but member contributions are now deposited into the member’s IAP account, not into the member’s PERS account. Accounts are credited with earnings and losses net of administrative expenses. OPSRP is part of PERS and is administered by the Board. The PERS Board is directed to adopt any rules necessary to administer OPSRP, and such rules are to be considered part of the plan for IRS purposes.
B. Plan Benefits
a. PERS Pension (Chapter 238)
1. Pension Benefits
The PERS retirement allowance is payable monthly for life. It may be selected from 13 retirement benefit options. These options include survivorship benefits and lump-sum refunds. The basic benefit is based on years of service and final average salary. A percentage (2.0 percent for police and fire employees, 1.67 percent for general service employees) is multiplied by the number of years of service and the final average salary. Benefits may also be calculat-ed under either a formula plus annuity (for members who were contributing before August 21, 1981) or a money match computation if a greater benefit results. Monthly payments must be a minimum of $200 per month or the member will receive a lump-sum payment of the actuarial equivalence of benefits to which he or she is entitled.
Police and fire members may purchase increased ben-efits that are payable between the date of retirement and age 65.
A member is considered vested and will be eligible at minimum retirement age for a service retirement allowance if he or she has had a contribution in each of five calendar years or has reached at least 50 years of age before ceas-ing employment with a participating employer (age 45 for police and fire members). General service employees may retire after reaching age 55. Police and fire members are eligible after reaching age 50. Tier One general service employee benefits are reduced if retirement occurs prior to age 58 with fewer than 30 years of service. Police and fire member benefits are reduced if retirement occurs prior to age 55 with fewer than 25 years of service. Tier Two members are eligible for full benefits at age 60. The ORS Chapter 238 Defined Benefit Pension Plan is closed to new members hired on or after August 29, 2003.
A judge member who has made contributions to the PERS Fund during each of five calendar years shall receive a retirement allowance, payable monthly, for life. Before reaching age 60, judge members must choose the calcula-tion formula under which they will retire. The election is irrevocable after the member attains age 60. The two formu-las, A and B, are described in the following paragraph.
The Plan A retirement allowance for judge members is computed by multiplying 2.8125 percent by the final aver-age salary for the first 16 years of service and 1.67 percent of the final average salary multiplied by the number of
Employee and Retiree MembersRetirees and beneficiariescurrently receiving benefits:
6/30/2012
General 110,279Police and fire 9,067Total 119,346
Current employees andterminated employees entitledto benefits but not yetreceiving them:
Vested: General 192,091 Police and Fire 16,026Nonvested: General 3,772 Police and Fire 178Total 212,067
TABLE 1

Oregon Public Employees Retirement System
• 28 •
years of service as a judge with years of service in excess of 16. For most judge members the maximum amount is limited to 65 percent of final average salary. The Plan B retirement allowance for judge members is computed by multiplying 3.75 percent by the final average salary for the first 16 years of service and 2.0 percent of the final average salary multiplied by the number of years of ser-vice as a judge with years of service in excess of 16. For most judge members the maximum amount is limited to 75 percent of final average salary. Plan B requires a judge to serve up to 35 days per year for a period of five years as a pro-tem judge. There is no actuarial reduction for retire-ment before age 65.
2. Death Benefits
Upon the death of a non-retired member, the beneficiary receives a lump-sum refund of the member’s account bal-ance (accumulated contributions and interest). In addition, the beneficiary will receive a lump-sum payment from employer funds equal to the account balance, provided one or more of the following conditions are met:
• the member was employed by a PERS employer at the time of death,
• the member died within 120 days after termina- tion of PERS-covered employment,
• the member died as a result of injury sustained while employed in a PERS-covered job, or
• the member was on an official leave of absence from a PERS-covered job at the time of death.
A member’s beneficiary may choose a monthly payment for life instead of the lump-sum or a combination of lump-sum and monthly payments, if eligible. The monthly pay-ment must be a minimum of $30 per month for deaths that occur July 30, 2003, and earlier; $200 per month for deaths that occur after July 30, 2003.
3. Disability Benefits
A member with 10 or more years of creditable service who becomes disabled from other than duty-connected causes may receive a non-duty disability benefit. A dis-ability resulting from a job-incurred injury or illness quali-fies a member (including PERS judge members) for dis-ability benefits regardless of the length of PERS-covered service. Upon qualifying for either a non-duty or duty dis-ability, service time is computed to age 58 (55 for police and fire members) when determining the monthly benefit.
Judge members of PERS who have served a minimum of six consecutive years and who become physically or mentally incapacitated are entitled to benefits as provided in ORS 238.555.
4. Benefit Changes After Retirement
Members may choose to continue participation in a vari-able equities investment account after retiring and may experience annual benefit fluctuations due to changes in the market value of equity investments.
Monthly benefits are adjusted annually through cost-of-living changes. Two percent per year is the maximum cost-of-living adjustment.
b. OPSRP Pension Program (OPSRP DB)
1. Pension Benefits
This portion of OPSRP provides a life pension funded by employer contributions. Benefits are calculated with the following formula for members who attain normal retirement age:
Police and fire: 1.8 percent is multiplied by the number of years of service and the final average salary. Normal retirement age for police and fire members is age 60 or age 53 with 25 years of retirement credit. To be classified as a police and fire member, the individual must have been employed continuously as a police and fire member for at least five years immediately preceding retirement.
General service: 1.5 percent is multiplied by the number of years of service and the final average salary. Normal retirement age for general service members is age 65, or age 58 with 30 years of retirement credit.
A member of the pension program becomes vested on the earliest of the following dates: the date the member completes 600 hours of service in each of five calendar years, the date the member reaches normal retirement age, and, if the pension program is terminated, the date on which termination becomes effective.
2. Death Benefits
Upon the death of a non-retired member, the spouse or other person who is constitutionally required to be treated in the same manner as the spouse, receives for life 50 per-cent of the pension that would otherwise have been paid to the deceased member. The surviving spouse or other person may elect to delay payment of the death benefit, but payment must commence no later than December 31 of the calendar year in which the member would have reached 70½ years.
3. Disability Benefits
A member who has accrued 10 or more years of retire-ment credits before the member becomes disabled or a member who becomes disabled due to job-related injury shall receive a disability benefit of 45 percent of the member’s salary determined as of the last full month of employment before the disability occurred.
c. OPSRP Individual Account Program (OPSRP IAP)
1. Pension Benefits
Upon retirement, a member of the OPSRP Individual Account Program (IAP) may receive the amounts in his or her employee account, rollover account, and employer account as a lump-sum payment or in equal installments over a 5-, 10-, 15-, 20-year period or an anticipated life span option. Each distribution option has a $200 minimum distri-bution limit.

Oregon Public Employees Retirement System
• 29 •
An IAP member becomes vested on the date the employee account is established or on the date the rollover account was established. If the employer makes option-al employer contributions for a member, the member becomes vested on the earliest of the following dates: the date the member completes 600 hours of service in each of five calendar years, the date the member reaches normal retirement age, the date the IAP is terminated, the date the active member becomes disabled, or the date the active member dies.
2. Death Benefits
Upon the death of a non-retired member, the beneficiary receives in a lump sum the member’s account balance, rollover account balance, and employer optional contribu-tion account balance. If a retired member dies before the installment payments are completed, the beneficiary may receive the remaining installment payments or choose a lump-sum payment.
3. Recordkeeping
PERS contracts with ING (Internationale Nederlanden Groep) to maintain IAP participant records.
d. Other Postemployment Healthcare Benefits
ORS 238.420 established the Retirement Health Insurance Account (RHIA) and authorizes a payment of up to $60 from RHIA toward the monthly cost of health insurance for eligible PERS members. RHIA is a cost-sharing, multiple-employer defined benefit OPEB plan for 902 participating employers. The plan was closed to new entrants hired on or after August 29, 2003.
To be eligible to receive this monthly payment toward the premium cost the member must: (1) have eight years or more of qualifying service in PERS at the time of retire-ment or receive a disability allowance as if the member had eight years or more of creditable service in PERS, (2) receive both Medicare Parts A and B coverage, and (3) enroll in a PERS-sponsored health plan.
A surviving spouse or dependent of a deceased PERS retiree who was eligible to receive the subsidy is eligible to receive the subsidy if he or she (1) is receiving a retire-ment benefit or allowance from PERS or (2) was insured at the time the member died and the member retired before May 1, 1991.
For the year ended June 30, 2012, PERS employers con-tributed 0.09 percent of PERS-covered salaries for Tier One and Tier Two members to fund the normal cost portion of RHIA benefits. PERS employers contributed 0.50 percent of all PERS-covered salaries to amortize the unfunded actuarial accrued liability over a fixed period with new unfunded actuarial accrued liabilities being amortized over 20 years. These rates were based on the December 31, 2009 actuarial valuation. This is included in the employer contri-bution rates listed in Table 2 on page 32.
Employer contributions are advance-funded on an actuarially determined basis. There is no inflation assumption for RHIA postemployment benefits because
the payment amount is set by statute and is not adjusted for increases in healthcare costs. The number of active plan RHIA participants was 41,467 for the fiscal year ended June 30, 2012. As of December 31, 2011, there were 92,067 active and 16,399 inactive members who meet the requirements to receive RHIA benefits when they retire.
ORS 238.415 established the Retiree Health Insurance Premium Account (RHIPA) and requires the Board on or before January 1 of each year to calculate the average dif-ference between the health insurance premiums paid by retired state employees under contracts entered into by the Board and health insurance premiums paid by state employ-ees who are not retired. ORS 238.415 authorizes payment of this average difference to qualified retired state employees. Retired state employees are qualified to receive this benefit if they had eight or more years of qualifying service in the System at the time of retirement or are receiving a disabil-ity pension calculated as if they had eight or more years of qualifying service, but are not eligible for federal Medicare coverage. RHIPA is a single-employer (the state as one employer) defined-benefit OPEB plan and was closed to new entrants hired on or after August 29, 2003.
A surviving spouse or dependent of a deceased retired state employee is eligible to receive the subsidy if he or she (1) is receiving a retirement benefit or allowance from PERS or (2) was insured at the time the member died, and the member retired on or after September 29, 1991.
For the year ended June 30, 2012, state agencies contrib-uted 0.05 percent of PERS-covered salaries for Tier One and Tier Two members to fund the normal cost portion of RHIPA benefits. State agencies contributed 0.11 percent of all PERS-covered salaries to amortize the unfunded actuarial accrued liability over a fixed period with new unfunded actuarial accrued liabilities being amortized over 20 years. These rates were based on the December 31, 2009 actuarial valuation. This is included in the employer contribution rates listed in Table 4 on page 34.
The number of active plan RHIPA participants was 1,136 for the fiscal year ended June 30, 2012. As of December 31, 2011, there were 23,521 active members who meet the requirements to receive RHIPA benefits when they retire. Inactive members are not eligible for these benefits. All subsidy payments from the RHIA and RHIPA are initially deposited in the Standard Retiree Health Insurance Account, described on page 30, and sub-sequently remitted to the appropriate PERS health plan.
e. Deferred Compensation Plan
Deferred compensation plans are authorized under Internal Revenue Code Section 457. The Oregon Legislature enacted Chapter 179, Oregon Laws 1997 that established the Deferred Compensation Fund. ORS 243.400 to 243.507 established and provided for PERS to administer the state deferred compensation plan, known as the Oregon Savings Growth Plan (OSGP). As of June 30, 2012, the fair value of investments was $1,055.0 million.

Oregon Public Employees Retirement System
• 30 •
The deferred compensation plan is a benefit available to all state employees. To participate, an employee executes an individual agreement with the state deferring current earnings to be paid at a future date. Participants in the plan are not required to pay federal and state income taxes on the deferred contributions and earnings until the funds are withdrawn. Participants or their beneficiaries cannot with-draw the funds until at least one of the following occurs: termination by reason of resignation, death, disability, or retirement; unforeseeable emergency; or by requesting a de minimis distribution from inactive accounts valued less than $5,000. A loan program is also available for eligible participants. Member loans receivable at June 30, 2012, total $9.7 million. Of that amount $6.9 million is not expected to be collected within one year.
PERS contracts with ING to maintain OSGP partici-pant records. The Oregon State Treasury, as custodian of the assets, also contracts with State Street Bank and Trust Company to provide financial services. There are 19 investment options with varying degrees of market risk. Up to five financial institutions provide investment services in mutual funds for each investment option. A participant receives a blend of these mutual funds within the investment option. Participants direct the selection of investment options and also bear any market risk. The state has no liability for losses under the plan but does have the prudent investor responsibility of due care. Total membership as of June 30, 2012, was 19,596.
PERS may assess a charge to the participants not to exceed 2.0 percent on amounts deferred, both contribu-tions and investment earnings, to cover costs incurred for administering the program. Actual charges to participants, including investment charges, for the year ended June 30, 2012, averaged 0.23 percent of amounts deferred.
Oregon Revised Statute 243.505 established a Deferred Compensation Advisory Committee to provide input to the PERS Board. This committee is composed of seven mem-bers who meet at least quarterly.
f. Standard Retiree Health Insurance Account
ORS 238.410 established the Standard Retiree Health Insurance Account (SRHIA), a public entity risk pool. SRHIA is both a risk sharing and insurance purchasing pool. The Board contracts for medical and hospital insur-ance on behalf of retired members. Members and their dependents are eligible for PERS healthcare coverage if the member is receiving a retirement allowance or benefit under the System. A surviving spouse or dependent of a PERS retiree is eligible to participate if he or she was cov-ered under the health plan at the time of the retiree’s death. As of June 30, 2012, there were 55,442 retirees and their dependents participating in the health insurance program.
PERS has contracted with various carriers on an insur-ance purchasing basis and remits premiums collected from participating members to the carriers on a monthly basis. PERS has contracted with Oregon Dental Service (ODS) for claims payment services for a maximum claims risk
sharing plan and also remits premiums monthly for stop-loss coverage. SRHIA is ultimately at risk for all amounts collected and on deposit with ODS and other health insur-ance providers, which totaled approximately $75.0 million as of June 30, 2012. ODS becomes responsible for claims in excess of $200 thousand per year per individual and all claims in excess of contractually required reserves on deposit with ODS.
The current estimate of Incurred But Not Reported (IBNR) insurance claims is $14.0 million. SRHIA received Early Retiree Reinsurance Program (ERRP) rev-enues through the federal government’s Affordable Care Act. The purpose of ERRP is to generate cost savings so that employers can maintain healthcare coverage for early retirees age 55 and older who are not yet eligible for Medicare. PERS has achieved this purpose by using the ERRP revenues to reduce healthcare insurance premiums. The ERRP revenues are reported as Federal Government Reimbursements in the Statement of Revenues, Expenses, and Changes in Net Assets.
Note 2 - Summary of Significant Accounting Policies A. Reporting Entity
The Public Employees Retirement Board is the govern-ing authority of the System. It consists of five members appointed by the governor and subject to confirmation by the state Senate. The Board appoints an executive director to act as the principal administrative officer of the System. The Board has independence in the operation and manage-ment of the System. The state Legislature has significant ability to influence funding, approve the System’s budget, and pass laws governing the System.
PERS’ financial statements are prepared on the basis of a fiscal year ended June 30. The Oregon State Treasury has statutory responsibility for custody and investment of PERS assets. As a result of this fiduciary responsibil-ity, PERS is included as part of the primary government in the State of Oregon Comprehensive Annual Financial Report.
B. Basis of Presentation
The accompanying financial statements are prepared in accordance with Governmental Accounting Standards Board Statements 10, 25, 30, 31, 32, 34, 43, and 50 as well as generally accepted accounting principles that apply to governmental accounting for fiduciary funds and enterprise funds. Fiduciary funds are used to account for assets held by a governmental unit in a trustee capacity (trust funds). Enterprise funds may be used to report any activity for which a fee is charged to external users for goods or ser-vices.
In accordance with Governmental Accounting Standards Board (GASB) Statement No. 20, Accounting and Financial Reporting for Proprietary Funds and Other Governmental Entities That Use Proprietary Fund Accounting, the System has elected not to follow Financial

Oregon Public Employees Retirement System
• 31 •
Accounting Standards Board pronouncements issued after November 30, 1989, for its enterprise fund.
PERS’ pension, other postemployment benefit, and deferred compensation activities are accounted for in five pension and other postemployment benefit trust funds:
• Defined Benefit Pension Plans
• Individual Account Program
• Retirement Health Insurance Account
• Retiree Health Insurance Premium Account
• Deferred Compensation Fund (Oregon Savings Growth Plan)
PERS’ public entity risk pool activity is accounted for in a single enterprise fund:
• Standard Retiree Health Insurance Account
C. Basis of Accounting
The accrual basis of accounting is used for all funds. Revenues are recognized when earned. Contributions are recognized when due, pursuant to formal commitments, as well as statutory and Board requirements. Expenses are recognized when incurred. Benefits and refunds are recog-nized in the month they are due and payable.
Proprietary funds distinguish operating revenues and expenses from non-operating items. Operating revenues and expenses generally result from providing services and producing and delivering goods in connection with a pro-prietary fund’s principal ongoing operations. The principal operating revenues are insurance premiums, and operat-ing expenses include claims and administrative expenses. All revenues and expenses not meeting this definition are reported as non-operating revenues and expenses.
D. Budgetary Data
Only administrative expenses are subject to biennial leg-islative budget control. The Legislature exercises this con-trol at the agency level. Any unobligated balance lapses at the end of each biennium.
Encumbrance accounting is allowed only during the biennium. All encumbrances lapse at the end of the bien-nium except capital construction, capital improvements, and disputed claims.
Budgetary accounting is not consistent with gener-ally accepted accounting principles (GAAP) because the measurement focus is on decreases in financial resources rather than net income determination.
E. Valuation of Investments
Investments are recognized at fair value, the amount at which financial instruments could be exchanged in a cur-rent transaction between willing parties other than in a forced or liquidation sale.
The fair value of publicly traded debt and equity securi-ties in active markets is determined by the custodian’s pric-ing agent using nationally recognized pricing services. The
custodian’s pricing agent values equity securities traded on a national or international exchange at the last reported sales price, and generally values debt securities by using evaluat-ed bid prices. For securities that do not have an active mar-ket, such as private placements or commingled investment vehicles, a market price is calculated by either the custodi-an’s pricing agent or the investment manager. For example, a similar benchmark security may be used to derive the fair value. The benchmark will typically have a coupon rate and maturity date comparable to the debt security being valued, and its market risk will be similar, considering current mar-ket conditions. The fair value of real estate investment trust (REIT) securities is determined by the custodian’s pricing agent using recognized pricing services. Publicly traded REIT securities account for 23.7 percent of the real estate asset class as of June 30, 2012.
Investments in private equities, alternative equities, and the opportunity portfolio are recorded at fair value as of June 30, 2012, as determined by management based on valuation information provided by the general partner. Investments in private equities, alternative equities, and the opportunity portfolio representing publicly traded securities are stated at quoted market price. Where observ-able market inputs are not available, valuation models are applied. The general partner determines fair value based on the best information available and by reference to information including, but not limited to, the follow-ing: projected sales, net earnings, earnings before inter-est, taxes, depreciation and amortization, balance sheets, public and private transactions, valuations for publicly traded comparable companies, and/or other measures, and consideration of any other pertinent information including the types of securities held and the general partner’s own assumptions regarding the investment. The methods used to determine the fair value of these investments typically include: (1) the market approach (whereby fair value is derived by reference to observable valuation measures for comparable companies or assets) and (2) the income approach (e.g., the discounted cash flow method).
Investments in real estate, with the exception of pub-licly traded REITS, for which observable market prices in active markets do not exist, are reported at fair value as of June 30, 2012, as determined by management based on valuation information provided in good faith by the gen-eral partner. Direct investments in real estate are appraised every two to three years, and between appraisals, invest-ment managers adjust values to reflect current and pro-jected operating performance and financial transactions. In the absence of observable market prices, general partners determine the fair value of real estate partnerships using valuation methods considered most appropriate. A vari-ety of factors are considered, including the nature of the investment, local market conditions, trading values on public exchanges for comparable investments, current and projected operating performance, and financing transac-tions subsequent to the acquisition of the investment.
Due to the inherent uncertainty and the degree of judg-ment involved in determining private equity, opportu-

Oregon Public Employees Retirement System
• 32 •
nity, alternatives, and real estate portfolio investment valuations, the fair values reflected in the accompanying financial statements may differ significantly from values that would have been used had a readily determinable market value for the investments existed and the differ-ence could be material. In addition, these investments are generally considered to be illiquid long-term investments, and the recorded fair values may materially differ from the amounts that eventually may be realized from the sale or other disposition of these investments.
F. Earnings Crediting
By law earnings are credited to member accounts on a calendar-year basis. Members in Tier One are currently guaranteed to receive at least the assumed earnings rate used in the most recent actuarial valuation. Members par-ticipating in the variable account, IAP members, and Tier Two members are credited actual earnings or losses, less deductions allowed by law.
G. Use of Estimates in the Preparation of Financial Statements
The preparation of the System’s financial statements in conformity with accounting principles generally accepted in the United States of America requires management to make estimates and assumptions that affect certain finan-cial statement amounts and disclosures. Actual results could differ from those estimates.
H. Comparative Totals
The basic financial statements include certain prior year summarized comparative information in total but not at the level of detail required for a presentation in conformity with the accounting principles generally accepted in the United States of America. Accordingly, such information should be read in conjunction with the System’s financial statements for the year ended June 30, 2011, from which
the summarized information was derived. Certain reclas-sifcations have been made to June 30, 2011 balances to conform to the presentation as of and for the year ended June 30, 2012.Note 3 - Contributions and ReservesA. Contributions
a. Member Contributions
Beginning January 1, 2004, all member contributions, except for contributions by judge members, were placed in the OPSRP Individual Account Program (IAP). Prior to that date, all member contributions were credited to the Defined Benefit Pension Plan. Member contributions are set by statute at 6.0 to 7.0 percent of salary and are remitted by participating employers, who may agree to make member contributions on the member’s behalf. The contributions are either deducted from member salaries or paid by the employers. The Member Reserve, described in Note 3C.1., represents accumulated member contributions and earnings allocations made prior to January 1, 2004, and subsequent earnings allocations less refunds and amounts transferred to reserves for retirements and disabilities. The IAP member accounts represent member contributions made on or after January 1, 2004, plus earnings allocations less disburse-ments for refunds, death benefits, and retirements.
b. Employer Contributions
PERS funding policy provides for monthly employer contributions at actuarially determined rates. These con-tributions, expressed as a percentage of covered payroll, are intended to accumulate sufficient assets to pay ben-efits when due. This funding policy applies to the PERS Defined Benefit Plan and the Other Postemployment Benefit Plans.
Employer contribution rates during the period were based on the December 31, 2009 actuarial valuation, which
TABLE 2Contribution Rate Summary 1 Defined Benefit Pension
Postemployment Healthcare
PERS Defined Benefit PlanOPSRP Pension
Program RHIA RHIPA
Pooled Employers Non-Pooled Employers All Employers All Employers State Only
State Agencies 2
State and Local Government Rate Pool 3 School Pool 3
Political Subdivisions 3,4 Judiciary
General Service
Police and Fire
Employee IAP 6.00% 6.00% 6.00% 6.00% 0.00% 6.00% 6.00% 0.00% 0.00%
EmployeeNormal Cost 0.00 0.00 0.00 0.00 7.00 0.00 0.00 0.00 0.00
EmployerNormal Cost 8.67 8.89 7.55 10.35 23.53 6.13 8.84 0.09 0.05
Unfunded Actuarial Liability 1.23 6.16 11.26 3.56 (5.95) 0.08 0.08 0.50 0.11
Total Employer Contributions 9.90 15.05 18.81 13.91 17.58 6.21 8.92 0.59 0.161 Group average rates shown were effective as of July 1, 2011.2 A subcomponent of the State and Local Government Rate Pool; includes UAL payment rate offset.3 Does not include UAL payment rate offsets.4 Non-pooled Political Subdivisions are valued separately for the Defined Benefit Plan.

Oregon Public Employees Retirement System
• 33 •
became effective July 1, 2011. The state of Oregon and cer-tain schools, community colleges, and political subdivisions have made excess contributions to the defined benefit pen-sion plans (unfunded actuarial liability payments), and their rates have been reduced. (See Table 2 on page 32.)
1. PERS Defined Benefit Plan Contributions (ORS 238)
Pension rates for the State and Local Government Rate Pool were 15.05 percent, schools 18.81 percent, and judi-ciary 17.58 percent of PERS-covered salaries, effective July 1, 2011. Political subdivisions that have not joined the State and Local Government Rate Pool had an average pension rate of 13.91 percent.
Oregon Laws 2001, Chapter 945, Section 13 authorized the establishment of the State and Local Government Rate Pool. Local political subdivisions were given the option to join the state of Oregon and community colleges for the actuarial purpose of calculating employer rates. Participation by local political subdivisions in this pool was effective for the actuarial valuation period beginning January 1, 2002.
Based on the actuarial valuation as of December 31, 2009, judiciary, state agencies, schools, and political sub-divisions had increases in employer contribution rates. These rate changes are measured against the actual aver-age rates paid since July 1, 2009. The Board practice is to implement new employer contribution rates July 1 of each odd-numbered year based on the valuation of the previous odd-numbered year.
2. OPSRP Pension Program Contributions (ORS 238A)
PERS employers participating in the OPSRP Pension Program participate in the same rate sharing pool and therefore share the same contribution rate. The OPSRP Pension Program employer rates effective July 1, 2011, through June 30, 2013, were 6.21 percent of covered salaries for general service employees and 8.92 percent of covered salaries for police and fire employees. These rates increased from 5.73 percent of covered salaries for general
service and 8.44 percent of covered salaries for police and fire employees. Each of these rates includes a component related to disability benefits for general service and police and fire members.
B. Actuarial Cost Method and Assumptions
The employer contribution rates effective July 1, 2011, through June 30, 2013, were set using the projected unit credit (PUC) actuarial cost method. For the Tier One/Tier Two component of the PERS Defined Benefit Plan, this method produced an employer contribution rate consisting of (1) an amount for normal cost (the estimated amount necessary to finance benefits earned by the employees dur-ing the current service year), (2) an amount for the amorti-zation of unfunded actuarial accrued liabilities, which are being amortized over a fixed period with new unfunded actuarial accrued liabilities being amortized over 20 years, and (3) an actuarially determined amount for funding pos-temployment healthcare subsidies. For the OPSRP Pension Program component of the PERS Defined Benefit Plan, this method produced an employer contribution rate consist-ing of (a) an amount for normal cost (the estimated amount necessary to finance benefits earned by the employees dur-ing the current service year), (b) an actuarially determined amount for funding a disability benefit component, and (c) an amount for the amortization of unfunded actuarial accrued liabilities, which are being amortized over a fixed period with new unfunded actuarial accrued liabilities being amortized over 16 years.
The funded status of the pension plan and each postem-ployment healthcare plan as of the most recent actuarial valuation date is illustrated in Table 3. The actuarial meth-odologies and assumptions used to determined funded status were the same as those used to establish rates.
Actuarial valuations of an ongoing plan involve estimates of the value of reported amounts and assumptions about the probability of events far into the future. Actuarially deter-mined amounts are subject to continual revision as actual results are compared to past expectations and new estimates are made about the future. The required schedule of funding
TABLE 3 (dollar amounts in millions)1
Funded Status
Actuarial Valuation
Date
ActuarialValue of Assets
(a)
Actuarial Accrued Liability (AAL)
(b)
Unfunded AAL (UAAL)
(b - a)Funded Ratio
(a/b)
Covered Payroll
(c)
UAAL as a % of Covered
Payroll ((b-a)/c)
Defined Benefit Pension12/31/2011 $50,168.22 $61,198.4 $11,030.2 82.0% $8,550.5 129.0%RHIA12/31/2011 239.6 461.1 221.5 52.0 8,550.5 2.6RHIPA12/31/2011 4.5 34.4 29.9 13.2 2,376.9 1.31 Discrepancies contained in this table are the result of rounding differences.2 Includes individual employer side accounts of $5,225.1 million
Oregon Public Employees Retirement System
• 34 •
progress immediately following the notes to the financial statements presents multi-year trend information about whether the actuarial value of plan assets is increasing or decreasing over time relative to the actuarial accrued liabil-ity for benefits.
The actuarial valuation calculations are based on the benefits provided under the terms of the plan in effect at the time of each valuation and on the pattern of sharing of costs between the employer and plan members as of the December 31, 2010 valuation.
Actuarial calculations reflect a long-term perspective. Actuarial methods and assumptions include techniques designed to reduce short-term volatility in actuarial accrued liabilities and the actuarial value of assets consistent with the long-term perspective of the calculations.
Actuarial methods and assumptions used in the latest actuarial valuation are illustrated in Table 4.
C. Reserves and Designations
Chapter 238 Defined Benefit Plan, Other Postemployment Benefit Plans, and Enterprise Fund
1. Member Reserve
The Member Reserve of $7,481.9 million as of June 30, 2012, represents member contributions made through December 31, 2003, and earnings allocations less refunds and amounts transferred to reserves for retirements and disabilities.
2. Employer Contribution Designation
The Employer Contribution Designation of $21,907.4 million as of June 30, 2012, represents employer contribu-tions and earnings allocations less amounts transferred to reserves for retirements and disabilities.
3. Benefit Reserve
The Benefit Reserve of $19,476.5 million as of June 30, 2012, is the amount set aside to pay future benefits. It includes funds transferred from the individual member and employer accounts and earnings allocations less amounts paid for retirements and disabilities.
4. Tier One Rate Guarantee Reserve
The Tier One Rate Guarantee Reserve may be cred-ited with investment earnings in excess of the required Tier One assumed earnings rate guarantee. ORS 238.255 requires regular accounts for Tier One members to be credited at the assumed rate of return on investments adopted by the Board for use in actuarial valuations.
The regular account for Tier One members and alternate payees of those members cannot be credited with earnings in excess of the assumed interest rate until:
(a) the reserve is fully funded with amounts determined by the Board, after consultation with the actuary employed by the Board, necessary to ensure a zero balance in the reserve when all Tier One members and alternate payees of those members have retired; and
(b) the reserve has been fully funded as described in paragraph (a) of this subsection in each of the three imme-diately preceding calendar years. As of June 30, 2012, the balance of this reserve was ($345.3) million.
5. Board Actions Affecting Reserves
As part of its December 31, 2011 earnings crediting decision, the Board decided to distribute $199.2 mil-lion from the Contigency Reserve to the Tier One Rate Guarantee Reserve to eliminate the 2008 deficit.
6. Contingency Reserve
The Contingency Reserve is to be maintained and used by the Board to prevent any deficit of moneys available for the payment of retirement allowances due to interest fluc-tuations, changes in mortality rates, or other unforeseen contingencies. As of June 30, 2012, the balance of this reserve was $510.3 million.
7. Employer Contingency Reserve
The Employer Contingency Reserve was established by the Board to prevent any deficit in the fund caused by the insolvency of an employer. Only earnings on employer contributions fund this reserve. As of June 30, 2012, the reserve had a balance of $25.0 million.
TABLE 4Actuarial Methods and Assumptions
Pension RHIA RHIPAValuation date December 31, 2011 December 31, 2011 December 31, 2011Actuarial cost method Projected Unit Credit Projected Unit Credit Projected Unit CreditAmortization method Amortized as a level percentage of pay-
roll; Tier One/Tier Two UAL (20 year) and OPSRP pension UAL (16 year)
amortization periods are closed
Amortized as a level percentage of payroll; UAL (10 year) amortization
period is closed
Amortized as a level percentage of payroll; UAL (10 year) amortization
period is closed
Equivalent single amortization period 30 years 10 years 10 yearsAsset valuation method Market value of assets Market value of assets Market value of assetsActuarial assumptions: Inflation rate 2.75 percent 2.75 percent 2.75 percent Investment rate of return 8.00 percent 8.00 percent 8.00 percent Projected salary increases 3.75 percent 3.75 percent 3.75 percent Healthcare cost trend rate N/A None. Statute stipulates $60 monthly
payment for healthcare insurance.Graded from 7.0 percent in 2011
to 4.5 percent in 2029.

Oregon Public Employees Retirement System
• 35 •
8. Capital Preservation Reserve
The Capital Preservation Reserve, as of June 30, 2012, had a balance of zero. In accordance with ORS 238.670, funds in this reserve may be used only to offset gains and losses of invested capital.
9. Unallocated Earnings Designation
The Unallocated Earnings Designation represents January through June investment earnings or losses less administra-tive expenses, which will be credited on a calendar year basis. Crediting takes place in March of the following year after employer annual reports have been reconciled and contribu-tions have been posted to individual member and employer accounts. As of June 30, 2012, the balance of this designation was $3,599.4 million.
10. OPSRP Defined Benefit Program
The OPSRP Defined Benefit plan net assets balance repre-sents the program’s accumulation of employer contributions and investment earnings less benefits and administrative expenses. As of June 30, 2012, the balance of this account was $1,004.2 million.
Other Postemployment Benefits Plans
11. Retirement Health Insurance Account (RHIA)
The RHIA plan net assets balance represents the program’s accumulation of employer contributions and investment earn-ings less premiums and administrative expenses. As of June 30, 2012, the balance of this account was $266.6 million. The Internal Revenue Code limits employer contributions to a 401(h) account to a maximum of 25 percent of the employer’s normal cost contributions to the pension plan.
12. Retiree Health Insurance Premium Account (RHIPA)
The RHIPA plan net assets balance represents the program’s accumulation of employer contributions and investment earn-ings less premiums and administrative expenses. As of June 30, 2012, the balance of this account was $4.6 million. The Internal Revenue Code limits employer contributions to a 401(h) account to a maximum of 25 percent of the employer’s normal cost contributions to the pension plan.
Enterprise Fund13. Standard Retiree Health Insurance Account (SRHIA)
The SRHIA plan net assets balance represents the program’s accumulation of insurance premiums and interest earnings less claims payments and administrative expenses. Net assets may be used to pay incurred but not reported expenses (IBNR) and to stabilize future premium rates. As of June 30, 2012, the balance of this account was $80.3 million.
D. Administrative Costs The System’s administrative expenses are funded from
investment earnings and administrative fees collected from members and are allocated to all plans and programs adminis-tered by the System. If investment earnings and fees are insuf-
ficient for such purpose, the remaining expenses are paid from employer contributions.
Note 4 - Receivables and PayablesA. Receivables
Table 5 disaggregates receivable balances reported in the Statement of Fiduciary Net Assets as Investment Sales and Other Receivables.
The Strunk/Eugene Accrual resulted from recalculating benefits for recipients who received overpayments based on
the reallocation of 1999 earnings. Approximately 84.6 per-cent of these receivables, or $93.5 million, is not expected to be collected by June 30, 2013.
B. Payables
Table 6 disaggregates payable balances reported in the Statement of Fiduciary Net Assets as Investment Purchases and Accrued Expenses.
Note 5 - Capital Assets Used in Plan OperationsCapital construction of PERS’ headquarters in Tigard,
Oregon, was completed May 31, 1997. The land, building, and improvements are recorded at cost. The depreciation of the building and improvements is computed on the straight-line method over the estimated useful life of 40 years.
Data processing hardware, furniture, and equipment are recorded at cost. These are items that are not consumed in the normal course of operations, have a useful life of more than one year, and whose value is $5,000 or more. Depreciation is computed using the straight-line method over the assets’ esti-mated useful lives. Useful lives range from three to 10 years.
TABLE 5Investment Sales and Other Receivables
June 30, 2012
Broker Receivable $ 1,191,858,056Strunk/Eugene Accrual 110,516,276Overpaid Benefits 2,517,568Other 300,280 Total $ 1,305,192,180
TABLE 6Investment Purchases andAccrued Expenses June 30, 2012
Broker Payable $ 2,209,223,490Investment Fees 34,144,909Refunds 14,982,502Death Benefits 7,132,366Compensated Absences 1,562,765Services and Supplies 884,834Other 767,395
Total $ 2,268,698,261

Oregon Public Employees Retirement System
• 36 •
Data processing software generated internally as part of the Oregon Retirement Information On-line Network (ORION) project is recorded at cost. The useful life is amortized using the straight-line method over 20 years. (See Table 7.)
Note 6 - Deposits and InvestmentsThe Oregon State Treasury is the investment officer for
the state of Oregon. Investment standards are established in ORS 293.726 and require funds to be managed as a prudent investor would do. The Oregon Investment Council (OIC) establishes policies for the investment and reinvestment of moneys in PERS’ investment funds. Policies are estab-lished based on the primary investment asset class of each investment manager and do not reflect the classifications of individual holdings as presented in the financial statements. Contracts with individual investment managers provide additional guidelines that vary from manager to manager.
A. Deposits PERS cash and cash equivalents consist of cash on
hand, deposits in the Oregon Short Term Fund (OSTF), moneys held by external investment managers, and cash equivalents held by health insurance providers. OSTF is a cash and investment pool that operates as a demand deposit account and is required for use by all state funds. (See Table 8.) OSTF is separately audited by the Oregon Audits Division. The audited financial statements can be viewed at http://www.sos.state.or.us/audits/pages/state_audits/full/2012/2012-27.pdf. OSTF investment risks are addressed in the notes to those financial statements.
1. Custodial Credit RiskCustodial credit risk for deposits is the risk that in
the event of a bank failure, PERS’ deposits may not be recovered.
As noted above, the deposit and investment risks, includ-ing custodial risk, of the OSTF are outlined in the OSTF financial statements. As of June 30, 2012, the carrying amount of PERS’ deposits in OSTF totaled $532.9 million, and the corresponding bank balance was $591.6 million.
Investment managers’ deposits with custodian banks consist of cash and cash equivalents that represent buying reserves. As of June 30, 2012, there was $1,392.6 million on deposit for the accounts of the Public Employees Retirement Fund (PERF) investment managers, of which $1,347.8 mil-lion was exposed to custodial credit risk.
Cash and cash equivalents of $75.0 million as of June 30, 2012, held by the Oregon Dental Service and Providence Health Plans in the Standard Retiree Health Insurance Account are exposed to custodial credit risk because the underlying investments are not held in PERS’ name.
2. Foreign Currency RiskForeign currency risk for deposits is the risk that changes
in exchange rates will adversely affect the fair value of the deposits. Foreign currency risk is controlled via contrac-tual agreements with the investment managers. As of June 30, 2012, $85.9 million in cash and cash equivalents was exposed to foreign currency risk. The U.S. dollar balances of these deposits, organized by currency denomination, are presented in Table 12 on page 40.
TABLE 7
Schedule of Capital Assets as of June 30, 2012Beginning of Year Increases Decreases End of Year
Capital Assets Furniture and Equipment $ 1,170,201 $ 493,552 (420,564) $ 1,243,189 Data Processing Software 38,450,617 1,709,001 — 40,159,618 Data Processing Hardware 2,013,613 74,941 (297,422) 1,791,132 Building and Building Improvements 7,601,581 687,082 — 8,288,663 Land 944,463 — — 944,463 Total Capital Assets 50,180,475 2,964,576 (717,986) 52,427,065Less Accumulated Depreciation Furniture and Equipment (838,936) (125,971) 420,564 (544,343) Data Processing Software (6,062,559) (1,771,716) — (7,834,275) Data Processing Hardware (1,372,508) (220,040) 297,422 (1,295,126) Building and Building Improvements (2,589,327) (203,785) — (2,793,112) Total Accumulated Depreciation (10,863,330) (2,321,512) 717,986 (12,466,856)
Capital Assets, Net $ 39,317,145 $ 643,064 $ — $ 39,960,209
Depreciation Expense Amount Defined Benefit Pension Plan Depreciation $ 2,299,280 Oregon Public Service Retirement Plan Individual Account Program Depreciation 22,232 Total Depreciation Expense $ 2,321,512
TABLE 8Depository Account Bank BalanceInsured $ 44,707,339Oregon Short Term Fund 591,573,019Uninsured and uncollateralized 1,422,849,156Total deposits $ 2,059,129,514

Oregon Public Employees Retirement System
• 37 •
3. Restricted Cash Equivalents
PERS’ cash and cash equivalents at June 30, 2012, include futures and swap collateral of $10.9 million held by investment managers. Swap collateral is offset by a related liability with a net settlement feature. Collateral is restrict-ed and is not available to pay current liabilities.
B. Investments Table 9 presents the fair value of investments held
by the state of Oregon for PERS as of June 30, 2012.
1. Credit Risk Debt Securities
It is OIC’s policy that no more than 35 percent of the fixed income manager positions be below invest-ment grade. Securities with a quality rating of below BBB- are considered below investment grade. There is no policy restriction on other investment managers who may hold debt securities. As of June 30, 2012, the fair value of below grade investments, excluding unrated securities, is $2,243.5 million, or 26.6 per-cent, of total securities subject to credit risk, and the weighted quality rating average is A. Overall credit quality deteriorated due to downgrades in both corpo-rate bonds and non-agency mortgages. Unrated secu-rities include $1,758.8 million in bank loans, $2,004.1 million in mutual funds, and $980.9 million in other debt securities.
Table 10 shows the quality ratings for credit risk debt securities as of June 30, 2012.
2. Custodial Credit Risk
Custodial credit risk for investments is the risk that in the event of a failure of the counterparty, PERS will not be able to recover the value of the investments or collateral securities that are in the possession of an outside party. OIC has no formal policy regarding the holding of securities by a custo-dian or counterparty. As of June 30, 2012, no invest-ments were exposed to custodial credit risk.
3. Concentrations of Credit Risk
OIC expects investment managers to maintain diversified portfolios. There is no limit on single issuer investments for domestic, global, and inter-national equity fund managers. Policy states that the asset classes will be diversified across their respective markets. Additionally, both passive and active investing strategies are employed, and sever-al external managers engage in active management.
OIC provides the following limitations for fixed income manager positions:
• obligations issued or guaranteed by the U.S. government, U.S. agencies, or government-sponsored enterprises – no restriction;
• obligations of other national governments – no more than 10 percent of the debt investment portfolio per issuer;
• private mortgage-backed and asset-backed securities, unless collateral is credit-independent of the issuer and the security’s credit enhancement is generated internally – no more than 10 percent of the debt investment portfolio per issuer; 25 percent per issuer if the collateral exception is met; and
TABLE 9Investments at June 30, 2012 Fair ValueRepurchase Agreements $ 12,456,946U.S. Treasury Obligations 1,306,237,936U.S. Federal Agency Mortgage Securities 1,334,708,135U.S. Federal Agency Mortgage TBAs 690,918,754U.S. Federal Agency Debt 271,695,690U.S. Federal Agency Strips 68,874,997U.S. Treasury Obligations – Strips 4,312,597U.S. Treasury Obligations – TIPS 66,629,437International Debt Securities 2,261,725,563Corporate Bonds 3,192,669,596Bank Loans 1,758,832,290Temporary Liquidity Guarantee Program (TLGP) 6,717,907Municipal Bonds 105,358,805Collateralized Mortgage Obligations 1,054,012,032Asset-Backed Securities 502,742,605Mutual Funds – Domestic Fixed Income 1,523,285,754Mutual Funds – International Fixed Income 480,809,663Total Debt Securities 14,641,988,707Derivatives 53,606,520Domestic Equity Securities 7,045,170,977International Equity Securities 8,660,292,506Mutual Funds – Domestic Equity 1,946,539,771Mutual Funds – Global Equity 755,730,716Mutual Funds – International Equity 2,161,639,370Mutual Funds – Target Date 293,817,471Oregon Savings Growth Plan - Self-Directed 2,184,233Real Estate and Real Estate Investment Trusts 6,760,574,023Limited Partnerships and Leveraged Buyouts 14,544,003,207Alternative Equity 410,250,609Opportunity Portfolio 933,878,315
Total PERS Investments $ 58,209,676,425
TABLE 10
Credit Risk Debt Securities at June 30, 2012 Fair ValueQuality RatingAAA $ 759,239,255AA 2,036,798,975A 886,646,432BBB 2,202,901,750BB 759,250,568B 819,923,275CCC 526,968,023CC 87,603,895C 2,881,602D 46,899,289Unrated 4,743,830,644Total Subject to Credit Risk 12,872,943,708U.S. Government Guaranteed Securities 1,769,044,999Total Debt Securities $ 14,641,988,707

Oregon Public Employees Retirement System
• 38 •
• other issuers, excluding investments in commingled vehicles – no more than 3 percent of the debt investment portfolio.
As of June 30, 2012, there were no single issuer debt investments that exceeded the above guidelines nor were there investments in any one issuer that represent 5 percent or more of total investments or total net assets.
4. Interest Rate Risk
Interest rate risk is the risk that changes in interest rates will adversely affect the fair value of an investment. This risk is managed within the portfolio using the effective duration methodology. Policies state that the fixed income manager positions will maintain a weighted average effec-tive duration within plus or minus 20 percent of the bench-mark’s effective duration. There is no policy restriction for non-fixed income investment managers who may hold fixed income positions. As of June 30, 2012, the weighted average duration of PERS’ fixed income portfolio was 4.05 years.
Effective duration is a measure of a fixed income invest-ment’s exposure to fair value changes arising from chang-
es in interest rates. Effective duration makes assumptions regarding the most likely timing and amounts of variable cash flows. These assumptions take into consideration fac-tors indicative of investments highly sensitive to interest rate changes, including callable options, prepayments, and other factors. These factors are reflected in the effective duration numbers provided herein.
No individual fixed income investment manager’s port-folio was outside the policy guidelines at June 30, 2012. Table 11 shows the investments by type, amount, and effective weighted duration.
At June 30, 2012, PERS held approximately $2,456.6 million in debt instruments backed by pooled mortgages, Collateralized Mortgage Obligations (CMOs), or fixed-rate mortgages. These securities represent a stream of principal and interest payments from underlying mort-gages. Assets with these characteristics are suscepti-ble to prepayment by the mortgage holders which may result in a decrease in total interest realized. The value of these securities can be volatile as interest rates fluctu-ate. Additionally, the risk of default exits and collateral held may potentially be insufficient to cover the principal
due. PERS also held approxi-mately $690.9 million in To Be Announced (TBA) federal agency-issued mortgage pools. An additional $767.5 million of debt instruments are asset-backed securities backed pri-marily by automobile, equip-ment lease, and student loan receivables.
5. Foreign Currency Risk
Foreign currency risk is the risk that changes in exchange rates will adversely affect the fair value of an investment or a deposit. Policy states that no more than 15 percent of the fixed income manager posi-tions may be invested in non-dollar denominated securities. Policies for the non-fixed por-tion of PERS’ portfolio are silent regarding this risk. As of June 30, 2012, approximately 3.0 percent of the debt invest-ment portfolio was invested in non-dollar denominated securi-ties. (See Table 12 on page 39.)
6. Unfunded CommitmentsOIC has entered into agree-
ments that commit the Public Employees Retirement Fund (PERF), upon request, to make additional investment pur-chases up to a predetermined
TABLE 11Schedule of Interest Rate Risk - Effective Duration at June 30, 2012
Investment Fair Value
Effective Weighted Duration (in years)
U.S. Treasury Obligations $ 1,288,240,944 8.92U.S. Treasury Obligations - Strips 4,312,597 5.42U.S. Treasury Obligations - TIPS 66,629,437 6.38U.S. Federal Agency Mortgage Securities 1,985,080,993 3.24U.S. Federal Agency Debt 271,695,690 6.07U.S. Federal Agency Strips 68,874,997 7.51International Debt Securities 2,181,280,326 4.82Corporate Bonds 3,165,388,102 4.93Temporary Liquidity Guarantee Program (TLGP) 6,717,907 0.15Bank Loans 1,756,910,101 0.28Municipal Bonds 105,219,007 8.93Collateralized Mortgage Obligations 985,068,702 2.82Asset-Backed Securities 454,916,220 1.37Mutual Funds - Domestic Fixed Income 1,266,585,800 2.16Mutual Funds - Domestic Fixed Income (OSGP) 98,411,398 4.68Mutual Funds - International Fixed Income 480,809,663 6.13Mutual Funds - Stable Value 158,288,556 2.77
No Effective Duration: U.S. Treasury Obligations 17,996,992 N/AU.S. Federal Agency Mortgage Securities 40,545,896 N/AInternational Debt Securities 80,445,237 N/ACorporate Bonds 27,281,494 N/ABank Loans 1,922,189 N/AMunicipal Bonds 139,798 N/ACollateralized Mortgage Obligations 68,943,330 N/AAsset-Backed Securities 47,826,385 N/ARepurchase Agreements 12,456,946 N/A
Total Debt Securities $ 14,641,988,707
Cash Equivalent - U.S. Government Short Term Funds 62,849,224 39 Days1
Total Subject to Interest Rate Risk $ 14,704,837,9311Weighted average maturity

Oregon Public Employees Retirement System
• 39 •
amount. As of June 30, 2012, the PERF had $7,519.1 million in commitments to purchase private equity invest-ments, $2,260.7 million in commitments to purchase real estate investments, $532.4 million in commitments to pur-chase alternative equity investments, and $304.5 million in commitments to purchase opportunity portfolio invest-ments, which includes $188.1 million in recallable distri-butions. These amounts are unfunded and are not recorded in the Statement of Fiduciary Net Assets.
C. Securities Lending
In accordance with state investment policies, PERF par-ticipates in securities lending transactions. Through securi-ties lending authorization agreements, the Oregon State Treasury has authorized its custodian, State Street Bank, to lend its securities pursuant to the terms and conditions
of policy and applicable agreements. Both PERF and the borrowers maintained the right to terminate all securities lending transactions on demand. There were no significant violations of the provisions of securities lending agree-ments during the period of these financial statements.
The custodian had the authority to loan short-term, fixed income, and equity securities and to receive as collateral U.S. dollar and foreign currency cash, U.S. government and agency securities, letters of credit, and foreign sover-eign debt of Organization of Economic Cooperation and Development (OECD) countries. Borrowers were required to deliver collateral for each loan equal to not less than 102 percent of the market value of the loaned security or 105 percent in the case of international and Canadian secu-rities. The custodian did not have the ability to pledge or
TABLE 12Currency Exposures by Asset Class in U.S. Dollar Equivalents as of June 30, 2012
CurrencyCash and Cash
EquivalentsDebt
SecuritiesPublic Equity
Real Estate
Private Equity Total
Argentine peso $ 73,730 $ - $ - $ - $ - $ 73,730Australian dollar 1,108,339 82,298,584 372,149,992 74,508,689 - 530,065,604Brazilian real 2,133,315 22,976,021 207,681,388 1,488,889 - 234,279,613Canadian dollar 584,421 23,114,949 415,208,122 16,961,881 - 455,869,373Chilean peso 15,553 - 6,439,132 - - 6,454,685Chinese yuan 63,839 - - - - 63,839Colombian peso - 1,256,090 7,411,171 - - 8,667,261Czech koruna 192,919 - 4,678,787 - - 4,871,706Danish krone 525,709 21,979 95,495,277 - - 96,042,965Dominican Republic peso - 1,152,815 - - - 1,152,815Egyptian pound 156,742 - 14,029,251 - - 14,185,993Euro 44,018,809 134,661,886 1,712,010,977 51,203,863 380,294,537 2,322,190,072Hong Kong dollar 2,340,648 - 397,374,281 94,914,017 - 494,628,946Hungarian forint 4,147 - 10,501,033 - - 10,505,180Indian rupee 309,721 - 66,427,913 - - 66,737,634Indonesian rupiah 409,215 - 82,538,091 - - 82,947,306Israeli shekel 73,637 - 10,203,386 - - 10,277,023Japanese yen 17,849,598 21,804,287 1,472,876,698 63,761,839 - 1,576,292,422Jordanian dinar 1 - - - - 1Malaysian ringgit 189,616 - 33,205,292 - - 33,394,908Mexican peso 2,061,980 52,751,645 52,859,698 - - 107,673,323New Zealand dollar 116,741 - 11,875,608 - - 11,992,349Nigerian naira - - 548,371 - - 548,371Norwegian krone 547,583 - 39,798,145 534,704 - 40,880,432Pakistan rupee 65,729 - 1,732,449 - - 1,798,178Peruvian nuevo sol 36 100,161 967,398 - - 1,067,595Philippine peso 7,485 - 15,532,630 - - 15,540,115Polish zloty 34,847 - 23,435,864 - - 23,470,711Pound sterling 7,562,860 93,360,820 1,260,822,555 60,762,684 - 1,422,508,919Qatar riyal - - 2,573,871 - - 2,573,871Singapore dollar 254,940 - 86,914,347 22,987,505 - 110,156,792South African rand 235,041 - 190,977,660 - - 191,212,701South Korean won 1,022,275 - 300,272,555 - - 301,294,830Swedish krona 97,807 - 148,452,223 5,514,283 - 154,064,313Swiss franc 913,284 - 368,437,028 6,408,816 - 375,759,128Taiwan dollar 1,804,441 - 117,172,826 - - 118,977,267Thai baht 831,539 - 103,041,880 1,483,871 - 105,357,290Turkish lira 260,949 1,280,929 62,674,613 307,438 - 64,523,929Venezuelan fuerte 6,234 - 11 - - 6,245
Total Subject to Foreign Currency Risk $ 85,873,730 $ 434,780,166 $ 7,696,320,523 $ 400,838,479 $ 380,294,537 $ 8,998,107,345
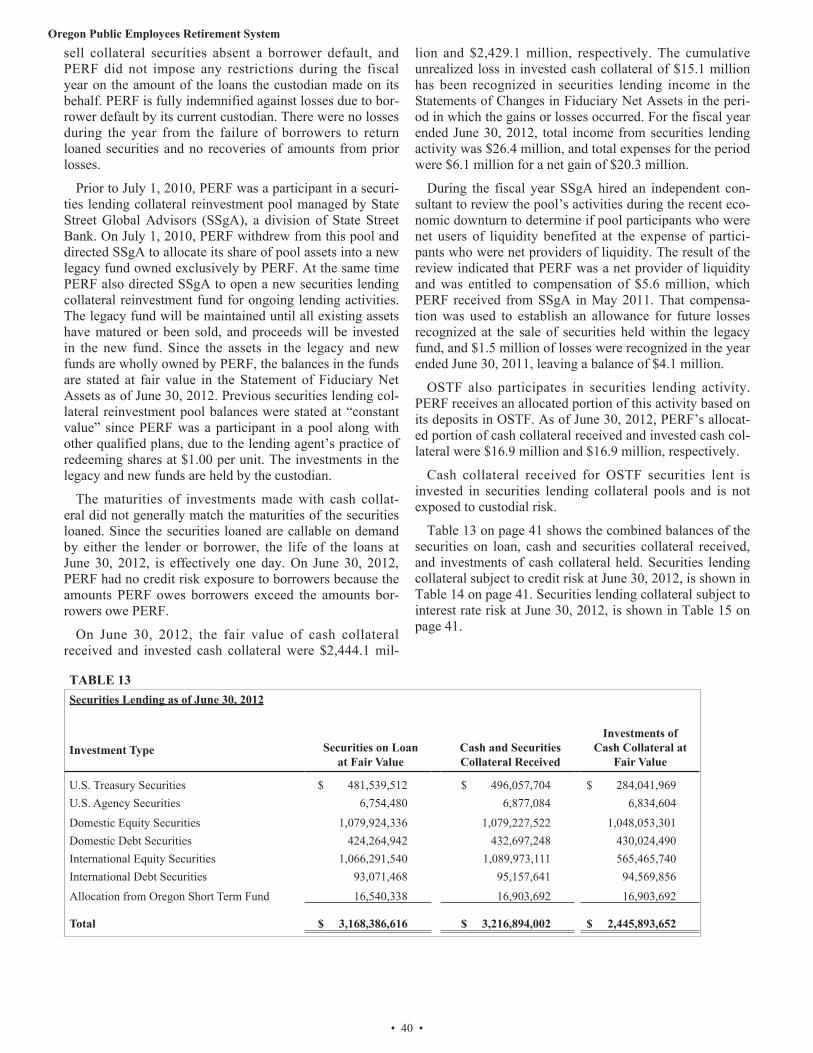
Oregon Public Employees Retirement System
• 40 •
sell collateral securities absent a borrower default, and PERF did not impose any restrictions during the fiscal year on the amount of the loans the custodian made on its behalf. PERF is fully indemnified against losses due to bor-rower default by its current custodian. There were no losses during the year from the failure of borrowers to return loaned securities and no recoveries of amounts from prior losses.
Prior to July 1, 2010, PERF was a participant in a securi-ties lending collateral reinvestment pool managed by State Street Global Advisors (SSgA), a division of State Street Bank. On July 1, 2010, PERF withdrew from this pool and directed SSgA to allocate its share of pool assets into a new legacy fund owned exclusively by PERF. At the same time PERF also directed SSgA to open a new securities lending collateral reinvestment fund for ongoing lending activities. The legacy fund will be maintained until all existing assets have matured or been sold, and proceeds will be invested in the new fund. Since the assets in the legacy and new funds are wholly owned by PERF, the balances in the funds are stated at fair value in the Statement of Fiduciary Net Assets as of June 30, 2012. Previous securities lending col-lateral reinvestment pool balances were stated at “constant value” since PERF was a participant in a pool along with other qualified plans, due to the lending agent’s practice of redeeming shares at $1.00 per unit. The investments in the legacy and new funds are held by the custodian.
The maturities of investments made with cash collat-eral did not generally match the maturities of the securities loaned. Since the securities loaned are callable on demand by either the lender or borrower, the life of the loans at June 30, 2012, is effectively one day. On June 30, 2012, PERF had no credit risk exposure to borrowers because the amounts PERF owes borrowers exceed the amounts bor-rowers owe PERF.
On June 30, 2012, the fair value of cash collateral received and invested cash collateral were $2,444.1 mil-
lion and $2,429.1 million, respectively. The cumulative unrealized loss in invested cash collateral of $15.1 million has been recognized in securities lending income in the Statements of Changes in Fiduciary Net Assets in the peri-od in which the gains or losses occurred. For the fiscal year ended June 30, 2012, total income from securities lending activity was $26.4 million, and total expenses for the period were $6.1 million for a net gain of $20.3 million.
During the fiscal year SSgA hired an independent con-sultant to review the pool’s activities during the recent eco-nomic downturn to determine if pool participants who were net users of liquidity benefited at the expense of partici-pants who were net providers of liquidity. The result of the review indicated that PERF was a net provider of liquidity and was entitled to compensation of $5.6 million, which PERF received from SSgA in May 2011. That compensa-tion was used to establish an allowance for future losses recognized at the sale of securities held within the legacy fund, and $1.5 million of losses were recognized in the year ended June 30, 2011, leaving a balance of $4.1 million.
OSTF also participates in securities lending activity. PERF receives an allocated portion of this activity based on its deposits in OSTF. As of June 30, 2012, PERF’s allocat-ed portion of cash collateral received and invested cash col-lateral were $16.9 million and $16.9 million, respectively.
Cash collateral received for OSTF securities lent is invested in securities lending collateral pools and is not exposed to custodial risk.
Table 13 on page 41 shows the combined balances of the securities on loan, cash and securities collateral received, and investments of cash collateral held. Securities lending collateral subject to credit risk at June 30, 2012, is shown in Table 14 on page 41. Securities lending collateral subject to interest rate risk at June 30, 2012, is shown in Table 15 on page 41.
TABLE 13Securities Lending as of June 30, 2012
Investment Type Securities on Loan at Fair Value
Cash and SecuritiesCollateral Received
Investments of Cash Collateral at
Fair Value
U.S. Treasury Securities $ 481,539,512 $ 496,057,704 $ 284,041,969U.S. Agency Securities 6,754,480 6,877,084 6,834,604
Domestic Equity Securities 1,079,924,336 1,079,227,522 1,048,053,301Domestic Debt Securities 424,264,942 432,697,248 430,024,490International Equity Securities 1,066,291,540 1,089,973,111 565,465,740International Debt Securities 93,071,468 95,157,641 94,569,856
Allocation from Oregon Short Term Fund 16,540,338 16,903,692 16,903,692
Total $ 3,168,386,616 $ 3,216,894,002 $ 2,445,893,652

Oregon Public Employees Retirement System
• 41 •
TABLE 14Securities Lending Invested Cash Collateral Subject to Credit Risk at June 30, 2012
Quality Rating Fair ValueAAA $ 109,616,110AA 1 919,892,188A 1 634,792,138BBB 456,049,358BB&B 8,640,166Unrated 300,000,000
Total Subject to Credit Risk 2,428,989,960
Allocation from Oregon Short Term Fund 16,903,692 Total Securities Lending Invested Cash Collateral $ 2,445,893,652 1 Commercial paper ratings of A-1+/P-1 categorized as AA;A-1/P-1 as A.
TABLE 15Securities Lending Invested Cash Collateral Subject to Interest Risk at June 30, 2012
EffectiveWeighted Average
DurationSecurity Type Fair Value (in days) 1
Asset-Backed Securities $ 248,777,059 33Bank Notes 39,022,350 20Certificates of Deposit 50,978,475 81Commercial Paper 668,822,764 46Corporate Notes 125,470,454 49U.S. Agency Discount Notes 49,995,858 65Repurchase Agreements 1,245,923,000 3
Total Subject to Interest Rate Risk $ 2,428,989,960 23
Allocation from Oregon Short Term Fund 16,903,692 Total Securities Lending Invested Cash Collateral $ 2,445,893,6521 Weighted average days to maturity or next reset date.

Oregon Public Employees Retirement System
• 42 •
D. Derivatives
Oregon Investment Council policy allows, with some restrictions, for the use of derivative instruments in the prudent management of PERS’ investments. Certain internally and externally managed accounts are allowed, through contract and pol-icy, to invest in derivative instru-ments in order to carry out their investment management activities. Risks inherent with derivatives are managed through investment man-agement’s adherence to contractual and policy prescribed terms that are consistent with the funds’ investing objectives. All derivatives are con-sidered investments. The fair value of PERS’ derivative investments is reported in the Investment Sales and Other Receivables, Investment Purchases and Accrued Expenses, and the Public Equity lines of the Statement of Fiduciary Net Assets – Pension and Other Postemployment Plans on pages 20 and 21. Changes in fair value during the fiscal year are reported in the Net Appreciation (Depreciation) in Fair Value of Investments line of the Statement of Changes in Fiduciary Net Assets – Pension and Other Postemployment Plans on pages 22 and 23. The fair values reported in Tables 16 through 23 are not the same as amounts reported as investments in the finan-cial statements because derivatives with net loss positions have been reclassified as Investment Purchases and Accrued Expenses. The fair value of futures reported in Table 17 is $0.
TABLE 16Foreign Currency Exchange Contracts as of June 30, 2012
Description Delivery Dates Notional Value Fair Value
Foreign currency exchange contracts purchased:
Australian dollar 8/14/2012 - 9/19/2012 $ 122,559,609 $ 3,074,415
Brazilian real 7/3/2012 - 9/5/2012 38,941,721 551,640
Canadian dollar 8/14/2012 - 9/20/2012 153,540,964 1,363,966
Chinese yuan 7/20/2012 - 9/8/2015 13,431,388 (395,397)
Columbian peso 9/19/2012 21,231 (19)
Danish krone 9/19/2012 2,532,397 32,145
Euro 7/3/2012 - 9/19/2012 313,707,223 4,271,449
Hong Kong dollar 7/3/2012 - 9/19/2012 45,276,891 11,587
Israeli shekel 9/19/2012 6,983,404 (13,136)
Japanese yen 8/14/2012 - 9/19/2012 191,053,298 (1,729,702)
Malaysian ringgit 9/19/2012 176,352 (831)
Mexican peso 7/26/2012 - 9/19/2012 23,751,191 999,712
New Zealand dollar 8/14/2012 - 9/19/2012 96,616,581 2,285,397
Norwegian krone 7/27/2012 - 9/19/2012 202,268,957 1,381,314
Philippine peso 10/31/2012 1,283,513 38,203
Pound sterling 7/3/2012 - 9/24/2012 271,589,821 1,257,928
Singapore dollar 8/3/2012 - 9/19/2012 44,856,163 497,397
South Korean won 7/12/2012 - 9/28/2012 2,797,235 (4,233)
Swedish krona 8/14/2012 - 9/19/2012 222,561,122 4,825,380
Swiss franc 9/19/2012 33,349,111 519,076
Thai baht 9/19/2012 350,750 (2,933)
Total foreign currency exchange contracts purchased 1,787,648,922 18,963,358
Foreign currency exchange contracts sold:
Australian dollar 7/18/2012 - 3/20/2013 248,284,912 (4,189,267)
Brazilian real 7/3/2012 - 9/5/2012 59,085,092 (396,479)
Canadian dollar 7/18/2012 - 9/19/2012 107,820,466 (441,826)
Chinese yuan 7/20/2012 - 10/15/2012 1,981,065 29,530
Columbian peso 9/19/2012 1,284,624 (1,855)
Danish krone 9/19/2012 5,966,739 (160,775)
Euro 7/3/2012 - 3/29/2013 694,895,420 1,984,056
Hong Kong dollar 9/19/2012 37,196,110 (11,651)
Israeli shekel 9/19/2012 237,983 2,160
Japanese yen 7/18/2012 - 9/19/2012 329,763,497 3,382,080
Mexican peso 7/26/2012 - 9/20/2012 26,065,914 (147,430)
New Zealand dollar 8/14/2012 - 9/19/2012 76,504,477 (4,712,588)
Norwegian krone 8/14/2012 - 9/19/2012 83,225,680 (2,013,116)
Peruvian nouveau sol 9/19/2012 96,769 (252)
Pound sterling 7/3/2012 - 11/29/2013 237,685,754 (807,571)
Singapore dollar 9/19/2012 22,199,457 (320,805)
South Korean won 7/12/2012 - 9/19/2012 1,562,837 (15,023)
Swedish krona 8/14/2012 - 9/19/2012 27,828,451 (840,837)
Swiss franc 8/14/2012 - 12/19/2012 129,259,982 (928,011)
Turkish lira 7/20/2012 1,284,393 (1,247)
Total foreign currency exchange contracts sold 2,092,229,622 (9,590,907)
Total foreign currency exchange contracts subject to foreign currency risk $ 3,879,878,544 $ 9,372,451

Oregon Public Employees Retirement System
• 43 •
Currency Forwards
A forward foreign currency exchange contract is a for-ward contract that is a commitment to purchase or sell a foreign currency at a future date at a negotiated forward rate. Foreign currency forward contracts are privately nego-tiated contracts with customized terms and are transacted in over-the-counter markets. In the PERS portfolio, forward currency exchange contracts may be used to gain exposure or hedge against the effects of fluctuations in foreign cur-rency exchange rates. Risk associated with such contracts includes movement in the value of foreign currencies and the ability of the counterparty to perform. The change in fair value arising from the difference between the original contracts and the closing of such contracts is $26.6 million for the fiscal year ended June 30, 2012. Table 16 on page 42 presents currency forward balances at June 30, 2012.
Futures & Forwards
Futures and forward contracts represent commitments to buy or sell an underlying asset at a future date and at a specified price. Futures contracts have standardized terms and are exchanged-traded. Forward contracts are privately
negotiated contracts with customized terms and are transact-ed in over-the-counter markets. The counterparty credit risk for futures is generally less than privately negotiated for-ward contracts, since the clearinghouse, which is the issuer or counterparty to each exchange-trade future, daily settles the net change in the futures contract’s value in cash with the broker. In the PERS portfolio futures and forward con-tracts may be used to gain exposure to or hedge against the effects of fluctuations in interest rates, currency exchange rates, equity indexes, and other market conditions. PERS bears the market risk that arises from changes in the value of these instruments and the imperfect correlation between movements in the price of the futures and forward contracts and movements in the price of the securities hedged or used for cover. The change in fair value resulting from futures contract settlements totaled $84.6 million for the fiscal year ended June 30, 2012. The change in fair value resulting from forward contract settlements totaled $3.4 million for the fiscal year ended June 30, 2012. Table 17 on page 44 presents futures contracts balances, and Table 18 on page 45 presents forwards contracts balances at June 30, 2012.

Oregon Public Employees Retirement System
• 44 •
TABLE 17Futures Contracts as of June 30, 2012
Expiration Date Number of Contracts Notional Value
Fixed IncomeLong cash and cash equivalents:
90 Day Euro 3/18/2013 - 3/16/2015 375 $ 93,244,863 Total Long cash and cash equivalents 93,244,863
Short cash and cash equivalents:90 Day Euro 3/17/2014 361 (89,681,425)
Total Short cash and cash equivalents (89,681,425)
Long fixed income:30 year U.S. Treasury Bonds 9/19/2012 723 106,981,40610 year U.S. Treasury Notes 9/19/2012 907 120,971,1255 year U.S. Treasury Notes 9/28/2012 4,620 572,735,6252 year U.S. Treasury Notes 9/28/2012 2,158 475,164,625Ultra Long U.S. Treasury Bonds 9/19/2012 960 160,170,000UK Long Gilt Bond 9/26/2012 153 28,583,172
Total Long Fixed Income 1,464,605,953Short Fixed Income
30 year U.S. Treasury Bonds 9/19/2012 1,096 (162,173,750)10 year Australian Treasury Bonds 9/17/2012 247 (24,551,582)10 year U.S. Treasury Notes 9/19/2012 4,268 (569,244,500)2 year U.S. Treasury Notes 9/28/2012 311 (68,478,313)
Total Short Fixed Income (824,448,145)
Total Fixed Income 643,721,246
IndexesLong purchased indexes: AEX 7/20/2012 39 3,041,342 ASX SPI 200 9/20/2012 92 9,564,846
CAC 40 7/20/2012 1,755 71,091,675DAX 9/21/2012 174 35,393,837DJ Euro STOXX 50 9/21/2012 423 12,105,024FTSE 100 9/21/2012 1,184 102,564,604FTSE MIB 9/21/2012 101 9,161,881Hang Seng 7/30/2012 33 4,137,098IBEX 35 7/20/2012 315 27,926,188OMX 30 7/20/2012 630 9,389,669Russell 1000 Mini 9/21/2012 751 56,152,270Russell 2000 Mini 9/21/2012 1,831 145,637,740S&P 500 E Mini 9/21/2012 2,661 180,469,020S&P 500 9/20/2012 80 27,128,000S&P Midcap 400 E Mini 9/21/2012 95 8,925,250S&P TSE 60 9/20/2012 118 15,311,236SGX MSCI Singapore 7/30/2012 38 1,992,390Swiss Market 9/21/2012 507 32,455,499TOPIX 9/14/2012 515 49,634,665
Total Long purchased indexes 802,082,234Short purchased indexes:
AEX 7/20/2012 58 (4,523,021)ASX SPI 200 9/20/2012 615 (63,938,914)Hang Seng 7/30/2012 55 (6,895,164)S&P 500 E MINI 9/21/2012 772 (52,357,040)S&P TSE 60 9/20/2012 323 (41,911,266)
Total Short purchased indexes (169,625,405)
Total Indexes 632,456,829
Total Futures $ 1,276,178,075

Oregon Public Employees Retirement System
• 45 •
TABLE 18Forwards as of June 30, 2012
Expiration Date Notional Value Fair ValueAssets:
U.S. Treasury Notes 2/15/2022 $ 53,900,000 $ 55,636,722U.S. Treasury - Strips 1/15/2022 16,018,251 16,967,331
Total Forward Assets 69,918,251 72,604,053Liabilities:
U.S. Treasury - TIPS 1/15/2022 (67,500,045) (71,499,419) Total Forward Liabilities (67,500,045) (71,499,419)
Total Forwards $ 2,418,206 $ 1,104,634
TABLE 19Swaps as of June 30, 2012
Description PERS Receives PERS Pays Maturity date Notional
Value Fair Value Interest Rate Swaps - Pay Fixed Liability 3 Month LIBOR 0.99-4.28%
6/20/2016 - 4/19/2041 $ 200,230,000 $ (5,907,508)
Interest Rate Swaps - Receive Fixed Asset 0.54 - 10.58% See note1
1/2/2014 - 5/24/2042 135,580,000 3,956,754
Interest Rate Swaps - Receive Fixed Liability 0.54 % 3 Month LIBOR 6/26/2014 156,400,000 (33,341) Credit Default Swaps - Pay Fixed Assets
Credit Default Protection2 0.00 - 5.00%
9/20/2012 - 2/17/2052 357,257,576 23,726,923
Credit Default Swaps - Pay Fixed Liabilities
Credit Default Protection2 0.00 - 5.00%
9/20/2012 - 3/20/2019 91,605,000 (1,286,096)
Credit Default Swaps - Receive Fixed Assets 0.25 - 4.42%
Credit Default Protection2
9/20/2012 - 6/25/2036 21,965,810 720,690
Credit Default Swaps - Receive Fixed Liabilities 0.08 - 5.00%
Credit Default Protection2
9/20/2012 - 10/12/2052 294,645,863 (22,907,459)
Total Equity Return Swaps Equity Position 3 Month LIBOR 5/15/2012 120,878 9,913,987
Total Swaps $ 1,257,805,127 $ 8,183,950
1 PERS pays/receives counterparty based on 1-Month Mexican TIIE, 3-Month CDOR, 3-Month LIBOR, 12-Month Brazilian CETIP Interbank rate, 12-Month BRDCI.2 Represents the difference between the original price of the reference asset and the recovery amount if a credit default even event occurs.
Swaps
A swap is an agreement that obligates two parties to exchange a series of cash flows or the net value of cash flows at specified intervals based upon or calculated by reference to changes in specified prices or rates for a speci-fied amount of an underlying asset. The Fund may enter into various types of swaps including credit default, interest rate, and total return swaps. The Fund may use swaps to obtain efficient investment exposure or to hedge exposure to interest and currency rates and to movements in the debt and equity markets. The payment flows are usually netted against each other, with the difference being paid by one party or another. In addition, collateral may be pledged or received by the Fund in accordance with the terms of the respective swap agreements to provide value and recourse
to the Fund or its counterparties.
Credit default swaps represent agreements between par-ties to exchange a fixed rate premium by the buyer of pro-tection in exchange for a contingent payment by the seller of protection equal to the loss in value of an underlying debt instrument triggered by the occurrence of a defined credit event (such as bankruptcy, restructuring, failure to make payments when due, and repudiation/moratorium for sovereign underlying instruments). Under the terms of the swap, the protection seller acts as a “guarantor” receiving a periodic payment that is equal to a fixed percentage applied to a notional principal amount. In return the seller of pro-tection agrees to pay the notional amount of the underlying instrument, less its distressed value, if a credit event occurs during the term of the swap. Credit default swaps are pri-

Oregon Public Employees Retirement System
• 46 •
vately negotiated contracts with customized terms and are transacted in over-the-counter markets. In the PERS portfolio, credit default swap contracts may be used to gain exposure to or hedge against the effects of fluctuations in specific investments, bond markets, and other market con-ditions. Credit default swaps are subject to general market risk, liquidity risk, credit risk, and the risk that the counter-party fails to perform.
Interest rate swaps represent agreements between two parties to exchange cash flows or the net value of cash flows based on a notional amount and an underlying inter-est rate. Interest rate swaps are privately negotiated con-tracts with customized terms and are transacted in over-the-counter markets. The Fund may elect to pay a fixed rate and receive a floating rate, or, receive a fixed rate and pay a floating rate based on a notional amount and a refer-ence rate. In the PERS portfolio, interest rate swap con-tracts may be used to gain exposure to or hedge against the effects of fluctuations in interest rates, bond markets, and other market conditions. Risk associated with such con-tracts includes liquidity risk, interest rate risk, and the risk that the counterparty fails to perform.
Total return swaps are agreements to exchange the return generated by one instrument for the return generated by another instrument. Total return swaps are privately negoti-ated contracts with customized terms and are transacted in
over-the-counter markets. In the PERS portfolio, total return swap contracts may be used to gain exposure to or hedge against the effects of fluctuations in interest rates, bond markets, equity markets, and other market conditions. Total return swaps are subject to general market risk, liquidity risk, and the risk that the counterparty fails to perform.
The change in fair value from PERS’ swap contracts for the year ended June 30, 2012, was ($17.0) million. Table 19 on page 45 presents swaps balances at June 30, 2012. The counterparties’ credit ratings for swaps at June 30, 2012, are shown on Table 20 below.
Options
An option is an instrument that gives one party the right, but not the obligation, to buy or sell an underlying asset from or to another party at a fixed price over a specified period of time. A European option is an option that can only be exercised on the expiration date. A call option gives the pur-chaser the option to buy (and the seller the obligation to sell) the underlying investment at the contracted exercise price. A put option gives the purchaser the option to sell (and the writer the obligation to buy) the underlying investment at the contracted exercise price. Options can be exchange traded or private contracts between two or more parties. Exchange-traded options are cleared through and guaranteed by clear-ing houses. In the PERS portfolio option and European option contracts may be bought or sold to gain exposure to
TABLE 20Swaps at June 30, 2012
Counterparty Ratings1Credit Default
SwapsInterest Rate
Swaps
Total Return Swaps Total
Bank of America Merrill Lynch A-/A/Baa2 $ 448,721 $ - $ 9,913,987 $ 10,362,708Barclay’s Bank A+/A/A2 1,935,570 - - 1,935,570BNP PARIBAS S.A. AA-/A+/A2 (21,543) - - (21,543)Citibank A/A/A3 (72,269) - - (72,269) Citigroup Global Markets A-/A/Baa2 2,621,180 - - 2,621,180CME Group AA-/Aa3/NR 361,879 1,355,215 - 1,717,094Credit Suisse A+/A/A1 1,865,729 - - 1,865,729Deutsche Bank A+/A+/A2 (1,224,667) 34,845 - (1,189,822)Goldman Sachs A-/A/A3 (1,927,903) (3,399,723) - (5,327,626)HBSC Bank N/A (3,942) - - (3,942)JP Morgan Chase A/A+/A2 (720,950) (566,940) - (1,287,890)Morgan Stanley A-/A/Baa1 213,682 132,245 - 345,927Royal Bank of Scotland A/A/A3 64,174 - - 64,174Socíeté Générale A/A+/A2 33 - - 33UBS AG Stamford A/A/A2 (3,285,636) 460,263 - (2,825,373)
Total Swaps Subject to Credit Risk $ 254,058 $ (1,984,095) $ 9,913,987 $ 8,183,950
1 Standard & Poor’s/Fitch/Moody’s

Oregon Public Employees Retirement System
• 47 •
or hedge against the effects of fluctuations in interest rates, currency exchange rates, bond markets, equity markets, and other market conditions.
In writing an option, the Fund bears the market risk of an unfavorable change in the price of the underlying invest-ment of the written option. Exercise of an option written by the Fund could result in the Fund selling or buying an asset at a price different from the current market value. The risk associated with purchasing an option is that the Fund pays
a premium whether or not the option is exercised. Options and European options may be subject to interest rate risk, general market risk, liquidity risk, credit risk, foreign cur-rency risk, and, for non-exchange traded options, the risk of the counterparty’s ability to perform. The change in fair value from PERS’ options contracts for the year ended June 30, 2012, was $0.8 million. Table 21 below presents options balances at June 30, 2012.
TABLE 21Options as of June 30, 2012
Description Expiration Date Contracts Units Fair Value Fixed Income:
Calls Purchased
FVA USD 3M30Y S ATM 9/19/2012 - 12/10/2012 2,200,000 $ 2,200,000 $ 174,508 Total Calls Purchased 2,200,000 174,508
Written INF CAP USD CPURNSA 3/4/2015 1,800,000 (1,800,000) (6,541) IRO USD 2Y 1.0562 MYC 10/11/2012 30,600,000 (30,600,000) (291,710)
IRO USD 2Y 0.915 MYC 11/14/2012 8,800,000 (8,800,000) (59,636) IRO USD 5Y 1.4 C BRC 3/18/2013 25,000,000 (25,000,000) (393,533) IRO USD 5Y C 1.7000 3/18/2013 14,900,000 (14,900,000) (409,647) IRO USD 5Y C 1.7 CBK 3/18/2013 3,300,000 (3,300,000) (90,727) Total Calls Written (84,400,000) (1,251,794)
Puts Written INF Floor USD CPURNS 3/14/2015 1,800,000 (1,800,000) (5,966) INF Floor USD CPURNSA 10/13/2020 800,000 (800,000) (2,115) IRO USD 2Y 1.0562 MYC 10/11/2012 30,600,000 (30,600,000) (3,562) IRO USD 2Y 0.915 MYC 11/14/2012 8,800,000 (8,800,000) (3,249) IRO USD 5Y 1.4 P BRC 3/18/2013 25,000,000 (25,000,000) (155,955) IRO USD 5Y P 1.7000 3/18/2013 14,900,000 (14,900,000) (50,849) IRO USD 5Y P 1.7 CBK 3/18/2013 3,300,000 (3,300,000) (11,262) Total Puts Written (85,200,000) (232,958)
Total Fixed Income (167,400,000) (1,310,244)
Option Futures: Calls
Written10 Year Treasury Note 8/24/2012 294 (294,000) (156,188)
Total Calls Written (294,000) (156,188) Puts Purchased 10 Year Treasury Note 7/27/2012 451 451,000 49,328 2 Year Euro Midcurve 9/14/2012 - 12/14/2012 1,252 3,130,000 112,550 3 Year Euro Midcurve 12/14/2012 1,448 3,620,000 185,525
Total Puts Purchased 7,201,000 347,403 Written 10 Year Treasury Note 7/27/2012 - 8/24/2012 446 (446,000) (81,656) 2 Year Euro Midcurve 9/14/2012 - 12/14/2012 1,252 (3,130,000) (42,206) 3 Year Euro Midcurve 12/14/2012 1,448 (3,620,000) (135,750) Total Puts Written (7,196,000) (259,612)
Total Option Future Puts 5,000 87,791Total Option Futures $ (289,000) $ (68,397)

Oregon Public Employees Retirement System
• 48 •
TABLE 22Swaptions as of June 30, 2012
Description Expiration Date Contracts Units Fair Value Calls
Purchased 10 Year RTR 12/17/2012 - 4/5/2013 110,700 $ 110,700,000 $ 5,124,229 Total Calls Purchased 110,700,000 5,124,229 Written 5 Year RTR 5/8/2014 - 3/20/2017 103,500 (103,500,000) (3,756,471) 30 Year RTR 12/17/2012 21,100 (21,100,000) (974,430) Total Calls Written (124,600,000) (4,730,901)
Total Calls (13,900,000) 393,328
PutsPurchased
30 Year RTP 5/2/2012 - 11/11/2013 76,600,000 76,600,000 339,64330 Year RTP 9/16/2013 17,000,000 17,000,000 72,54010 Year RTP 4/5/2013 - 3/16/2017 115,900,000 115,900,000 1,415,159Pound sterling 12/15/2015 2,800,000 2,800,000 193,112 IRO Pound sterling 12/15/2015 6,300,000 6,300,000 434,502
Payer 0.92 9/19/2012 - 9/20/2012 4,920,000 4,920,000 69,685 Payer 0.93 7/18/2012 - 9/19/2012 31,860,000 31,860,000 89,437
Total Puts Purchased 255,380,000 2,614,078Written
10 Year RTP 3/16/2017 54,000,000 (54,000,000) (703,516) IRO Euro 7/1/2014 2,500,000 (2,500,000) (201) Swaption 317U153B3 7/10/2012 3,800,000 (3,800,000) - 5 Year RTP 5/8/2014 -3/20/2017 103,500,000 (103,500,000) (1,625,028)
Payer 0.87 9/19/2012 4,920,000 (4,920,000) (26,327) Payer 0.88 7/18/2012 -9/19/2012 31,860,000 (31,860,000) (10,409)
Total Puts Written (200,580,000) (2,365,481)
Total Puts 54,800,000 248,597
Total Swaptions $ 40,900,000 $ 641,925
Swaption
A swaption is an option to enter into an interest rate swap at an agreed upon fixed rate until or at some future date. Swaption contracts entered into by the Fund typically represent an option that gives the purchaser the right, but not the obligation, to enter into a swap contract on a future date. If a call swaption is exercised, the purchaser will enter into a swap contract to receive the fixed rate and pay a floating rate in exchange. Exercising a put swaption would entitle the purchaser to pay a fixed rate and receive a float-ing rate. Swaptions are privately negotiated contracts with customized terms and are transacted in over-the-counter markets. In the PERS portfolio, swaption contracts may be bought or sold to gain exposure to or hedge against the effects of fluctuations in interest rates, bond markets and other market conditions.
In writing a swaption, the Fund bears the market risk of an unfavorable change in the price of the underlying investment of the written swaption. Exercise of a swap-tion written by the Fund could result in the Fund selling or buying an asset at a price different from the current market value. The risk associated with purchasing a swap-tion is that the Fund pays a premium whether or not the option to enter a swap is exercised. Swaptions may be subject to interest rate risk, liquidity risk, and the risk of the counterparty’s ability to perform. The change in fair value from PERS’ swaptions contracts for the year ended June 30, 2012, was ($1.7) million. Table 22 on page 48 presents swaptions balances at June 30, 2012.

Oregon Public Employees Retirement System
• 49 •
TABLE 23Rights and Warrants as of June 30, 2012
Related Number of Shares
Fair ValueExpiration Date
Rights 7/10/2012 - 7/20/2012 158,491 $ 75,915Warrants 10/31/2012 - 1/19/2021 1,352,725 6,951,643
Total Rights and Warrants 1,511,216 $ 7,027,558
PERS Building Debt Service Requirements to Maturity
FiscalYear
Series “B” Total Principal Interest
2013 $ 535,000 $ 115,300 $ 650,300
2014 545,000 104,600 649,600
2015 565,000 88,250 653,250
2016 585,000 60,000 645,000
2017 615,000 30,750 645,750
Total $ 2,845,000 $ 398,900 $ 3,243,900
TABLE 24
Rights and Warrants
Rights are the right, but not the obligation, to purchase newly issued equity shares, often in proportion to the num-ber of shares currently owned, in a specified company, at a pre-established price on or within a pre-determined date. Rights are privately transacted in over-the-counter markets. In the PERS portfolio, rights are often obtained and held due to existing investments. Rights are subject to general market risk and liquidity risk.
A warrant provides the holder the right, but not the obli-gation, to purchase securities from the issuing entity at a specific price and within a certain time period. Warrants are privately transacted in over-the-counter markets. In the PERS portfolio, warrants are often obtained and held due to existing investments. Warrants are subject to general market risk and liquidity risk. The change in fair value from PERS’ rights and warrants for the year ended June 30, 2012, was ($3.8) million. The fair value of PERS’ rights and warrants at June 30, 2012, are shown in Table 23 on page 48.
Note 7 - Long-Term DebtIn 1997 PERS completed construction on its retirement
system headquarters building in Tigard, Oregon. The con-struction was financed by the sale of certificates of partici-pation (COP), Series A. In March 2002, a new COP, Series B, was issued and used to finance the original Series A COP. In April 2012, an XI-Q general obligation bond, 2012 Series K, was issued to refund the 2002 Series B COP. The Series K bond amount oustanding at June 30, 2012, is
$2,845,000 and has a final repayment due May 1, 2017.
Table 24 on page 48 summarizes all future PERS build-ing bond payments of principal and interest for each fiscal year during the next five-year period ending June 30, 2017. The current portion of the PERS building debt is $535,000.
Table 25 on page 49 summarizes the changes in long-term debt for the year ended June 30, 2012.
TABLE 25Long-Term Debt Activity
Balance July 1, 2011 Additions Deductions
Balance June 30, 2012
Amounts Due Within One Year
PERS Building Principal $ 3,580,000 $ 2,845,000 $ (3,580,000) $ 2,845,000 $ 535,000Plus: Premium (Net) 147,487 318,715 (163,451) 303,751 62,780
Less: Deferred Gain (Net) (113,119) (80,326) 116,890 (76,555) (15,822) Total COPs/ Bonds Payable
$
3,615,368 $ 3,083,389 $
(3,626,561) $ 3,072,196 $ 581,958

Oregon Public Employees Retirement System
• 50 •
Note 8 - LitigationFollowing is a summary of current PERS-related lawsuits:
A. White, et al. v. Public Employees Retirement Board (PERB)
These consolidated cases challenge the settlement of the City of Eugene case, the reallocation of 1999 earnings, the adoption of new rate orders for employers, and the alloca-tion of 2003 earnings. Various local PERS employers inter-vened and also began a separate action in Marion County Circuit Court (Canby, see below).
On June 11, 2009, Circuit Court Judge Kantor issued a decision granting summary judgment to PERB and the local PERS employer intervenors. The Court entered judg-ment for PERB July 9, 2009, and petitioners filed a notice of appeal July 13, 2009.
This case has been briefed and, on May 3, 2011, was argued in the Oregon Supreme Court. On October 21, 2011, the Court requested supplemental briefing. Supplemental memoranda were due from all parties November 21, 2011, and reply memoranda were due December 5, 2011. On December 30, 2011, the Court issued its decision, affirm-ing the trial court’s judgment in favor of PERS on all issues except the transfer of $61 million from the Contingency Reserve to the prevailing employers’ reserves. That issue was remanded back to the Circuit Court to address questions of fact regarding whether the amount of the transfer was proper. Judge Kantor will set a trial date, probably in March 2013.
B. Canby Utility Board, et al. v. State of Oregon, PERB
Public employers filed a lawsuit against PERB June 14, 2004, claiming that when PERB reallocated the 1999 earn-ings in response to Judge Lipscomb’s finding on the retro-active participation in the variable account by employers, public employers did not get an appropriate allocation. This case is stayed until the White case (see above) is resolved. Legal counsel is unable to provide an opinion as to the out-come.
C. Consolidated 2003 Rate Order Cases (Baker County Library District v. State of Oregon, Adrian School District No. 61 v. State of Oregon, City of Albany v. State of Oregon, Baker County v. State of Oregon, League of Oregon Cities v. State of Oregon, and Canby Utility Board v. State of Oregon)
Public employers challenged PERB’s employer rate orders issued in 2003. The petitions for review were con-solidated December 9, 2003. This case, along with Canby (see above) is stayed until the White case is resolved. Legal counsel is unable to provide an opinion as to the outcome.
D. Murray v. State of Oregon, PERB
On May 12, 2010, the Court of Appeals issued a deci-sion in Murray v. PERB, holding that expenses attributable to the Variable Annuity Account cannot be paid from that account in years when the earnings in that account are not sufficient to cover those expenses. As a result of the deci-sion, PERB issued a Final Order on Remand on March
3, 2011, directing staff to recalculate the balance in Mr. Murray’s Variable Annuity Account in accordance with the reallocation of administrative expenses to his Variable Account for 2001 and 2002. On April 27, 2011, counsel for Mr. Murray requested reconsideration of PERS’ Final Order on Remand, contending that the original appeal was not only on Mr. Murray’s behalf, but also for all of the participants in the variable account who were adversely impacted by the Board’s original decision. Counsel’s petition was consid-ered at the Board’s May 26, 2011, meeting and, on June 9, 2011, PERS issued an Order on Reconsideration denying the petition. On August 4, 2011, Mr. Murray filed a petition for judicial review of that Order on Reconsideration. Mr. Murray’s attorney filed the opening brief on May 30, 2012. PERS’ respondent’s brief was due September 5, 2012, was extended until November 7, 2012, and is now due on January 2, 2013. Legal counsel is unable to provide an opinion as to the outcome.
E. Re v. PERS
On May 13, 2011, Daniel Re filed a Petition for Judicial Review in the Court of Appeals seeking judicial review of three Oregon Administrative Rules (OARs) related to PERS. Petitioner’s attorney indicated in a letter accompanying the petition that the intent of the action is to “…challenge the resort to the rule of necessity when judges have an interest in the outcome of an action.” To this end, on July 8, 2011, petitioner filed a Motion to Disqualify Judges Interested in the Outcome and for Appointment of Judges not Interested in the Outcome. The court denied petitioner’s motion and, on September 16, 2011, petitioner filed for a writ of mandamus for the recusal of judges with the Oregon Supreme Court. On October 24, 2011, PERS received notice that the Oregon Supreme Court denied petitioner’s request. The opening brief in the appellate court was due September 13, 2011, but was not filed until December 1, 2011. PERS respondent brief was timely filed on January 19, 2012 and a reply brief was filed February 13, 2012. Oral arguments were held on August 23, 2012. PERS filed a Supplemental Memorandum on September 6, 2012. Legal counsel is unable to provide an opinion as to the outcome.
F. Sundermier v. PERS
Paul Sundermier requested judicial review of his Notice of Dispute in Marion County Circuit Court. In addition to judi-cial review, Mr. Sundermier included civil complaints for breach of contract, breach of fiduciary duty, money had and received, violations of constitutional rights under 42 USC §1983, and unconstitutional takings. All of his complaints center around four issues: 1) calculation of his tax remedy increase; 2) purchase of waiting and military time; 3) male and female blended actuarial factors; and 4) alleged inten-tional delay in paying his benefits. Legal counsel is unable to provide an opinion as to the outcome.
G. Forest v. Wheeler, et al.
Michael Forest and Davis Dyer, active members of PERS, filed a Complaint in Multnomah County claiming breach of fiduciary duty, securities fraud, aiding and abetting securi-

Oregon Public Employees Retirement System
• 51 •
TABLE 26Changes in the Aggregated Estimated Claims Liabilities of SRHIA for the Year Ended June 30
2012 2011
Total Estimated Claims atBeginning of Fiscal Year $ 23,492,372 $ 21,362,157
Insured Claims and Claim Adjustment ExpensesProvision for Insured Events
of Current Fiscal Year 163,099,600 163,104,506
Decrease in Provision forInsured Events of Prior Years (12,480,317) (10,551,825)
Total Incurred Claims andClaim Adjustment Expenses 150,619,283 152,552,681
PaymentsClaims and Claim Adjustment Expenses
Attributable to Insured Events ofCurrent Fiscal Year 149,140,600 139,612,134
Claims and Claim Adjustment ExpensesAttributable to Insured Events of
Prior Fiscal Year 11,012,055 10,810,332
Total Payments 160,152,655 150,422,466
Total Estimated Claims atEnd of Fiscal Year $ 13,959,000 $ 23,492,372
ties fraud, breach of contract, and a Petition for Declaratory Judgment for breach of trust. The Complaint names numer-ous defendants, including the Oregon State Treasurer, indi-vidual members of the PERS Board (both past and present), PERS’ Executive Director, and the Oregon Investment Council, among others, and seeks $1 billion in damages. Legal counsel is unable to provide an opinion as to the out-come.
Note 9 - Standard Retiree Health Insurance Account - Basis for Estimated Liabilities
The Standard Retiree Health Insurance Account (SRHIA) establishes claim liabilities based on estimates of the ultimate costs of claims (including future claim adjust-ment expenses) that have been reported but not settled
and of claims that have been “incurred but not reported” (IBNR). The estimated claims liability was calculated by Milliman, PERS’ actuary, at June 30, 2012, using a vari-ety of actuarial and statistical techniques and adjusted for actual experience to produce current estimates that reflect recent settlements, claim frequency, and other economic and social factors. Adjustments to claims liabilities are charged or credited to expense in the periods in which they are made. The estimated claims liability of $14.0 mil-lion is carried at its face amount, and no interest discount is assumed. The IBNR portion represents an estimate for claims that have been incurred prior to June 30, 2012, but have not been reported to the SRHIA. Table 26 on page 51 shows the changes in the aggregated estimated claims liabilities as of June 30, 2012.

Oregon Public Employees Retirement System
• 52 •
Note 10 - Violation of Legal ProvisionPERS is in violation of ORS 238.660 which requires
that all moneys paid to PERS “shall be deposited with the State Treasurer.” Monthly premiums paid by PERS Health Insurance Program participants as well as Early Retiree Reinsurance Program funds have been transferred to insur-ance carriers for payment of claims. Amounts transferred exceed claims by approximately $75.0 million at June 30, 2012. PERS is determining the most effective method of redirecting these moneys to the State Treasurer.
Note 11 - Subsequent EventIn June 2012, GASB approved Statement No. 67,
Financial Reporting for Pension Plans, and Statement No. 68, Accounting and Financial Reporting for Pensions. Statement No. 67 addresses reporting by pension plans that administer benefits for governments, and is effective for financial statements for periods beginning after June 15, 2013. Statement No. 68, which primarily relates to reporting by governments that provide pensions to their employees, is effective for fiscal years beginning after June 15, 2014. These standards were subsequently published in August 2012.
Key changes include:
• Incorporating ad hoc cost-of-living adjustments and other ad hoc postemployment benefit changes into projec-tions of benefit payments, if an employer’s past practice and future expectations of granting them indicate they are essentially automatic.
• Using a discount rate that applies (a) the expected long-term rate of return on pension plan investments for which plan assets are expected to be available to make projected benefit payments, and (b) the interest rate on a tax-exempt 20-year AA- or higher rated municipal bond index to projected benefit payments for which plan assets are not expected to be available for long-term investment in a qualified trust.
• Adopting a single actuarial cost allocation method – entry age normal – rather than the current choice among six actuarial cost methods.
• Requiring more extensive note disclosures and required supplementary information.
The System will be subject to the provisions of Statement No. 67 beginning with the fiscal year end-ing June 30, 2014. GASB Statement No. 67 replaces the requirements of GASB Statement No. 25, Financial Reporting for Defined Benefit Pension Plans and Note Disclosures for Defined Contribution Plans, and GASB Statement No. 50, Pension Disclosures, as they relate to pension plans that are administered through trusts or similar arrangements meeting certain criteria. GASB Statement No. 67 builds upon the existing framework for financial reports of defined benefit pension plans and enhances note disclosures and required supplementary information for both defined benefit and defined contribution pension plans. In addition, it requires the presentation of new infor-mation about annual money-weighted rates of return in the notes to the financial statements and in 10-year required supplementary information schedules.

Oregon Public Employees Retirement System
• 53 •
Required Supplementary Information Schedules of Funding Progress (dollar amounts in millions)11
ActuarialValuation
Date
ActuarialValue of Assets
(a)
Actuarial Accrued
Liability (AAL)(b)
Unfunded (Overfunded)AAL (UAAL)
(b-a)
Funded Ratio(a/b)
Covered Payroll2
(c)
UAAL as a % of Covered
Payroll((b-a)/c)
Defined Benefit Pensions –Tier One/Tier Two and OPSRP1
12/31/20023 $ 35,446.9 $ 38,947.0 $ 3,500.1 91.0% $ 6,383.5 54.8%12/31/20033 42,753.3 44,078.1 1,324.8 97.0 6,248.5 21.212/31/20044,5 45,581.1 47,398.6 1,817.5 96.2 6,772.46 26.812/31/20056,7 51,382.6 49,294.0 (2,088.6) 104.2 6,791.9 (30.8)12/31/2006 56,616.5 51,252.9 (5,363.5) 110.5 7,326.8 (73.2)12/31/20078 59,327.8 52,871.2 (6,456.7) 112.2 7,721.8 (83.6)12/31/2008 43,520.6 54,259.5 10,738.9 80.2 8,130.1 132.1
12/31/20099 48,729.2 56,810.6 8,081.4 85.8 8,512.2 94.9
12/31/2010 51,583.6 59,329.5 7,746.0 86.9 8,750.1 88.5
12/31/201110 50,168.2 61,198.4 11,030.2 82.0 8,550.5 129.0Postemployment Healthcare Benefits – Retirement Health Insurance Account12/31/20023 $ 87.4 $ 542.3 $ 454.9 16.1% $ 6,383.5 7.1%12/31/20033 117.1 522.5 405.4 22.4 6,248.5 6.512/31/20045 148.0 556.9 408.9 26.6 6,772.46 6.012/31/2005 181.0 495.9 314.9 36.5 6,791.9 4.612/31/2006 221.3 511.8 290.5 43.2 7,326.8 4.012/31/2007 250.8 499.6 248.8 50.2 7,721.8 3.212/31/2008 183.8 494.0 310.2 37.2 8,130.1 3.812/31/2009 214.1 511.2 297.1 41.9 8,512.2 3.512/31/2010 232.3 547.1 314.8 42.5 8,750.1 3.612/31/2011 239.6 461.1 221.5 52.0 8,550.5 2.6Postemployment Healthcare Benefits – Retiree Health Insurance Premium Account12/31/20023 $ 2.9 $ 30.1 $ 27.2 9.6% $ 1,741.9 1.6%12/31/20033 4.0 25.0 21.0 16.0 1,711.9 1.212/31/20045 5.2 28.2 23.0 18.4 1,851.46 1.212/31/2005 6.1 27.0 20.9 22.7 1,827.0 1.112/31/2006 7.0 23.4 16.4 30.0 1,946.8 0.812/31/2007 7.8 23.3 15.5 33.6 2,080.2 0.712/31/2008 5.7 21.3 15.6 26.7 2,217.9 0.712/31/2009 6.4 24.5 18.2 25.9 2,371.8 0.812/31/2010 5.7 33.9 28.2 16.8 2,379.7 1.212/31/2011 4.5 34.4 29.9 13.2 2,376.9 1.31 Includes UAAL for Multnomah Fire District ($162 million as of December 31, 2011); assets in the December 2011 amount excludes $535.3 million of
Contingency Reserve assets. 2 Annual Active Member Payroll excludes the member pick-up, if any. 3 Figures through December 31, 2003, do not reflect the impact of PERS Reform Legislation enacted in 2003. 4 Effective with the 2004 valuation, the Oregon Supreme Court rulings in Strunk v. PERB, et al. (issued March 8, 2005) and City of Eugene v. State of Oregon,
PERB, et al. (issued August 11, 2005) are reflected. 5 Effective with the 2004 valuation, the cost method was changed from Entry Age Normal to Projected Unit Credit, and the actuarial value of assets was
changed from a four-year smoothed value to market value. 6 Assets and liabilities for OPSRP are first valued in the 2005 valuation. OPSRP payroll, however, was included in the amortization of the UAAL beginning
with the 2004 valuation. 7 Reflects the transfer in assets and liabilities for new employers that joined the SLGRP effective January 1, 2006. 8 Reflects the transfer in assets and liabilities for new employers that joined the SLGRP effective January 1, 2008. 9 Reflects the transfer in assets and liabilities for new employers that joined the SLGRP effective January 1, 2010.10 Reflects the transfer in assets and liabilities for new employers that joined the SLGRP effective January 1, 2012.11 Discrepancies contained in this table are the result of rounding differences.

Oregon Public Employees Retirement System
• 54 •
Required Supplementary Information Schedules of Employer Contributions (dollar amounts in millions)
Actuarial Valuation Date
Annual Required
Contribution 1, 2, 3Percentage
Contributed 2, 7
Defined Benefit Pension Plan12/31/2011 $ 779.1 83%4
12/31/2010 472.4 1004
12/31/2009 630.8 1004
12/31/2008 707.4 1004
12/31/2007 805.7 74 12/31/2006 938.6 63
Postemployment Healthcare Plan - Retirement Health Insurance Account5
12/31/2011 $ 37.0 88%12/31/2010 26.5 8312/31/2009 29.8 8712/31/2008 33.0 8512/31/2007 38.8 91 12/31/2006 44.3 89
Postemployment Healthcare Plan - Retiree Health Insurance Premium Account6
12/31/2011 $ 2.8 83%12/31/2010 2.3 6412/31/2009 2.6 6812/31/2008 2.9 6312/31/2007 2.7 79 12/31/2006 2.5 90
1 The Annual Required Contribution (ARC) prior to July 1, 2007, is based on the July 1, 2005 rates developed in the December 31, 2003 Milliman valuation prior to the adjustment to phase-in the rate increase and adjusted for supplemental payments since December 31, 2003. For most employers, the actual amount contributed from July 1, 2005, to June 30, 2007, was based on the phased-in rates.
2 The ARC shown for December 31. 2010, and prior years is an estimated amount based on system-wide contribution rates in effect for the year in question and system payroll as reported by PERS. For example, the 2010 pension benefits ARC is based on rates developed in the December 31, 2007 actuarial valuation and 2010 payroll as reported by PERS.
3 The ARC shown beginning in December 31, 2011, is based on contribution rates in effect for individual employers for the year in question, system payroll as reported by PERS, and contribution rates for individual employers that would have been effective in the absence of the contribution rate stabilization method (rate collar).
4 For biennia beginning in July 2007, system employers are generally required to contribute 100 percent of the ARC for Tier One/Tier Two and OPSRP as a percent of pay. The actual dollar amount contributed in a given calendar year can vary from the estimated ARC based on factors such as month-to-month variations in payroll and timing of contributions. During the July 2011-June 2013 biennium, the percentage of ARC contributed will be less than 100 percent due to the application of contributions rate stabilization method (rate collar).
5 The Retirement Health Insurance Account provides postemployment healthcare benefits for eligible members for all participating employers. 6 The Retiree Health Insurance Premium Account provides postemployment healthcare benefits only for eligible members who retired from state of Oregon employers.7 Percentages were changed to whole numbers in 2009. Prior amounts are restated.

Oregon Public Employees Retirement System
• 55 •
Required Supplementary InformationSchedule of Claims Development InformationStandard Retiree Health Insurance AccountFiscal and Policy Year Ended (In Millions of Dollars)
2011
2012
1. Net earned required contributions and investment revenues
$
174.19
$
188.99
2. Unallocated expenses 20.01 22.15
3. Estimated incurred claims and expense, end of policy year 152.55 150.624. Paid (cumulative) as of:
End of policy year One year later Two years later Three years later Four years later Five years later Six years later Seven years later Eight years later Nine years later
150.42161.43
160.15
5. Reestimated incurred claims and expense: End of policy year One year later Two years later Three years later Four years later Five years later Six years later Seven years later Eight years later Nine years later
152.55163.56
150.62
6. Increase (decrease) in estimated incurred claims and expense from end of policy year 11.01

Oregon Public Employees Retirement System
• 56 •
Oregon Public Service
Retirement PlanRegular Account
Pension Program
Variable Account Total
Assets:Cash and Cash Equivalents $ 1,590,784,370 $ 49,943,767 $ 8,564,978 $ 1,649,293,115
Receivables: Employer 22,917,170 4,756,114 — 27,673,284 Interest and Dividends 303,341,324 5,703,252 — 309,044,576 Investment Sales and Other Receivables 1,188,893,848 20,228,305 — 1,209,122,153
Total Receivables 1,515,152,342 30,687,671 — 1,545,840,013
Interaccount Receivables and Payables 1,930,174 1,844,778 (3,774,952) —Due from Other Funds 1,673,822 — — 1,673,822Investments: Debt Securities 12,983,120,052 244,101,281 — 13,227,221,333 Public Equity 17,477,424,991 328,600,660 755,730,716 18,561,756,367 Real Estate 6,101,604,610 114,718,919 — 6,216,323,529 Private Equity 13,126,364,227 246,794,477 — 13,373,158,704 Alternative Equity 370,262,495 6,961,466 — 377,223,961 Opportunity Portfolio 842,850,949 15,846,807 — 858,697,756
Total Investments 50,901,627,324 957,023,610 755,730,716 52,614,381,650
Securities Lending Collateral 2,204,950,930 41,996,684 297,464 2,247,245,078Prepaid Expenses and Deferred Charges 6,876,736 108,808 — 6,985,544Capital Assets at Cost, Net 36,524,300 3,057,959 — 39,582,259 Total Assets 56,259,519,998 1,084,663,277 760,818,206 58,105,001,481
Liabilities: Investment Purchases and Accrued Expenses 2,034,100,245 38,056,187 120,111 2,072,276,543 Deposits and Other Liabilities 102,417,320 72,481 15,706 102,505,507 Due to Other Funds 6,297,579 — — 6,297,579 Bonds/COPs Payable 3,072,196 — — 3,072,196 Deferred Revenue 299,322 — — 299,322 Securities Lending Cash Collateral Due Borrowers 2,218,576,437 42,252,863 297,464 2,261,126,764
Total Liabilities 4,364,763,099 80,381,531 433,281 4,445,577,911
Net Assets Held in Trust for Pension Benefits $ 51,894,756,899 $ 1,004,281,746 $ 760,384,925 $ 53,659,423,570
Other Supplementary Information Schedule of Plan Net Assets Defined Benefit Pension Plan As of June 30, 2012

Oregon Public Employees Retirement System
• 57 •
Oregon Public Service
Retirement Plan
Regular Account
Pension Program
Variable Account Total
Additions:Contributions: Employer $ 632,563,375 $ 197,560,030 $ — $ 830,123,405 Plan Member 16,364,277 — 170,373 16,534,650
Total Contributions 648,927,652 197,560,030 170,373 846,658,055
Investment Income:
Net Depreciation in Fair Value of Investments (720,420,926) (3,235,478) (62,995,846) (786,652,250) Interest, Dividends, and Other Investment Income 1,415,357,244 33,408,212 109,277 1,448,874,733
Total Investment Income 694,936,318 30,172,734 (62,886,569) 662,222,483
Less Investment Expense 294,984,352 7,038,409 667,908 302,690,669 Net Investment Income 399,951,966 23,134,325 (63,554,477) 359,531,814 Securities Lending Income: Securities Lending Income 24,180,045 340,387 3,574 24,524,006 Less Securities Lending Expense (5,469,756) (97,678) (3,574) (5,571,008) Net Securities Lending Expense 18,710,289 242,709 — 18,952,998
Other Income 728,442 5,531 1,530,970 2,264,943 Total Additions 1,068,318,349 220,942,595 (61,853,134) 1,227,407,810
Deductions: Benefits 3,252,835,597 5,111,981 33,844,072 3,291,791,650 Death Benefits 3,918,168 — — 3,918,168 Refunds of Contributions 33,215,426 — 805,024 34,020,450 Administrative Expense 24,384,455 7,681,744 1,036,468 33,102,667 Interaccount Transfers (81,657,362) — 81,657,362 — Total Deductions 3,232,696,284 12,793,725 117,342,926 3,362,832,935
Net Increase (Decrease) (2,164,377,935) 208,148,870 (179,196,060) (2,135,425,125)
Net Assets Held in Trust for Pension Benefits Beginning of Year 54,059,134,834 796,132,876 939,580,985 55,794,848,695 End of Year $ 51,894,756,899 $ 1,004,281,746 $ 760,384,925 $ 53,659,423,570
Other Supplementary Information Schedule of Changes in Plan Net Assets Defined Benefit Pension Plan For the Year Ended June 30, 2012

Oregon Public Employees Retirement System
• 58 •
Other Supplementary Information Schedule of Administrative Expenses - All Funds For the Year Ended June 30, 2012Personal Services: Staff Salaries $ 17,412,385 Social Security 1,304,733 Retirement 3,504,042 Insurance 4,936,249 Assessments 119,479 Total Personal Services 27,276,888Professional Services: Actuarial 526,636 Data Processing 16,973 Audit 279,441 Legal Counsel 531,303 Medical Consultants 140,340 Training and Recruitment 122,209 Contract Services 5,205,671 Healthcare Fees 22,886,344 Total Professional Services 29,708,917Communications: Printing 159,012 Telephone 358,553 Postage 564,968 Travel 153,964 Total Communications 1,236,497Rentals: Office Space 525,078 Equipment 108,260 Total Rentals 633,338Miscellaneous: Central Government Charges 678,199 Supplies 932,505 Maintenance 1,379,229 Non-Capitalized Equipment 163,296 Depreciation 2,321,512 COP and Bond Amortization 78,387 Total Miscellaneous 5,553,128Total Administrative Expenses $ 64,408,768
Other Supplementary Information Schedule of Payments to Consultants and Contractors For the Year Ended June 30, 2012
Individual or Firm Commission/Fees Nature of ServiceMercer Human Resources Consulting LLC $ 367,717 ActuarialMilliman, Inc. 158,919 ActuarialOregon Audits Division 6,709 AuditMacias Gini & O’Connell LLP 272,732 AuditCEM Benchmarking Inc. 35,000 BenchmarkingBenefitHelp Solutions 3,248,762 Health InsuranceThe ODS Companies 19,623,846 Health InsuranceButler Partners & Associates LLC 78,090 Health InsuranceING 2,207,786 IAP AdministrationOrrick, Herrington & Sutcliffe LLP 56,297 LegalIce Miller LLP 6,880 LegalOregon Department of Justice 390,249 Legal Harrang Long Gary Rudnick PC 24,910 LegalTrucker Huss 16,096 LegalRonald N Turco, MD 10,035 MedicalFrederick William Miller, MD 62,250 MedicalMass Ingenuity 119,565 Strategig and Organizational PlanningMMC Systems Inc 340,532 TechnologyHP Enterprise Services 2,182,017 TechnologyProvaliant, Inc. 102,300 TechnologynextSource Inc. 57,397 TechnologyU Work Com Inc 100,150 TechnologyTriTek Solutions Inc. 36,368 TechnologyInfo Risk 4,700 TechnologyOregon Department of Administrative Services 35,548 Technology

Oregon Public Employees Retirement System
• 59 •
2012International Equity Fund Managers Acadian Asset Management, Inc. $ 2,442,878 AllianceBernstein International 3,286,588 AQR Capital Management 3,271,771 Arrowstreet Capital, LP 5,936,248 Brandes Investment Partners LLC 2,530,525 Dimensional Fund Advisors 1,192,017 Genesis Investment Management, Ltd. 3,384,473 Harris Associates 1,819,904 Pyramis Global Investors 5,535,372 TT International Co., Ltd. 1,842,066 UBS Global Asset Management Americas 1,132,107 Victory Capital Management 1,389,635 Walter Scott & Partners Limited 2,344,053 Other International Equity Fund Managers 5,150,196Domestic Equity Fund Managers AQR Capital Management 1,214,258 Aronson+Johnson+Oritz 1,591,931 The Boston Company Asset Management, LLC 1,419,052 Delaware Capital Management 1,903,074 MFS Institutional Advisors, Inc. 2,241,289 Next Century Growth Investors 1,890,489 Northern Trust Company 1,183,476 PIMCO 1,619,264 Pyramis Global Advisors 1,006,948 Wanger Asset Management, LP 2,502,285 Wellington Management Company, LLP 2,079,250 Wells Capital Management 1,749,958 Other Domestic Equity Fund Managers 3,710,790Debt Securities Managers Alliance Capital Management 2,729,411 BlackRock Asset Management 3,100,638 KKR Financial Credit Portfolio 10,799,776 Oak Hill Advisors 4,694,508 Wellington Management Company, LLP 3,115,842 Western Asset Management Company 1,974,752 Other Debt Securities Managers 18,632Alternative Equity Managers 4,828,781Opportunity Portfolio Managers 2,448,181Custodian State Street Bank 131,517Private Equity Managers Apollo Management 3,676,300 Aquiline Capital Partners 3,708,014 Baring Private Equity Asia 1,600,000 Black Diamond Capital Management 3,550,173 Capital International Private Equity Funds 1,658,216 CCMP Capital Advisors, LLC 3,761,361 CVC Capital Partners 2,738,470 Centerbridge Partners, L.P. 1,663,755 Coller Capital 3,655,310 Endeavour Capital 2,786,474 First Reserve Corporation 2,562,692 Fisher Lynch Capital 4,993,135 Grove Street Advisors 3,441,046 Kohlberg Kravis Roberts & Co. 12,988,331 KSL Capital Partners 2,186,916 Lion Capital 4,555,965 Littlejohn & Co., LLC 1,729,883 Oak Hill Capital Partners 5,489,647 Pathway Private Management, LLC 3,794,439 Providence Equity Partners 3,658,000 TPG Capital 10,839,281 Vista Equity Partners 2,763,575 Warburg Pincus 2,713,726 Wellspring Capital Management LLC 2,244,755 Other Private Equity Fees 28,204,502Real Estate Fees and Expenses 27,507,647State Treasury Fees 8,274,960Brokerage Commissions 21,864,495Other Investment Fees and Expenses 54,771,105Deferred Compensation Investment Fees and Expenses 2,569,620
Total Investment Fees, Commissions, and Expenses $ 335,163,728
Other Supplementary Information Summary of Investment Fees, Commissions, and Expenses For the Year Ended June 30, 2012

Oregon Public Employees Retirement System
• 60 •
This page is intentionally left blank.

Investment Section

Oregon Public Employees Retirement System
• 62 •
Investment Officer’s Report
STATE OF OREGONOREGON STATE TREASURY
350 WINTER STREET NE, SUITE 100SALEM, OREGON 97301-3896
MICHAEL MUELLERINTERIM CHIEF INVESTMENT OFFICERINVESTMENT DIVISION
PHONE 503 378-4111FAX 503 378-6772
October 18, 2012
Dear PERS Members:
This letter will address the macroeconomic investment environment over the past fiscal year, as well as the underlying performance of the Oregon Public Employees Retirement Fund.
While there were periods of positive sentiment in the U.S. stock market during the last twelve months, fears about the faltering global recovery and the heightening Eurozone crisis drove market volatility to elevated levels. All told, the Russell 3000 finished the year ended June 30 with a 3.8 percent gain. The returns varied widely across the last four quarters, with the market losing 15.3 in the third quarter of 2011, followed by gains of 12.1 percent and 12.9 percent in fourth quarter and first quarter, respectively, capped by a 3.1 percent loss in the final quarter. On a cumulative basis, the market is up 120 percent since the March 2009 low.
Across size segments, large cap outperformed small cap by 6.5 percent during the past twelve months. Drilling down into the large cap segment, large cap growth bested large cap value by 2.8 percent. On a sector basis, the defensive and yield-oriented sectors of Consumer Staples, Telecommunication Services, and Utilities were the best performing groups, with each posting a total return above 13 percent. Relatedly, the more cyclical and economically-sensitive sectors lagged during the year, with the Energy and Materials sectors performing the worst, with returns of -9.5 percent and -7.3 percent, respectively.
While the U.S. markets were able to finish the period with positive returns, international stock markets fell sharply as economic data weakened and European debt fears increased. After elections and debt progress, investor sentiment did improve in June, but it was not enough to recoup losses from the prior periods. For the year, the developed markets (as measured by the MSCI EAFE index) returned -13.8 percent. Emerging markets (as measured by the MSCI Emerging Markets index) pulled back in similar fashion, falling by 16.0 percent. On a sector basis, across developed and emerging markets, the negative market returns created conditions favoring defensive sectors such as Consumer Staples (up 3.0 percent) and Health Care (up 1.0 percent). Leading the declines were the Materials (down -26.7 percent) and Financials (down -17.6 percent) sectors.
In U.S. Fixed Income, investors moved to the safety of Treasuries, sending yields broadly lower for the year. The yield on a ten-year Treasury bond ended June at 1.67 percent versus 1.89 percent on December 31, 2011 and 3.16 percent on June 30, 2011. Spreads on non-Treasury securities widened, although stronger balance sheets and attractive lending rates buoyed performance of investment-grade corporate bonds. The fiscal turmoil in Europe and economic slowdowns in large emerging markets, such as China, continued to weigh on global bond markets. For the year, the Barclays Capital Aggregate Bond index returned 7.5 percent.
With respect to performance of the pension fund, OPERF ended the fiscal year up just 1.6 percent, but up over 13.2 percent, on average, for the prior three years. Public equity markets, around the globe, continued to be stifled by the dismal macroeconomic picture, both home and abroad, as mentioned earlier. OPERF public equities declined 7.1 percent for the fiscal year, reflective of the domestic portfolio returning approximately 1.9 percent and the non-US and emerging markets losing 13.4 percent. OPERF was helped by a strong year in fixed income, with that portion of the fund delivering 7.4 percent, ahead of the custom benchmark return of 6.9 percent. Real estate and private equity provided positive contributions as well, returning 8.7 percent and 6.7 percent, respectively, for the year.
Longer term, the total fund has somewhat mixed results, slightly lagging the benchmark over the most recent five year period and beating the benchmark over ten years. Relative to other large state funds, OPERF continues to perform well. Total fund performance for the year ended June 2012 was in the top 29th percentile of large public funds while the ten year rank was 6th percentile (that is, better performance than 94 percent of the peer funds).
Calculations were prepared using a time-weighted rate of return based on the market rate in accordance with Global Investment Performance Standards performance presentation standards.
Michael Mueller, CFA, CPA Interim Chief Investment Officer

Oregon Public Employees Retirement System
• 63 •
Description of Investment Policies
Oregon Revised Statute (ORS) 293.706 established the Oregon Investment Council (OIC), which consists of five voting members. Four members of the council, who are qualified by training and experience in the field of invest-ment or finance, are appointed by the governor subject to state Senate confirmation. The state treasurer serves as the council’s remaining voting member. In addition, the direc-tor of the Public Employees Retirement System serves as a non-voting OIC member.
ORS 293.701 defines the investment funds over which OIC has responsibility. Included are the Public Employees Retirement Fund (PERF) and the Deferred Compensation Fund. OIC establishes policies for the investment and rein-vestment of moneys in the investment funds as well as the acquisition, retention, management, and disposition of investments in the investment funds. OIC is also responsible for providing an examination of the effectiveness of the investment program.
OIC ensures moneys in the investment funds are invested and reinvested to achieve the investment objec-tive of making the moneys as productive as possible. Furthermore, the investments of those funds are managed as a prudent investor would do under the prevailing cir-cumstances and in light of the purposes, terms, distribution requirements, and laws governing each investment fund. This standard requires the exercise of reasonable care, skill, and caution and is applied to investments not in iso-lation, but in the context of each fund’s portfolio as part of an overall investment strategy. The strategy should incor-porate risk and return objectives reasonably suitable to the particular investment fund.
When implementing investment decisions, OIC has a duty to diversify the investments of the investment funds unless, under the circumstances, it is not prudent to do so. In addition, OIC must act with prudence when selecting agents and delegating authority.
OIC has approved the following asset classes for the PERF: Short-Term Investing, Fixed Income, Real Estate, Public and Private Equities, and Alternative Investments. In addition, PERF invests in the Opportunity Portfolio, which may be populated with investment approaches across a wide range of investment opportunities with no limitation as to asset classes or strategies. OIC must approve, in advance, the purchase of investments in a new asset class not described above.
OIC has an open-door policy wherein investment offi-cers employed by the Oregon State Treasury will hear and consider investment proposals and solicitations from any person, firm, or partnership that submits a proposal or solicitation in good faith. However, under no circumstance does this policy require that the Oregon State Treasury purchase the proposed investment.
OIC maintains an equal opportunity policy. When awarding contracts or agreements, OIC does not discrimi-nate because of age, race, color, sex, religion, national origin, marital status, sexual orientation, or disability. Furthermore, OIC encourages firms doing or seeking to do business with OIC to have equal opportunity programs. OIC requires that all written contracts or agreements with OIC incorporate reference that affirms compliance with applicable nondiscrimination, equal opportunity, and con-tract compliance laws.
In compliance with ORS 192.630-660 OIC holds its meeting in a public forum. Public notice, including a meeting agenda, is provided to interested persons and news media that have requested notice. Written minutes and recordings are taken at all meetings.
OIC regularly reviews various aspects of investment policy, performance of investment managers and accounts, asset allocation, and a large number of investment propos-als and recommendations. OIC’s statement of Investment Objectives and Policy Framework is available on the Oregon State Treasury website at http://www.ost.state.or.us/About/OIC/Governance.Documents.asp

Oregon Public Employees Retirement System
• 64 •
Investment Results*
Periods Ending June 30, 2012Annualized
1-Year 3-Year 5-YearTotal Portfolio, Excluding Variable 1.6% 13.3% 1.8%Policy Benchmark 2.6 12.6 2.4Variable Account (6.4) 11.6 (3.2)Variable Account Blended Index (6.9) 11.3 (2.4)
Domestic Stocks 1.9 16.8 0.1Benchmark: Russell 3000 Index 3.8 16.7 0.4
International Stocks (13.4) 8.5 (3.2)Benchmark: Custom Index1 (14.8) 7.4 (4.2)
Fixed Income Segment 7.4 11.5 7.8Benchmark: Custom Index2 6.9 7.0 6.5
Real Estate3 8.7 9.3 (1.1)Benchmarks: NCREIF Property Index 13.4 6.0 2.9NCREIF Equity REIT Share Price Index 12.5 32.4 2.6
Private Equity4 6.7 18.5 5.8Russell 3000 +300 bps 10.4 27.7 6.1
Calculations were prepared using a time-weighted rate of return based on the market rate in accordance with the Global Investment Performance Standards performance presentation standards.1 Morgan Stanley Capital International All Country World Index (MSCI ACWI) ex U.S. Gross through May 31, 2008, and thereafter linked with the
MSCI ACWI ex U.S. Investable Market Index Net Index2 90% Barclays Capital Universal/10% Solomon Smith Barney Inc. Non-US World Government Bond Hedged3 Returns are lagged one quarter.4 Returns are lagged one quarter.
*The Investment Results are based on OIC asset classes as determined by each manager’s primary investment type, not the financial statement classification of individual holdings.

Oregon Public Employees Retirement System
• 65 •
OIC Target and Actual Investment Allocations as of June 30, 2012*
Asset Class/Strategy LowRange
HighRange
OIC Target Allocation
Asset Class/Strategy
ActualAllocation
Cash 0.0% 3.0% 0.0% Cash 3.3%Debt Securities 20.0 30.0 25.0 Debt Securities 24.3Public Equity 38.0 48.0 43.0 Public Equity 34.7Private Equity 12.0 20.0 16.0 Private Equity 24.2Real Estate 8.0 14.0 11.0 Real Estate 11.2Alternative Equity 0.0 8.0 5.0 Alternative Equity 0.7Opportunity Portfolio1 0.0 0.0 0.0 Opportunity Portfolio 1.6
Total 78.0% 123.0% 100.0% Total 100.0%1 Opportunity Portfolio is an investment strategy and it can be invested up to 3% of total plan net assets.
* The OIC Target Allocations are based on OIC asset classes as determined by each manager's primary investment type, not the financial statement classification of individual holdings. The Target Allocation amounts do not include Deferred compensation Plan investments. The Actual Investment Allocation is based on the financial statement investment classifications, including Deferred Compensation Plan investments.
Public Equity 34.7%
Debt Securities
24.3%
Private Equity 24.2%
Real Estate 11.2%
Cash 3.3%
Opportunity Portfolio
1.6%
Alternative Equity 0.7%
Actual Allocation
Investment Mix by Asset Class/Strategy
2.8%
18.0%
13.7% 14.3%
18.6%
-3.8%
-22.3%
17.0%
22.3%
1.6%
2003 2004 2005 2006 2007 2008 2009 2010 2011 2012
Total Fund Performance10-Year Review, One-Year Returns

Oregon Public Employees Retirement System
• 66 •
List of Largest Assets HeldLargest Stock Holdings (by Fair Value)
June 30, 2012 Description Shares Fair Value
Apple Inc. 348,725 $ 203,655,400Exxon Mobil Corporation 1,733,393 148,326,439Pfizer Inc. 4,811,044 110,654,012Chevron Corporation 872,053 92,001,592JPMorgan Chase & Co. 2,572,528 91,916,425China Mobile Limited 7,444,432 81,336,575Samsung Electronics Co. Limited 75,734 79,413,746BP Plc 11,528,957 76,299,515Nestle SA 1,265,541 75,611,562Novo Nordisk A/S 505,265 73,182,437
Largest Bond Holdings (by Fair Value)June 30, 2012
Description Par Value Fair Value
FNMA TBA 30 Year Single Family 3.5% Due December 1, 2099
115,575,000 $ 121,479,727
US Treasury Notes 1% Due August 31, 2016
115,378,400 117,197,930
US Treasury Notes 1.25% Due April 30, 2019
103,065,000 104,211,050
US Treasury Notes 3.125% Due November 15, 2041
85,350,000 91,694,065
FNMA Pool AJ7689 4% Due December 1, 2041
78,624,096 83,749,555
Brambles Payment In-Kind Senior Subordinated Notes 12% Due July 18, 2014
82,557,708 82,298,584
FNMA TBA 30 Year Single Family 4% Due December 1, 2099
77,300,000 82,264,206
Russian Foreign Bond Senior Unsecured 7.5% Due March 31, 2030
65,721,000 78,903,975
US Treasury Notes 4.5% Due May 15, 2038
57,070,000 77,158,638
US Treasury Notes 4.625% Due February 15, 2040
54,920,000 75,923,606
A complete list of portfolio holdings may be requested from the Oregon State Treasury, 350 Winter Street NE, Suite 100, Salem, OR 97301-3896.

Oregon Public Employees Retirement System
• 67 •
Schedule of Fees and Commissions For the Fiscal Year Ended June 30, 2012
Assets Under Management Fees Basis Points
Investment Managers’ Fees: Debt Securities Managers $ 14,641,988,707 $ 26,433,559 0.180533 Public Equity Managers 20,918,981,564 65,786,882 0.314484 Real Estate Managers 6,760,574,023 27,507,647 0.406883 Private Equity Managers (Limited Partnerships) 14,544,003,207 120,963,966 0.831710 Alternative Equity Managers 410,250,609 4,828,781 1.177032 Opportunity Portfolio Managers 933,878,315 2,448,181 0.262152Total Assets Under Management $ 58,209,676,425
Other Investment Service Fees: Investment Consultants 1,952,850 Commissions and Other Fees 85,241,862Total Investment Service and Managers’ Fees $ 335,163,728
Schedule of Broker Commissions For the Fiscal Year Ended June 30, 2012
Broker’s Name Commission Shares / ParCommissionPer Share
Goldman, Sachs & Co. $ 1,849,118 138,090,682 $ 0.0134Credit Suisse First Boston Corporation 1,447,242 272,897,445 0.0053J.P. Morgan 1,444,658 258,090,968 0.0056Merrill Lynch, Pierce, Fenner & Smith, Inc. 1,366,012 208,031,423 0.0066Citigroup Global Markets Inc. 1,177,391 189,015,163 0.0062UBS Securities Inc. 1,142,515 118,471,599 0.0096Morgan Stanley & Co., Incorporated 1,114,100 148,893,385 0.0075Deutsche Bank 1,024,604 320,269,489 0.0032Barclays Capital 864,888 29,354,600 0.0295Instinet Corporation 774,601 194,619,019 0.0040Investment Technology Group Inc. 744,820 158,987,592 0.0047Société Générale 499,917 152,253,634 0.0033MacQuarie Securities 454,406 161,532,927 0.0028Nomura Securities International, Inc. 442,506 77,628,561 0.0057Liquidnet, Inc. 414,777 30,312,639 0.0137Jefferies & Company 331,567 24,167,242 0.0137Sanford C. Bernsterin LTD 281,511 75,610,614 0.0037Royal Bank of Canada 246,177 12,652,794 0.0195BNP Paribas Securities 219,528 43,200,450 0.0051HSBC Bank Plc 211,793 62,616,359 0.0034
Brokerage commissions on purchases and sales are too numerous to list; therefore, only the top 20 brokers by amount of commission paid are shown.

Oregon Public Employees Retirement System
• 68 •
Investment Summary
Type of InvestmentFair Value at June 30, 2012
Percent of Total Fair Value*
Debt Securities U.S. Government Securities $ 1,377,179,970 2.37% U.S. Agency Securities 2,366,197,576 4.06 Corporate Bonds 5,076,035,544 8.71 Asset-Backed Securities 1,556,754,637 2.67 International Debt Securities 2,261,725,563 3.89 Mutual Funds - Domestic Fixed Income 1,523,285,754 2.62 Mutual Funds - International Fixed Income 480,809,663 0.83
Total Debt Securities 14,641,988,707 25.15
Public Equity Domestic Equity Securities 7,098,777,497 12.20 International Equity Securities 8,660,292,506 14.88 Mutual Funds - Domestic Equity 1,946,539,771 3.34 Mutual Funds - Global Equity 757,914,949 1.30 Mutual Funds - International Equity 2,161,639,370 3.71 Mutual Funds - Target Date 293,817,471 0.51
Total Public Equity 20,918,981,564 35.94
Real Estate 6,760,574,023 11.61
Private Equity 14,544,003,207 24.99
Alternative Equity 410,250,609 0.71
Opportunity Portfolio 933,878,315 1.60
Total Fair Value $ 58,209,676,425 100.00%
*These percentages do not include cash and cash equivalents.

Actuarial Section

Oregon Public Employees Retirement System
• 70 •
c:\temp\gwvie
October
RetiremeOregon P
Re: A
Dear Me
As part oPublic Emfindings aOctober
The mateis a subsregardingvaluation
Actuarialodd-numperforme
The Retiused for valuationby Mercealways mStatemenAnnual R
MillimanComprehvaluation
S S S S A S S N
ewer\cafr letter 123
30, 2012
ent Board Public Emplo
Actuarial Va
mbers of the
of our engagmployees Reare set forth26, 2012. T
erial includedset of the resg the actuarin apply to the
valuations ambered year aed as of the e
rement Boarthe valuatio
n were adopter as of Decemeet the parants Nos. 25
Required Co
prepared thhensive Annn:Schedule of ASchedule of RSchedules ofSolvency TesAnalysis of FSchedules ofSchedules ofNotes to Req
This work prodpurposes statedintend to benefirecommends threviewing the M
12011.docx
oyees Retire
luation as o
e Board,
ement with tetirement Sy in our syste
That report re
d in the Comsults containial basis of te CAFR exh
are performeare used to end of each
rd has sole an. The actuated by the Bember 31, 2ameters set and 43. Whentribution ha
e following iual Financia
Active MembRetirees andf Funding Prstinancial Expf Funding Prf Employer Cuired Supple
uct was prepared d herein, and may it and assumes no
hat third parties beilliman work produc
ement Syste
of Decembe
the Board, wystem (“PERem-wide Deceflects the b
mprehensiveed in the syshe valuation
hibits, and ar
ed annually,determine aeven-numb
authority to darial assumpoard based 010. The asfor disclosu
ere the fundas been adju
nformation tal Report (CA
ber Valuationd Beneficiariogress by R
perience ogress
Contributionsementary Sc
solely for Oregonnot be appropriate
o duty or liability toe aided by their owct.
m
er 31, 2011
we performedRS” or “the Scember 31, 2enefit provis
e Annual Finastem-wide re
n and the mare incorporat
but only vaannual requirered year ar
determine thptions and mupon the res
ssumptions ares by Goveing amount
usted to satis
that is preseAFR) based
n Data es Added to
Rate Pool
schedules
n Public Employeee to use for other o other parties whown actuary or othe
d an actuariSystem”) as o2011 Actuarsions in effec
ancial Repoeport. The daterial inputsted herein by
luations perfred contributre advisory o
he actuarial methods used
sults of the eand methodsernmental Acdoes not mesfy the GAS
ented in the Aon the Dece
o and Remov
es Retirement Syspurposes. Millimao receive this worer qualified profess
11SuPoUS
TeFa
mi
al valuation of Decemberial Valuationct as of Dece
ort (CAFR) fodescription is and limitatiy reference.
rformed as otions. Interimonly.
assumptionsd in the 201experience ss used for fuccounting Steet GASB paB paramete
Actuarial Seember 31, 2
ved from Ro
stem for the an does not rk. Milliman sional when
1 SW Fifth Avenueuite 3700 ortland, OR 97204SA
el +1 503 227 063ax +1 503 227 795
lliman.com
of the Oreger 31, 2011. n Report, issember 31, 2
or Oregon Pn the report ions of use o
of the end of m valuations
s and metho1 actuarial study condu
unding do notandards Boarameters, trs.
ection of the 2011 actuaria
olls
e
3456
on Our
sued2011.
ERS
of the
eachs
ods
uctedotoardthe
2012al

Oregon Public Employees Retirement System
• 71 •
RetiremeOregon POctoberPage 2
c:\temp\gwvie
We undemethodsthe Dece
All membadministeschool dijoined theindependBenefitsand all ot
All membmembersrequiremall emplobenefits a
Finally, scontributoffset futsum depContributpool.
Howeverrequiredaccounts
Actuaria
In preparwriting) sbenefit pfound thiother purinformatineed to b
All costs,the basisaccount toffer a re
ent Board Public Emplo30, 2012
ewer\cafr letter 123
erstand the A, actuarial as
ember 31, 20
bers hired prered using sistricts sharee State and dent employein Force Rether pooling
bers hired afs who previo
ments to reinsoyers regardand Chapter
some employions. These ure contribuosits are nottion (ARC) o
r, side accoucontribution
s as part of t
al Basis
ring the valusupplied by trovisions ass informatiorposes. Theon is inaccube revised.
, liabilities, ras of actuarialthe experien
easonable es
oyees Retire
This work prodpurposes statedintend to benefirecommends threviewing the M
12011.docx
Actuarial Secssumptions,011, actuaria
rior to Augussome cost-she costs throuLocal Goveers who do nserve that parrangemen
fter August 2ously establistate those bless of their r 238A bene
yers made ludeposits aretion requiremt considered
or the contra
unts are inclus. The Schehe Plan’s as
ation reportthe System’ss defined by n to be reas
e valuation rerate or incom
ates of interel assumptionnce of the Systimate of an
ement Syste
uct was prepared d herein, and may it and assumes no
hat third parties beilliman work produc
ction of the C and plan pr
al valuation r
st 29, 2003, haring poolsugh the schornment Ratenot share coools the expnts.
28, 2003, areshed membbenefits. Cosstatus unde
efits are parts
ump sum dee placed in aments of thad as contribuactually requ
uded as assedule of Funssets.
, we relied, ws staff. This statute, memonably consesults depenmplete our r
est, and othens and methystem and renticipated ex
m
solely for Oregonnot be appropriate
o duty or liability toe aided by their owct.
CAFR will alrovisions valreport.
are covereds and some iool district poe Pool (SLGosts with theperience of t
e covered unership undests for Chap
er the Chaptes of a single
eposits in adda side accouat employer. utions towardired contribu
sets in the deding Progres
without auditinformation
mber censussistent and cnd on the intresults may b
er factors foods which aeasonable experience aff
n Public Employeee to use for other o other parties whown actuary or othe
lso include slued. These
d under Chandependentool. Some loRP) to share
e other emplohose in pay
nder Chapteer Chapter 23pter 238A meer 238 arran
e plan.
dition to theunt within theFor financia
d meeting thution for emp
evelopmentss and Solve
t, on informa includes, bus data, and fcomparable wtegrity of thisbe different a
or the Systemare individuaexpectationsffecting the S
es Retirement Syspurposes. Millimao receive this worer qualified profess
summaries osummaries
pter 238. Tht employer vocal governme costs. Theoyers excepstatus acros
er 238A, exc38 and meetembers are ngements. C
ir regularly se pension trual reporting phe Annual Reployers in a
of the ARC ency Test a
ation (some ut is not limifinancial infowith informas informationand our calc
m have beenally reasonab); and which
System.
stem for the an does not rk. Milliman sional when
of the actuarare contain
hese benefitsvaluations. Aments have ere are also pt through thess all emplo
cept for thoset the shared acro
Chapter 238
scheduled ust and usedpurposes, luequiredcost-sharing
or contractulso include s
oral and somted to, Syste
ormation. Wation used fon. If any of tculations ma
n determinedble (taking inh, in combina
rialed in
s are All
132eyers
e
oss
d to mp
g
uallyside
me in em
Weorthisay
d on ntoation,

Oregon Public Employees Retirement System
• 72 •
RetiremeOregon POctoberPage 3
c:\temp\gwvie
The valuIt can neActuarialcontributother assassumpt
Future acpresentethat anticdemograthe methadditionain Systemdid not pfinal deciherein on
Some of determinOther ac43 and 4financialas discloconsistencalculatioSystem b27, 43 ansignificandetermin
Milliman’Retireme
Millimanreport. Nrecipientsneeds.
The consintended
ent Board Public Emplo30, 2012
ewer\cafr letter 123
ation report ither predict valuations dions. While sumption setions would b
ctuarial meaed in this repcipated by thaphic assumodology use
al cost or conm benefit proerform an anision regardin July 29, 20
the actuariaing the conttuarial comp5 are for pureporting re
osed in our rent with our uons in this rebenefit provind 45. Detently differentations may
s work is preent System.
does not into third partys should eng
sultants whoto be a sub
oyees Retire
This work prodpurposes statedintend to benefirecommends threviewing the M
12011.docx
is only an e the Systemdo not affectthe valuatio
ts may also be different.
asurements mort due to su
he economicptions; incre
ed for these ntribution reqovisions or analysis of thing the appr011.
al computatioribution rate
putations prerposes of asquirements.eport. The cnderstandin
eport have bsions as sumrminations f from the resbe needed f
epared solel
tend to beney recipient ofgage qualifie
o worked on stitute for qu
ement Syste
uct was prepared d herein, and may it and assumes no
hat third parties beilliman work produc
stimate of thm’s future con
t the ultimateon is based obe reasonab No one set
may differ siuch factors ac or demograeases or decmeasuremequirements b
applicable lae potential ropriateness
ons presentees effective fesented in thssisting the S The compu
calculations ng of the Syseen made ommarized infor purposessults containfor other pur
ly for the use
efit or create f Milliman's wed professio
this assignmualified legal
m
solely for Oregonnot be appropriate
o duty or liability toe aided by their owct.
he System’s ndition nor ge cost of Syson an array oble and valuof assumpt
gnificantly fras the followaphic assumcreases expeents (such asbased on thew. Due to th
range of futuof the assum
ed in the valrom July 20
his report unSystem and utations prepin the enclos
stem’s fundinon a basis co the report, a
s other than mned in this rerposes.
e and benef
a legal dutywork producnals for adv
ment are penl or accounti
n Public Employeee to use for other o other parties whown actuary or othe
financial coguarantee futstem benefitof individual
uation resultsions is uniqu
rom the currwing: Systemmptions; chanected as pars the end of e System's fhe limited sc
ure measuremptions and
uation repor13 to June 2der GASB Sparticipatingpared for thesed report hng requiremeonsistent witand of GASmeeting theseport. Accor
fit of the Ore
y to any thirdct should relyice appropri
nsion actuaring counsel.
es Retirement Syspurposes. Millimao receive this worer qualified profess
ondition as ofture financiats, only the tly reasonabs based on tuely correct.
rent measurem experiencenges in econrt of the natuan amortizafunded statucope of this aments. The
d adopted th
rt are for pur2015 for SysStatements Ng employersese two purphave been ments and goth our undersB Statemense requiremrdingly, addi
gon Public E
d party recipy upon this rate to their o
ries. Millima
stem for the an does not rk. Milliman sional when
f a single daal soundnesstiming of Sysle assumptiothose
ements e differing fronomic or ural operatioation period ous); and chaassignment,
e Board has em as indica
rposes of stem employNo. 25 and 2s in fulfilling tposes may d
made on a baals. The standing of tts No. 25 an
ments may beitional
Employees
ient of this report. Such own specific
an’s advice is
ate.s.stemons,
om
on of ornges, we theated
yers.27,theirdifferasis
thende
c
s not

Oregon Public Employees Retirement System
• 73 •
RetiremeOregon POctoberPage 4
c:\temp\gwvie
On the bthis reporecognizeAcademycontained
Sincerely
MatthewConsultin
The informbe used, athat may
ent Board Public Emplo30, 2012
ewer\cafr letter 123
asis of the fort is completed and accey of Actuaried herein.
y,
R. Larrabeeng Actuary
mation contaand it cannotbe imposed o
oyees Retire
This work prodpurposes statedintend to benefirecommends threviewing the M
12011.docx
oregoing, wete and accurepted actuares and meet
e, FSA, EA,
ained in this dt be used, foron the taxpay
ement Syste
uct was prepared d herein, and may it and assumes no
hat third parties beilliman work produc
e hereby cerrate and hasial principlesthe Qualific
MAAA
document (inr the purposeyer.
m
solely for Oregonnot be appropriate
o duty or liability toe aided by their owct.
rtify that, to ts been prepas and practication Standa
ScotCon
cluding any ae of avoiding
n Public Employeee to use for other o other parties whown actuary or othe
the best of oared in accoces. We areards to rend
tt D. Preppensulting Actu
attachments)penalties un
es Retirement Syspurposes. Millimao receive this worer qualified profess
our knowledgordance withe members oer the actua
ernau, FSA, uary
) is not intendder the Intern
stem for the an does not rk. Milliman sional when
ge and belie generally
of the Americarial opinion
EA, MAAA
ded by Millimnal Revenue
ef,
can
man to Code

Oregon Public Employees Retirement System
• 74 •
Actuarial Assumptions and MethodsTier One/Tier TwoActuarial Methods and Valuation ProceduresOn July 29, 2011, the Board adopted the following actuarial methods and valuation procedures for the December 31, 2010 and 2011 actuarial valuations of PERS Tier One/Tier Two benefits. The actuarial cost method and contribution rate stabilization method were first adopted effective December 31, 2004.
Actuarial cost method Projected Unit Credit. Under the Projected Unit Credit cost method, the objective is to fund each member’s benefit under the plan as it accrues, taking into consideration expected future compensation increases. Thus, the total pension to which each member is expected to become entitled at retirement is broken down into units, each associated with a year of past or future credited service. Typically, when this method is introduced, there will be an initial liability for benefits credited for service prior to that date, and to the extent that the liability is not covered by assets of the plan, there is an unfunded liability to be funded over a stipulated period in accordance with an amortization schedule.A detailed description of the calculation follows:An individual member’s accrued benefit for valuation purposes related to
a particular separation date is the accrued benefit described under the plan, determined using the projected compensation and service that would be used in the calculation of the benefit on the expected separation date, multiplied by the ratio of credited service as of the valuation date over credited service as of the expected separation date. In no event can this be less than the accrued benefit described under the plan, determined using the compensation and service as of the valuation date.
The benefit deemed to accrue for an individual member during a plan year is the excess of the accrued benefit for valuation purposes at the end of the plan year over the accrued benefit for valuation purposes at the beginning of the plan year. Both accrued benefits are calculated from the same projections to the various anticipated separation dates as described above.
An individual member’s accrued liability is the present value of the accrued benefit for valuation purposes at the beginning of the plan year, and an individual member’s normal cost is the present value of the benefit deemed to accrue in the plan year. The accrued liability and the normal cost for an individual member are the sum of the component accrued liabilities and normal costs associated with the various anticipated separation dates. Such accrued liabilities and normal costs reflect the accrued benefits as modified to obtain the benefits payable on those dates and the probability of the member separating on those dates.
- The plan’s normal cost is the sum of the individual member normal costs, and the plan’s accrued liability is the sum of the accrued liabilities for all members under the plan.
Amortization of change in UAL due to change in actuarial cost method (PUC change UAL)
Contribution rates effective July 1, 2007, through June 30, 2011, reflect an accelerated amortization of the change in UAL that occurred when the PUC cost method was first adopted for the December 31, 2004 valuation. By the time the current contribution rates are changed on July 1, 2011, four years of contributions will have been collected toward the three-year amortization base. Consequently, the PUC change amortization was eliminated from the December 31, 2009 valuation so it will not be included in contribution rates that become effective July 1, 2011.
Tier One/Tier Two UAL and Retiree Healthcare UAL amortization
The Tier One/Tier Two regular UAL and Retiree Healthcare regular UAL as of December 31, 2007, are amortized as a level percentage of combined valuation payroll over a closed period. For the Tier One/Tier Two UAL, this period is 20 years; for Retiree Healthcare, it is 10 years. Gains and losses between subsequent odd-year valuations are amortized as a level percentage of combined valuation payroll over 20 (10 for Retiree Healthcare) years from the odd-year valuations in which they are first recognized.The amortization of the UAL using the current amortization method results in an initial payment less than the “interest only” payment on the UAL. Payments less than the interest only amount will result in the UAL increasing for an initial period of time.

Oregon Public Employees Retirement System
• 75 •
Asset valuation method The actuarial value of assets equals the market value of assets, excluding the Contingency, Capital Preservation, and Rate Guarantee Reserves when it is in positive surplus status. Market values are reported to Milliman by PERS. It is our understanding that select real estate and private equity investments are reported on a three-month lag basis. This valuation report does not attempt to quantify any such effects.
Contribution rate stabilization method
Contribution rates for a rate pool (e.g., Tier One/Tier Two SLGRP, Tier One/Tier Two School Districts, OPSRP) are confined to a collar based on the prior contribution rate (prior to application of side accounts, pre-SLGRP liabilities, and 6 percent Independent Employer minimum). The new contribution rate will generally not increase or decrease from the prior contribution rate by more than the greater of 3 percentage points or 20 percent of the prior contribution rate. If the funded percentage excluding side accounts drops below 70 percent or increases above 130 percent, the size of the collar doubles. If the funded percentage excluding side accounts is between 70 percent and 80 percent or between 120 percent and 130 percent, the size of the rate collar is increased on a graded scale.
Allocation of Liability for Service Segments
For active Tier One/Tier Two members who have worked for multiple PERS employers over their careers, the calculated actuarial accrued liability is allocated among the employers based on a weighted average of the Money Match methodology, which utilizes account balance, and the Full Formula methodology, which utilizes service. The allocation is 40 percent (10 percent for police and fire) based on account balance with each employer and 60 percent (90 percent for police and fire) based on service with each employer.The entire Normal Cost is allocated to the current employer.
Allocation of Benefits-In-Force (BIF) Reserve
The BIF is allocated to each rate pool in proportion to the retiree liability attributable to the rate pool.

Oregon Public Employees Retirement System
• 76 •
Economic AssumptionsThe Board adopted the following economic assumptions for the December 31, 2010 and 2011 actuarial valuations. The
investment return assumption was first adopted in 1989, and the interest crediting assumptions were adopted in 2003. The healthcare cost inflation assumption was adopted December 31, 2008. The interest crediting assumption for variable account balances was adopted December 31, 2010. All other economic assumptions were first adopted in 2005.
Investment return 8.0 percent compounded annuallyInterest crediting 8.0 percent compounded annually on members’ regular account balances
8.25 percent compounded annually on members’ variable account balancesInflation 2.75 percent compounded annuallyPayroll growth 3.75 percent compounded annually. This assumption represents the sum of the inflation
assumption and a real wage growth assumption of 100 basis points.Healthcare cost inflation Health cost trend rates are used to predict increases in the RHIPA Maximum Subsidy. The
trend rates shown below do not attempt to incorporate any potential impact of the excise tax associated with the Patient Protection and Affordable Care Act.
Year 1
20122013201420152016201720182019 2020
Rate6.9%6.96.96.96.86.86.66.46.2
Year20212022202320242025202620272028
2029+
Rate6.05.85.65.45.25.04.94.74.5
Demographic AssumptionsThe Board adopted the following demographic assumptions for the December 31, 2010 and 2011 actuarial valuations.
Mortality The following mortality tables were first adopted in the December 31, 2010 valuation, except for the Police and Fire male table, which was adopted in the December 31, 2008 valuation.
Healthy Retired Members
Basic Table RP 2000, Generational Combined Active/Healthy Annuitant, Sex Distinct
School District male White collar, set back 18 monthsOther General Service male (including male beneficiary) Blended 25 percent blue collar, set back 12 monthsPolice and Fire male Blended 33 percent blue collar, no set backSchool District female White collar, set back 24 monthsOther female (including female beneficiary) White collar, no set back
The following disabled retiree mortality rates were first adopted for the December 31, 2008 actuarial valuation.
Disabled Retired Members
Basic Table RP 2000, Static, Combined Active/Healthy Annuitant, No Collar, Sex Distinct
Male Set Forward 60 months, min of 2.25 percent
Female Set Forward 48 months, min of 2.25 percent
1 For valuation purposes, the health cost trend rates are assumed to be applied at the beginning of the plan year.

Oregon Public Employees Retirement System
• 77 •
The following mortality rates were first adopted for non-annuitant members for the December 31, 2010 actuarial valuation, except for the School District male, Police and Fire male, and other General Service female rates, which were adopted in the December 31, 2008 valuation.
Non-Annuitant MembersBasic Table Percent of Healthy Retired Mortality TablesSchool District male 75%Other General Service male 85Police and Fire male 70School District female 60 Other female 50
Retirement AssumptionsThe retirement assumptions used in the actuarial valuation include the following:
• Retirement from active status/dormant status• Probability a member will elect a lump-sum option at retirement• Percentage of members who elect to purchase credited service at retirement.
Rates of Retirement from Active StatusThe following retirement rate assumptions were first adopted in the December 31, 2010 valuation.
Judge members are assumed to retire at age 63.
Police and Fire General Service/School Districts
General Service School DistrictsAge < 13 Years 13-24 Years 25+ Years < 15 Years 15-29 Years < 15 Years 15-29 Years 30+ Years
<50 18.0%50 1.0% 2.0% 25.0% 18.051 1.0 2.0 16.5 18.052 1.0 2.0 16.5 32.053 1.0 2.0 16.5 28.054 1.0 2.0 16.5 27.055 3.0 7.5 16.5 1.0% 3.5% 1.0% 6.0% 26.056 3.0 7.5 16.5 1.0 3.25 1.0 5.0 25.057 3.0 7.5 16.5 1.0 3.0 1.0 5.0 24.058 3.0 7.5 16.5 1.5 9.0 2.5 15.0 28.059 3.0 7.5 16.5 2.0 8.0 2.5 12.0 21.060 3.0 7.5 16.5 4.0 8.0 3.5 12.0 21.061 3.0 7.5 16.5 4.0 8.0 4.5 12.0 21.062 13.0 22.0 35.0 8.5 15.0 9.0 21.0 29.063 8.0 20.0 30.0 7.0 13.0 8.0 16.0 22.064 8.0 10.0 30.0 7.0 13.0 8.0 16.0 22.065 100.0 100.0 100.0 12.0 22.0 17.0 27.0 26.066 19.0 31.0 14.0 32.0 18.067 13.0 25.0 12.0 24.0 18.068 12.0 21.0 10.0 24.0 18.069 12.0 21.0 8.0 24.0 18.070 100.0 100.0 100.0 100.0 100.0

Oregon Public Employees Retirement System
• 78 •
Retirement from Dormant StatusDormant members are assumed to retire at Normal Retirement Age (age 58 for Tier One, age 60 for Tier Two, age 60
for judges, and age 55 for Police and Fire) or at the first unreduced retirement age (30 years of service, or age 50 with 25 years of service for Police and Fire).
Lump-Sum Option at RetirementMembers retiring may elect to receive a full or partial lump sum at retirement. The probability that a retiring mem-
ber will elect a lump sum at retirement is summarized in the table below. These rates were first adopted effective December 31, 2010.
Partial Lump Sum: 6% for all yearsTotal Lump Sum: 4.5% for 2012, declining by 0.5% per year until reaching 0.0%No Lump Sum: 89.5% in 2012, increasing by 0.5% until reaching 94.0%
Purchase of Credited Service at RetirementThe following percentages of members are assumed to purchase credit for the six-month waiting period at retirement.
These rates were first adopted effective December 31, 2010.
Money Match Retirements: 0%Non-Money Match Retirements: 60%
Judge Member Plan Election All judge members are assumed to elect to retire under the provisions of Plan B.
Disability AssumptionsThere are two disability assumptions used in the valuation—duty disability and ordinary disability. Duty disability rates
are separated between police and fire and general service, while ordinary disability is the same for all members. The rates for ordinary disability were first adopted effective December 31, 2010. The rates for duty disability were first adopted effective December 31, 2008.
TypePercentage of the 1985Disability Class 1 Rates
Duty Disability Police and Fire 15%Duty Disability General Service 1.5%Ordinary Disability 50% with 0.18% cap
Termination AssumptionsThe termination assumptions used in the actuarial valuation include the following assumptions:
• Termination from active status prior to retirement eligibility
• Probability that a member will not take a lump-sum distribution prior to retirement.
The termination assumptions for School District and Police and Fire members were first adopted effective December 31, 2008. The assumptions for General Service members were first adopted December 31, 2010.
Termination RatesSample termination rates are shown for each group below:
Age School DistrictGeneral
Service MaleGeneral
Service FemalePolice and
Fire30 4.32% 6.16% 8.75% 3.45%40 2.63 3.64 4.42 2.1750 1.90 2.61 3.00 1.24

Oregon Public Employees Retirement System
• 79 •
Salary Increase AssumptionsThe salary increase assumptions reflected in the actuarial valuation include:• Merit scale increases in addition to the payroll growth increase• Unused Sick Leave adjustments• Vacation pay adjustments
Merit IncreasesMerit increases are based on duration of service for the following groups with sample rates shown in the following
table. The rates were first adopted effective December 31, 2010.
Unused Sick LeaveMembers covered by the provision allowing unused sick leave to be used to increase final average salary are assumed
to receive increases in their final average salary in accordance with the table below. This adjustment is not applied to disability benefits. The rates for local general service females were adopted effective December 31, 2001, and the rates for local general service males were adopted effective December 31, 2005. All other rates were adopted effective December 31, 2010.
Actives RatesState GS Male 6.25%State GS Female 3.75School District Male 8.25School District Female 6.50Local GS Male 4.25Local GS Female 3.00State Police and Fire 5.50Local Police and Fire 7.50
DormantsAll members 2.50%
Vacation PayMembers eligible to receive a lump-sum payment of unused vacation pay are assumed to receive increases in their final
average salary in accordance with the table below. This adjustment is not applied to disability benefits. These rates were adopted December 31, 2010.
RatesTier One Non-School District/Judges 1.0%Tier One School District 0.25Tier Two 0.0
Duration School District Other General
ServicePolice and
Fire5 2.05% 1.97% 2.55%
10 1.11 1.00 1.2015 0.35 0.51 0.6720 (0.18) 0.33 0.59

Oregon Public Employees Retirement System
• 80 •
Retiree Healthcare ParticipationThe following percentages of eligible retiring members are assumed to elect RHIPA and RHIA coverage.
RHIPA 13%RHIAHealthy Retired 48%Disabled Retired 20
The RHIA disabled retired rate was first adopted December 31, 2008. All other rates were first adopted effective December 31, 2010.
Actuarial Methods and Assumptions — OPSRPMost of the methods and assumptions adopted for the OPSRP valuation are the same as those used for Tier One/Tier
Two. A summary of the methods and assumptions that differ for OPSRP are summarized below. The Board adopted the following methods, procedures, and assumptions for the December 31, 2010 and December 31, 2011 actuarial valuations.
Actuarial Methods and Valuation ProceduresOPSRP UAL amortization Gains and losses between odd-year valuations are amortized as a level percentage of combined valuation payroll (Tier One/Tier Two plus OPSRP payroll) over 16 years from the valuation in which they are first recognized.
Economic AssumptionsAdministrative expenses: $6.6 million per year is added to the normal cost.
Demographic Assumptions Retirement Assumptions Retirement from Active Status
Police and Fire General Service
Age <13 years 13-24 years 25+ years <15 years 15-29 years 30+ years50 1.0% 2.0% 5.5%51 1.0 2.0 5.5 52 1.0 2.0 5.553 1.0 2.0 30.054 1.0 2.0 16.555 3.0 5.0 16.5 1.0% 5.0% 5.0%56 3.0 5.0 16.5 1.0 4.0 5.057 3.0 5.0 16.5 1.0 3.0 7.558 3.0 5.0 16.5 2.0 3.0 35.059 3.0 5.0 16.5 2.0 3.0 25.060 3.0 15.0 16.5 4.0 3.75 20.061 3.0 8.5 16.5 4.0 5.0 20.062 13.0 22.0 35.0 7.0 12.0 30.063 8.0 20.0 30.0 6.0 10.0 20.064 8.0 10.0 30.0 6.0 10.0 20.065 100.0 100.0 100.0 14.0 40.0 20.066 17.25 33.0 20.067 12.0 22.0 30.068 10.0 17.0 20.069 10.0 17.0 20.070 100.0 100.0 100.0

Oregon Public Employees Retirement System
• 81 •
Retirement from Dormant StatusDormant members are assumed to retire at Normal Retirement Age.
Termination AssumptionsThe termination rates are based on three-year select and ultimate rates, with the ultimate rates being the same as the
Tier One/Tier Two termination rates. The following table illustrates sample rates at several ages.
Age School District Police and Fire1st Select
Period2nd Select
Period3rd Select
Period Ultimate1st Select
Period2nd Select
Period3rd Select
Period Ultimate25 11.32% 9.98% 8.64% 7.30% 12.73% 10.18% 7.64% 5.09%35 6.78 5.89 5.00 4.11 6.53 5.22 3.92 2.6145 4.83 4.14 3.45 2.76 4.45 3.56 2.67 1.78
Age Other General Service Male Other General Service Female1st Select
Period2nd Select
Period3rd Select
Period Ultimate1st Select
Period2nd Select
Period3rd Select
Period Ultimate25 20.91% 17.93% 14.94% 11.95% 21.23% 18.20% 15.16% 12.13%35 13.36 9.29 7.74 6.19 13.09 10.92 9.74 7.2845 10.73 6.58 5.04 3.28 12.86 7.81 6.59 3.96
Changes in Actuarial Methods and Assumptions — Tier One/Tier Two and OPSRPA summary of key changes implemented since the December 31, 2010 valuation are described briefly below. Additional
detail and a comprehensive list of changes in methods and assumptions can be found in the report entitled 2010 Experience Study.
Changes in Actuarial Methods and Allocation Procedures There were no changes to actuarial methods since the December 31, 2010 actuarial valuation.
Changes in Economic and Demographic AssumptionsThere were no changes to assumptions since the December 31, 2010 actuarial valuation.

Oregon Public Employees Retirement System
• 82 •
Actuarial Schedules
Schedule of Active Member Valuation Data
Valuation Date Count
Annual Payroll in
Thousands1
AverageAnnual
Pay% Increase inAverage Pay
Number ofParticipating Employers2
12/31/2002 159,287 $ 6,383,475 $ 40,075 2.8% N/A12/31/2003 153,723 6,248,550 40,648 1.4 N/A 12/31/2004 142,635 6,306,447 44,214 8.8 806
12/31/20053 156,501 6,791,891 43,398 (1.8) 81012/31/2006 163,261 7,326,798 44,878 3.4 75812/31/2007 167,023 7,721,819 46,232 3.0 76012/31/2008 170,569 8,130,136 47,665 3.1 76612/31/2009 178,606 8,512,192 47,659 0.0 77612/31/20104 193,569 8,750,064 45,204 (5.2) 78712/31/2011 170,972 8,550,511 50,011 10.6% 791
1 The annual payroll excludes the member pick-up, if any. 2 Effective in 2006, participating employers are defined for this purpose as any employer with covered payroll during the prior year. In prior years,
employers with liabilities but without covered payroll were included as well.3 Effective with the 12/31/2005 valuation, OPSRP members and payroll are included. 4 In the December 31, 2010 valuation only approximately 16,000 active records with very low annual pay (average <$5,000) were reported. The inclusion of those records for a single valuation did not significantly affect plan liabilities, but it did affect the per-participant pay averages and the year-to-year changes to those averages for 2010 and 2011.
Schedule of Retirees and Beneficiaries Added to and Removed From Rolls(Annual Allowances are shown in thousands)5
Added to Rolls Removed from Rolls Rolls - End of Year
Valuation Date Count
Annual Allowances Count
Annual Allowances Count
Annual Allowances
% Increase in Annual
Allowances1
Average Annual
Allowances12/31/2002 89,482 $ 1,722,865 13.8% $ 19,25412/31/2003 97,777 2,040,533 8.4 20,869
12/31/20042 6,754 $149,474 2,863 $ 35,151 101,668 2,154,856 5.6 21,195 12/31/20052 4,472 149,127 3,217 36,784 102,923 2,267,198 5.2 22,02812/31/2006 5,060 151,240 3,263 39,735 104,720 2,378,704 4.9 22,715
12/31/20072 5,385 183,232 3,304 40,590 106,801 2,521,345 6.0 23,608 12/31/20082 5,963 171,484 3,626 47,062 109,138 2,645,767 4.9 24,242 12/31/20092 6,377 226,713 3,374 46,228 112,141 2,826,252 6.8 25,20312/31/2010 6,359 217,424 3,512 51,627 114,988 2,992,048 5.9 26,02112/31/2011 8,715 282,0983 3,679 55,633 120,0244 3,218,514 7.6 26,816
1 Since last valuation date.2 Annual allowances reflect estimated adjustments to retiree benefits due to the implementation of the Strunk v. PERB, et al. and City of Eugene v. State
of Oregon, PERB, et al. decisions.3 The amount shown as “added to rolls” in annual allowances includes the value of COLA increases to continuing retirees.4 For the purposes of this exhibit, a retired members who is also a surviving beneficiary of a deceassed retiree is counted twice.5 Discrepencies contained in this table are the result of rounding differences.

Oregon Public Employees Retirement System
• 83 •
Schedules of Funding Progress by Rate Pool(dollar amounts in millions) 8
ActuarialValuation Date
ActuarialValue of Assets1,2
(a)
ActuarialAccrued
Liability (AAL)2
(b)
Unfunded AAL(UAAL)2
(b-a)Funded Ratio
(a/b)
Covered Payroll3
(c)
UAAL as a% of
CoveredPayroll((b-a)/c)
Tier One/Tier Two State and Local Government Rate Pool 12/31/20054 $ 25,556.3 $ 24,450.3 $ (1,106.0) 104.5 % $ 3,089.8 (35.8)%12/31/2006 28,177.2 25,390.0 (2,787.3) 111.0 3,174.6 (87.8)
12/31/20075 30,314.8 26,883.1 (3,431.7) 112.8 3,448.1 (99.5)12/31/2008 22,301.2 27,551.8 5,250.6 80.9 3,452.7 152.1
12/31/20096 25,068.8 29,029.1 3,960.3 86.4 3,465.1 114.312/31/2010 26,499.5 30,285.0 3,785.4 87.5 3,333.1 113.612/31/2011 25,679.2 31,109.1 5,429.9 82.5 3,179.3 170.8
Tier One/Tier Two School District Rate Pool12/31/2005 21,095.0 20,151.8 (943.2) 104.7 2,126.5 (44.4)12/31/2006 23,033.4 20,825.0 (2,208.4) 110.6 2,233.7 (98.9)12/31/2007 24,053.6 21,299.3 (2,754.3) 112.9 2,185.0 (126.1)12/31/2008 17,458.5 21,742.7 4,284.2 80.3 2,153.7 198.912/31/2009 19,388.0 22,517.6 3,129.6 86.1 2,079.2 150.512/31/2010 20,343.5 23,303.3 2,959.8 87.3 2,027.5 146.012/31/2011 19,668.2 23,973.7 4,305.5 82.0 1,880.7 228.9
Tier One/Tier Two Independent Employers and Judiciary 12/31/20054 4,742.9 4,575.0 (167.9) 103.7 894.9 (18.8)12/31/2006 5,330.5 4,860.1 (470.4) 109.7 928.1 (50.7)
12/31/20075 4,765.5 4,423.2 (342.3) 107.7 628.8 (54.4)12/31/2008 3,576.7 4,566.0 989.3 78.3 619.4 159.7
12/31/20096 3,926.7 4,665.9 739.3 84.2 579.1 127.712/31/2010 4,189.4 4,913.1 723.7 85.3 569.7 127.012/31/2011 4,083.2 5,069.8 986.6 80.5 547.9 180.1
OPSRP Rate Pool12/31/2006 151.4 115.0 (36.4) 131.6 990.4 (3.7)12/31/2007 275.1 203.0 (72.1) 135.5 1,459.9 (4.9)12/31/2008 270.5 336.8 66.3 80.3 1,904.3 3.512/31/2009 445.4 535.5 90.1 83.2 2,388.8 3.812/31/2010 659.0 767.6 108.6 85.8 2,819.8 3.912/31/2011 840.5 986.4 145.9 85.2 2,942.6 5.0
Postemployment Healthcare Benefits - Retirement Health Insurance Account12/31/2005 181.0 495.9 314.9 36.5 6,111.2 5.212/31/2006 221.3 511.8 290.5 43.2 6,336.4 4.612/31/2007 250.8 499.6 248.8 50.2 6,261.9 4.012/31/2008 183.8 494.0 310.2 37.2 6,225.8 5.012/31/2009 214.1 511.2 297.1 41.9 6,123.4 4.912/31/2010 232.3 547.1 314.8 42.5 5,930.3 5.312/31/2011 239.6 461.1 221.5 52.0 5,607.9 3.9
Postemployment Healthcare Benefits - Retiree Health Insurance Premium Account12/31/2005 6.1 27.0 20.9 22.7 1,621.2 1.312/31/2006 7.0 23.4 16.4 30.0 1,665.7 1.012/31/2007 7.8 23.3 15.5 33.6 1,692.1 0.912/31/2008 5.7 21.3 15.6 26.7 1,708.5 0.912/31/2009 6.4 24.5 18.2 25.9 1,705.1 1.112/31/2010 5.7 33.9 28.2 16.8 1,603.3 1.812/31/2011 4.5 34.4 29.9 13.2 1,539.5 1.9
Notes:1 Side account assets are included with Tier One/Tier Two assets.2 Excludes $162 million for Multnomah Fire District UAAL; as a result, the actuarial value of asset and actuarial accrued liability amounts reported in this schedule differ from the amounts reported in the basic financial statements on pages 34 and 53.3 Covered payroll shown is payroll for members of the rate pool benefiting from the specified program. For example, Tier One/Tier Two School District payroll is only payroll for Tier One/Tier Two members and excludes OPSRP. For the postemployment healthcare benefit plans—Retirement Health Insurance Account and Retiree Health Insurance Premium Account, the covered payroll shown reflects payroll amounts over which UAALs are amortized and includes both Tier One/Tier Two and OPSRP. This differs from the covered payroll amounts reported in the basic financial statements on pages 34 and 53, which only reflect payroll for Tier One/Tier Two members eligible for those programs.4 Reflects the transfer in assets and liabilities for new employers that joined the SLGRP effective January 1, 2006.5 Reflects the transfer in assets and liabilities for new employers that joined the SLGRP effective January 1, 2008.6 Reflects the transfer in assets and liabilities for new employers that joined the SLGRP effective January 1, 2010.7 Reflects the transfer in assets and liabilities for new employers that joined the SLGRP effective January 1, 2012. 8 Discrepancies contained in this table are the result of rounding differences.

Oregon Public Employees Retirement System
• 84 •
Actuarial Schedules
Analysis of Financial Experience
Gains and Losses in Unfunded Accrued Liabilities During Year Ended December 31Resulting from Differences Between Assumed Experience and Actual Experience(dollar amounts in millions) 1
$ Gain/(Loss) for YearPension and Retiree Healthcare Plans 2011 2010
Type of ActivityRetirements from Active Status $ (68.2) $ (134.0)Active Mortality and Withdrawal 19.1 (37.4) Pay Increases 130.7 121.4 Contributions (37.9) 26.1 Interest Crediting Experience 171.9 (70.0) Investment Income (2,372.9) 1,455.9Retirement, Mortality, and Lump Sums from Dormant Status 38.3 98.1 Retiree and Beneficiary Mortality (110.0) (127.6) Data Corrections 27.7 (5.2) COLA Experience 54.0 29.3New Entrants (21.8) (43.4) Other (0.5) (60.1)
Gain/(Loss) During Year From Financial Experience $ (2,169.6) $ 1,253.1
Non-Recurring ItemsAssumption Changes — (243.3)
Plan Changes — —
Composite Gain/(Loss) During Year $ (2,169.6) $ 1,009.8
1 Discrepancies contained in this table are the result of rounding differences.

Oregon Public Employees Retirement System
• 85 •
Solvency Test
Defined Benefit Pension and Retiree Healthcare Plans(dollar amounts in millions)12
Actuarial Accrued Liability1
ValuationDate2
Active Member
Contributions
RetiredMembers andBeneficiaries
Other Members
ValuationAssets 1,3
Portion of Actuarial Accrued Liabilities Covered by Assets
(1) (2) (3) (1) (2) (3)
12/31/1995 $ 5,753.0 $ 7,492.8 $ 10,002.8 $ 20,957.6 100% 100% 77%12/31/1997 8,135.4 9,994.9 13,534.6 29,108.2 100 100 8112/31/1999 8,238.1 14,333.7 18,336.1 39,964.8 100 100 95 12/31/2000 10,142.5 15,664.1 17,543.9 41,804.6 100 100 9112/31/2001 10,252.8 17,465.9 18,229.0 39,852.2 100 100 6712/31/20014 10,252.8 17,340.0 10,228.8 39,852.2 100 100 12012/31/20024 9,940.7 19,339.0 10,240.8 36,316.8 100 100 6912/31/20034 9,005.8 23,625.9 11,993.9 42,874.4 100 100 8512/31/20045,6 9,073.0 25,363.0 13,547.6 45,735.3 100 100 8312/31/20057,8 9,169.7 26,602.4 14,044.7 51,569.6 100 100 11212/31/2006 9,410.8 27,711.3 14,666.2 56,844.8 100 100 13412/31/20079 9,225.0 29,157.3 15,011.8 59,586.4 100 100 14112/31/2008 8,341.5 30,537.7 15,895.7 43,710.2 100 100 3012/31/200910 8,392.0 32,484.2 16,470.1 48,949.7 100 100 4912/31/2010 8,407.9 34,432.5 17,070.2 51,821.6 100 100 5312/31/201111 7,779.7 37,362.4 16,551.8 50,412.4 100 100 32
1 Includes effect of Multnomah Fire District (net UAAL of $162 million as of 12/31/2011); assets in December 31, 2011 amount excludes $535.3 million of Contigency Reserve assets.
2 An extensive revision of the actuarial assumptions occurs prior to each odd-year valuation; therefore, the figures are not directly comparable. Effective with the December 31, 2006 valuation, revisions to actuarial assumptions occur prior to each even-year valuation.
3 Effective with the December 31, 2002 valuation, includes the value of UAL Lump Sum Side Accounts.4 The 2001 valuation was revised to include the impact of PERS Reform Legislation enacted in 2003. Figures for December 31, 2003, do not
reflect the judicial review or subsequent Board action.5 Effective with the 2004 valuation, the Oregon Supreme Court rulings in Strunk v. PERB, et al.(issued March 8, 2005) and City of Eugene v.
State of Oregon, PERB, et al. (issued August 11, 2005) are reflected.6 Effective with the 2004 valuation, the cost method was changed from Entry Age Normal to Projected Unit Credit, and the actuarial value of
assets was changed from a four-year smoothed value to market value.7 Assets and liabilities for OPSRP are first valued in the 2005 valuation.8 Reflects the transfer in assets and liabilities for new employers that joined the SLGRP effective January 1, 2006.9 Reflects the transfer in assets and liabilities for new employers that joined the SLGRP effective January 1, 2008.10 Reflects the transfer in assets and liabilities for new employers that joined the SLGRP effective January 1, 2010.11 Reflects the transfer in assets and liabilities for new employers that joined the SLGRP effective January 1, 2012.12 Discrepancies contained in this table are the result of rounding differences.

Oregon Public Employees Retirement System
• 86 •
Plan Summary
Membership All employees of public employers participating in this System who are in qualifying positions become members of the System after completing six months of service except those who are eligible for and have elected to participate in an optional retirement plan. Different benefit provisions of the plan apply based on date of hire.Tier One Hired prior to 1996Tier Two Hired after 1995 and before August 29, 2003OPSRP Hired after August 28, 2003, not a judge, and not a former Tier One/Tier Two
member eligible to reestablish Tier One/Tier Two membership.Judges Members of the state Judiciary
Employee Contributions
Judges 7 percent of salary
All others NoneEmployer Contributions
Set by the PERS Board based on actuarial calculations that follow Board rate-setting policies for em-ployers.
Summary of Chapter 238 Provisions — Tier One/ Tier Two and JudgesNormal Retirement Age
Police and Fire Age 55
Judges Age 65
Tier One General Service Age 58
Tier Two General Service Age 60Normal Retirement Allowance
For members who are not judges, the greatest of the Full Formula benefit, the Money Match benefit, or the Formula Plus Annuity benefit (only available to members who made contributions before August 21, 1981). For members with 15 or more years of creditable service, the benefit will not be less than the minimum service retirement allowance of $100 per month, as described in ORS 238.310.Full Formula The percentage multiplier from the table below multiplied by final average pay and
years of credited service, plus a prior service pension, if applicable.
Percentage Multiplier Membership Classification2.00 percent Police and Fire; Legislators1.67 percent All other members
Money Match The member’s account balance and a matching employer amount converted to an actuarially equivalent annuity.
Formula Plus Annuity
The member’s account balance converted to an actuarially equivalent cash refund annuity plus the percentage multiplier from the table below multiplied by final average pay and years of credited service, plus a prior service pension, if applicable. Percentage Multiplier Membership Classification1.35 percent Police and Fire; Legislators1.00 percent All other members
Judges Final average pay multiplied by the first percentage multiplier from the table on page 89 for up to 16 years of service plus the second percentage multiplier for any service in excess of 16 years, but not to exceed the maximum percentage of final average pay also shown on page 89. Judges must elect Plan A or Plan B no later than age 60. A “Plan B” judge must serve as a pro tem judge for a total of 175 days post-retirement.
Summary of Plan ProvisionsThe following section summarizes the plan provisions considered in the actuarial valuation. A more detailed description of plan provisions is available from the PERS administrative office.

Oregon Public Employees Retirement System
• 87 •
PlanPercentage Factor
(up to 16 years)Percentage Factor
(after 16 years)
MaximumPercentage of
Final Average Pay
A 2.8125% 1.67% 65%B 3.75 2.00 75
Final Average Salary
The greater of:• Average salary earned during the three calendar years in which the member was paid the highest sal-
ary, even if one of those years is less than a full calendar year.• Total salary earned over the last 36 months of employment divided by the actual months of service
during that 36-month period.Covered salary for this purpose includes the value of member contributions assumed and paid by employ-ers, any payment due to an employer’s participation in the Unused Sick Leave program, and, for Tier One members, lump-sum payment of unused vacation time.
Creditable Service The number of years and months an active member is paid a salary by a participating PERS employer and PERS benefits are being funded.
Prior Service Pension
Benefits payable on account of Prior Service Credit for a member’s service with a participating employer prior to the employer’s participation in PERS, as described in ORS 238.442.
SB 656/HB 3349 Adjustment
All members receive an increase to their monthly retirement benefit equal to the greater of the increase under Senate Bill 656 (SB 656) or House Bill 3349 (HB3349). The adjustment for SB 656 only applies to members who established membership prior to July 14, 1995. Effective for retirements January 1, 2012, and later, HB3349 will only apply for members who maintain residence in Oregon.SB 656Increase Years of Service General Service Police and Fire
0-910-1415-1920-2425-29
30 & Over
0.0%1.01.02.03.04.0
0.0%1.01.02.54.04.0
HB 3349Increase 1 Service prior to October 1, 1991
1 - maximum Oregon personal income tax rate
(limited to 9%)X All Service
Early Retirement Eligibility
Police and FireJudgesGeneral Service
Age 50 or 30 years of service Age 60Age 55 or 30 years of service
Early Retirement Allowance
Normal retirement allowance, actuarially reduced to early retirement age. However, there is no reduc-tion applied if a member has completed 30 years of service (25 years for police and fire members) or for judges in Plan B.
Vesting Contributions made in any part of five calendar years or attainment of age 50 (45 for police and fire) while working in a qualifying position.
Termination Benefits
Non-Vested Payment of member’s account balance.
Vested Same as normal (or early) retirement allowance, but commencement is deferred to normal (or early) retirement date.
Summary of Chapter 238 Provisions — Tier One/ Tier Two and Judges (continued)
( - 1)

Oregon Public Employees Retirement System
• 88 •
Optional Forms of RetirementAllowance
The normal form of benefit is a cash refund annuity (joint and two-thirds survivor contingent annuity for a married judge). All optional amounts are adjusted to be actuarially equivalent.
Options Available• Life annuity
• Cash refund annuity
• Life annuity guaranteed 15 years
• Joint and 50 percent or 100 percent survivor contingent annuity, with or without pop-up feature
• Partial Lump Sum: Refund of member contribution account balance plus a pension (under any op-tional form) or employer-paid portion of the Full Formula or Money Match annuity.
• Total Lump Sum: Refund of member contribution account plus a matching employer amount.Pre-retirementDeath Benefit Eligibility
Judges Six or more years of service.
All others Death occurring while the member is an employee of a participating employer or within 120 days of termination provided the employee does not withdraw the account balance or retire, or a result of injuries received while in the service of a participating employer.
Pre-retirement Death Benefit
Judges The spouse shall receive a life pension equal to two-thirds of the service retirement allowance. The beneficiary of an unmarried judge shall receive the member’s ac-cumulated contributions with interest.
All others The member’s account balance plus a matching employer amount.Additional Police and Fire Death Benefits
Upon the death of a retired police officer or firefighter, the surviving spouse or dependent children un-der age 18 will receive a monthly benefit based on 25 percent of the cash refund retirement allowance due to police and fire service.
Disability Benefit Eligibility
Duty Disablement occurring as a direct result of a job-related injury or illness, regardless of length of service.
Non-Duty Disablement occurring after 10 years of service (six years, if a judge), but prior to normal retirement eligibility.
Disability Benefits
The normal retirement allowance calculated based on the service credit that would have been earned if the member had continued working to age 58 (age 55 for police and fire, age 65 for judge members) payable commencing immediately.
Police and Fire Members’ AlternativeIn lieu of the above, police officers and firefighters who qualify for duty disability may elect to receive a benefit of 50 percent of final average monthly salary at the time of disablement.
Minimum Monthly Retirement AllowanceJudges ................... 45 percent of final average monthly salary.All others .............. $100 for a member with at least 15 years of credited service, actuarially reduced if
an optional form of benefit is chosen.
Reduction of BenefitsWhenever a disabled employee’s disability benefit and earned income for any month exceed the monthly salary received at the time of disablement or $400, if greater, the disability benefit will be reduced by the excess.
For Tier Two members, the sum of the disability benefit and any workers’ compensation benefits may not exceed the member’s salary at the time of disablement.
Waiting Time Service Purchases
Members with at least 10 years of combined credited and/or prior service under PERS may elect to purchase service credit for the six-month “waiting time” period worked prior to establishing member-ship in the system. The waiting time purchase is interest-free and must be purchased in one payment prior to retirement.
Summary of Chapter 238 Provisions — Tier One/ Tier Two and Judges (continued)

Oregon Public Employees Retirement System
• 89 •
Summary of Chapter 238 Provisions - Tier One/Tier Two and Judges (continued)Police and Fire Unit Purchases
Police and fire members may purchase 60-month annuity benefits (up to $80 per month) that must be paid out by age 65 and cannot commence prior to the earliest retirement age. The amount purchased by the member is matched by the employer. In certain situations, such as termination of employment prior to retiring or working beyond age 65, the employer’s matching purchase is forfeited.
Postretirement Adjustments
All monthly pension and annuity benefits except unit purchases are eligible for postretirement adjustments.Automatic Adjustments
Benefits are adjusted annually to reflect the increase or decrease in the Consumer Price Index (Portland area - all items) as published by the Bureau of Labor Statis-tics. The maximum adjustment to be made for any year is 2 percent of the previous year’s benefit. Any CPI change in excess of 2 percent is accumulated for future benefit adjustments, which would otherwise be less than 2 percent. No benefit will be decreased below its original amount.
Ad Hoc Adjustments
From time to time, as granted by the Legislature, retired members and beneficiaries have received increases in their monthly benefits.
Variable Annuity Program
Contributions Prior to January 1, 2004, a member could elect to have 25, 50, or 75 percent of his or her contributions invested in the variable account.
Benefit At retirement, a member may elect to receive a variable annuity with the funds ac-cumulated in his or her variable account. Alternatively, a member may elect to have all of the funds in his or her variable account transferred back to the regular account and receive an annuity from the System and cease to participate in the variable program. The employer provided benefit, however, is based on the earnings the member would have received in the regular account.
Interest Credit on Member Accounts
Tier One Regular Actuarially assumed rate of return until the rate guarantee reserve has been fully funded for three consecutive years and the Board elects to credit additional interest.
Tier Two Regular Amount determined by the Board based on actual investment earnings of the regular account.
Variable Actual earnings in variable account
Retiree Healthcare – Medicare Supplement (RHIA)
Retiree Eligibility All of the following must be met:(a) Currently receiving a retirement allowance from the System,(b) Covered for eight years before retirement,(c) Enrolled in a PERS-sponsored health plan, and(d) Enrolled in both Medicare Part A and Part B.
Surviving Spouse or Dependent Eligibility
A surviving spouse or dependent of a deceased RHIA-eligible retiree is eligible for RHIA benefits if they are enrolled in both Medicare Part A and Part B, and either of the following criteria are met:(a) Currently receiving a retirement allowance from the System, or(b) The surviving spouse or dependent was covered under the eligible retiree’s
PERS-sponsored health insurance at the time of the retiree’s death and the deceased retiree retired before May 1, 1991.
Benefit Amount A monthly contribution of up to $60 per retiree is applied toPERS-sponsored Medicare supplemental insurance costs.
Retiree Healthcare – Under Age 65 (RHIPA)
Retiree Eligibility Retired PERS members who were state employees at the time of retirement, are enrolled in a PERS-sponsored health plan, and are not eligible for Medicare.
Surviving Spouse or Dependent Eligibility
A surviving spouse or dependent of a deceased RHIPA-eligible retiree is eligible for RHIPA benefits if they are not yet eligible for Medicare, and either of the following criteria are met:(a) Currently receiving a retirement allowance from the System, or(b) The surviving spouse or dependent was covered under the eligible retiree’s
PERS-sponsored health plan at the time of the retiree’s death and the deceased retiree retired on or after September 29, 1991.
Benefit A percentage (as shown on the following page) of the maximum monthly subsidy based on years of service. The maximum monthly subsidy is calculated annually as the average difference between the health insurance premiums paid by active state employees and the premium retirees would pay if they were rated separately from active state employees.

Oregon Public Employees Retirement System
• 90 •
Summary of Chapter 238 Provisions - Tier One/Tier Two and Judges (continued)The maximum monthly subsidy for 2012 is $316 per month.
Years of Service Subsidized Amount
Under 88-9
10-1415-1920-2425-29
30 & Over
0% 50 60 70 80 90100
Benefits Not Included in the Valuation
No material benefits have been excluded from the liabilities.
Changes in Plan Provisions
House Bill 2456, signed into law in August 2011, removed the HB 3349 “tax remedy” adjustment for members who retire after 2011 and are not residents of Oregon. The effects of this legislation were not reflected in this valu-ation. In our professional judgment, reflecting the effects of HB 2456 would not have materially affected system funded status as of December 31, 2011, or 2013-2015 employer contribution rates.

Oregon Public Employees Retirement System
• 91 •
Summary of Chapter 238A Provisions - OPSRPNormal Retirement Age
Police and Fire Age 60 or age 53 with 25 years of retirement creditGeneral Service Age 65 or age 58 with 30 years of retirement creditSchool Districts Age 65 or age 58 with 30 calendar years of active membership
Normal Retirement Allowance
A single life annuity equal to final average salary times years of retirement credit attributable to service as police and fire times 1.8 percent plus final average salary times all other years of retirement credit times 1.5 percent.
Final Average Salary
The greater of:• Average salary earned during the three calendar years in which the member was paid the highest salary, even if one of those years is less than a full calendar year.• Total salary earned over the last 36 months of employment divided by the actual months of service during that 36-month period.Covered salary for this purpose includes base pay, plus overtime up to an average amount, plus bonuses, plus member contributions paid by the employer on a salary reduction basis. Excludes payments of unused vacation or accumulated sick leave at retirement and member contributions “assumed and paid” by the employer.
Early Retirement Eligibility
Police and Fire Age 50 and 5 years of vesting serviceGeneral Service Age 55 and 5 years of vesting service
Early Retirement Allowance
Normal retirement allowance, actuarially reduced to early retirement age.
Vesting Five years or attainment of normal retirement age.Vested Termination Benefit
Same as normal (or early) retirement allowance, but commencement is deferred to normal (or early) retirement date.
Optional Forms of Retirement Benefit
The normal form of benefit is a life annuity. All optional amounts are adjusted to be actuarially equivalent.Options Available• Life annuity• Joint and 50 percent or 100 percent survivor contingent benefit, with or without pop-up feature.• Lump sum if monthly normal retirement benefit is less than $200 or if lump-sum value is less
than $5,000.
Pre-Retirement Death Benefit Eligibility
Death of a vested member before retirement benefits begin.
Pre-Retirement Death Benefit
If member was eligible for early retirement, the actuarial equivalent of 50 percent of the early retirement benefit the participant was eligible to receive at date of death. If member was not eligible for early retirement, the actuarial equivalent of 50 percent of the early retirement benefit the participant would have been eligible to receive if he terminated employment on his date of death and retired at the earliest possible date.
Disability Benefit Eligibility
Duty Disablement occurring as a direct result of a job-related injury or ill-ness, regardless of length of service.
Non-Duty Disablement occurring after 10 years of service, but prior to normal retirement eligibility.

Oregon Public Employees Retirement System
• 92 •
Summary of Chapter 238A Provisions - OPSRP
Postretirement Adjustments
All monthly pension and annuity benefits are eligible for postretirement adjustments.Automatic Adjustments
Benefits are adjusted annually to reflect the increase or decrease in the Consumer Price Index (Portland area - all items) as published by the Bureau of Labor Statistics. The maximum adjustment to be made for any year is 2 percent of the previous year’s benefit. Any CPI change in excess of 2 percent is ac-cumulated for future benefit adjustments which would otherwise be less than 2 percent. No benefit will be decreased below its original amount.
Ad Hoc Adjustments From time to time, as granted by the Legislature, retired members and beneficiaries have received increases in their monthly benefits.
Changes in Plan Provisions
There were no changes in plan provisions since the December 31, 2010 actuarial valuation.
Disability Benefit Amounts
Pre-Retirement Benefit 45 percent of salary during last full month of employment before disability, reduced if total benefit including workers’ compensation exceeds 75 percent of salary. Benefit is payable monthly until normal retirement age.
Retirement Benefit Same formula as Normal Retirement Benefit, except:• Final average salary is adjusted to reflect cost-of-living increases
from date of disability to normal retirement age, and• Retirement credits continue to accrue from date of disability to nor-
mal retirement age.

Statistical Section

Oregon Public Employees Retirement System
• 94 •
Statistical NotesThe statistical section of the Oregon Public Employees
Retirement System (PERS or “the System”) CAFR presents detailed information as a context for understanding what the information in the financial statements, note disclo-sures, and required supplementary information says about the System’s overall financial health. The data presented was extracted from the PERS’ information systems.
Financial TrendsThese schedules contain trend information to help the
reader understand how the System’s financial performance and well being have changed over time. Financial informa-tion is presented on an accrual basis.
The Schedules of Revenues by Source, Expenses by Type, and Changes in Plan Net Assets are presented on both a fiscal and calendar year basis. The System prepares its financial statements on a fiscal-year basis but has its actuarial valuations performed on a calendar-year basis.
The Schedule of Benefit Expenses by Type provides additional detail of benefit expense for fiscal years report-ed in the aggregate in the Schedules of Expenses by Type.
The Schedule of Earnings and Crediting at December 31 shows earnings available for crediting net of administra-tive expenses and the rates approved by the Board for the programs it administers.
Operating InformationThese schedules contain data to help understand how the
information in the System’s financial reports relates to the services the System provides and the activities it performs.
The Schedule of Average OPEB Benefits for Retirement Health Insurance Account and Schedule of Average OPEB Benefits for Retiree Health Insurance Premium Account show the average monthly other post-employment health-care benefits, and the number of retirees receiving benefits under each plan.
The Schedule of Average Defined Benefit Pension Payments presents average monthly benefits, final average salary, and number of retirees still receiving benefits, by year of retirement. The year 2003 shows a large increase in retirements due to members applying for retirement before pending policy changes and legislation became effective.
The Schedule of Benefit Recipients by Benefit Type shows retired members by benefit level, benefit type, and payment option selected.
The Schedule of Retirement System Membership shows demographics of membership over a period of time. The fiscal year schedule shows membership over the last six years. The calendar-year schedule is in five-year incre-ments going back to 1985.
The Schedule of Principal Participating Employers shows the 10 employers with the largest number of cur-rent employees, along with aggregate information for the remaining employers with current employees.
The Schedule of Participating Employers lists all employers as of June 30, 2012, to show public employers of the state of Oregon participating in PERS.

Oregon Public Employees Retirement System
• 95 •
Revenues by Source - Retirement Programs For the Last Ten Years Ended June 30:
1 House Bill 3262, enacted by the 2005 Oregon Legislature, combined the OPSRP Pension Program with the existing defined benefit plan. Activity since 2005 includes activity of the OPSRP Pension Program.
2 The Oregon Public Service Retirement Plan was added to the System in January 2004.
Defined Benefit Pension Plan1
Employer ContributionsFiscal Year
MemberContributions Dollars
Percent of AnnualCovered Payroll
Net Investmentand Other Income Total
2003 $ 400,988,567 $ 2,578,989,169 39.91% $ 1,465,990,471 $ 4,445,968,2072004 185,693,017 3,166,153,073 63.39 7,182,539,171 10,534,385,2612005 9,590,285 815,807,985 14.77 5,686,759,377 6,512,157,6472006 9,611,666 783,921,381 12.70 6,919,097,410 7,712,630,4572007 13,680,980 597,372,229 8.70 10,589,123,834 11,200,177,0432008 11,937,362 763,164,823 10.30 (2,804,736,029) (2,029,633,844)2009 8,452,030 649,706,891 7.88 (12,903,220,545) (12,245,061,624)
2010 13,600,476 433,268,434 4.88 7,279,890,664 7,726,759,574 2011 14,024,484 424,101,414 5.30 10,931,390,952 11,369,516,850 2012 16,534,650 830,123,405 9.69 380,749,755 1,227,407,810
Oregon Public Service Retirement Plan2
Individual Account ProgramEmployer Contributions
Fiscal Year
MemberContributions Dollars
Percent of AnnualCovered Payroll
Net Investmentand Other Income Total
2004 $ 201,306,142 $ N/A N/A% $ 1,606,791 $ 202,912,9332005 362,893,934 N/A N/A 51,969,806 414,863,7402006 417,555,791 N/A N/A 139,735,992 557,291,7832007 439,720,328 N/A N/A 309,126,786 748,847,1142008 465,517,744 N/A N/A (54,596,058) 410,921,6862009 495,933,952 N/A N/A (553,146,972) (57,213,020)2010 505,922,492 N/A N/A 393,651,362 899,573,854
2011 513,715,949 N/A N/A 735,695,057 1,249,411,006 2012 516,174,983 N/A N/A 71,535,911 587,710,894
Deferred Compensation PlanEmployer Contributions
Fiscal Year
MemberContributions Dollars
Percent of AnnualCovered Payroll
Net Investmentand Other Income Total
2003 $ 50,279,420 $ N/A N/A% $ 15,987,532 $ 66,266,9522004 56,479,388 N/A N/A 79,874,001 136,353,3892005 56,542,080 N/A N/A 53,506,406 110,048,4862006 59,724,202 N/A N/A 70,672,287 130,396,4892007 66,152,631 N/A N/A 129,511,435 195,664,0662008 70,448,534 N/A N/A (74,030,166) (3,581,632)2009 66,727,977 N/A N/A (142,099,959) (75,371,982)2010 66,708,970 N/A N/A 84,417,201 151,126,171
2011 73,291,691 N/A N/A 176,999,516 250,291,207 2012 80,632,698 N/A N/A 9,841,830 90,474,528

Oregon Public Employees Retirement System
• 96 •
Expenses by Type - Retirement Programs For the Last Ten Years Ended June 30:
Defined Benefit Pension Plan1
Fiscal Year Benefits
AdministrativeExpenses3 Refunds Total
2003 $ 1,978,887,202 $ 16,784,817 $ 42,640,295 $ 2,038,312,3142004 2,495,222,891 26,318,257 42,193,518 2,563,734,6662005 2,340,813,964 34,549,034 60,241,863 2,435,604,8612006 2,371,628,570 24,350,573 33,172,837 2,429,151,9802007 2,574,588,942 29,214,866 41,222,535 2,645,026,3432008 2,768,305,300 27,061,038 50,660,781 2,846,027,1192009 2,790,218,464 26,195,676 36,548,963 2,852,963,1032010 2,915,568,801 28,512,343 25,692,404 2,969,773,5482011 3,203,938,769 29,256,747 26,487,226 3,259,682,7422012 3,295,709,818 33,102,667 34,020,450 3,362,832,935
Oregon Public Service Retirement Plan2
Individual Account Program
Fiscal Year Benefits
AdministrativeExpenses Refunds Total
2004 $ N/A $ 1,400,300 $ N/A $ 1,400,3002005 1,234,891 5,243,347 N/A 6,478,2382006 14,791,999 6,237,195 N/A 21,029,1942007 36,379,230 7,291,683 N/A 43,670,9132008 55,478,104 7,871,419 N/A 63,349,5232009 49,534,423 8,413,392 N/A 57,947,8152010 72,802,216 7,673,682 N/A 80,475,8982011 133,970,603 6,810,487 N/A 140,781,0902012 224,729,644 7,698,098 N/A 232,427,742
Deferred Compensation Plan
Fiscal Year Benefits
AdministrativeExpenses Refunds Total
2003 $ 33,596,122 $ 660,144 $ N/A $ 34,256,2662004 40,377,599 759,180 N/A 41,136,7792005 39,406,579 703,809 N/A 40,110,3882006 40,544,067 884,438 N/A 41,428,5052007 49,835,260 606,410 N/A 50,441,6702008 50,366,273 800,668 N/A 51,166,9412009 38,858,335 816,033 N/A 39,674,3682010 45,901,913 889,647 N/A 46,791,5602011 55,929,452 1,326,224 N/A 57,255,6762012 61,465,377 417,776 N/A 61,883,153
1 House Bill 3262, enacted by the 2005 Oregon Legislature, combined the OPSRP Pension Program with the existing defined benefit plan. Activity since 2005 includes activity of the OPSRP Pension Program.
2 The Oregon Public Service Retirement Plan was added to the System in January 2004.3 Balances restated for fiscal years 2004 to 2009 due to prior period adjustment.
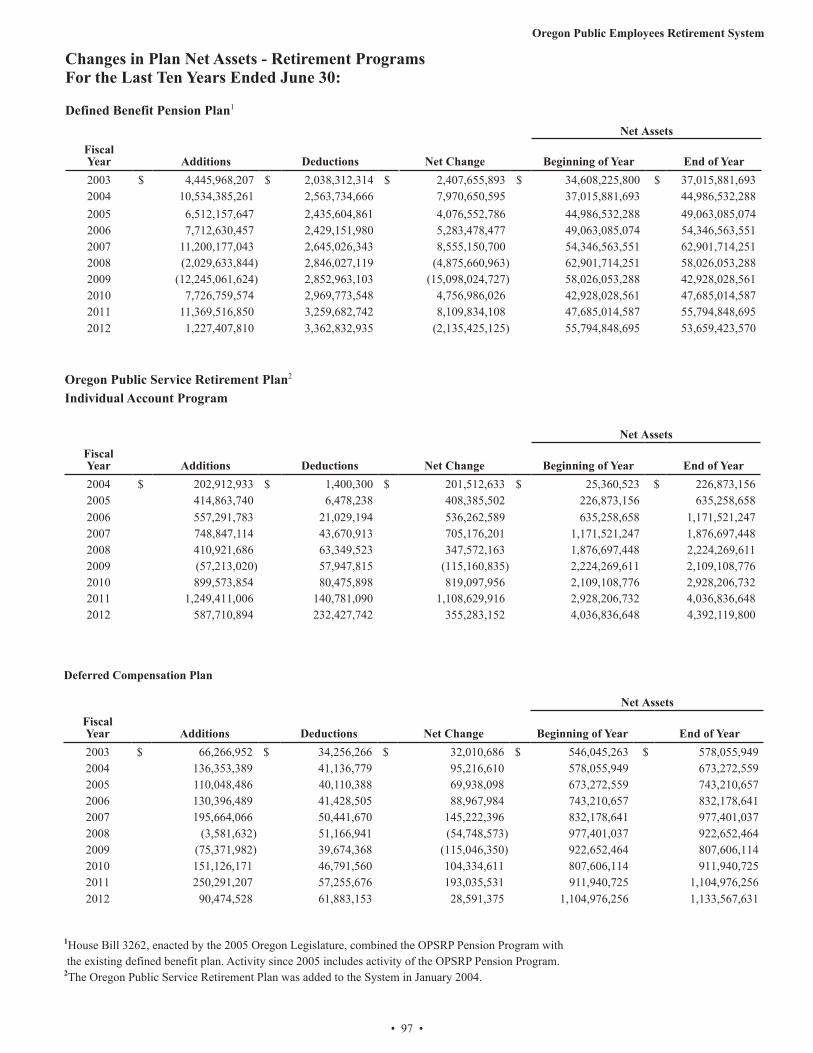
Oregon Public Employees Retirement System
• 97 •
Changes in Plan Net Assets - Retirement ProgramsFor the Last Ten Years Ended June 30:
Defined Benefit Pension Plan1
Net AssetsFiscal Year Additions Deductions Net Change Beginning of Year End of Year2003 $ 4,445,968,207 $ 2,038,312,314 $ 2,407,655,893 $ 34,608,225,800 $ 37,015,881,6932004 10,534,385,261 2,563,734,666 7,970,650,595 37,015,881,693 44,986,532,2882005 6,512,157,647 2,435,604,861 4,076,552,786 44,986,532,288 49,063,085,0742006 7,712,630,457 2,429,151,980 5,283,478,477 49,063,085,074 54,346,563,5512007 11,200,177,043 2,645,026,343 8,555,150,700 54,346,563,551 62,901,714,2512008 (2,029,633,844) 2,846,027,119 (4,875,660,963) 62,901,714,251 58,026,053,2882009 (12,245,061,624) 2,852,963,103 (15,098,024,727) 58,026,053,288 42,928,028,5612010 7,726,759,574 2,969,773,548 4,756,986,026 42,928,028,561 47,685,014,5872011 11,369,516,850 3,259,682,742 8,109,834,108 47,685,014,587 55,794,848,6952012 1,227,407,810 3,362,832,935 (2,135,425,125) 55,794,848,695 53,659,423,570
Deferred Compensation Plan
Net AssetsFiscal Year Additions Deductions Net Change Beginning of Year End of Year2003 $ 66,266,952 $ 34,256,266 $ 32,010,686 $ 546,045,263 $ 578,055,9492004 136,353,389 41,136,779 95,216,610 578,055,949 673,272,5592005 110,048,486 40,110,388 69,938,098 673,272,559 743,210,6572006 130,396,489 41,428,505 88,967,984 743,210,657 832,178,6412007 195,664,066 50,441,670 145,222,396 832,178,641 977,401,0372008 (3,581,632) 51,166,941 (54,748,573) 977,401,037 922,652,4642009 (75,371,982) 39,674,368 (115,046,350) 922,652,464 807,606,1142010 151,126,171 46,791,560 104,334,611 807,606,114 911,940,7252011 250,291,207 57,255,676 193,035,531 911,940,725 1,104,976,2562012 90,474,528 61,883,153 28,591,375 1,104,976,256 1,133,567,631
1House Bill 3262, enacted by the 2005 Oregon Legislature, combined the OPSRP Pension Program with the existing defined benefit plan. Activity since 2005 includes activity of the OPSRP Pension Program.2The Oregon Public Service Retirement Plan was added to the System in January 2004.
Oregon Public Service Retirement Plan2
Individual Account Program
Net AssetsFiscalYear Additions Deductions Net Change Beginning of Year End of Year2004 $ 202,912,933 $ 1,400,300 $ 201,512,633 $ 25,360,523 $ 226,873,1562005 414,863,740 6,478,238 408,385,502 226,873,156 635,258,6582006 557,291,783 21,029,194 536,262,589 635,258,658 1,171,521,2472007 748,847,114 43,670,913 705,176,201 1,171,521,247 1,876,697,4482008 410,921,686 63,349,523 347,572,163 1,876,697,448 2,224,269,6112009 (57,213,020) 57,947,815 (115,160,835) 2,224,269,611 2,109,108,7762010 899,573,854 80,475,898 819,097,956 2,109,108,776 2,928,206,7322011 1,249,411,006 140,781,090 1,108,629,916 2,928,206,732 4,036,836,6482012 587,710,894 232,427,742 355,283,152 4,036,836,648 4,392,119,800

Oregon Public Employees Retirement System
• 98 •
Revenues by Source - OPEB For the Last Ten Years Ended June 30:
Retirement Health Insurance AccountEmployer Contributions
Fiscal Year
MemberContributions Dollars
Percent of AnnualCovered Payroll
Net Investmentand Other Income Total
2003 $ N/A $ 41,248,903 0.64% $ 2,890,216 $ 44,139,1192004 N/A 40,619,811 0.64 20,706,960 61,326,7712005 N/A 37,308,769 0.64 17,106,276 54,415,0452006 N/A 38,162,075 0.59 23,296,256 61,458,3312007 N/A 41,171,759 0.59 39,609,224 80,780,9832008 N/A 27,783,093 0.37 (10,246,057) 17,537,0362009 N/A 28,812,705 0.37 (52,278,868) (23,466,163)2010 N/A 22,351,240 0.29 31,145,418 53,496,6582011 N/A 22,176,966 0.29 47,359,659 69,536,6252012 N/A 46,464,958 0.54 3,023,553 49,488,511
Retiree Health Insurance Premium Account
Employer ContributionsFiscal Year
MemberContributions Dollars
Percent of AnnualCovered Payroll
Net Investmentand Other Income Total
2003 $ N/A $ 1,599,744 0.09% $ 46,286 $ 1,646,0302004 N/A 3,100,423 0.16 642,012 3,742,4352005 N/A 2,344,259 0.16 594,376 2,938,6352006 N/A 2,190,254 0.13 777,757 2,968,0112007 N/A 2,399,843 0.13 1,301,049 3,700,8922008 N/A 1,791,179 0.10 (312,725) 1,478,4542009 N/A 2,005,173 0.10 (1,578,384) 426,7892010 N/A 1,496,640 0.08 939,274 2,435,9142011 N/A 1,428,453 0.08 1,135,114 2,563,5672012 N/A 3,378,230 0.13 16,723 3,394,953

Oregon Public Employees Retirement System
• 99 •
Expenses by Type - OPEB For the Last Ten Years Ended June 30:
Retirement Health Insurance Account
Fiscal Year Benefits
AdministrativeExpenses Refunds Total
2003 $ 23,906,241 $ 724,104 $ N/A $ 24,630,3452004 24,632,880 708,696 N/A 25,341,5762005 25,282,377 777,979 N/A 26,060,3562006 26,059,316 887,743 N/A 26,947,0592007 26,887,060 876,363 N/A 27,763,4232008 27,624,361 899,601 N/A 28,523,9622009 28,262,580 958,311 N/A 29,220,8912010 28,821,538 974,988 N/A 29,796,5262011 29,251,771 1,039,603 N/A 30,291,3742012 29,935,920 963,843 N/A 30,899,763
Retirement Health Insurance Premium Account
Fiscal Year Benefits
AdministrativeExpenses Refunds Total
2003 $ 1,367,993 $ 116,422 $ N/A $ 1,484,4152004 1,656,993 62,320 N/A 1,719,3132005 1,922,701 81,816 N/A 2,004,5172006 2,120,368 143,252 N/A 2,263,6202007 2,047,322 119,875 N/A 2,167,1972008 1,906,431 104,880 N/A 2,011,3112009 1,926,236 115,770 N/A 2,042,0062010 2,307,059 103,645 N/A 2,410,7042011 3,024,382 161,559 N/A 3,185,9412012 3,885,769 71,981 N/A 3,957,750

Oregon Public Employees Retirement System
• 100 •
Changes in Plan Net Assets - OPEBFor the Last Ten Years Ended June 30:
Retirement Health Insurance Account
Net AssetsFiscalYear Additions Deductions Net Change Beginning of Year End of Year2003 $ 44,139,119 $ 24,630,345 $ 19,508,774 $ 77,342,137 $ 96,850,9112004 61,326,771 25,341,576 35,985,195 96,850,911 132,836,1062005 54,415,045 26,060,356 28,354,689 132,836,106 161,190,7952006 61,458,331 26,947,059 34,511,272 161,190,795 195,702,0672007 80,780,983 27,763,423 53,017,560 195,702,067 248,719,6272008 17,537,036 28,523,962 (10,986,926) 248,719,627 237,732,7012009 (23,466,163) 29,220,891 (52,687,054) 237,732,701 185,045,6472010 53,496,658 29,796,527 23,700,131 185,045,647 208,745,7782011 69,536,625 30,291,374 39,245,251 208,745,778 247,991,0292012 49,488,511 30,899,763 18,588,748 247,991,029 266,579,777
Retiree Health Insurance Premium Account
Net AssetsFiscal Year Additions Deductions Net Change Beginning of Year End of Year2003 $ 1,646,030 $ 1,484,415 $ 161,615 $ 2,510,475 $ 2,672,0902004 3,742,435 1,719,313 2,023,122 2,672,090 4,695,2122005 2,938,635 2,004,517 934,118 4,695,212 5,629,3302006 2,968,011 2,263,620 704,391 5,629,330 6,333,7212007 3,700,892 2,167,197 1,533,695 6,333,721 7,867,4162008 1,478,454 2,011,311 (532,857) 7,867,416 7,334,5592009 426,789 2,042,006 (1,615,217) 7,334,559 5,719,3422010 2,435,914 2,410,703 25,211 5,719,342 5,744,5532011 2,563,567 3,185,941 (622,374) 5,744,553 5,122,1792012 3,394,953 3,957,750 (562,797) 5,122,179 4,559,382
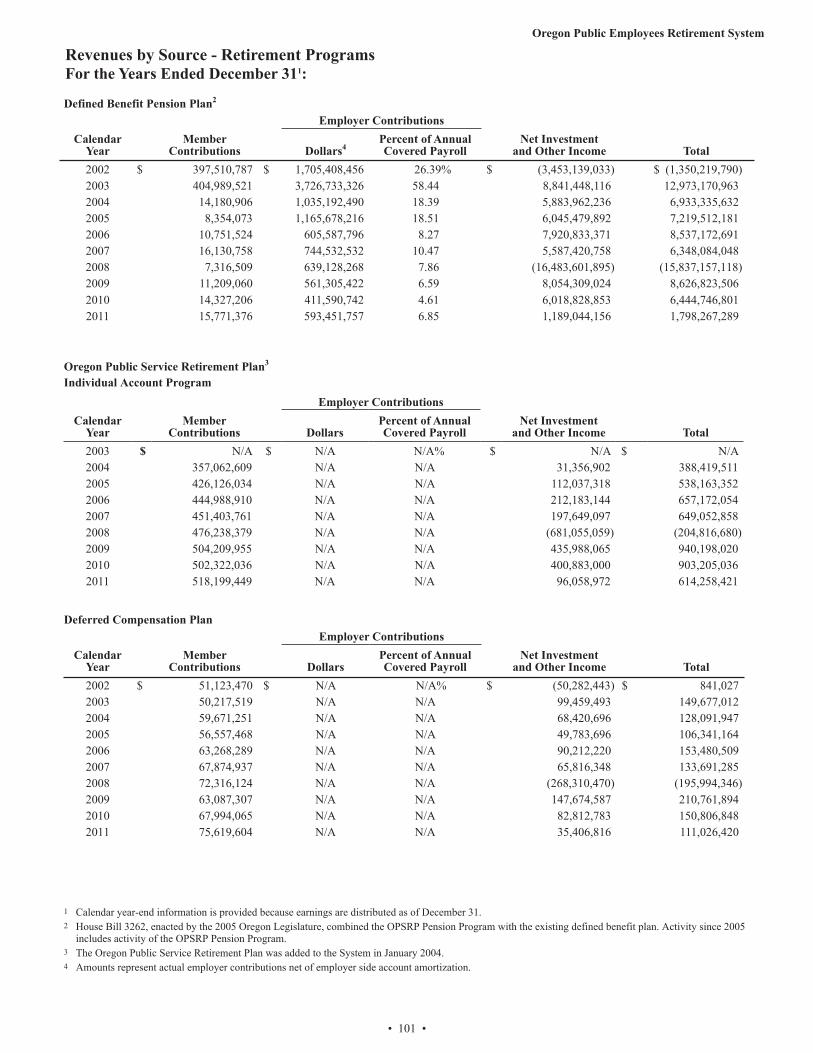
Oregon Public Employees Retirement System
• 101 •
Revenues by Source - Retirement ProgramsFor the Years Ended December 311:
Defined Benefit Pension Plan2
Employer ContributionsCalendar
YearMember
Contributions Dollars4Percent of AnnualCovered Payroll
Net Investmentand Other Income Total
2002 $ 397,510,787 $ 1,705,408,456 26.39% $ (3,453,139,033) $ (1,350,219,790)2003 404,989,521 3,726,733,326 58.44 8,841,448,116 12,973,170,9632004 14,180,906 1,035,192,490 18.39 5,883,962,236 6,933,335,6322005 8,354,073 1,165,678,216 18.51 6,045,479,892 7,219,512,1812006 10,751,524 605,587,796 8.27 7,920,833,371 8,537,172,6912007 16,130,758 744,532,532 10.47 5,587,420,758 6,348,084,0482008 7,316,509 639,128,268 7.86 (16,483,601,895) (15,837,157,118)2009 11,209,060 561,305,422 6.59 8,054,309,024 8,626,823,5062010 14,327,206 411,590,742 4.61 6,018,828,853 6,444,746,8012011 15,771,376 593,451,757 6.85 1,189,044,156 1,798,267,289
Deferred Compensation PlanEmployer Contributions
Calendar Year
MemberContributions Dollars
Percent of AnnualCovered Payroll
Net Investmentand Other Income Total
2002 $ 51,123,470 $ N/A N/A% $ (50,282,443) $ 841,0272003 50,217,519 N/A N/A 99,459,493 149,677,0122004 59,671,251 N/A N/A 68,420,696 128,091,9472005 56,557,468 N/A N/A 49,783,696 106,341,1642006 63,268,289 N/A N/A 90,212,220 153,480,5092007 67,874,937 N/A N/A 65,816,348 133,691,2852008 72,316,124 N/A N/A (268,310,470) (195,994,346)2009 63,087,307 N/A N/A 147,674,587 210,761,8942010 67,994,065 N/A N/A 82,812,783 150,806,8482011 75,619,604 N/A N/A 35,406,816 111,026,420
1 Calendar year-end information is provided because earnings are distributed as of December 31.2 House Bill 3262, enacted by the 2005 Oregon Legislature, combined the OPSRP Pension Program with the existing defined benefit plan. Activity since 2005
includes activity of the OPSRP Pension Program.3 The Oregon Public Service Retirement Plan was added to the System in January 2004.4 Amounts represent actual employer contributions net of employer side account amortization.
Oregon Public Service Retirement Plan3
Individual Account ProgramEmployer Contributions
Calendar Year
MemberContributions Dollars
Percent of AnnualCovered Payroll
Net Investmentand Other Income Total
2003 $ N/A $ N/A N/A% $ N/A $ N/A2004 357,062,609 N/A N/A 31,356,902 388,419,5112005 426,126,034 N/A N/A 112,037,318 538,163,3522006 444,988,910 N/A N/A 212,183,144 657,172,0542007 451,403,761 N/A N/A 197,649,097 649,052,8582008 476,238,379 N/A N/A (681,055,059) (204,816,680)2009 504,209,955 N/A N/A 435,988,065 940,198,0202010 502,322,036 N/A N/A 400,883,000 903,205,0362011 518,199,449 N/A N/A 96,058,972 614,258,421

Oregon Public Employees Retirement System
• 102 •
Defined Benefit Pension Plan2
Calendar Year Benefits
AdministrativeExpenses3 Refunds Total
2002 $ 1,746,727,771 $ 16,156,679 $ 39,767,828 $ 1,802,652,2782003 2,305,913,864 23,026,963 44,485,825 2,373,426,6522004 2,432,307,750 29,965,677 75,329,010 2,537,602,4372005 2,372,895,822 30,659,957 42,143,663 2,445,699,4422006 2,514,479,244 24,438,769 61,059,360 2,599,977,3732007 2,630,279,015 31,358,911 38,197,392 2,699,835,3182008 2,784,164,757 24,645,591 27,117,003 2,835,927,3512009 2,823,723,754 26,011,412 18,269,906 2,868,005,0722010 3,053,863,566 29,126,521 17,996,148 3,100,986,2352011 3,351,517,947 29,244,166 38,369,101 3,419,131,214
Oregon Public Service Retirement Plan4
Individual Account Program
Calendar Year Benefits
AdministrativeExpenses Refunds Total
2003 $ N/A $ 264,574 $ N/A $ 264,5742004 6,272,929 4,472,158 N/A 10,745,0872005 3,682,712 4,177,338 N/A 7,860,0502006 30,051,229 8,061,455 N/A 38,112,6842007 47,529,077 7,583,898 N/A 55,112,9752008 58,765,223 8,183,279 N/A 66,948,5022009 53,171,640 7,905,631 N/A 61,077,2712010 95,293,228 7,822,430 N/A 103,115,6582011 196,350,366 8,363,154 N/A 204,713,520
Deferred Compensation Plan
Calendar Year Benefits
AdministrativeExpenses Refunds Total
2002 $ 41,926,056 $ 691,968 $ N/A $ 42,618,0242003 38,162,887 745,559 N/A 38,908,4462004 41,080,360 748,208 N/A 41,828,5682005 38,351,898 878,538 N/A 39,230,4362006 40,706,739 684,991 N/A 41,391,7302007 50,697,210 763,382 N/A 51,460,5922008 47,955,641 795,233 N/A 48,750,8742009 37,366,503 863,699 N/A 38,230,2022010 46,759,679 804,345 N/A 47,564,0242011 60,816,774 963,874 N/A 61,780,648
Expenses by Type - Retirement ProgramsFor the Years Ended December 311:
1 Calendar year-end information is provided because earnings are distributed as of December 31.2 House Bill 3262, enacted by the 2005 Oregon Legislature, combined the OPSRP Pension Program with the existing defined benefit plan. Activity since 2005
includes activity of the OPSRP Pension Program. 4 The Oregon Public Service Retirement Plan was added to the System in January 2004.3 Balances restated for calendar years 2005 to 2009 due to prior period adjustment.4 The Oregon Public Service Retirement Plan was added to the System in January 2004.

Oregon Public Employees Retirement System
• 103 •
Changes in Plan Net Assets - Retirement ProgramsFor the Last Ten Years Ended December 311:
Defined Benefit Pension Plan2
Net AssetsCalendar
Year Additions Deductions Net Change Beginning of Year End of Year2002 $ (1,350,219,790) $ 1,802,652,278 $ (3,152,872,068) $ 36,134,157,306 $ 32,981,285,2382003 12,973,170,963 2,373,426,652 10,599,744,311 32,981,285,238 43,581,029,5492004 6,933,335,632 2,537,602,437 4,395,733,195 43,581,029,549 47,976,762,7442005 7,219,512,181 2,445,699,442 4,773,812,739 47,976,762,744 52,750,575,4832006 8,537,172,691 2,599,977,373 5,937,195,318 52,750,575,483 58,687,770,8012007 6,348,084,048 2,699,835,318 3,648,248,730 58,687,770,801 62,336,019,5312008 (15,837,157,118) 2,835,927,351 (18,673,084,469) 62,336,019,531 43,662,935,0622009 8,626,823,506 2,868,005,072 5,758,818,434 43,662,935,062 49,421,753,4962010 6,444,746,801 3,100,986,235 3,343,760,566 49,421,753,496 52,765,514,0622011 1,798,267,289 3,419,131,214 (1,620,863,925) 52,765,514,062 51,144,650,137
Deferred Compensation Plan
Net AssetsCalendar
Year Additions Deductions Net Change Beginning of Year End of Year2002 $ 841,027 $ 42,618,024 $ (41,776,997) $ 572,230,856 $ 530,453,8592003 149,677,012 38,908,446 110,768,566 530,453,859 641,222,4252004 128,091,947 41,828,568 86,263,379 641,222,425 727,485,8042005 106,341,164 39,230,436 67,110,728 727,485,804 794,596,5322006 153,480,509 41,391,730 112,088,779 794,596,532 906,685,3112007 133,691,285 51,460,592 82,230,693 906,685,311 988,916,0042008 (195,994,346) 48,750,874 (244,745,220) 988,916,004 744,170,7842009 210,761,894 38,230,202 172,531,692 744,170,784 916,702,4762010 150,806,848 47,564,024 103,242,824 916,702,476 1,019,945,3002011 111,026,420 61,780,648 49,245,772 1,019,945,300 1,069,191,072
1Calendar year-end information is provided because earnings are distributed as of December 31.2House Bill 3262, enacted by the 2005 Oregon Legislature, combined the OPSRP Pension Program with the existing defined benefit plan. Activity since 2004 includes activity of the OPSRP Pension Program.3The Oregon Public Service Retirement Plan was added to the System in January 2004.
Oregon Public Service Retirement Plan3
Individual Account Program
Net AssetsCalendar
Year Additions Deductions Net Change Beginning of Year End of Year2003 $ N/A $ 264,574 $ (264,574) $ 27,697,457 $ 27,432,8832004 388,419,511 10,745,087 377,674,424 27,432,883 405,107,3072005 538,163,352 7,860,050 530,303,302 405,107,307 935,410,6092006 657,172,054 38,112,684 619,059,370 935,410,609 1,554,469,9792007 649,052,858 55,112,975 593,939,883 1,554,469,979 2,148,409,8622008 (204,816,680) 66,948,502 (271,765,182) 2,148,409,862 1,876,644,6802009 940,198,020 61,077,271 879,120,749 1,876,644,680 2,755,765,4292010 903,205,036 103,115,658 800,089,378 2,755,765,429 3,555,854,8072011 614,258,421 204,713,520 409,544,901 3,555,854,807 3,965,399,708

Oregon Public Employees Retirement System
• 104 •
Revenues by Source - OPEB For the Years Ended December 311:
Retirement Health Insurance AccountEmployer Contributions
Calendar Year
MemberContributions Dollars
Percent of AnnualCovered Payroll
Net Investmentand Other Income Total
2002 $ N/A $ 41,355,199 0.67% $ (7,434,689) $ 33,920,5102003 N/A 40,789,302 0.65 23,713,608 64,502,9102004 N/A 37,923,918 0.56 16,550,236 54,474,1542005 N/A 39,202,772 0.58 20,112,501 59,315,2732006 N/A 39,481,902 0.54 28,532,583 68,014,4852007 N/A 35,457,965 0.45 22,089,579 57,547,5442008 N/A 28,043,517 0.34 (66,077,417) (38,033,900)2009 N/A 25,863,178 0.31 33,958,964 59,822,1422010 N/A 22,156,216 0.25 26,075,309 48,231,5252011 N/A 32,610,644 0.38 5,474,204 38,084,848
Retiree Health Insurance Premium Account
Employer ContributionsCalendar
YearMember
Contributions DollarsPercent of AnnualCovered Payroll
Net Investmentand Other Income Total
2002 $ N/A $ 1,581,544 0.09% $ (272,924) $ 1,308,6202003 N/A 2,175,955 0.13 728,395 2,904,3502004 N/A 2,678,731 0.14 550,508 3,229,2392005 N/A 2,454,389 0.13 679,346 3,133,7352006 N/A 2,284,194 0.14 920,910 3,205,1042007 N/A 2,148,731 0.03 688,777 2,837,5082008 N/A 1,867,402 0.08 (2,004,488) (137,086)2009 N/A 1,796,343 0.08 1,016,811 2,813,1542010 N/A 1,458,105 0.06 659,794 2,117,8992011 N/A 2,347,710 0.10 158,742 2,506,452
1 Calendar year-end information is provided because earnings are distributed as of December 31.

Oregon Public Employees Retirement System
• 105 •
Expenses by Type - OPEB For the Years Ended December 311:
Retirement Health Insurance Account
Calendar Year Benefits
AdministrativeExpenses Refunds Total
2002 $ 23,679,226 $ 402,662 $ N/A $ 24,081,8882003 24,236,456 467,080 N/A 24,703,5362004 24,991,280 712,195 N/A 25,703,4752005 25,601,296 698,986 N/A 26,300,2822006 26,552,598 978,785 N/A 27,531,3832007 27,244,840 888,308 N/A 28,133,1482008 27,976,500 918,244 N/A 28,894,7442009 28,537,920 974,580 N/A 29,512,5002010 29,066,220 973,329 N/A 30,039,5492011 29,524,122 1,283,144 N/A 30,807,266
Retiree Health Insurance Premium Account
Calendar Year Benefits
AdministrativeExpenses Refunds Total
2002 $ 1,291,244 $ 127,636 $ N/A $ 1,418,8802003 1,519,455 219,529 N/A 1,738,9842004 1,735,776 63,256 N/A 1,799,0322005 2,070,218 117,939 N/A 2,188,1572006 2,158,432 140,794 N/A 2,299,2262007 1,923,159 111,240 N/A 2,034,3992008 1,902,292 101,664 N/A 2,003,9562009 2,020,198 113,096 N/A 2,133,2942010 2,664,123 106,791 N/A 2,770,9142011 3,547,400 124,769 N/A 3,672,169
1 Calendar year-end information is provided because earnings are distributed as of December 31.

Oregon Public Employees Retirement System
• 106 •
Changes in Plan Net Assets - OPEBFor the Last Ten Years Ended December 311:
Retirement Health Insurance Account
Net AssetsCalendar
Year Additions Deductions Net Change Beginning of Year End of Year2002 $ 33,920,510 $ 24,081,888 $ 9,838,622 $ 69,438,794 $ 79,277,4162003 64,502,910 24,703,536 39,799,374 79,277,416 119,076,7902004 54,474,154 25,703,475 28,770,679 119,076,790 147,847,4692005 59,315,273 26,300,282 33,014,991 147,847,469 180,862,4602006 68,014,485 27,531,383 40,483,102 180,862,460 221,345,5622007 57,547,544 28,133,148 29,414,396 221,345,562 250,759,9582008 (38,033,900) 28,894,744 (66,928,644) 250,759,958 183,831,3142009 59,822,142 29,512,500 30,309,642 183,831,314 214,140,9562010 48,231,525 30,039,549 18,191,976 214,140,956 232,332,9322011 38,084,848 30,807,266 7,277,582 232,332,932 239,610,514
Retiree Health Insurance Premium Account
Net AssetsCalendar
Year Additions Deductions Net Change Beginning of Year End of Year2002 $ 1,308,620 $ 1,418,880 $ (110,260) $ 2,679,437 $ 2,569,1772003 2,904,350 1,738,984 1,165,366 2,569,177 3,734,5432004 3,229,239 1,799,032 1,430,207 3,734,543 5,164,7502005 3,133,735 2,188,157 945,578 5,164,750 6,110,3282006 3,205,104 2,299,226 905,878 6,110,328 7,016,2062007 2,837,508 2,034,399 803,109 7,016,206 7,819,3152008 (137,086) 2,003,956 (2,141,042) 7,819,315 5,678,2732009 2,813,154 2,133,294 679,860 5,678,273 6,358,1332010 2,117,899 2,770,914 (653,015) 6,358,133 5,705,1182011 2,506,452 3,672,169 (1,165,717) 5,705,118 4,539,401
1 Calendar year-end information is provided because earnings are distributed as of December 31.

Oregon Public Employees Retirement System
• 107 •
Disability Benefits Refunds1
Fiscal Year
Service Benefits Duty Non-Duty
Retirement Benefit Totals
Death Benefits Normal Death Total
2003 $ 1,888,912,273 $ 9,102,457 $ 74,949,807 $ 1,972,964,537 $ 5,922,665 $ 42,640,295 N/A $ 2,021,527,4972004 2,395,783,190 10,035,722 80,793,817 2,486,612,729 8,610,162 42,193,518 N/A 2,537,416,4092005 2,233,603,114 10,929,003 85,709,442 2,330,241,559 10,572,405 60,241,863 N/A 2,401,055,8272006 2,264,988,154 11,371,883 89,310,558 2,365,670,595 5,957,975 33,172,837 N/A 2,404,801,4072007 2,462,885,953 12,113,128 93,493,033 2,568,492,114 6,096,828 41,222,535 N/A 2,615,811,4772008 2,646,746,186 13,363,139 96,763,796 2,756,873,121 11,432,179 50,660,781 N/A 2,818,966,0812009 2,672,728,881 14,270,486 100,050,006 2,787,049,373 3,169,091 36,548,963 N/A 2,826,767,4272010 2,795,098,921 15,188,097 101,866,823 2,912,153,841 3,414,960 25,692,404 N/A 2,941,261,2052011 3,074,390,373 15,967,087 105,974,442 3,196,331,902 7,606,867 17,203,318 9,283,908 3,230,425,9952012 3,166,918,154 16,449,589 108,423,907 3,291,791,650 3,918,168 27,966,120 6,054,330 3,329,730,268
1 Prior to fiscal year 2011, information to present refunds by type was not available and Death Refunds were combined with Normal Refunds.
Schedule of Earnings and Creditingat December 311:
Calendar Year
Tier One Earnings/(Loss) Available for
CreditingVariable Earnings/
(Loss) CreditedIndividual Account
ProgramCredited
Tier One Tier Two2
2002 (8.93)% 8.00% (8.93)% (21.51)%2003 23.79 8.00 22.00 34.682004 13.80 8.00 13.27 13.00 12.77%3
2005 13.74 8.00 18.31 8.29 12.802006 15.57 8.00 15.45 15.61 14.98 2007 10.22 7.97 9.47 1.75 9.462008 (27.18) 8.00 (27.18) (43.71) (26.75)2009 19.12 8.00 19.12 37.57 18.472010 12.65 8.00 12.44 15.17 12.132011 2.21 8.00 2.21 (7.80) 2.15
1 Calendar year-end information is provided because earnings are credited as of December 31.2 Tier Two earnings available and credited are the same.3 The Individual Account Program began in 2004 and was remediated in 2006 to reflect annual earnings credited for 2004 and 2005.
Schedule of Benefit Expenses By Type - Defined Benefit Pension Plan For the Years Ended June 30:
Years Credited Service 8+Average Monthly Benefit $ 60
Final Average Salary N/A Number of Active Retirees 41,467
Years Credited Service8 - 9 10 - 14 15 - 19 20 - 24 25 - 29 30 + Total
Average Monthly Benefit $158 $190 $221 $253 $285 $316 $285 Final Average Salary N/A N/A N/A N/A N/A N/A N/A Number of Active Retirees 9 51 91 175 265 545 1,136
Schedule of Average OPEB Benefits for Retiree Health Insurance Premium Account1
For the Year Ended June 30, 2012:
Schedule of Average OPEB Benefits for Retirement Health Insurance Account1 For the Year Ended June 30, 2012:
1 Effective years of retirement and final average salary are not available for OPEB.

Oregon Public Employees Retirement System
• 108 •
Schedule of Average Defined Benefit Pension PaymentsRetirement Effective Dates
July 1, 2002 to Years Credited ServiceJune 30, 2012 0 - 5 6 - 10 11 - 15 16 - 20 21 - 25 26 - 30 31+ Total
2003 Average Monthly Benefit $ 803 $ 1,180 $ 1,499 $ 2,083 $ 3,040 $ 4,312 $ 5,118 $ 2,942 Final Average Salary $ 2,566 $ 2,707 $ 3,245 $ 3,637 $ 4,107 $ 4,667 $ 4,935 $ 3,939 Number of Active Retirees 526 1,244 1,577 1,697 2,372 2,833 1,349 11,5982004 Average Monthly Benefit $ 901 $ 1,014 $ 1,332 $ 1,935 $ 2,874 $ 4,099 $ 4,603 $ 2,581 Final Average Salary $ 2,599 $ 2,928 $ 3,222 $ 3,734 $ 4,276 $ 4,739 $ 5,077 $ 3,953 Number of Active Retirees 255 671 876 919 1,128 1,384 364 5,5972005 Average Monthly Benefit $ 774 $ 956 $ 1,395 $ 1,930 $ 2,888 $ 4,123 $ 4,291 $ 2,410 Final Average Salary $ 2,960 $ 3,054 $ 3,512 $ 3,988 $ 4,441 $ 4,876 $ 4,976 $ 4,033 Number of Active Retirees 207 488 553 559 526 816 122 3,2712006 Average Monthly Benefit $ 792 $ 913 $ 1,291 $ 1,874 $ 2,832 $ 4,013 $ 4,120 $ 2,369 Final Average Salary $ 3,453 $ 3,138 $ 3,640 $ 3,939 $ 4,446 $ 4,997 $ 5,051 $ 4,143 Number of Active Retirees 199 511 638 636 601 853 217 3,6552007 Average Monthly Benefit $ 764 $ 968 $ 1,256 $ 1,874 $ 2,649 $ 4,044 $ 4,432 $ 2,423 Final Average Salary $ 3,289 $ 3,549 $ 3,625 $ 4,183 $ 4,598 $ 5,093 $ 5,352 $ 4,329 Number of Active Retirees 236 604 639 735 589 1,001 330 4,1342008 Average Monthly Benefit $ 779 $ 934 $ 1,293 $ 1,722 $ 2,505 $ 3,949 $ 4,680 $ 2,446 Final Average Salary $ 2,937 $ 3,329 $ 3,795 $ 4,188 $ 4,495 $ 5,127 $ 5,587 $ 4,364 Number of Active Retirees 237 585 656 833 685 1,111 415 4,5222009 Average Monthly Benefit $ 829 $ 957 $ 1,289 $ 1,782 $ 2,497 $ 3,837 $ 4,789 $ 2,460 Final Average Salary $ 3,271 $ 3,501 $ 3,826 $ 4,382 $ 4,673 $ 5,246 $ 5,683 $ 4,512 Number of Active Retirees 245 599 645 765 695 1,004 501 4,4542010 Average Monthly Benefit $ 720 $ 1,016 $ 1,248 $ 1,774 $ 2,422 $ 3,779 $ 4,821 $ 2,427 Final Average Salary $ 2,985 $ 3,747 $ 3,908 $ 4,469 $ 4,965 $ 5,395 $ 5,768 $ 4,667 Number of Active Retirees 259 657 712 913 890 1,133 534 5,0982011 Average Monthly Benefit $ 695 $ 949 $ 1,287 $ 1,716 $ 2,434 $ 3,675 $ 4,990 $ 2,403 Final Average Salary $ 2,886 $ 3,677 $ 4,113 $ 4,564 $ 5,151 $ 5,701 $ 6,076 $ 4,834 Number of Active Retirees 323 799 970 1,064 1,129 1,226 747 6,2582012 Average Monthly Benefit $ 627 $ 960 $ 1,299 $ 1,699 $ 2,331 $ 3,508 $ 4,849 $ 2,346 Final Average Salary $ 3,173 $ 3,642 $ 4,196 $ 4,470 $ 5,067 $ 5,561 $ 6,204 $ 4,849 Number of Active Retirees 310 848 980 1,014 1,162 1,163 821 6,298
Schedule of Benefit Recipients by Benefit Type For the Year Ended June 30, 2012
Monthly Benefit Amount
Number of
Retirees
Type of Retirement*Refund Annuity
Annuity Options** Lump-Sum Options**
1 2 3 4 5 1 2 3 4 1 2 3
$ 1 -500 19,196 15,300 139 189 3,168 400 2,539 4,787 3,846 1,184 688 3,377 2,231 544501 - 1000 18,527 15,106 116 725 2,060 520 2,701 5,759 4,835 1,871 799 1,263 997 302
1001 - 1500 14,997 12,366 97 709 1,409 416 1,895 4,460 4,419 1,851 605 800 745 2221501 - 2000 12,162 10,174 86 646 938 318 1,512 3,437 3,777 1,503 452 633 649 1992001 - 2500 10,338 8,946 74 468 645 205 1,174 2,848 3,254 1,322 341 530 727 1422501 - 3000 8,648 7,669 62 330 446 141 1,003 2,401 2,800 1,166 293 388 467 1303001 - 3500 7,461 6,818 36 206 340 61 839 2,026 2,702 1,102 266 190 265 713501 - 4000 6,671 6,215 31 160 236 29 666 1,795 2,673 1,045 216 107 122 474001 - 4500 5,852 5,593 21 68 150 20 472 1,516 2,509 968 203 60 90 344501 - 5000 4,738 4,500 12 57 160 9 385 1,158 2,110 830 146 24 66 195001 - 5500 3,449 3,307 11 24 96 11 266 916 1,522 590 115 12 21 75501 - 6000 2,390 2,295 7 25 59 4 169 556 1,110 448 65 16 22 4
6000 plus 4,917 4,720 8 27 158 4 247 1,075 2,410 1,003 109 11 50 12
Totals 119,346 103,009 700 3,634 9,865 2,138 13,868 32,734 37,967 14,883 4,298 7,411 6,452 1,733
*Type of Retirement ** Annuity and Lump-Sum Options1 - Normal 1 - No benefit for beneficiary.2 - Duty Disability 2 - Beneficiary receives same monthly benefit for life.3 - Non-Duty Disability 3 - Beneficiary receives half the monthly benefit for life.4 - Survivor Payment 4 - 15-year certain.5 - Alternate Payee

Oregon Public Employees Retirement System
• 109 •
Schedule of Benefit Recipients by Benefit Type For the Year Ended June 30, 2012
Monthly Benefit Amount
Number of
Retirees
Type of Retirement*Refund Annuity
Annuity Options** Lump-Sum Options**
1 2 3 4 5 1 2 3 4 1 2 3
$ 1 -500 19,196 15,300 139 189 3,168 400 2,539 4,787 3,846 1,184 688 3,377 2,231 544501 - 1000 18,527 15,106 116 725 2,060 520 2,701 5,759 4,835 1,871 799 1,263 997 302
1001 - 1500 14,997 12,366 97 709 1,409 416 1,895 4,460 4,419 1,851 605 800 745 2221501 - 2000 12,162 10,174 86 646 938 318 1,512 3,437 3,777 1,503 452 633 649 1992001 - 2500 10,338 8,946 74 468 645 205 1,174 2,848 3,254 1,322 341 530 727 1422501 - 3000 8,648 7,669 62 330 446 141 1,003 2,401 2,800 1,166 293 388 467 1303001 - 3500 7,461 6,818 36 206 340 61 839 2,026 2,702 1,102 266 190 265 713501 - 4000 6,671 6,215 31 160 236 29 666 1,795 2,673 1,045 216 107 122 474001 - 4500 5,852 5,593 21 68 150 20 472 1,516 2,509 968 203 60 90 344501 - 5000 4,738 4,500 12 57 160 9 385 1,158 2,110 830 146 24 66 195001 - 5500 3,449 3,307 11 24 96 11 266 916 1,522 590 115 12 21 75501 - 6000 2,390 2,295 7 25 59 4 169 556 1,110 448 65 16 22 4
6000 plus 4,917 4,720 8 27 158 4 247 1,075 2,410 1,003 109 11 50 12
Totals 119,346 103,009 700 3,634 9,865 2,138 13,868 32,734 37,967 14,883 4,298 7,411 6,452 1,733
*Type of Retirement ** Annuity and Lump-Sum Options1 - Normal 1 - No benefit for beneficiary.2 - Duty Disability 2 - Beneficiary receives same monthly benefit for life.3 - Non-Duty Disability 3 - Beneficiary receives half the monthly benefit for life.4 - Survivor Payment 4 - 15-year certain.5 - Alternate Payee
Schedule of Retirement System Membership at December 31:
Schedule of Retirement System Membership at June 30:
Information is not available to display principal participating employers’ data prior to 2006.
2012 2006
Number of Current Employees Rank
Percent of Total System
Number of Current Employees Rank
Percent of Total System
State of Oregon 45,953 1 27.07% 37,973 1 24.23%Oregon Health & Science University 5,744 2 3.38 4,988 2 3.18Portland Public Schools 5,128 3 3.02 4,984 3 3.18Salem-Keizer Public Schools 4,782 4 2.82 3,948 5 2.52City of Portland 4,490 5 2.64 3,509 6 2.24Multnomah County 4,468 6 2.63 4,047 4 2.58Beaverton School District 4,349 7 2.56 3,488 7 2.23Hillsboro School District 1J 2,501 8 1.47 1,974 9 1.26Portland Community College 2,449 9 1.44 2,849 8 1.82Clackamas County 1,909 10 1.12 -Eugene School District 4J - - 1,864 10 1.19All Others* 88,008 51.85 87,074 55.57Total 169,781 100.00% 156,698 100.00%
* “All Others” consisted of:Counties 11,140 6.56% 12,381 7.90%Municipalities 12,464 7.35 11,410 7.28School Districts 50,412 29.70 49,710 31.73Community Colleges 6,060 3.57 6,635 4.23Other Political Subdivisions 7,932 4.67 6,938 4.43Total All Others 88,008 51.85% 87,074 55.57%
Schedule of Principal Participating Employers Current Fiscal Year and Six Years Ago
1985 1990 1995 2000 2005 2010State Agencies 37,824 46,187 45,068 42,434 38,076 48,018School Districts 47,590 48,144 55,734 63,133 56,756 79,798Political Subdivisions 26,238 33,177 40,635 53,291 50,085 65,332Inactive Members 15,920 23,225 32,033 44,830 47,289 40,481
Total Non-Retired 127,572 150,733 173,470 203,688 192,206 233,629
Retired Membersand Beneficiaries 46,181 55,540 64,796 82,355 101,213 110,573Total Membership 173,753 206,273 238,266 286,043 293,419 344,202
Administrative Expense1 $ 2,905,072 $ 8,901,091 $ 13,500,677 $ 24,358,550 $ 40,056,600 $ 38,029,071Pension Roll (one month) $ 18,083,614 $ 33,175,888 $ 58,457,531 $ 122,467,087 $ 202,633,214 $ 265,490,496
2007 2008 2009 2010 2011 2012State Agencies 42,906 41,872 44,377 46,105 46,739 45,953School Districts 65,792 69,840 70,946 72,656 75,915 67,172Political Subdivisions 55,850 55,740 55,745 57,989 60,695 56,656Inactive Members 52,513 46,356 43,397 37,624 41,832 42,286
Total Non-Retired 217,061 213,808 214,465 214,374 225,181 212,067Retired Members
and Beneficiaries 103,368 105,721 107,936 110,642 114,252 119,346Total Membership 320,429 319,529 322,401 325,016 339,433 331,413
Administrative Expense1 $40,082,947 $38,758,835 $38,648,977 $40,351,845 $ 38,594,620 $42,254,365Pension Roll (one month) $216,137,975 $230,863,092 $227,379,725 $236,323,468 $ 270,111,478 $284,236,7121Prior year balances revised to show effect of prior period adjustments for 2004 through 2009.2Ficuciary Funds only.

Oregon Public Employees Retirement System
• 110 •
Schedule of Participating Employers (902)
State (113)Appraiser Certification and Licensure
BoardBoard of AccountancyBoard of Architect ExaminersBoard of Chiropractic ExaminersBoard of Examiners for Engineering
and Land SurveyingBoard of Geologists ExaminersBoard of Optometry Board of Parole and Post-Prison
SupervisionBoard of PharmacyBoard of Psychologist ExaminersBureau of Labor and IndustriesChancellor’s OfficeCommission on Indian ServicesCommission on Judicial Fitness and
DisabilityConstruction Contractors BoardDepartment of Administrative ServicesDepartment of AgricultureDepartment of AviationDepartment of Community Colleges
and Work Force DevelopmentDepartment of Consumer and Business
ServicesDepartment of CorrectionsDepartment of EducationDepartment of EnergyDepartment of Environmental QualityDepartment of Human ServicesDepartment of JusticeDepartment of Land Conservation and
DevelopmentDepartment of Military — Federal
EmployeesDepartment of RevenueDepartment of State Lands Department of State PoliceDepartment of TransportationDepartment of Veterans’ AffairsDistrict Attorneys DepartmentEastern Oregon UniversityEmployment DepartmentEmployment Relations BoardForestry Department Geology and Mineral IndustriesHealth Related Licensing BoardsJudges PERSJudicial DepartmentLand Use Board of AppealsLandscape Contractors BoardLegislative Administration CommitteeLegislative AssemblyLegislative CommitteesLegislative Fiscal OfficeLong Term Care OmbudsmanMilitary DepartmentOffice of the GovernorOffice of Legislative CounselOregon Advocacy Commission OfficeOregon Board of Licensed Professional
Counselors and Therapists
Oregon Beef CouncilOregon Board of DentistryOregon Board of Massage TherapistsOregon Board of Medical ExaminersOregon Business Development
Department Oregon Commission for the BlindOregon Commission on Children and
FamiliesOregon Corrections EnterprisesOregon Criminal Justice CommissionOregon Dairy Products CommissionOregon Department of Fish and
WildlifeOregon Dungeness Crab CommissionOregon Film and VideoOregon Forest Resources InstituteOregon Government Ethics
CommissionOregon Health AuthorityOregon Health Insurance Exchange
CorporationOregon Health Licensing AgencyOregon Hop CommissionOregon Housing and Community
ServicesOregon Institute of TechnologyOregon Liquor Control CommissionOregon Parks and Recreation
DepartmentOregon Patient Safety CommissionOregon Potato CommissionOregon Racing CommissionOregon Salmon CommissionOregon Student Assistance
CommissionOregon State Bar Oregon State Bar Professional Liability
FundOregon State Board of NursingOregon State LibraryOregon State TreasuryOregon State UniversityOregon Tourism CommissionOregon Trawl CommissionOregon Watershed Enhancement BoardOregon Wheat CommissionOregon Youth AuthorityPhysical Therapist Licensing BoardPortland State UniversityPsychiatric Security Review BoardPublic Defense Services CommissionPublic Employees Retirement SystemPublic Safety Standards and TrainingPublic Utility CommissionReal Estate AgencySecretary of StateSouthern Oregon UniversityState Accident Insurance FundState Board of Clinical Social WorkersState Board of Tax PractitionersState Lottery CommissionState Marine BoardTeacher Standards and Practices
CommissionTravel Information CouncilUniversity of OregonWater Resources DepartmentWestern Oregon UniversityPolitical Subdivisions (485)Adair Village, City ofAlbany, City ofAmity, City ofAmity Fire DistrictApplegate Valley RFPD 9Arch Cape Service DistrictAshland, City ofAshland Parks CommissionAstoria, City ofAthena, City ofAumsville, City ofAumsville RFPDAurora, City ofAurora RFPDBaker, City ofBaker CountyBaker County Library DistrictBaker Valley Irrigation DistrictBandon, City ofBanks, City ofBanks Fire District 13Bay City, City ofBeaverton, City ofBend, City ofBend Metropolitan Park and Recreation
DistrictBenton CountyBlack Butte Ranch RFPDBlack Butte Ranch Service DistrictBoardman, City ofBoardman RFPDBoring RFD 59Brookings, City ofBrownsville RFPDBurns, City ofBurnt River Irrigation DistrictButte Falls, Town ofCanby, City ofCanby FPD 62Canby Utility BoardCannon Beach, City ofCannon Beach RFPDCanyon City, Town ofCanyonville, City ofCarlton, City ofCascade Locks, City ofCave Junction, City ofCentral Oregon Coast Fire and Rescue
DistrictCentral Oregon Intergovernmental
CouncilCentral Oregon Irrigation DistrictCentral Oregon Regional Housing
AuthorityCentral Point, City ofCharleston RFPDChetco Community Public Library
Board

Oregon Public Employees Retirement System
• 111 •
Chiloquin, City ofChiloquin-Agency Lake RFPDCity County Insurance ServicesClackamas CountyClackamas County FairClackamas County Fire District 1Clackamas County Vector Control
DistrictClackamas River Water ProvidersClackamas River WaterClatskanie, City ofClatskanie Library DistrictClatskanie People’s Utility DistrictClatskanie RFPDClatsop CountyClatsop County 4-H and Extension
Service DistrictClean Water ServicesCloverdale RFPDCoburg, City ofCoburg RFPDColton RFPD 70Columbia City, City ofColumbia CountyColumbia County 911 Communications DistrictColumbia Drainage Vector Control
DistrictColumbia River Fire and RescueColumbia River PUDCommunity Services ConsortiumCondon, City ofCoos Bay, City ofCoos CountyCoos County Airport DistrictCoquille, City ofCorbett Water DistrictCornelius, City ofCorvallis, City ofCottage Grove, City ofCrescent RFPDCreswell, City ofCrook CountyCrook County RFPD 1Crooked River Ranch RFPDCrystal Springs Water DistrictCulver, City ofCurry CountyCurry Public Library DistrictDallas, City ofDayton, City ofDepoe Bay, City ofDepoe Bay RFPDDeschutes CountyDeschutes County RFPD 2Deschutes Public Library DistrictDeschutes Valley Water DistrictDexter RFPD Douglas CountyDouglas County RFPD 2Douglas County Soil and Water
Conservation DistrictDrain, City ofDufur, City of Dundee, City ofDunes City, City ofDurham, City of
Eagle Point, City ofEast Fork Irrigation DistrictEast Umatilla County RFPDEcho, City ofElgin, City ofElkton, City ofEnterprise, City ofEstacada, City ofEstacada Cemetery Maintenance
DistrictEstacada RFD 69Eugene, City ofEugene Water and Electric BoardFairview, City ofFairview Water DistrictFalls City, City ofFarmers Irrigation DistrictFern Ridge Community LibraryFlorence, City ofFossil, City ofGaribaldi, City ofGaston, City ofGaston RFPDGearhart, City of Gervais, City ofGilliam CountyGladstone, City ofGlide RFPDGold Beach, City ofGold Hill, City ofGoshen RFPDGrant CountyGrants Pass, City ofGrants Pass Irrigation DistrictGreater St. Helens Parks and
Recreation DistrictGreen Sanitary DistrictGresham, City ofHalsey, City ofHalsey-Shedd RFPDHappy Valley, City ofHarbor Water PUDHarney CountyHarney Health District Harrisburg, City ofHarrisburg Fire and RescueHelix, City ofHeppner, City ofHermiston, City ofHermiston RFPDHigh Desert Park and Recreation
DistrictHillsboro, City ofHines, City ofHood River, City ofHood River CountyHoodland RFD 74Horsefly Irrigation DistrictHousing Authority of Clackamas
CountyHousing Authority of Jackson CountyHousing Authority of PortlandHubbard, City ofHubbard RFPDHuntington, City ofIce Fountain Water DistrictIllinois Valley RFPD
Imbler, City ofImbler RFPDIndependence, City ofIrrigon, City ofJackson CountyJackson County Fire District 3Jackson County Fire District 4Jackson County Fire District 5Jackson County Fire District 6Jackson County Vector Control District Jacksonville, City ofJefferson, City ofJefferson CountyJefferson County EMS DistrictJefferson County Library DistrictJefferson County RFPD 1Jefferson County SWCDJefferson RFPDJob CouncilJohn Day, City ofJordan Valley, City ofJoseph, City ofJosephine CountyJunction City, City ofJunction City RFPDKeizer, City ofKeizer RFPDKeno RFPDKing City, City ofKlamath CountyKlamath County Emergency
Communications DistrictKlamath County Fire District 1Klamath Falls, City ofKlamath Housing AuthorityKlamath Vector Control DistrictKnappa Svensen Burnside RFPDLa Grande, City ofLa Pine RFPDLafayette, City ofLake CountyLake County 4-H and Extension
Service DistrictLake County Library DistrictLake Oswego, City ofLakeside, City ofLakeside Water DistrictLakeview, Town ofLane Council of GovernmentsLane CountyLane County Fire District 1Lane Rural Fire RescueLeague of Oregon CitiesLebanon Aquatic DistrictLebanon, City ofLebanon RFPDLincoln City, City ofLincoln CountyLincoln County Communications
AgencyLinn CountyLinn-Benton Housing AuthorityLocal Government Personnel InstituteLowell, City ofLowell RFPDLyons, City ofLyons RFPD

Oregon Public Employees Retirement System
• 112 •
Madras, City ofMalheur CountyMalin, City ofManzanita, City ofMapleton Water DistrictMarion CountyMarion County Housing AuthorityMaupin, City ofMcKenzie RFPDMcMinnville, City ofMcMinnville Water and Light
Department Medford, City ofMedford Irrigation DistrictMedford Water CommissionMerrill, City ofMetolius, City ofMETROMetropolitan Area Communication
CommissionMid-Columbia Center for LivingMill City, City ofMill City RFPDMillersburg, City ofMillington RFPDMilton-Freewater, City ofMilwaukie, City ofMist-Birkenfeld RFPDMohawk Valley RFDMolalla, City ofMolalla RFPD 73Monmouth, City ofMonroe, City ofMonroe RFPDMoro, City ofMosier Fire DistrictMt. Angel, City ofMt. Angel Fire DistrictMt. Vernon, City of Mulino Water District 23Multnomah CountyMultnomah County Drainage District 1Multnomah County RFPD 14Myrtle Creek, City ofMyrtle Point, City ofNehalem Bay Fire and RescueNehalem Bay Health DistrictNehalem Bay Wastewater AgencyNesika Beach - Ophir Water DistrictNeskowin Regional Sanitary AuthorityNeskowin Regional Water DistrictNestucca RFPDNetarts-Oceanside RFPDNetarts-Oceanside Sanitary DistrictNetarts Water DistrictNewberg, City ofNewport, City ofNorth Bend City Housing AuthorityNorth Bend, City ofNorth Clackamas County Water
CommissionNorth Douglas County Fire and EMSNorth Lincoln Fire & Rescue District 1North Marion County CommunicationsNorth Morrow Vector Control DistrictNorth Plains, City of
North Powder, City ofNorth Wasco County Parks &
Recreation DistrictNortheast Oregon Housing AuthorityNorthern Oregon CorrectionsNorthwest Senior and Disability
ServicesNyssa, City ofNyssa Road Assessment District 2Oak Lodge Sanitary DistrictOak Lodge Water DistrictOakland, City ofOakridge, City ofOchoco Irrigation DistrictOdell RFPDOdell Sanitary DistrictOntario, City ofOregon Cascades West COGOregon City, City ofOregon Community College
AssociationOregon Consortium, TheOregon Coastal Zone Management
AssociationOregon Health & Science UniversityOregon School Boards AssociationOregon Trail Library DistrictOwyhee Irrigation DistrictParkdale RFPDPendleton, City ofPhilomath, City ofPhilomath Fire and RescuePhoenix, City ofPilot Rock, City ofPleasant Hill RFPDPolk CountyPolk County Fire District 1Polk Soil and Water Conservation
DistrictPort of AstoriaPort of Cascade LocksPort of Coos Bay, InternationalPort of GaribaldiPort of Hood RiverPort of NewportPort of PortlandPort of St. HelensPort of The DallesPort of Tillamook BayPort of UmatillaPort Orford, City ofPort Orford Public LibraryPortland, City ofPortland Development CommissionPowers, City ofPrairie City, City ofPrineville, City ofRainbow Water DistrictRainier, City ofRainier Cemetery DistrictRedmond Area Park and Recreation
DistrictRedmond Fire and RescueRedmond, City ofReedsport, City ofRiddle, City of
Rockaway Beach, City ofRockwood Water PUDRogue River, City ofRogue River RFPDRogue River Valley Irrigation DistrictRoseburg, City ofRoseburg Urban Sanitary AuthorityRural Road Assessment District 3Salem, City ofSalem Housing AuthoritySalmon Harbor and Douglas CountySandy, City ofSandy RFPD 72Santa Clara RFPD Scappoose, City ofScappoose Public Library DistrictScappoose RFPDScio RFPDSeal Rock RFPDSeal Rock Water DistrictShady Cove, City ofSheridan, City ofSheridan Fire DistrictSherman CountySherwood, City ofSilver Falls Library DistrictSilverton, City ofSilverton RFPD 2Sisters and Camp Sherman RFPDSisters, City ofSiuslaw Public Library DistrictSiuslaw RFPD 1South Fork Water BoardSouth Lane County Fire and RescueSouth Suburban Sanitary DistrictSouthwest Polk County RFPDSouthwest Lincoln County Water
DistrictSpringfield, City ofSpringfield Utility BoardSt. Helens, City ofStanfield, City ofStanfield Fire District 7-402Stayton, City ofStayton RFPDSublimity RFPDSuburban East Salem Water DistrictSunrise Water AuthoritySunriver Service DistrictSutherlin, City ofSutherlin Water Control DistrictSweet Home, City ofSweet Home Cemetery Maintenance
DistrictSweet Home Fire and Ambulance
DistrictTalent, City ofTalent Irrigation DistrictTangent RFPDTigard, City ofTillamook, City ofTillamook County Emergency
Communications DistrictTillamook County Soil and Water
Conservation DistrictTillamook Fire District

Oregon Public Employees Retirement System
• 113 •
Tillamook People’s Utility DistrictToledo, City ofTri-City Water and Sanitary AuthorityTri-County Cooperative Weed
Management AreaTroutdale, City ofTualatin, City ofTualatin Valley Fire and RescueTualatin Valley Irrigation DistrictTualatin Valley Water DistrictTurner, City ofUmatilla, City ofUmatilla CountyUmatilla County Soil and Water
DistrictUmatilla County Special Library
DistrictUmatilla-Morrow Radio and Data
DistrictUmatilla RFPD 7-405Vale, City ofValley View Cemetery Maintenance
DistrictVeneta, City ofVernonia, City ofVernonia RFPDWaldport, City ofWallowa, City ofWallowa CountyWarrenton, City ofWasco CountyWasco County Soil and Water
Conservation DistrictWashington CountyWashington County Consolidated
Communications AgencyWashington County Fire District 2West Extension Irrigation DistrictWest Linn, City ofWest Multnomah Soil and Water
Conservation DistrictWest Side Fire DistrictWest Slope Water DistrictWest Valley Fire DistrictWest Valley Housing AuthorityWestern Lane Ambulance DistrictWestfir, City ofWeston, City ofWeston Cemetery DistrictWheeler, City ofWickiup Water DistrictWillamette Valley Fire and Rescue
AuthorityWillamina, City ofWilsonville, City ofWinchester Bay Sanitary DistrictWinston, City ofWinston-Dillard Fire DistrictWinston-Dillard Water DistrictWood Village, City ofWoodburn, City ofWoodburn Fire DistrictYachats, City ofYachats RFPDYamhill, City ofYamhill Communications AgencyYamhill County
Yoncolla, City of
Community Colleges (17)Blue Mountain Community CollegeCentral Oregon Community CollegeChemeketa Community CollegeClackamas Community CollegeClatsop Community CollegeColumbia Gorge Community CollegeKlamath Community CollegeLane Community CollegeLinn-Benton Community CollegeMt. Hood Community CollegeOregon Coast Community CollegePortland Community CollegeRogue Community CollegeSouthwestern Oregon Community
College Tillamook Bay Community College Treasure Valley Community CollegeUmpqua Community College
School Districts (287)Alliance Charter AcademyArco Iris Spanish Immersion Charter
SchoolArmadillo Technical InstituteBaker CSD 5JBaker CSD 16JBaker CSD 30 JBaker CSD 61Baker Web AcademyBallston Community SchoolBeaverton School District 48JBennett Pearson Academy Charter
SchoolBenton CSD 1JBenton CSD 7JBenton CSD 17JBenton CSD 509JCascade Heights Public Charter SchoolCenter for Advanced LearningCentral Curry School District 1City View Charter SchoolClackamas Charter Alliance 1Clackamas Charter Alliance 2Clackamas County ESDClackamas CSD 3Clackamas CSD 7JClackamas CSD 12Clackamas CSD 35Clackamas CSD 46Clackamas CSD 53Clackamas CSD 62Clackamas CSD 86Clackamas CSD 108Clackamas CSD 115Clatskanie School District 6JClatsop CSD 1CClatsop CSD 4Clatsop CSD 8Clatsop CSD 10Clatsop CSD 30Coburg Community Charter SchoolColumbia CSD 13Columbia CSD 47 JColumbia CSD 502
Columbia Gorge Education Service District
Condon Admin. School District 25JCoos CSD 8Coos CSD 9Coos CSD 13Coos CSD 31Coos CSD 41Coos CSD 54Corbett Charter SchoolCrook CSDCurry CSD 2CJCurry CSD 17CDayton School District 8Deschutes CSD 1Deschutes CSD 2JDeschutes CSD 6Douglas County ESDDouglas CSD 1Douglas CSD 4Douglas CSD 12Douglas CSD 15Douglas CSD 19Douglas CSD 21Douglas CSD 22Douglas CSD 32Douglas CSD 34Douglas CSD 70Douglas CSD 77Douglas CSD 105Douglas CSD 116Douglas CSD 130EagleRidge High SchoolEddyville Charter SchoolEstacada Web and Early College
Academy 1 Forest Grove Community SchoolFossil School District 21JFour Rivers Community SchoolGilliam CSD 3Grant School District 3Grant County ESDGrant CSD 4Grant CSD 8Grant CSD 16JGrant CSD 17Greater Albany Public Schools 8JGresham Barlow Web Academy Public
Charter SchoolHarney ESD Region 17Harney CSD 3Harney CSD 4Harney CSD 5Harney CSD 7Harney CSD 10Harney CSD 13Harney CSD 16Harney CSD 28Harney CSD UH1JHarrisburg School District 7High Desert Education Service DistrictHillsboro School District 1JHome Scholars Academy of Oakridge
and WestfirHomeSource Family CharterHood River CSDHoward Street Charter School, Inc.

Oregon Public Employees Retirement System
• 114 •
Inavale Community PartnersIone School DistrictJackson CSD 4Jackson CSD 5Jackson CSD 6Jackson CSD 9Jackson CSD 35Jackson CSD 59Jackson CSD 91Jackson CSD 94Jackson CSD 549CJefferson County ESDJefferson CSD 4Jefferson CSD 8Jefferson CSD 41Jefferson CSD 509JJordan Valley School District 3Josephine County UJ School DistrictJosephine CSD 7Kings Valley Charter SchoolKlamath CSD CUKlamath Falls City SchoolsLake County ESDLake CSD 7Lake CSD 11CLake CSD 14Lake CSD 18Lake CSD 21Lane County ESDLane CSD 1Lane CSD 4JLane CSD 19Lane CSD 28JLane CSD 32Lane CSD 40Lane CSD 45J3Lane CSD 52Lane CSD 66Lane CSD 68Lane CSD 69Lane CSD 71Lane CSD 76Lane CSD 79JLane CSD 90Lane CSD 97JLEP HighLewis and Clark Montessori Charter
SchoolLincoln CSDLinn CSD 9Linn CSD 55Linn CSD 95CLinn CSD 129JLinn CSD 552CLinn Benton Lincoln ESDLogos Public Charter SchoolLourdes Charter SchoolLuckiamute Valley Charter SchoolMadrone Trail Public Charter SchoolMalheur ESD Region 14Malheur CSD 8CMalheur CSD 12Malheur CSD 26CMalheur CSD 29Malheur CSD 61Malheur CSD 66Malheur CSD 81
Malheur CSD 84Marion CSD 1Marion CSD 4JMarion CSD 5Marion CSD 14CJMarion CSD 15Marion CSD 24JMarion CSD 45Marion CSD 91Marion CSD 103CMastery Learning InstituteMolalla River AcademyMorrow CSDMosier Community SchoolMosier Middle SchoolMultisensory Institute Teaching
ChildrenMultisensory Learning AcademyMultnomah County ESDMultnomah CSD 1Multnomah CSD 3Multnomah CSD 7Multnomah CSD 10Multnomah CSD 28-302 JTMultnomah CSD 39Multnomah CSD 51JTMultnomah CSD R-40Nixyaawii Community SchoolNorth Central ESDNorth Santiam School District 29JNorth Powder School DistrictNorth Wasco CSD 21Northwest Regional ESDOpal SchoolOregon Building Congress Academy
for Architecture, Construction and Engineering
Oregon Connections AcademyOregon Virtual Academy Personalized Learning, Inc.Phoenix School, ThePolk CSD 2Polk CSD 13JPolk CSD 21Polk CSD 57Portland Village SchoolPowell Butte Community Charter
SchoolRenaissance Public AcademyRidgeline Montessori Public Charter
SchoolRimrock AcademyRiver’s Edge Academy Charter SchoolSage Community SchoolSand Ridge Charter SchoolSauvie Island AcademyScappoose School District 1JSelf-Enhancement Inc.Sheridan AllPrep AcademySheridan Japanese School FoundationSherman CSDSherwood Charter SchoolSiletz Valley Early College AcademySiletz Valley SchoolSisters Web and Early College
Academy #3South Coast ESD Region 7
South Columbia Family SchoolSouth Harney School District 33South Wasco County School District 1Southwest Charter SchoolSouthern Oregon ESDSpringfield Academy of Arts &
AcademicsSpringwater Environmental Sciences
SchoolSunny Wolf Charter SchoolSweet Home Charter SchoolThe Emerson SchoolThe Ivy SchoolThe Lighthouse SchoolThe Village SchoolThree Rivers Charter SchoolTillamook CSD 9Tillamook CSD 56Tillamook CSD 101Trillium Charter SchoolUmatilla County Administrative School
District 1RUmatilla Morrow ESDUmatilla CSD 2RUmatilla CSD 5Umatilla CSD 6RUmatilla CSD 7Umatilla CSD 8RUmatilla CSD 16RUmatilla CSD 29RJUmatilla CSD 61RUmatilla CSD 80RUnion CSD 1Union CSD 5Union CSD 11Union CSD 15Union CSD 23Wallowa County Region 18 ESDWallowa CSD 6Wallowa CSD 12Wallowa CSD 21Wallowa CSD 54Wasco CSD 29Washington CSD 13Washington CSD 15Washington CSD 23JWashington CSD 88JWashington CSD 511JTWest Lane Technical Learning CenterWheeler CSD 1Wheeler CSD 55UWillamette ESDYamhill CSD 1Yamhill CSD 4JYamhill CSD 29JTYamhill CSD 30-44-63JYamhill CSD 40Yamhill CSD 48J

Oregon Public Employees Retirement System
• 115 •
In compliance with the Americans with Disabilities Act, this document can be provided in alternate formats. To request an alternate format, please call PERS at 888-320-7377 (toll free).