Completing Markets with Contracts: Evidence from the First ...
53
Completing Markets with Contracts: Evidence from the First Central Clearing Counterparty * Guillaume Vuillemey † October 2, 2018 Abstract I study the real effects a contracting innovation that suddenly made financial markets more complete: central clearing counterparties (CCPs) for derivatives. The first CCP to provide full insulation against counterparty risk was created in Le Havre (France) in 1882, in the coffee futures market. Using triple difference- in-differences estimation, I show that central clearing changed the geography of trade flows Europe-wide, to the benefit of Le Havre. Inspecting the mechanism using trader-level data, I show that the CCP was instrumental both to mitigate adverse selection issues and to solve a “missing market” problem. Increased risk- sharing possibilities enabled more gains from trade to be realized. The successful contractual innovation quickly spread to new exchanges. * I am grateful to Laura Rischbieter, to seminar participants at the University of Melbourne and to conference participants at the 4 Nations’ Cup (ESMT) for comments. I thank the Chair ACPR/Risk Foundation: Regulation and Systemic Risk, the Investissements d’Avenir (ANR-11-IDEX-0003/Labex Ecodec/ANR-11-LABX-0047) and the ANR (FIRR) for supporting this work. † HEC Paris and CEPR. Email: [email protected]. 1
Transcript of Completing Markets with Contracts: Evidence from the First ...

Completing Markets with Contracts: Evidence fromthe First Central Clearing Counterparty∗
Guillaume Vuillemey†
October 2, 2018
Abstract
I study the real effects a contracting innovation that suddenly made financialmarkets more complete: central clearing counterparties (CCPs) for derivatives.The first CCP to provide full insulation against counterparty risk was created inLe Havre (France) in 1882, in the coffee futures market. Using triple difference-in-differences estimation, I show that central clearing changed the geography oftrade flows Europe-wide, to the benefit of Le Havre. Inspecting the mechanismusing trader-level data, I show that the CCP was instrumental both to mitigateadverse selection issues and to solve a “missing market” problem. Increased risk-sharing possibilities enabled more gains from trade to be realized. The successfulcontractual innovation quickly spread to new exchanges.
∗I am grateful to Laura Rischbieter, to seminar participants at the University of Melbourne and toconference participants at the 4 Nations’ Cup (ESMT) for comments. I thank the Chair ACPR/RiskFoundation: Regulation and Systemic Risk, the Investissements d’Avenir (ANR-11-IDEX-0003/LabexEcodec/ANR-11-LABX-0047) and the ANR (FIRR) for supporting this work.†HEC Paris and CEPR. Email: [email protected].
1
1 Introduction
The degree of (in-)completeness of financial markets is critical for economic outcomes.
When agents cannot perfectly share risks, the economy is subject to wider fluctuations
(Acemoglu and Zilibotti, 1997). As such, macroeconomic models where shocks are am-
plified by financial frictions typically prevent agents from perfectly hedging (Bernanke
and Gertler, 1989; Kiyotaki and Moore, 1997). However, the degree of market com-
pleteness is not exogenous, as often assumed: markets can be made more complete
via financial contracting (Allen and Gale, 1988). Throughout history, a number of
contractual innovations – from the bill of exchange to limited liability – increased the
set of traded securities and contributed to long-term growth (North, 1991). Yet, it is
challenging to empirically identify a causal impact of changes in market completeness
on real outcomes.
In this paper, I study the real effects of one contracting innovation that suddenly
increased the degree of market completeness: central clearing counterparties (CCPs)
for derivatives. As an experiment, I use the creation of the Caisse de Liquidation
des Affaires en Marchandises (CLAM ) in the market for coffee futures in Le Havre
(France) in 1882. Before that date, earlier clearinghouses, e.g., in Liverpool or New
York, were only offering netting services to facilitate the settlement of transactions.
The contractual innovation brought about by the CLAM is to fully insulate futures
traders against counterparty risk. Specifically, for the first time, a clearing institution
interposed itself between traders, becoming a buyer to any seller and a seller to any
buyer, so as to guarantee the execution of contracts. If bilateral default risk is high ex
ante, central clearing completes financial markets by ensuring that derivatives pay off
as contractually planned. The contractual arrangement invented by coffee traders in
Le Havre then spread worldwide and, after the 2008 financial crisis, central clearing
became mandatory globally for standardized derivatives.
I hand-collect rich archive data and conduct an empirical analysis that yields two
contributions. The first one is to show that greater risk-sharing opportunities with
derivatives had a significant causal impact on trade flows in underlying commodities.
The creation of the CLAM arguably satisfies exogeneity requirements: it did not
follow any specific pre-trend in trade flows in Le Havre, and was heavily debated by
2
traders who did not foresee its impact on trade flows. For identification, I estimate
a triple difference-in-differences model. The three sources of variation in trade flows
I exploit are (i) before and after 1882, (ii) between Le Havre and other European
markets where clearing is not introduced, and (iii), within Le Havre, between coffee
and other commodities that remain uncleared. The specification enables ruling out
many confounding factors, such as commodity-specific and harbor-specific demand
and supply shocks. Another appealing feature of this setup is that both coffee and
the commodities used in the control group (e.g., tea or cocoa) are not produced in
Europe. Therefore, the effect I identify is a pure trade effect that cannot reflect poor
production conditions for a given commodity in an importing region or country.
The estimation results show a positive and significant effect of the introduction of
central clearing on coffee trade flows in Le Havre. I first estimate the triple difference-
in-differences model within France, comparing trade flows in Le Havre with 22 other
harbors. I find that the share of coffee imports entering France increased by 11.1
percentage points relative to control commodities. Then, I address residual endogene-
ity concerns by replicating the estimation with cotton trade flows. Indeed, while the
CLAM was created to mitigate counterparty risk on coffee futures, it also accepted
clearing of cotton futures. In this case, the creation of the CLAM was exogenous to
conditions in the cotton market. Yet, the results also hold when focusing on cotton
trade flows, using other textiles as control.
Next, I extend my analysis at the European scale and reconstruct trade flows in
cleared and control commodities for 7 countries. I show that central clearing changed
the geography of trade flows Europe-wide: after 1882, a significantly larger share of
coffee entered Europe in Le Havre, was warehoused there, and eventually reexported to
neighboring countries. The share of coffee imports from France by the sample countries
increased by 2.9 to 7.3 percentage points, relative to control commodities. I also
provide suggestive evidence that central clearing helped smoothing coffee consumption
in France. Finally, I support my quantitative results with narrative evidence. Many
contemporaries wrote that the CLAM boosted trade in Le Havre and, within less than
ten years, nine other European futures exchanges had introduced CCPs. Therefore,
the contractual innovation quickly spread.
3

As a second contribution, I pin down the mechanism through which central clearing
affected trade flows. First of all, several requirements must be met for the increase
in market completeness to be the main channel. Most importantly, it must be that
counterparty risk hinders trade before central clearing, and is reduced afterwards.
Consistent with this idea, I show that central clearing was invented following a global
crisis in coffee markets during which counterparty risk dislocated trade. I then show
that the CLAM was explicitly designed to mitigate counterparty risk, with high equity,
high margin requirements, and a chairman of the board with a strong reputation of
honesty. Other requirements for the increase in market completeness to explain the
results are that traders indeed make use of the CCP, and that trading volume in futures
– not just in physical commodities – increases. I show evidence that both requirements
are verified. Remarkably, even though the use of the CLAM was costly and not
mandatory, an overwhelming majority of traders were using it. Furthermore, the fact
that the CCP was widely used enables ruling out alternative channels through which
trade flows could have been affected. In particular, both contract standardization and
price transparency increased with the creation of the CLAM. However, if investors
were primarily valuing any of these two features, they could free-ride on the CLAM,
by benefiting from standardization and transparency when trading, while not using
costly central clearing. However, there is no evidence of such free-riding.
I then dig deeper into the mechanism and distinguish between two channels through
which markets can be made more complete. One possibility is that central clearing
solves an adverse selection problem: absent the CCP, uninformed traders in futures
markets fear trading predominantly with low-quality counterparties. They therefore
accept to trade only at a price discount (Akerlof, 1970; Gorton and Pennacchi, 1990).
Anticipating this discount, high-quality counterparties self-select out of the market.
Another possibility is that central clearing solves a “missing market” problem. Specif-
ically, if bilateral probabilities of default are known but there are no traded insurance
contracts to insure against them, a CCP completes markets by offering this insurance
(Biais et al., 2012, 2016). If this is the case, high-quality traders should be more
prevalent in the data before central clearing. Indeed, market participants are ex ante
unwilling to trade with participants known to have a high probability of default. Thus,
4

the two channels are associated with opposite predictions about the composition of
the pool of traders. In my case, data on the pool of futures traders is not available.
I thus test predictions empirically with data on the pool of physical coffee traders,
based on the idea that greater access to futures enhances ability to trade in physical
markets. I collect daily data on these traders and, for each of them, the date at which
they start operating and cease operations.
I run two tests and find partial evidence consistent with both channels. First,
I find that the share of low-quality traders, defined as traders who cease operations
within two years, is low before central clearing (8.2%) and does not drop after a
CCP is in place. This is inconsistent with adverse selection being significant for this
group of traders: it is as if their quality had already been revealed. Therefore, for
long-established traders, the main effect of central clearing was to solve a “missing
market” problem. Second, I find evidence consistent with adverse selection significantly
affecting new traders, defined as traders who entered the market in the preceding two
years. The share of such agents, with no or little established reputation, increased
significantly after the creation of the CLAM. I additionally find a surge in entry of new
coffee traders following the creation of the CLAM. Thus, for new traders, the main
effect of central clearing was to eliminate informational barriers to entry in futures
markets.
A final question in terms of contract design is whether the increase in market
completeness brought about by central clearing could have been obtained with simpler
contractual arrangements. Relying on historical sources, I argue that this was not
the case. The CLAM was created at a time when importers had large coffee stocks
and cash needs. Loans collateralized with coffee (or outright coffee sales) were not
possible, due to adverse selection with financiers about coffee grades. Coffee sales with
uncollateralized forward repurchases avoided this adverse selection problem but were
not possible due to high counterparty risk on forward contracts. Collateralization with
high-quality assets was costly, both because the opportunity cost of such assets was
high, and due to technological constraints. Compared to bilateral collateralization,
a CCP reduced the cost of posting high-quality assets: traders could benefit from
multilateral netting of margin calls across counterparties, and collateral was posted in
5
only one place. Therefore, central clearing was arguably the most efficient arrangement
to solve the contracting problem faced by coffee traders.
Related literature
This paper is first related to the literature on market incompleteness and macroeco-
nomic outcomes. It is well-understood that market incompleteness prevents resources
from being optimally allocated (Acemoglu and Zilibotti, 1997). Relatedly, financial
amplification mechanisms in macroeconomic models typically prevent agents from per-
fectly hedging (Bernanke and Gertler, 1989; Kiyotaki and Moore, 1997; Brunnermeier
and Sannikov, 2014), and volatility disappears from these models when risk-sharing
is possible (Krishnamurthy, 2003; Di Tella, 2018). Recently, Davila and Philippon
(2017) model the real effects of “incompleteness shocks”. While theoretically clear, the
relation between market completeness and real allocations is hard to empirically pin
down, partly because the degree of market completeness is not readily measurable. I
show a case where a change in market completeness is causally linked to real outcomes.
Furthermore, my paper relates to the literature on how contracts and institu-
tions can complete markets and enable gains from trade to be realized (Allen and
Gale, 1988; North and Thomas, 1973; Greif, 2006). A number of contractual innova-
tions throughout history fostered long-term growth, including insurance mechanisms
(De Roover, 1945) or bills of exchange and payments clearing (Börner and Hatfield,
2017). I show that central clearing is another contractual innovation that fostered
long-distance trade. Relatedly, the relationship between finance and growth has been
intensely studied (Levine, 2005). That said, I am not aware of previous papers – in-
cluding in the trade literature – showing a causal relationship between the ability to
hedge and trade flows.
Finally, the paper is linked to the growing literature on central clearing. Existing
papers study CCP design (Biais et al., 2016; Koeppl et al., 2012), netting (Duffie and
Zhu, 2011), collateralization (Duffie et al., 2015; Menkveld, 2017; Cruz Lopez et al.,
2017) and defaults (Bignon and Vuillemey, 2018). The closest paper to mine is by
Bernstein, Hughson, and Weidenmier (2017), who show a reduction in counterparty
risk premia in the US equity market after the establishment of the NYSE clearinghouse
6
in 1892. The main difference with my paper is that I do not focus on the effect of
central clearing on the pricing of cleared derivatives, but study real effects on trade
flows in underlying assets.
2 Theory and hypotheses
In complete markets, risk can be shared cross-sectionally and intertemporally to max-
imize the efficiency of allocations. Markets can be made more complete through fi-
nancial contracting between agents (Allen and Gale, 1988). Consider a case where
hedging instruments exist before the CCP is in place, but the agents who trade them
have a non-zero probability of default. Central clearing is a contracting innovation
that completes financial markets by ensuring that contracts pay off as planned.1 I
formulate one main hypothesis.
Hypothesis 1. (Trade flows) After the introduction of a CCP, trade flows in com-
modities underlying centrally cleared future contracts increase relative to trade flows
in commodities with no centrally cleared future contracts.
Hypothesis 1 follows from the fact that more complete markets enable more risk-
sharing, thus more gains from trade to be realized. This hypothesis has a corollary.
Corollary 1. (Consumption) After the introduction of a CCP, consumption of
commodities underlying centrally cleared future contracts becomes smoother relative to
consumption of commodities with no centrally cleared future contracts.
Indeed, risk-averse agents should exploit any new risk-sharing opportunity to smooth
consumption.
While Hypothesis 1 follows from theories of market incompleteness, two distinct
channels can explain why CCPs make markets more complete. First, there is an “ad-
verse selection channel”, relying on the idea that the key friction that impairs market
functioning before central clearing is an information problem. Specifically, consider a
situation where agents are asymmetrically informed about default probabilities, and
some agents are better able to identify high-quality counterparties (that is, those with a1An implicit assumption is that the CCP has enough resources so that its probability of default
is zero. In Section 5.1, I argue that the probability of default of the CLAM was indeed close to zero.
7

low probability of default). Then, uninformed agents fear trading predominantly with
“lemons” who will not be able to make good on their contractual promises. Therefore,
they choose to participate in the market only at a price discount (Gorton and Pen-
nacchi, 1990; Dang et al., 2017). Anticipating this, high-quality traders self-select out
of the market (Akerlof, 1970). In this context, CCPs complete financial markets by
making hedging contracts information-insensitive: contract value becomes insensitive
to agents’ private information about bilateral default risk. After central clearing is in
place, uninformed agents no longer fear to be adversely selected, while high-quality
traders re-enter the market. The ability to trade risk-sharing contracts increases.
The second potential channel through which market completeness increases is a
“missing insurance channel”. In this case, the friction impairing market functioning
before central clearing is the lack of an insurance market to trade counterparty default
risk (Biais, Heider, and Hoerova, 2012). This form of incompleteness can arise for
exogenous reasons, or from transaction costs, but the key difference with the adverse
selection channel is that it does not arise from an information problem. Whenever
bilateral default risk cannot be insured, bilateral risk-sharing contracts become less
valuable. In this case, CCPs complete financial markets by eliminating counterparty
risk, thus by making financial contracts better risk-sharing instruments. It is as if a
new security with different payoffs was introduced.
To distinguish between these two channels, theory makes distinct predictions about
the composition of the pool of traders around the introduction of central clearing. If
adverse selection is significant ex ante, the fraction of low-quality traders (those with
high unobservable probability of default) should drop with central clearing. Indeed,
after a CCP is in place, high-quality traders re-enter the market as price discounts
for counterparty risk disappear. A related prediction is that new traders – for which
asymmetric information concerns are arguably larger – also become more prevalent
after central clearing. Instead, if markets are incomplete but there is no asymmetric
information, then trading before central clearing should be concentrated among traders
with a low observable probability of default. When a CCP is in place, either traders
with high default risk can enter the market (since counterparties no longer worry
about default risk), or they are kept away from the market by the CCP, for example
8

via high margin calls. To summarize, while the adverse selection channel predicts that
the average quality of the pool of traders increases with central clearing, the missing
market channel predicts that it decreases.
3 Historical background and data
I describe the creation of the CLAM, its functioning, and the data used in the analysis.
3.1 Historical background
In the second half of the 19th century, the North-Western part of Europe was the most
active trade area globally. Both free-trade policies and technological progress (steam-
boats replacing sailboats) boosted intra-European and transatlantic trade. Harbors
such as Antwerp, Hamburg, Le Havre, Liverpool and Rotterdam were intensely com-
peting to attract trade flows. Le Havre was the largest French harbor in this “Northern
range”, and the second largest harbor in France, after Marseille.
The market for physical coffee had one main characteristic. While coffee was
produced in distant countries, primarily Brazil, it was not stored in these countries.
After the crops, coffee was exported to European harbors to be warehoused. Then,
whenever demand was rising in a region, short-distance intra-European boats would
transfer it from the warehouse to this region. The strength of a harbor was thus
reflected in the magnitude of its imports from producing countries and in the amount
of its stocks.
Long-distance trade gave rise to significant price risk, both for importers and for
dealers warehousing physical commodities.2 To mitigate price risk, forward sales and
purchases had existed for centuries. Starting in the 1860s, the standardization of con-
tracts led to the creation of organized futures markets. Thus, trading was centralized.
Clearinghouses created in markets such as Liverpool also centralized the settlement of
transactions, but did not insulate traders against counterparty risk. In Le Havre, bi-
lateral futures transactions were concentrated between well-established trading houses
and uncollateralized. Reputation was the main guarantee against counterparty risk.2Other risks were those associated with moral hazard when contracting with agents in distant
countries (Greif, 1993) and the risk that boats sink (De Roover, 1945).
9

3.2 The creation and functioning of the CLAM
The first CCP insulating traders from counterparty risk was created following a crisis in
global coffee markets in 1880-1881 (see Appendix B.1 for details). Fears of counterparty
risk were large and trading houses’ reputation was not sufficient anymore to sustain
trade. In Le Havre, a group of well-established coffee traders assembled to create the
Caisse de Liquidation des Affaires en Marchandises (CLAM ) as a limited liability
corporation.3 The CLAM started operating on December 16th, 1882. Compared to
pre-existing clearinghouses, the contractual innovation was for the CCP to substitute
itself to original parties in a transaction, and to insulate traders against bilateral
default risk. To successfully arise, a CCP needs coordination of sufficiently many
traders.4 In Le Havre, close ties between the first equity holders – including family
ties – allowed overcoming coordination problems (see Appendix B.2 for details).
Remarkably, the functioning of the CLAM was similar in most respects to that of
modern CCPs. After two traders agree on a transaction, they report it to the CLAM,
which becomes counterparty to each of them. Subsequently, the CLAM eases the
settlement of trades, via multilateral netting, and insulates each trader against the
default of its initial counterparty. The CLAM has two main instruments to protect
itself against the default of traders. First, each counterparty must be a broker domi-
ciled in Le Havre, which is akin to a membership requirement. Second, the CLAM
calls variation margins every day from traders realizing losses (based on changes in
their position’s market value). Variation margins must be received within one day.
Furthermore, at the inception of any trade, an initial margin is paid, to protect the
CCP in case a trader defaults on variation margins. When a trader defaults on margin
calls, the CLAM seeks to immediately liquidate its position, in order to return to a
matched book. Potential losses arising from the liquidation of a trader’s position are
first borne by this trader’s initial margins.5 If initial margins are insufficient, residual
losses are borne by the CCP’s equity. This last point is the main difference with mod-3In the US, the 1880 crisis led to the creation of the Coffee Exchange in the City of New York,
also in 1882. This exchange had no CCP insulating traders against counterparty risk (Emery, 1896).4The incentive for a trader to use a CCP depends on the fraction of other traders using it, due
to network externalities arising from multilateral netting (Duffie and Zhu, 2011). Such externalitiesimply that mutually beneficial CCPs may not emerge due to coordination failures.
5For a CCP, losses arise from price changes between the time at which a trader lasts posts variationmargins and the time at which the liquidation of its position is complete.
10

ern CCPs: the CLAM did not have a default fund or other loss-sharing mechanisms
between surviving members (“default waterfall”).
3.3 Data
I reconstruct the history and functioning of the CLAM using archive sources described
in Appendix A. I found early rulebooks, annual reports, board minutes, legal acts
containing exhaustive lists of equityholders, and a number of descriptive accounts by
contemporaries about the CLAM’s operations. I further collect data from the Bulletin
de correspondance a daily newspaper published by Le Havre’s exchange. This includes
daily data on future prices and quantities traded, as well as daily data on the identity
of traders in physical coffee.
For my main tests, I additionally collect yearly data on trade flows in coffee and
other relevant commodities for France and 7 other European countries over the 1877-
1888 period. These data are obtained separately from each country’s customs statistics
(see Appendix A.2 for detailed sources).
4 Central clearing and trade flows
In this section, I show that the reduction of counterparty risk in Le Havre’ futures
market led to a significant change in trade flows Europe-wide.
4.1 The event
To assess the effect of central clearing on trade flows, I use the introduction of the
CLAM as an experiment and estimate triple difference-in-differences models. The iden-
tification of a causal effect relies on exogeneity requirements: central clearing should
be as good as randomly assigned, both with respect to treated harbors and to treated
commodities. My setting has several features such that exogeneity requirements are
arguably satisfied.
Regarding the treated harbor, the CLAM was a response to heightened counter-
party risk in Havre. However, there is no evidence that risk was higher in Le Havre
than in other markets. For example, Appendix B.1 shows that it was much lower
11

than in New York, where all three largest trading houses had failed. Relatedly, central
clearing was not introduced at a moment when Le Havre became more or less attrac-
tive for trade flows in general. As seen in Figure 2, total imports and exports in Le
Havre, either in volume or in value, do not exhibit a specific trend before 1882-1883.
Furthermore, central clearing was an heavily debated innovation, and evidence shows
that traders had no clear understanding of what its effects on trade flows would be.
Depitre (1907, p. 162) writes that “At the beginning, opinions were strongly divided
in the commercial circles in Le Havre. A number of important trading houses refused
to participate in the CLAM and several of them avoided any relationship with it.”6
Similarly, the costs and benefits of central clearing remained debated abroad for years.
In the New York Coffee Exchange the introduction of central clearing was debated
multiple times by the Board of Managers, but never adopted (Emery, 1896). In Ham-
burg, the commodity exchange was long convinced that the costs of a CCP outweigh
its benefits (Fuchs, 1891). In this context, it is unlikely that traders in Le Havre
adopted central clearing because of the pre-existing knowledge that it would boost
trade flows.
Then, regarding the treated commodity, the CLAMwas explicitly set up to mitigate
counterparty risk in the market for coffee futures. However, from the very beginning,
it also accepted other commodities for clearing, primarily cotton. In the case of cotton,
remaining concerns about the endogeneity of the treatment is thus absent. In Section
4.3, I show that the results obtained for coffee trade flows hold equally well when
focusing on cotton trade flows.
4.2 Triple difference-in-differences estimation
For identification, there are three sources of variation: (i) variation before and after
December 1882, (ii) within trade flows in coffee, variation between Le Havre and other
harbors, and (iii) within trade flows in Le Havre, variation between coffee and other
uncleared commodities. The existence of these sources of variation enables ruling out
confounding explanations relying either on commodity-specific or on harbor-specific6In Appendix B.2, I document that some of the largest coffee traders indeed did not initially
contribute to the CLAM. Even among the founders, 8 out of 50 shareholders opposed the proposedfunctioning during the general assembly in which the CLAM’s rulebook was approved.
12

demand and supply shocks. My main specification jointly exploits these sources of
variation in a triple difference-in-differences model. Focusing first on France’s imports
and exports, I use as specification,
Sharecht = α + β1 · CCPht + β2 · Clearedc · Postt
+β3 · CCPht · Clearedc + µt + µch + εcht. (1)
In (1), Sharecht is the share of France’s imports of commodity c in harbor h in year
t.7 CCPht equals one if there is a CCP in place in harbor h it year t. Clearedc is a
dummy variable equal to one for coffee and zero for other commodities that remain
uncleared. Finally, Postt equals one for years strictly after 1882. The coefficient of
interest, β3, captures the effect of introducing a CCP in Le Havre specifically on coffee
trade flows, after controlling for changes in Le Havre’s trade activity that are common
to all cleared and uncleared commodities (captured by β1), and for changes in coffee
trade activity after 1882 that are common to all harbors (captured by β2).
I first estimate Equation (1) on the full set of 23 French harbors, over the period
1877-1888 (that is, 6 years before and after the treatment).8 As control commodities,
I use so-called “colonial commodities”. This corresponds to the commodity group in
which coffee is classified in customs data, and includes cocoa, pepper, sugar, tea, and
tobacco. For identification, one advantage of this setup is that these commodities
are not produced on European soil. Therefore, changes in trade flows cannot reflect
changes in home production. Table 1 reports the share of French imports by com-
modity arriving in the main harbors in the 1877-1882 period preceding the creation of
the CLAM. As can be seen, Le Havre was by far the most important harbor for coffee
trade flows (60.5% of total imports), and also a large market for tobacco (34.9%),
cocoa (32%) and pepper (21.2%).
The regression estimates are displayed in Table 2. The baseline estimate, in col-
umn (1), shows that the share of coffee imports arriving in Le Havre increased by
11.1% (significant at the 1% level) after the creation of the CLAM, relative to control7The reason for using commodity-level import shares as dependent variables is that I do not have
to separately account for changes in trade flows coming either from changes in import volume or fromchanges in import prices.
8Throughout the paper, I refer to “harbors,” even though some entry or exit points for commoditiesinclude a few cities on land borders.
13

commodities. The magnitude of the effect is economically large. Compared to a pre-
clearing share of 60.5%, this represents an increase in coffee imports for Le Havre of
18.3%.
This baseline result is robust to alternative specifications of the control group.
In column (2), I re-estimate the baseline specification after excluding sugar from the
control group, since sugar is also produced in Europe. The magnitude of the effect
remains of similar magnitude (9.2% versus 11.1%) and equally significant. In column
(3), the control group is the sum of all imports at the harbor-level. The estimated
effect of introducing the CLAM (a 17.7 percentage points increase in the share of
coffee) is even larger than in the baseline specification. Finally, in column (4), I
estimate the same regression as in column (3) but with exports as dependent variable.
The estimated effect is larger than for imports, as the share of Le Havre’s coffee exports
within France’s exports increases by 24.7 percentage points. Therefore, all regression
results show that the introduction of central clearing had a large positive effect on
trade flows within France.
While large, the magnitude of the estimated effect is realistic. Indeed, as dis-
cussed in Section 3.1, coffee imported to Europe was not consumed immediately, but
warehoused and potentially re-exported within Europe. This storage activity exposed
dealers to price risk. Therefore, the ability to hedge price risk was a key determinant
of the place in which commodities were warehoused. Consequently, the creation of
the CLAM increased hedging ability, and led to a change in the geography of imports
– not primarily because more coffee was consumed in Le Havre, but because more
stocks were held in Le Havre. This can be seen from Column (5) of Table 2, which
re-estimates Equation (1) using the share of French stocks for each commodity as de-
pendent variable. I find that the share of French coffee stocks in Le Havre increased
by 15 percentage points after 1882, relative to stocks of other commodities.
4.3 Estimation with other commodities
A potential endogeneity concern is that unobserved characteristics simultaneously led
to the adoption of clearing and made coffee trade more attractive in Le Havre around
1882. To rule out this concern, I systematically read local newspapers in 1882, and
14
do not find any mention of omitted factors. To get further reinsurance, I construct
a formal test. Indeed, while the CLAM was created to address issues in the coffee
market, other commodities – primarily cotton – also became centrally cleared.9 The
introduction of clearing in the cotton market is thus fully exogenous.
I reestimate the triple difference-in-differences model in Equation (1) with either
raw cotton or the sum of raw cotton and cotton textiles as treated commodities. The
control group includes either raw wool, or the sum of raw wool, wool textiles and silk
textiles. The estimation results, in Columns (1) and (2) of Table 3, show a positive
and significant effect of central clearing on cotton imports, relative to other textile
imports. The magnitude of the effect is similar to that obtained for coffee, with an
increase in the share of cotton imports between 7.2% and 14.2% depending on the
specification. The endogeneity of the treatment is thus unlikely to be a major concern
in coffee trade regressions.
The same test can be reproduced for subsequent years, when additional commodi-
ties became eligible for clearing. One of the very first commodities to be added was
indigo, in 1887. In Column (3) of Table 3, I reestimate Equation (1) with indigo as
treated commodity and the sum of all imports as control, over a 1882-1890 window.
I again find a positive and significant effect of central clearing on imports. Since the
event date in this case is not the same as for coffee and cotton, this test alleviates
the concern that previous results were driven by factors specifically related to these
commodities in 1882.
4.4 Europe-level trade flows
I turn to the impact of central clearing on trade flows at a broader scale, and ask
whether European countries import a larger share of their coffee from France after
1882.10 Separately for each sample country i, I estimate the difference-in-difference9The third commodity eligible for clearing in December 1882 was lard (saindoux). There is un-
fortunately very limited information on the central clearing of lard futures and on lard trade flows.10The ideal test would be to check whether European countries import a larger share of their coffee
from Le Havre (not just from France) after 1882. However, archival data report only the country oforigin, not the harbor of origin of imported goods. As shown in Section 4.2, Le Havre significantlyincreased exports after 1882, relative to other French harbors. Therefore, if European countriesimport more coffee from France, it is most likely coming from Le Havre.
15
equation,
Tradeicpt = α + β1 · CCPpt + β2 · Clearedc · Postt
+β3 · CCPpt · Clearedc + µt + µcp + εicpt, (2)
where p indexes countries other than i and Tradecpt is the share of imports in country
i of commodity c from country p at date t. Furthermore, CCPpt equals one for France
after 1882, while other terms are the same as in Equation (1). Equation (2) is esti-
mated for the following countries: Belgium, Germany, Hamburg, Italy, Netherlands,
Norway and Sweden.11 The composition of the control group always includes colonial
commodities, but the composition varies for each country based on data availability.
Table 4 shows that, before the introduction of the CLAM, France’s exports of colonial
commodities to the sample countries were low overall.
The estimation results, in Table 5, show that central clearing had a significant
effect on trade flows Europe-wide. All European countries in the sample increase the
share of their coffee imports from France after the CLAM is in place, and this increase
is significant in all cases, except for Italy.12 Interestingly, the magnitude of the effect is
relatively similar across countries, ranging from 2.9 percentage points for Hamburg to
7.3 percentage points for Germany. Economically, these magnitudes are large. Indeed,
as seen in Table 4, pre-treatment import shares from France were between 2 and 3%
in several cases (Hamburg, Netherlands, Norway, Sweden). The estimates therefore
imply that, for these countries, imports from France were multiplied between 2 and 3
times. In Germany, where the pre-treatment import share for coffee was only 0.9%, the
effect is even larger. These results are consistent with the idea that, while more coffee
was warehoused in Le Havre after the creation of the CLAM, a significant part was
re-exported to other European countries. Thus, access to better hedging instruments
reinforced the role of Le Havre as a hub for coffee trade in Europe.11I treat Hamburg as a separate country. Indeed, while a large number of German states were
part of the Zollverein (customs union), Hamburg joined only in 1888. Therefore, there are separatecustoms statistics for Hamburg and for Germany over my sample period. Furthermore, I do notinclude the UK because import data for colonial commodities are not broken down by Europeancountries of origin.
12A tariff war between France and Italy started in 1887 and led to a sharp drop in Italian im-ports from France in 1888. When re-estimating Equation (2) from 1878 to 1887 only, the estimatedcoefficient for Italy equals 0.054 and is significant at the 10% level (p-value of 0.051).
16

4.5 Narrative evidence
The econometric evidence is supported with narrative evidence. Indeed, several con-
temporaries noted the positive impact of central clearing on coffee trade flows in Le
Havre. In front of a parliamentary commission on futures markets, coffee dealers de-
clared in 1897 that “since 1880, imports have increased so much that, within a few
years, Le Havre has become the largest market globally.”13 A few years later, Depitre
(1907) wrote that “it is not disputable that the creation of the CLAM significantly
contributed to maintain the preponderance and to foster the commercial development
of the harbor of Le Havre.” Interestingly, foreign commentators reached a similar
conclusion. In the United States, Emery (1898) writes that “it is well-known that
the establishment of future trading in Le Havre in 1881 greatly increased the coffee
business of that port at the expense of Hamburg.” Similar quotes exist in German
sources.14
Moreover, indirect evidence that central clearing was beneficial to trade activity
in Le Havre can be obtained by studying the reaction of competing harbors. When it
became clear that the increase in trade in Le Havre was attributable to the CLAM,
other European markets introduced CCPs. Within ten years, nine European exchanges
had CCPs in place: Paris (1885, 1887), Antwerp (1887), Hamburg (1887), Amster-
dam (1888), Marseille (1888), Magdeburg (1889), Reims (1890), Leipzig (1890) and
Roubaix-Tourcoing (1892). In cases where documentation is available, it is clear that
the adoption of central clearing was motivated by the successful experiment in Le
Havre.15 Therefore, the contractual innovation spread quickly to other markets.16
4.6 Consumption smoothing
I now provide suggestive evidence that central clearing helped smoothing coffee con-
sumption in France. My sample period offers a good laboratory, in the form of a global
negative production shock, which I use to study cross-country differences in the re-
sponse of coffee consumption. While less cleanly identified than results on trade flows,13In Rapport Gustave Dron, Commission chargée d’examiner les propositions de lois concernant les
marchés à livrer et l’agiotage sur les denrées et marchandises, Chambre des députés, 1898, p. 117.14See the excerpt from Denkschrift für Handelskammer cited by Sayous (1898, p. 280).15For Hamburg, the other main coffee market in Europe, see Becker (2002) and Rischbieter (2011).16In the US, according to Moser (1998), the first CCP was established in 1891 in Minneapolis.
17

the findings on consumption are nonetheless important given the role of this variable
in any economic theory.17
The shock I study is displayed in Figure 3: coffee prices boomed by 140% within
a few months in 1886-1887, due to bad crops in Brazil. This shock has the appealing
feature that it is posterior to the creation of the CLAM but precedes the creation of
CCPs in other European markets. Furthermore, while food consumption is typically
hard to measure, coffee consumption can be precisely assessed, since there is no home
production of coffee in Europe. I obtain yearly data on coffee consumption in 11
European countries from the US Department of Agriculture (Graham, 1912).
The main result can be seen in Figure 4. While world coffee consumption fell by
17.6% between 1886 and 1887, European consumption (excluding France) by 16.6%,
German consumption by 17.7%, French consumption fell by only 6.0%. I then focus
more precisely on cross-country differences within Europe, showing data for 11 Eu-
ropean countries in Table 6. This table shows that France has the smallest drop in
coffee consumption between 1885 and 1887. The fact that France exhibits a smoother
coffee consumption can also be seen when looking separately at the main drop (1886
to 1887, in Column 2) and at the rebound (1887 to 1888, in column 3).18 Finally,
while all French harbors reduced coffee stocks in 1886 and 1887, Le Havre’s stocks
decreased by 64.4%, from 73 million tons in December 1885 to 26 million tons in De-
cember 1887. Overall, these results are consistent with Corollary 1, according to which
central clearing helps smoothing coffee consumption.
5 Mechanism
In this section, I dig into the mechanism explaining the effect of central clearing on
trade flows. I find that central clearing made markets more complete by mitigating
both an adverse selection problem and a “missing market” problem.17The ideal test would be to estimate Equation (2) using price-elasticities of commodity consump-
tion as dependent variables. However, price-elasticities cannot be reliably estimated with yearly dataand a relatively short time window.
18Two anomalies are Romania and Italy, where an increase in consumption is reported in 1887.However, both countries reported large drops in consumption in 1886 (-14.4% and -54.0% respec-tively), while other countries do not. One possibility is that, for these two countries, consumption isnot measured at the same moment of the year. This is why my favorite measure is the total dropbetween 1885 and 1887.
18

5.1 Completing financial markets: Preliminary evidence
For an increase in market completeness to explain the results on trade flows, four
requirements must be met: (i) counterparty risk before the introduction of central
clearing must be high enough to significantly impair trade, (ii) the CCP must be
credible to significantly reduce counterparty risk, (iii) investors must use the CCP
to a significant extent, and (iv) trading activity in futures must increase. All four
requirements are met.
Concerning (i), the CLAM was created following a long period of high counter-
party risk. As discussed in Appendix B.1, there is abundant narrative evidence that
global coffee markets could not efficiently function in 1880-1881, following a large drop
in coffee prices. Figure A1 also shows that the number of active commodity traders
decreased between 1880 and 1883, consistent with counterparty risk being high. Ad-
ditionally, in Le Havre, traders had massively increased coffee stocks in 1881-1882,
to bet on a price reversal. As they became cash-constrained, counterparty risk for
potential financiers was large. Sayous (1898) reports that “as the future looked highly
uncertain, one needed [...] to find a way to reduce the risks for capitalists.”
Then, with respect to (ii), several elements show that the founders of the CLAM
explicitly sought to create a credible and robust institution to fully eliminate counter-
party risk. Indeed, the CLAM was established with the support of several reputable
families, as discussed in Appendix B.2. As Depitre (1907, p. 162) notes, “the founders
chose, as chairman of the board, W. Iselin, a highly reputed trader, from an excellent
and very old trading house importing coffee, and notoriously staying away from spec-
ulative deals.” Moreover, only 25% of the equity (2,000,000 FRF) was initially paid-in,
so as to retain a callable buffer of 75%. Furthermore, the CLAM started operations
with stringent collateral requirements, which were deemed excessive by some members
but were not lowered. At the founding general assembly (8th December 1882), several
participants complained about the magnitude of initial margins. Then, according to
the minutes, “Mr. Le Normand [one of the founders] answers that the company is
above all a financial company: the members of the assembly are shareholders before
being brokers or dealers; one should consider the general interest of the company, not
the particular interest of each shareholder; if initial margins are lower, the decrease
19

may be advantageous for some counterparties, but disadvantageous for the company
and its shareholders.” It is also notable that, in subsequent years, the CLAM was
never at risk of defaulting on its commitments.
In support of requirement (iii), there is evidence that virtually all traders were
very soon using the CLAM, in spite of early opposition by some trading houses. This
is remarkable, given that there was no requirement to centrally clear transactions
executed in the exchange. For example, De Rousiers (1903, p. 172) writes: “No law,
no local rule require anyone to register futures transactions at the CLAM; however,
all serious businessmen in Le Havre use it. Through their daily actions, for more than
20 years, they give a strong support to the CLAM, they recognize that its discipline is
not uselessly tough [...] and very few of the critiques would dare engaging in a bilateral
transaction that would not be centrally cleared.” Furthermore, according to Depitre
(1907), even traders who explicitly wanted to avoid the CLAM after its creation were
using it after just a few months. The fact that the CLAM was widely used is also
evident from its early and high profitability, discussed in Appendix B.3. For example,
the CLAM was already able to pay dividends in 1883.
Finally, regarding (iv), the trading volume in futures increased markedly soon after
the creation of the CLAM. To show this, I collect daily data on trading volume from
the Bulletin de correspondance, and plot it in Figure 5. As can be seen, between the
six months preceding the creation of the CLAM and the following six months, the
trading volume in coffee futures increased by 303% on average.
5.2 Completing financial markets: The mechanism
I now dig deeper into the mechanism and try to distinguish between the adverse
selection channel and the “missing market” channel. These two channels can be dis-
tinguished based on their predictions about changes in the composition of the pool of
traders around the introduction of central clearing.
While trader-level data on futures transactions are not available, I collected daily
data on the names of individual traders in the spot coffee market (from the Bulletin de
correspondance). I thus rely on the assumption that, in the cross-section of traders, a
greater access to futures markets positively correlates with access to the spot market.
20

I collect these data for a period covering one year before and after the creation of
the CLAM. Furthermore, from yearly registers of commodity traders (Almanach du
commerce du Havre), I find for each of them the year in which they started and
ceased operations.19 Panel A of Table 7 describes the data using two-sample t-tests
comparing the number and concentration of traders around the creation of the CLAM.
The average number of traders increased both at daily and monthly frequencies (by 0.7
and 3.7 traders respectively), while the concentration of trading activity – measured by
the Herfindhal index – decreased. While this increase in the set of traders is consistent
with both the adverse selection and the “missing market” channels, I now conduct two
tests to distinguish between them.
As a first test, I study the share of low-quality traders, defined as traders who exit
the market within the subsequent two years. Specifically, I estimate
Sharet = α + β · Postt + εt, (3)
where Sharet is the share of transactions executed by low-quality traders and Posttis a dummy variable equal to one after the creation of the CLAM. If adverse selection
is large before the CLAM, the coefficient β is expected to be negative. Indeed, after
the CLAM is in place, high-quality traders find it more valuable to enter the market,
while low-quality traders may be excluded from the market if collateral requirements
play a screening role. I report estimates of Equation (3) in Panel B of Table 7. The
estimated share of low-quality traders over the entire sample period is relatively low
(8.2%) and, most importantly, the coefficient β on Postt is not significantly different
from zero. The fact that the share of low-quality traders does not change around the
creation of the CLAM is inconsistent with the idea that adverse selection due to their
presence was large. Since these traders had been operating for years, their quality had
arguably been revealed (at least with a reasonable level of confidence). If this is the
case, I conclude that the main effect of central clearing for long-established traders
was to solve a “missing market” problem.19In the trade-level data, counterparties are not always identified, but this does not change with the
creation of the CLAM. There are 2,200 trader-day observations, corresponding to 83 unique traders.Only two of them cannot be matched to data on the start and end dates of operations. Furthermore,the reason for exiting the market is not known.
21

As a second test, I study the share of new traders around the creation of the
CLAM, defined as traders who entered the market in the preceding two years. Indeed,
the above argument about trader quality being partially revealed requires traders to
have been active in the market for some time; this is arguably not the case for new
traders. I re-estimate Equation (3), with the share of transactions executed by new
traders as dependent variable. Estimates, also in Panel B of Table 7, show that this
share significantly jumps after central clearing is in place. In terms of magnitude, it
is multiplied by a factor of three, from 4.8% to 14.7%. This result is consistent with
the idea that new traders, whose reputation is not yet established, faced significant
adverse selection problems. In sum, there were informational barriers to entry before
the CLAM was in place. To further support this idea, I collect trader identities from
yearly registers until 1886. As seen in Figure A1, there was significant entry of new
commodity traders after 1883. Among them, those explicitly identified as coffee traders
increased from 43 in 1882 to 55 in 1886.20
To conclude, I find partial evidence consistent with both the “missing market” and
the “adverse selection” channels. In the subset of long-established traders, adverse
selection was not a major issue, and the introduction of the CLAM compensated the
absence of a market to trade counterparty risk. In the subset of new traders, the
CLAM eliminated adverse selection and removed informational barriers to entry.21
5.3 Other potential mechanisms
Next, I rule out alternative mechanisms that could explain my results.
Price transparency
A first possibility is that the trade results are due to an increase in price trans-
parency associated with the creation of the CLAM. As Figure 6 shows, public price
information shifted from an approximative discussion of prices (left panel) to a detailed
price schedule for each maturity (right panel) on the day the CLAM opened. The-20These figures do not reflect the total number of houses involved in coffee trading. Indeed, many
of them dealt with several commodities and did not explicitly identify as coffee traders.21Given that the CLAM was created by established traders (see Appendix B.2), they must have
agreed to lose part of their informational rents to new entrants. This suggests that, in their view, the“missing market” problem was in itself an important concern.
22

oretically, price transparency should reduce price dispersion and informational rents,
increase matching efficiency and allow more gains from trade to be realized (Duffie,
Dworczak, and Zhu, 2017; Martin, 2018).
This mechanism is unlikely to be dominant here. First, while it is true that price
transparency improved, it didn’t do so only for traders in Le Havre. In the 1880s,
prices were quickly disseminated by telegraph to all other European markets, and to
the United States.22 Thus, if price transparency improved in all markets, we should
not expect the trade effect to be localized in Le Havre. Second, the futures exchange
and the CLAM were separate entities, so that one could trade futures and choose
not to clear them with the CLAM. Therefore, if traders had been primarily seeking
price transparency, they could have engaged in free-riding, by benefiting from price
information while avoiding the costs associated with using the CLAM. Instead, as
discussed, virtually all traders were clearing trades through the CLAM, and the CLAM
earned significant profit out of clearing fees from the first year of operations.
Standardization
A second possible mechanism to explain the trade effects could be the increase in
contract standardization that coincided with the creation of the CLAM. Specifically, a
futures markets was created in Le Havre in 1881, slightly more than a year before the
creation of the CLAM. At that time, futures became more standardized. Standard-
ization further increased with the creation of the CLAM, as one single coffee grade
became publicly quoted. Standardization makes contracts more liquid. Indeed, due
to the existence of externalities in liquidity provision decisions, a single traded future
is more liquid than multiple contracts (Pagano, 1989). Moreover, if all investors trade
standardized grades, the concern that some investors have private information specific
to a given grade is lower. Therefore, bid-ask spreads – a compensation for adverse
selection – are lower (Gorton and Pennacchi, 1993) and risk-sharing is easier.
This alternative explanation can be ruled out based on already mentioned argu-
ments. Most importantly, if investors were primarily seeking standardized contracts
regardless of whether they are centrally cleared, they could free ride on the CLAM.
This is inconsistent with the fact that virtually all transactions were centrally cleared.22The first transatlantic telegraph cable started operating in 1866 (Steinwender, 2017).
23

Second, while the use of the CLAM was restricted to counterparties located in Le
Havre, trading was open to investors in other markets. Therefore, if the availability
of trading more standardized contracts was a dominant force, there is no reason why
the effect should be concentrated in Le Havre.
Why is the effect localized?
While other mechanisms are inconsistent with a localized effect in Le Havre (since
price transparency and standardization increased for virtually anyone), several ele-
ments suggest that markets became more complete only for traders localized in Le
Havre. Indeed, while trading was open to any investor, clearing was easier for traders
located in Le Havre. First of all, any counterparty to the CLAM had to be located in
Le Havre. Counterparties located outside Le Havre could thus only clear trades via a
broker. Moreover, the ability to pay margin calls, was more limited for counterparties
outside Le Havre, due to technological reasons. Finally, the CLAM could refuse to reg-
ister transactions in case it lacked information about counterparties, which was more
likely to occur for distant counterparties. Due to these features, it is reasonable to
conclude that the creation of the CLAM made markets more complete predominantly
for traders in Le Havre.
5.4 Central clearing vs. other contracts
Theoretically, a remaining question is whether the increase in market completeness due
to central clearing could have been achieved without a CCP. Relying on a description
of the market by Sayous (1898), partially reproduced in Appendix B.1, I argue that
simpler contractual arrangements could not be equivalent to a CCP.
In 1882, coffee importers faced a specific contracting problem. To operate long-
distance boats, they typically relied on advances from banks or wealthy individuals
(Dany, 1900). In the months leading up to the creation of the CLAM, importers
in Le Havre had bought large amounts of coffee, following a large crop, to store it
in the expectation of future high prices. However, the magnitude of the purchases
had been such that importers were cash constrained, and needed liquidity to continue
operations. To solve this problem, several contractual solutions were possible.
24

A first possibility could have been for importers to borrow from financiers by pledg-
ing coffee stocks as collateral. However, as mentioned by Sayous (1898), such loans
“could not attract capitalists and speculators who ignored differences in coffee quality.”
In other terms, coffee was not a good collateral because of adverse selection concerns:
financiers feared ending up with the worse grades of coffee. Therefore, collateralized
loans were not feasible. For the same reason, coffee sales to financiers in order to raise
cash were not feasible.
To solve this adverse selection problem, the solution had to rely on the use of term
transactions. Namely, financiers could buy coffee but only with an agreement to resell
at a future date and at a price decided immediately. In principle, this arrangement
avoids adverse selection concerns about the quality of collateral, provided that the
counterparty is indeed able to buy back the coffee at maturity.23 However, there is no
reason why counterparties would never default at maturity, especially since their expo-
sure to prices was high, due to the size of their stocks. As Sayous (1898) confirms, one
needed “to find a way to reduce the risks for capitalists.” Therefore, uncollateralized
forwards were not feasible.
Lastly, the question is whether collateralized forwards, instead of a CCP, could
work. As mentioned, collateral needed to be information-insensitive, and could thus
only include cash or high-quality securities. However, evidence shows that the cost
of posting such collateral was high. In addition to being cash-constrained, importers
faced transaction costs associated with bilateral margin calls: posting collateral re-
quired visiting every counterparty to deliver and collect securities (which were paper
certificates). Relative to this situation, the creation of a CCP reduced the cost of
posting collateral. First, all collateral was posted in one place.24 Second, and most
importantly, by becoming direct counterparty to every transaction, the CLAM could
offer multilateral netting facilities, that is, call margins based on the net position of
any given trader across all of its counterparties. Therefore, creating a CCP was more
cost-efficient than the collateralization of bilateral futures. Sayous (1898, p. 280) con-
firms that outright sales together with cleared futures were taking place: “[financiers]23This is akin to a repurchase agreement (repo). Holmström (2015) justifies the existence of repos
precisely as a way to borrow while avoiding adverse selection concerns about the quality of collateral.24According to its rulebook, the CLAM accepted cash and securities (at its discretion) as collateral.
25

bought in the spot market to resell in the term market”.
6 Conclusion
I study the real effects of central clearing, a contracting innovation that suddenly made
financial markets more complete. After its introduction for coffee futures in Le Havre
in 1882, central clearing significantly changed the geography of trade flows in France
and Europe: for cleared commodities, trade flows increasingly went through Le Havre.
Regarding the mechanism, central clearing both mitigated adverse selection issues and
resolved a “missing market” problem.
While central clearing proved beneficial when first introduced, one should remain
careful when drawing implications for current debates about mandatory central clear-
ing. There are at least two novel elements to be taken into account. First, central
clearing in the 1880s was voluntary. Instead, mandatory clearing may create new
agency problems, since CCPs now have more captive clients and potentially benefit
from implicit guarantees. Second, the CLAM was closely resembling a member-owned
institution. In contrast, for-profit CCPs – which are now common – may be less in-
clined to manage risk so as to avoid externalities that impair the market’s functioning.
More research is needed on the optimal design of CCPs when regulation is in place.
ReferencesAcemoglu, D. and F. Zilibotti (1997). Was Prometheus unbound by chance? Risk,diversification, and growth. Journal of Political Economy 105, 709–751.
Akerlof, G. A. (1970). The market for “lemons”: Quality uncertainty and the marketmechanism. Quarterly Journal of Economics 84, 488–500.
Allen, F. and D. Gale (1988). Optimal security design. Review of Financial Studies 1,229–263.
Becker, U. (2002). Kaffee-konzentration: Zur Entwicklung Und Organisation DesHanseatischen Kaffeehandels. Franz Steiner Verlag.
Bernanke, B. and M. Gertler (1989). Agency costs, net worth, and business fluctua-tions. American Economic Review 79, 14–31.
26

Bernstein, A., E. Hughson, and M. Weidenmier (2017). Counterparty risk and theestablishment of the NYSE clearinghouse. Journal of Political Economy (forthcom-ing).
Biais, B., F. Heider, and M. Hoerova (2012). Clearing, counterparty risk and aggregaterisk. IMF Economic Review 60, 193–222.
Biais, B., F. Heider, and M. Hoerova (2016). Risk-sharing or risk-taking? Counterpartyrisk, incentives and margins. Journal of Finance 71, 1669–1698.
Bignon, V. and G. Vuillemey (2018). The failure of a clearinghouse: Empirical evi-dence. Review of Finance (forthcoming).
Börner, L. and J. W. Hatfield (2017). The design of debt-clearing markets: Clear-inghouse mechanisms in preindustrial Europe. Journal of Political Economy 125,1991–2037.
Brunn, E. M. (1931). The New York Coffee and Sugar Exchange. The Annals of theAmerican Academy of Political and Social Science 155, 110–118.
Brunnermeier, M. K. and Y. Sannikov (2014). A macroeconomic model with a financialsector. American Economic Review 104, 379–421.
Cruz Lopez, J., C. Hurlin, J. H. Harris, and C. Pérignon (2017). CoMargin. Journalof Financial and Quantitative Analysis 52, 2183–2215.
Dang, T. V., G. Gorton, B. Holmström, and G. Ordonez (2017). Banks as secretkeepers. American Economic Review 107, 1005–1029.
Dany, A. (1900). Manuel pratique des opérations commerciales et des documents com-merciaux. Berger-Levrault et Cie.
Davila, E. and T. Philippon (2017). Incompleteness shocks. Working paper .
De Roover, F. E. (1945). Early examples of marine insurance. Journal of EconomicHistory 5, 172–200.
De Rousiers, P. (1903). Le port du Havre. Revue de Paris 10, 163–187.
Depitre, E. (1907). Les caisses de liquidation des opérations à terme sur marchandises.Arthur Rousseau.
Di Tella, S. (2018). Uncertainty shocks and balance sheet recessions. Journal ofPolitical Economy (forthcoming).
Duffie, D., P. Dworczak, and H. Zhu (2017). Benchmarks in search markets. Journalof Finance 72, 1983–2044.
Duffie, D., M. Scheicher, and G. Vuillemey (2015). Central clearing and collateraldemand. Journal of Financial Economics 116, 237–256.
27

Duffie, D. and H. Zhu (2011). Does a central clearing counterparty reduce counterpartyrisk? Review of Asset Pricing Studies 1, 74–95.
Emery, H. C. (1896). Speculation on the Stock and Produce Exchanges of the UnitedStates, Volume 7. Studies in History, Economics and Public Law.
Emery, H. C. (1898). The results of the German Exchange Act of 1896. PoliticalScience Quarterly 13, 286–320.
Fuchs, C.-J. (1891). Der Waren-Terminhandel: seine Technik und volkswirtschaftlicheBedeutung. Duncker & Humblot.
Gorton, G. and G. Pennacchi (1990). Financial intermediaries and liquidity creation.Journal of Finance 45, 49–71.
Gorton, G. and G. Pennacchi (1993). Security baskets and index-linked securities.Journal of Business 66, 1–27.
Graham, H. C. (1912). Coffee: Production, trade and consumption by countries. USDepartment of Agriculture.
Greif, A. (1993). Contract enforceability and economic institutions in early trade: TheMaghribi traders’ coalition. American Economic Review 83, 525–548.
Greif, A. (2006). Institutions and the path to the modern economy: Lessons frommedieval trade. Cambridge University Press.
Holmström, B. (2015). Understanding the role of debt in the financial system. Workingpaper .
Kiyotaki, N. and J. Moore (1997). Credit cycles. Journal of Political Economy 105,211–248.
Koeppl, T., C. Monnet, and T. Temzelides (2012). Optimal clearing arrangements forfinancial trades. Journal of Financial Economics 103, 189–203.
Krishnamurthy, A. (2003). Collateral constraints and the amplification mechanism.Journal of Economic Theory 111, 277–292.
Levine, R. (2005). Finance and growth: Theory and evidence. Volume 1 of Handbookof Economic Growth, pp. 865–934. Elsevier.
Martin, T. (2018). Real effects of price transparency: Evidence from steel futures.Working paper .
Menkveld, A. J. (2017). Crowded trades: An overlooked systemic risk for centralclearing counterparties. Review of Asset Pricing Studies 7, 209–242.
Moser, J. T. (1998). Contracting innovations and the evolution of clearing and settle-ment methods at futures exchanges. Working paper .
28

North, D. C. (1991). Institutions. Journal of Economic Perspectives 5, 97–112.
North, D. C. and R. Thomas (1973). The Rise of the Western World: A New EconomicHistory. Cambridge University Press.
Pagano, M. (1989). Trading volume and asset liquidity. Quarterly Journal of Eco-nomics 104, 255–274.
Rischbieter, J. L. (2011). Mikro-Ökonomie der Globalisierung: Kaffee, Kaufleute undKonsumenten im Kaiserreich 1870-1914. Böhlau.
Rufenacht, C. (1955). Le Café et les principaux marchés de matières premières. S.C.I.Le Havre.
Sayous, A.-E. (1898). Etude économique et juridique sur les bourses allemandes devaleurs et de commerce. Arthur Rousseau.
Steinwender, C. (2017). Real effects of information frictions: “when the states and thekingdom became united”. American Economic Review (forthcoming).
Tapolski, W. (1896). Der Kaffeeterminhandel. L. Gräfe und Sillem.
Wakeman, A. (1914). History and reminiscences of lower Wall Street and vicinity.The Spice Mill Publishing Co.
29

Table 1 – Share of France’s main harbors in colonial commodities trade - 1877 to 1882
This table reports the share of total French imports arriving in seven major harbors. We report sharesfor coffee, for the five commodities in our main control group, as well as for total imports (both involume and value). The shares are averaged over the period from 1877 to 1882, and thus correspondto the period just before the creation of the CLAM.
Share of total French imports arriving in:
Bordeaux Dunkerque Le Havre Marseille Nantes Paris Rouen
Cocoa 0.322 0 0.320 0 0.114 0.226 0Coffee 0.105 0.001 0.605 0.216 0.017 0.034 0.012Pepper 0.065 0 0.212 0.665 0.058 0 0Sugar 0.088 0.007 0.063 0.341 0.201 0.278 0.001Tea 0 0 0 0.921 0 0.079 0Tobacco 0.272 0.071 0.349 0.264 0 0.007 0Total (volume) 0.082 0.076 0.117 0.169 0.014 0.025 0.058Total (value) 0.069 0.058 0.201 0.255 0.012 0.118 0.030
30

Table 2 – Triple difference-in-differences estimation – French trade flows
This table displays the results from the estimation of Equation (1). It is estimated on the sampleof 23 French harbors. In columns (1) to (3), the share of total imports of commodity c in harbor hin year t is used as dependent variable, while column (4) uses the share of total exports and column(5) uses the share of total stocks. In columns (1), the control group includes colonial commodities,specifically: cocoa, pepper, sugar, tea and tobacco. In column (2) the control group includes the samecolonial commodities except sugar. In column (3), the control group includes the sum of all importedgoods. In column (4), the control group includes the sum of all exported goods. The creation ofthe CLAM occurred in December 1882. Data is at a yearly frequency over the period 1877-1888.Standard errors are in parentheses. ∗, ∗∗ and ∗∗∗ refer respectively to statistical significance at the10%, 5% and 1% levels.
Dependent variable:Share of Share of Share of Share of Share ofimports imports imports exports stocks
CCPht · Clearedc 0.111∗∗∗ 0.092∗∗∗ 0.177∗∗∗ 0.247∗∗∗ 0.158∗∗∗(0.020) (0.019) (0.008) (0.018) (0.037)
Clearedc · Postt -0.004 -0.004 -0.007∗∗∗ -0.010∗∗∗ -0.014(0.004) (0.004) (0.001) (0.003) (0.011)
CCPht 0.049∗∗∗ 0.069∗∗∗ -0.016∗∗∗ 0.013 0.029∗(0.008) (0.008) (0.005) (0.012) (0.015)
Control group Colonial Colonial Total Total ColonialIncl. sugar Yes No - - YesR2 0.944 0.953 0.991 0.964 0.878N. Obs. 1,656 1,380 552 552 772
31

Table 3 – Triple difference-in-differences estimation – Other commodities
This table displays the results from the estimation of Equation (1) with commodities other thancoffee. It is estimated on the sample of 23 French harbors. In all columns, the share of total imports ofcommodity c in harbor h in year t is used as dependent variable. In column (1), the treated commodityis raw cotton, while control commodity is raw wool. In column (2), the treated commodities and rawcotton and cotton textiles, while control commodities are raw wool, wool textiles and silk textiles. Incolumn (3), the treated commodity is indigo, and the control group is the sum of all imported goods.Cotton started being centrally cleared in December 1882, while indigo was cleared in 1887. Data isat a yearly frequency over the periods 1877-1888 (for cotton) and 1882-1890 (for indigo). Standarderrors are in parentheses. ∗, ∗∗ and ∗∗∗ refer respectively to statistical significance at the 10%, 5%and 1% levels.
Dependent variable:Share of imports
Cotton (raw) Cotton (raw Indigoand textiles)
CCPht · Clearedc 0.142∗∗∗ 0.072∗∗∗ 0.046∗∗∗(0.020) (0.015) (0.010)
Clearedc · Postt -0.006 -0.003 -0.002(0.004) (0.003) (0.002)
CCPht -0.171∗∗∗ -0.036∗∗∗ 0.000(0.014) (0.009) (0.007)
Control group Raw Raw and textiles TotalR2 0.966 0.932 0.984N. Obs. 552 1,380 414
32

Table 4 – Share of colonial commodities imports from France - 1877 to 1882
This table reports the share of total imports of colonial commodities of Belgium, Germany, Ham-burg, Italy, Netherlands, Norway and Sweden that arrive from France. The list of reported colonialcommodities depends on the availability of data in country-level customs data. Import shares areaveraged over the period from 1877 to 1882, and thus correspond to the period just before the creationof the CLAM.
Share of imports arriving from France:
Belgium Germany Hamburg Italy Netherlands Norway Sweden
Cinnamon - - - 0.208 - - 0.003Cocoa 0.642 - 0.124 0.396 - - 0.020Cocoa and tea - 0.031 - - - - -Coffee 0.126 0.009 0.020 0.217 0.028 0.027 0.024Molasses 0.256 - - 0.610 0.004 0.152 0.058Black pepper - - 0.037 - - - 0Chili pepper - - 0.018 - - - -All pepper - - - 0.196 - - -Spices - 0.007 - - 0.008 - -Sugar - 0.140 0.000 - 0.002 - -Sugar - raw - - - 0.098 - - 0.003Sugar - refined 0.452 - - 0.124 - - 0.114Tea 0.073 - - 0.241 0.000 0.001 0Tobacco 0.021 0.001 0.042 0.005 0.019 0.000 0Vanilla - - 0.108 0.645 - - -Other - - - - - 0.005 -
33

Table 5 – Triple difference-in-differences estimation – European trade flows
This table displays the results from the estimation of Equation (2). It is estimated separately foreach of the following countries: Belgium, Germany, Hamburg, Italy, Netherlands, Norway, Sweden.The dependent variable is always the share of imports of commodity c from country p in year t. Thecontrol group includes all main colonial commodities, whose exact list depends on the country. Thecreation of the CLAM occurred in December 1882. Data is at a yearly frequency over the period 1877-1888. Standard errors are in parentheses. ∗, ∗∗ and ∗∗∗ refer respectively to statistical significance atthe 10%, 5% and 1% levels.
Dependent variable: Share of imports from country p
Belgium Germany Hamburg Italy Netherlands Norway Sweden
CCPpt · Clearedc 0.062∗∗ 0.073∗ 0.029∗ 0.030 0.058∗∗ 0.047∗∗ 0.041∗(0.030) (0.044) (0.017) (0.027) (0.029) ( 0.023) (0.024)
Clearedc · Postt -0.002 -0.004 -0.000 -0.001 -0.003 -0.001 -0.001(0.003) (0.011) (0.002) (0.004) (0.007) (0.004) (0.005)
CCPpt -0.005 -0.008 0.014∗∗ -0.094∗∗∗ -0.000 -0.051∗∗∗ -0.019∗∗(0.009) (0.019) (0.006) (0.008) (0.012) (0.009) (0.008)
Control group Colonial Colonial Colonial Colonial Colonial Colonial ColonialR2 0.854 0.808 0.931 0.828 0.884 0.910 0.899N. Obs. 1,648 864 3,735 4,080 1,368 1,728 2,484
34
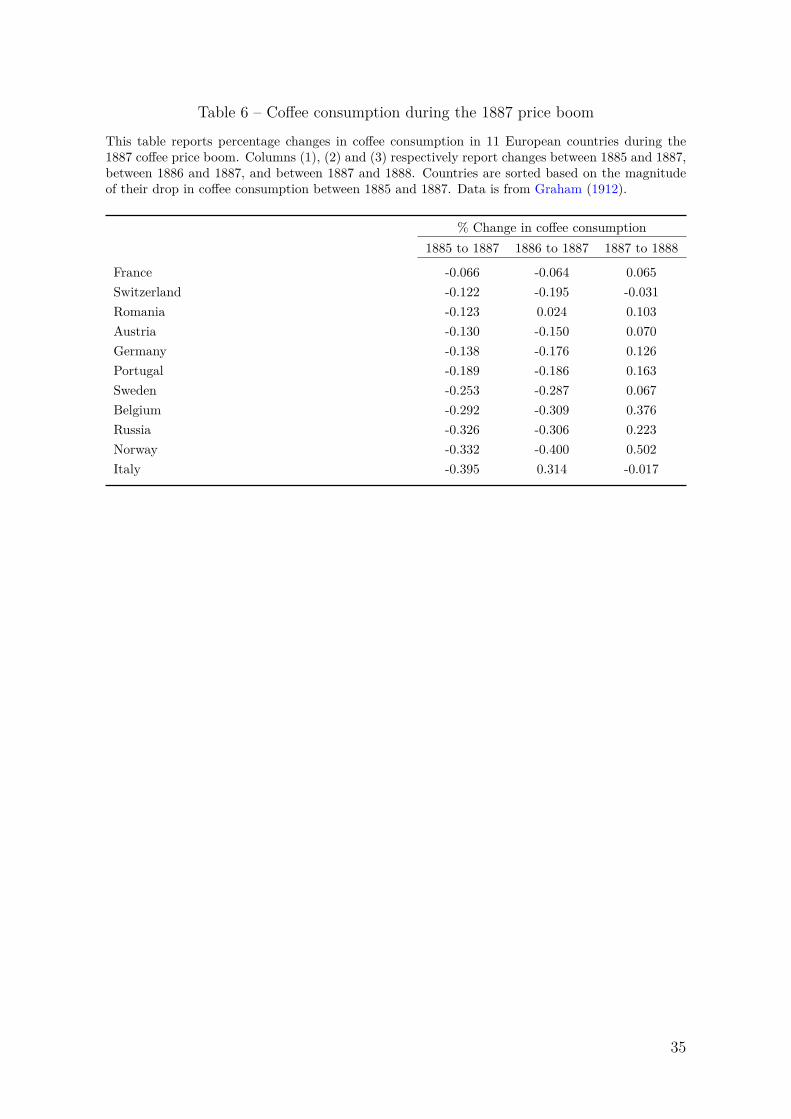
Table 6 – Coffee consumption during the 1887 price boom
This table reports percentage changes in coffee consumption in 11 European countries during the1887 coffee price boom. Columns (1), (2) and (3) respectively report changes between 1885 and 1887,between 1886 and 1887, and between 1887 and 1888. Countries are sorted based on the magnitudeof their drop in coffee consumption between 1885 and 1887. Data is from Graham (1912).
% Change in coffee consumption1885 to 1887 1886 to 1887 1887 to 1888
France -0.066 -0.064 0.065Switzerland -0.122 -0.195 -0.031Romania -0.123 0.024 0.103Austria -0.130 -0.150 0.070Germany -0.138 -0.176 0.126Portugal -0.189 -0.186 0.163Sweden -0.253 -0.287 0.067Belgium -0.292 -0.309 0.376Russia -0.326 -0.306 0.223Norway -0.332 -0.400 0.502Italy -0.395 0.314 -0.017
35

Table 7 – Pool of traders around the event
This table describes the pool of coffee traders around the creation of the CLAM. Panel A describes thedata by performing two-sample t-tests comparing three variables one year before and one year afterthe creation of the CLAM (“Pre” and “Post”, respectively): the number of distinct traders per day,the number of distinct traders per month, and the Herfindhal index (HHI) computed based on eachtrader every month. In Panel B, I report estimates of Equation 3. In Column (1), the dependentvariable is the share of trades executed by traders who will cease to operate in the following twoyears. In Column (2), the dependent variable is the share of trades executed by traders who startedoperation in the past two years. Data on trading is collected at a daily frequency from the Bulletin decorrespondance and relates to traders in physical coffee only. Data on new and defaulting traders iscollected from the Almanach du commerce du Havre. The sample period is January 1882 to December1883, and the CLAM was introduced on 16 December 1882. Standard errors are in parentheses. ∗,∗∗ and ∗∗∗ refer respectively to statistical significance at the 10%, 5% and 1% levels.
Panel A: Description of coffee trading data
Pre Post Post − Pre p-value N. Obs
Number of traders / day 3.440 4.147 0.706∗∗∗ (0.000) 578Number of traders / month 23.454 27.166 3.712∗∗ (0.042) 23HHI traders / month 0.071 0.063 -0.007∗ (0.091) 23
Panel B: Composition of the pool of coffee traders
Dependent variable:Share of trades Share of trades
by members near distress by recent members
Postt -0.004 0.099∗∗∗(0.014) (0.014)
Constant 0.082∗∗∗ 0.048∗∗∗(0.010) (0.010)
R2 -0.002 0.074N. Obs. 577 577
36

Figure 1 – Sample of French harbors and main customs
This map shows the sample French harbors and main customs used in our sample when estimatingEquation (1). There are 22 entry/exit points in metropolitan France, plus one in Corsica (notmapped). Le Havre is denoted with a red dot. The two points within land – Rouen and Paris – areon a river connected to the ocean (the Seine), and had standalone customs. The full list of harborsis given in Appendix A.3. Note that the French territory was smaller during our sample period thanit is today, due to the takeover by Germany of Alsace and Moselle in 1871.
37

Figure 2 – Share of French imports/exports in Le Havre
This figure plots the share of French imports and exports respectively arriving in Le Havre andleaving from Le Havre. The shares are plotted for imports and exports both in volume (weight in100 kilograms) and in value (current FRF). The dotted vertical line corresponds to the creation ofthe CLAM in December 1882.
1878 1880 1882 1884 1886 1888 18900
0.05
0.1
0.15
0.2
0.25
0.3
Sha
re o
f Fre
nch
impo
rts/
expo
rts
Imports - VolumeImports - ValueExports - VolumeExports - Value
38

Figure 3 – The 1886-1887 coffee price boom
This figure shows monthly coffee prices in FRF/ton over the 1878-1893 period. The 1886-1887 priceboom is due to exceptionally low crops in Brazil, the largest producing country worldwide. Data isbased on prices in Hamburg. Source: Tapolski (1896), converted into FRF/kg.
1878 1880 1882 1884 1886 1888 1890 18920
20
40
60
80
100
120
Cof
fee
pric
e (in
FR
F /
kg)
39

Figure 4 – Coffee consumption during the 1887 boom
This figure plots log-consumption of coffee, net of a fixed effect, during the 1887 coffee price boom.Coffee consumption is shown for France, Germany, Europe (excluding France and Germany) and forthe world (excluding Europe). The dashed vertical line indicates year 1887, when the coffee priceboom took place. Data is from Rufenacht (1955).
1880 1885 1890 1895-0.3
-0.2
-0.1
0
0.1
0.2
Con
sum
ptio
n (in
log)
FranceGermanyEurope excl. FR and DEWorld excl. EU
40

Figure 5 – Trading volume in coffee future
This figure plots the trading volume in coffee futures at a daily frequency. The volume is expressedin thousand bags (1 bag ≈ 60 kilograms). The dotted vertical line corresponds to the creation of theCLAM in December 1882.
Jun. 1882 Dec. 1882 Jun. 18830
5
10
15
20
25
30
35
40
45
50
Tra
ding
vol
ume
in c
offe
e fu
ture
s (x
100
0 ba
gs)
41

Figure 6 – Improvement in price transparency
This figure plots two excerpts from a local newspaper, the Courrier du Havre, on the last day beforethe CLAM started operations (December 15th, 1882) and on the first day of operations (December16th, 1882). In the left panel, one can read “One may have paid 46 to 46.50 fr. for Jacmel [a gradeof coffee] to deliver, and one talks about Port-au-Prince [another grade of coffee], also to deliver,around 41 fr., but there are no quotations for this.” In the right panel, precise prices are given foreach tradable maturity.
December 15th, 1882 December 16th, 1882
42

Appendix – For Online Publication
A Data sources
I rely on the following sources.
A.1 Archive sources
• Archives municipales du Havre (Le Havre): Data are from four main sources.
– I obtained data on coffee prices, trading volume in futures, traders in phys-ical coffee, as well as a large number of telegraphic messages from the Bul-letin de Correspondance de la Bourse du Havre (collection starting in 1880;reference code: PER012 ).
– I consulted a daily local newspaper, the Journal du Havre (reference code:PER071 ), for general information about the local environment in the 1880s.
– I collected lists containing the identity of all commodity traders from yearlyregisters, the Almanach du commerce du Havre, for the years 1876-1886.
– I consulted several boxes and files related to coffee trade, but informationis very limited, due to the destruction of most archives in Le Havre duringWorld War II bombings.
• Archives départementales de Seine-Maritime (Rouen): From the archivesof the notary Pierre Léon Cheuret (reference codes: 2E64\169 to 2E64\327 ),I obtained the first rulebook of the CLAM, minutes from general assemblies,as well as the legal acts founding the corporation (including a detailed list ofshareholders with their equity stake, in file numbered 2E64\225 ).
• Archives nationales du monde du travail (Roubaix): Contains the versionof the CLAM’s rulebook as revised in 1884, and extracts from annual reportsfrom 1883 to 1890 (reference code: 65AQ-A-614 ).
A.2 Data on commercial flows
Yearly data on commercial flows at the commodity level are obtained country bycountry from the following sources. Data is collected from 1877 to 1888.
• France: Tableau général du commerce de la France avec ses colonies et les puis-sances étrangères, Direction générale des douanes.
• Germany: Handel des deutschen Zollgebiets mit dem Auslande in: StatistischesJahrbuch für das Deutsche Reich, Statistisches Reichsamt.
1
Appendix – For Online Publication
• Hamburg: Tabellarische Übersichten des hamburgischen Handels
• Italy: Movimento commerciale del Regno d’Italia, Direzione generale delle gabelle.
• Netherlands: Jaarstatistiek Handel – Koningrijk der nederlanden statistiek vanden in-, uit- en doorvoer, Departement van Financiën.
• Norway: Tabeller vedkommende Norges Handel in aaret ..., in Norges officiellestatistik, ny raekke, Udgivne af det Statistiske Centralbureau.
• Sweden: Commerce collegii underdåniga berättelse för år ..., in Bidrag tillSveriges officiela statistik - Utrikes handel och sjöfart, Kongl. Boktryckeriet.
A.3 Sample of French harbors
The harbor-level sample includes the following cities: (1) Avricourt, (2) Bayonne,(3) Belfort Petit-Croix, (4) Bordeaux, (5) Boulogne, (6) Calais, (7) Cette, (8) Corse,(9) Dieppe, (10) Dunkerque, (11) Jeumont, (12) Le Havre, (13) Lille, (14) Marseille,(15) Nantes, (16) Nice, (17) Pagny, (18) Paris, (19) Roubaix, (20) Rouen, (21) Saint-Nazaire, (22) Tourcoing, (23) Valenciennes-Blancmisseron.
2

Appendix – For Online Publication
B Additional historical background
This appendix presents additional historical background. Section B.1 describes thecrisis that led to the creation of the CLAM. Section B.2 shows that close ties betweenthe founders of the CLAM helped to overcome coordination problems. Section B.3shows evidence on the profitability of the CLAM. Section B.4 lists relevant referencesnot cited in the main text.
B.1 The 1880 coffee crisis
The 1880 crisis started primarily in the US. It is best known from the reminiscences ofa coffee trader, (Wakeman, 1914, Chap. “The Great Coffee Trade Failures of 1880”).A few additional useful elements are given by Brunn (1931) for the US and by Sayous(1898) for the French case. I complement these elements with contemporary newspa-pers and other archives.
Between 1870 and 1873, bad crops in Brazil raised global coffee prices and inducedfarmers to scale up production. The US market was then dominated by three importersknown as the “Trinity”: B. G. Arnold (New York), Bowie Dash & Company (NewYork) et O. G. Kimball & Company (Boston). These large importers benefited fromhigh prices until 1878-1879, when the coffee trees planted earlier in the decade reachedmaturity (coffee plants take several years to mature). Faced with abundant crops, theTrinity engaged in massive purchases for two years in order to maintain high prices.In 1880, the arrival of a new abundant crop made it impossible for them to continuesupporting prices. Therefore, coffee prices started to collapse. This triggered a waveof failures by the end of 1880. All three members of the Trinity ultimately defaulted,as well as other smaller US importers.
There is strong evidence that the 1880 crisis was associated with elevated levels ofcounterparty risk that impaired the functioning of the US coffee market. For example,Wakeman (1914, p. 139) writes on December 9th: “Absolutely no market. [...] Therewas no attempt to do business, everyone being suspicious of his neighbor. None of thelarger firms escaped suspicion, and many did not know if they would be the next to go.”Brunn (1931, p. 111) summarizes: “A chaotic situation therefore pervaded the coffeetrade during the months of October, November and December 1880. What with thesuccessive failures of the firms comprising the syndicate and the resultant dumpingof their large stocks on the market, complete demoralization prevailed. There waslittle or no attempt to do business. Everyone suspected his neighbor. Even the largerfirms did not escape suspicion. Thus the situation which faced the coffee trade in 1881
3

Appendix – For Online Publication
was indeed one of uncertainty. It appeared that the end of the old methods of doingbusiness had been reached, so new and improved methods were sought.”
Based on available sources, in particular local newspapers, there is no evidence thatthe 1880 crisis was as severe in Europe as in the US.25 However, the crisis was felt andtrading conditions are sometimes described as “depressed”.26 To obtain a measure ofthe rough extent of the crisis, I collected yearly data on commodity professionals activein the harbor of Le Havre between 1876 and 1886, for the Almanach du commercedu Havre (a registry of firms). After excluding professionals with no direct role incommodities trading (e.g., bankers and warehouses), I plot the measured number ofcommodity traders every year in Figure A1. While this figure should be interpretedwith caution – since it includes traders of all commodities and not just coffee –, aslowdown of activity is observed precisely in 1880. Indeed, the total number of tradersdropped by about 5%, from around 430 to 410. Given the importance of coffee tradingwithin Le Havre at the time, this chart is consistent with the view that the 1880 crisiswas felt locally.
However, the increase in counterparty risk that gave rise to the CLAM is not di-rectly linked to the crisis but follows it. While coffee prices had been dropping sharply,triggering failures in the US, a group of traders in Le Havre took this opportunity tobuild up large coffee stocks. Their large inventories then gave rise to a contractingproblem described by Sayous (1898, p. 279-280): “The coffee traders of Le Havre took,following excellent crops and in the expectation of bad ones, a very large long position:They stored considerable amounts of coffee, for a quantity reaching 1,400,000 bags.Importers soon had no more free cash and had to wait. Where could the necessarycapital come from? No one wanted, in such circumstances, make loans without realguarantees; but warrants by their nature could not attract capitalists and speculatorswho ignored the differences in coffee qualities.27 Furthermore, as the future lookedhighly uncertain, one needed not only to overcome the problem of the individualityof each coffee batch, but also to find a way to reduce the risks for capitalists. Anew regulation of the futures markets, closely linked to the creation of a central clear-ing counterparty, was considered the best solution given the state of affairs. Indeed,holders of capital, bankers, or even individual investors came in without fearing theinsolvency of counterparties [...] the crisis was solved.” It is therefore clear that, asin the US case, counterparty risk was material in Le Havre and prevented the coffee
25We have focused most of our searches on Le Havre. For Hamburg, Becker (2002) and Rischbieter(2011) do not mention major waves of failures.
26See, for example, the Bulletin de correspondance on December 9th and 10th, 1880.27A warrant is a financial instrument that enables borrowing by pledging commodities stored in a
warehouse as collateral.
4

Appendix – For Online Publication
market from operating efficiently. Furthermore, as discussed in Section 5.4, this tes-timony gives a precise idea of the contracting problem faced by traders in Le Havreand helps understanding why the creation of a CCP could solve problems that simplercontracting arrangements, such as collateralization, could not solve equally well.
B.2 The founders and members of the CLAM
This appendix discusses how characteristics of trading circles in Le Havre contributedto the successful creation of the CLAM. Specifically, close ties between a number ofold and important trading houses – including often family ties – helped to overcometwo problems. First, the CLAM could immediately benefit from a good reputation.Second, the joint participation of several trading houses solved a coordination probleminherent to the creation of CCPs: the benefits from using a CCP increase with thenumber of investors using it (Duffie and Zhu, 2011; Duffie et al., 2015).
The foundation of the CLAM was initially inspired by the reorganization of coffeetrade in New York (creation of the Coffee Exchange in the City of New York in 1882,including a clearinghouse which was not insulating traders from counterparty risk).Depitre (1907, p. 160-161) gives the following details: “During the year 1881, a traderfrom Le Havre, Mr. Le Normand, went to the US to study the organization of futuresmarkets in New York, Chicago, Baltimore, and other main commercial cities.28 Hesaw how futures transactions were generally guaranteed by margins that brokers anddealers were calling from each other: perhaps he also attended the negotiations thatled to the creation, early in 1882, of a coffee clearinghouse in New York. When hecame back, he disseminated the results of his study to several traders from Le Havrewho were importing coffee and cotton and who, at the same time, could also speculateon these commodities. These traders decided to complete and improve the techniquesused in the US and to create a special clearinghouse, which would concentrate alltransactions and guarantee their execution. The initiative of the creation was takenby the main trading houses in Le Havre: Latham et Cie, Jung et Himely, Lamothe etCie, Busch et Cie, etc.29”
To get a more precise idea on the founders of the CLAM, I obtained from the no-tarial archives the legal act of foundation of the company. The main shareholders arelisted in Table A1. Several features are noticeable. First of all, the largest shareholderwas Emmerick Le Normand, who had initiated the study on the market’s reform (25
28In some documents, the spelling “Lenormand” is also used.29“Lamothe” is spelled Lamotte in the notarial archives. Furthermore, Busch is not one of the
shareholders in 1882; he only appears as an equityholder in 1885.
5

Appendix – For Online Publication
out of 200 shares). Second, some of the shareholders are among the most active coffeetraders in Le Havre. This can be seen by comparing names to the trader-level dataused for the tests in Section 5.2. However, many large traders are also absent and seemnot to have participated to the creation of the CLAM. This is consistent with anecdo-tal reports that some of the largest trading houses opposed the creation of the CLAM.Third, a brief genealogical search shows that several of the main shareholders of theCLAM had close family ties.30 This is in particular the case of the families Latham(20 shares), Jung (8 shares), Iselin (3 shares), who are linked together and with a fewsmaller shareholders (Kronheimer, Pochet, Senn). Emmerick Le Normand (25 shares),who became vice-president of the board, was linked – although not through family ties– with some other large shareholders, Macleod (10 shares) and Dennis (6 shares).31
While central clearing involves significant network externalities and can give rise tofree-rider problems (i.e., everyone finds it optimal to join a CCP only after sufficientlymany other traders have joined), these close ties can explain why the original coor-dination problem could be solved: a critical mass of traders were committed to usethe CCP. The member-owned structure – with most of the shareholders being eithercommodity brokers or dealers – ensured that they had an interest to do so.32 Instead,several CCPs created in other cities in subsequent years did not manage to solve thiscoordination problem and had to close down quickly due to the lack of business (seeDepitre, 1907, for examples).
Soon after its creation, the CLAM was successful and expanded its base of equityholders. According to Depitre (1907, p. 162), “the usefulness of the CLAM was soonappreciated and, at the end of 1884, there was an attempt to create a competingclearinghouse, whose equity was quickly subscribed.33 This attempt ended up witha merger, that took place at the beginning of 1885.” The notarial act signed for thefoundation of this second society shows a significant expansion of the equity base(4,000,000 FRF) and of the membership. Some of the founders subscribed new shares(Le Normand, Latham) but, most importantly, most of the largest coffee traders whodid not initially participate to the CLAM then became shareholders of the new en-
30For the genealogical search, I relied mostly on “Michel de la Roche (1775-1852), ses aïeuxet descendants”, by Charles Rufenacht (available in the municipal archives in Le Havre, referenceGEN030 ), and on the website www.geneanet.org.
31In a notarial act signed on May 29, 1883, Le Normand gives power to Macleod and Dennis tomanage his business.
32The member-owned structure was also preserved via the voting mechanism. According to thestatutes of the CLAM, none of the equity holders could have more than 10 votes in the generalassembly, even with more than 10 shares. Therefore, no member could become to important relativeto other members.
33I did not find the notarial act corresponding to the foundation of this company. Either it was aproject that was never finalized, or the act was not made with the same notary as for the CLAM.
6

Appendix – For Online Publication
tity: Breckenridge, Busch, Couvert, Postel, Rivière, Schmidt, etc. There was thus aclear attempt to integrate users of the CCP as equity holders. This arguably givesmore incentives for traders to clear their transactions, but also to ensure the smoothfunctioning of the CCP.
B.3 Profitability of the CLAM
This appendix discusses the profitability of the CLAM, using data from annual reports(1883 to 1890 are available) combined with data reported in Depitre (1907).
Most importantly, the volume of cleared operations was high from the very begin-ning. The volume of cleared transactions equaled 185.8 million FRF in 1883, the firstyear of operations. It increased massively to 922.4 million FRF in 1884, consistent withthe fact that many traders that had initially been reluctant to use the CLAM turnedto it after several months. After the reorganization of the CLAM and the increasein equity in 1885 (see Appendix B.2), the volume then continued to grow to reach amaximum in 1887, equal to 2,478 million FRF. These high numbers reflect the factthat an overwhelming majority of futures transactions were cleared. Unfortunately, nobreakdown between operations on coffee, cotton, or other commodities, is available.
Due to this volume of operations, the CLAM was profitable starting in 1883 – itsfirst full year of operations. Figure A2 shows that income from interest and fees washigh in 1883-1884, and did not subsequently increase much more – but became morestable from 1890 onwards. Consequently the CLAM could pay dividends starting in1883 (72.5 FRF / share). In addition to paying dividends, the CLAM could use itsincome to retain earnings and increase reserves. Anecdotal evidence also suggests thatthe attempt by a group of traders unrelated to the CLAM to create a competing CCPin 1884 (as discussed in Appendix B.2), was also motivated by the high profitabilityof the CLAM.
B.4 Additional references
I used the following references (not cited in the main text) to get further informationabout the historical context or to cross-check information about the CLAM or otherrelevant aspects of the coffee market.
Delcambre, P. (1907). Les Caisses de liquidation et les opérations à terme sur marchan-dises, H. Morel.
Fauchère A. (1927). Le Café. Production, préparation, commerce. Société d’éditions
7
Appendix – For Online Publication
géographiques, maritimes et coloniales.
Findeisen, F. (1917). Der Kaffeehandel. Heinrich John.
François, G. (1897). Les chambres de compensation et les caisses de liquidation.Bulletin de l’Institut International de Statistique, 10, 76-94
Garvens, W. (1905). Kaffee. Kultur, Handel und Bereitung im Produktionslande.Verlag von Carl Brandes.
Gülpen, A. van (1896). Terminhandel und Währung. Carl Heymanns.
Jacobson, E. (1889). Terminhandel in Waaren. Allgemeine Kaffee-Zeitung.
Lacombe, R. (1939). La Bourse de commerce du Havre, Sirey.
Senn, O. (1888). Etude sur les marchés à terme en marchandises et leur liquidation,Guillaumin et Cie.
Ukers, W. H. (1922). All about coffee. The tea and coffee trade journal company.
8

Appendix – For Online Publication
Table A1 – Equity holders of the CLAM
This table displays the largest equity holders of the CLAM at its foundation (6th November 1882).The total equity capital was 2,000,000 FRF, broken down in 200 shares with a notional value of10,000 FRF each.
Occupation Number Equity Paid-inof shares amount amount
LENORMAND Emmerick – 25 250,000 62,500LATHAM Richard Dealer 20 200,000 50,000MACLEOD Edouard Broker 10 100,000 25,000LIONNET Charles – 10 100,000 25,000CHAMBRELAN Eugène Dealer 9 90,000 22,500JUNG Frédéric Dealer 8 80,000 20,000GAUSSEN Eugène Broker 8 80,000 20,000DENNIS Félix Broker 6 60,000 15,000DE HEYDEC Charles Broker 6 60,000 15,000LEFRANCOIS Emile Broker 5 50,000 12,500LAMOTTE et Cie Dealer 5 50,000 12,500KOCH Frédéric Broker 5 50,000 12,500FOERSTER Frédéric Dealer 5 50,000 12,500DURAND Jacques Broker 4 40,000 10,000CALLIGE Louis Broker 4 40,000 10,000LAUDE Alphonse Broker 3 30 7,500ISELIN William – 3 30 7,500HOFFMANN Francis – 3 30 7,500HOFFMANN Charles Broker 3 30 7,500FOSSAT Alexandre Broker 3 30 7,500
9

Appendix – For Online Publication
Figure A1 – Number of commodity traders in Le Havre
This figure plots a measure of the number of commodity traders (all commodities combined) at ayearly frequency in Le Havre, over the 1876-1886 period. Data is from yearly copies of the Almanachdu commerce du Havre and sums the number of commodity professionals active in the harbor atthe beginning of the year. I exclude a few observations for which the occupation is not directlyrelated to commodities trading (notably bankers and warehouses). I include observations for whichthe occupation is missing (about 15% of the data). The first vertical dashed line (in red) correspondsto the 1880 coffee crisis, which started in the second half of 1880. the second vertical dashed line (inblack) corresponds to the creation of the CLAM in December 1882.
1876 1877 1878 1879 1880 1881 1882 1883 1884 1885 1886390
400
410
420
430
440
450
Num
ber
of tr
ader
s (a
ll co
mm
oditi
es)
10
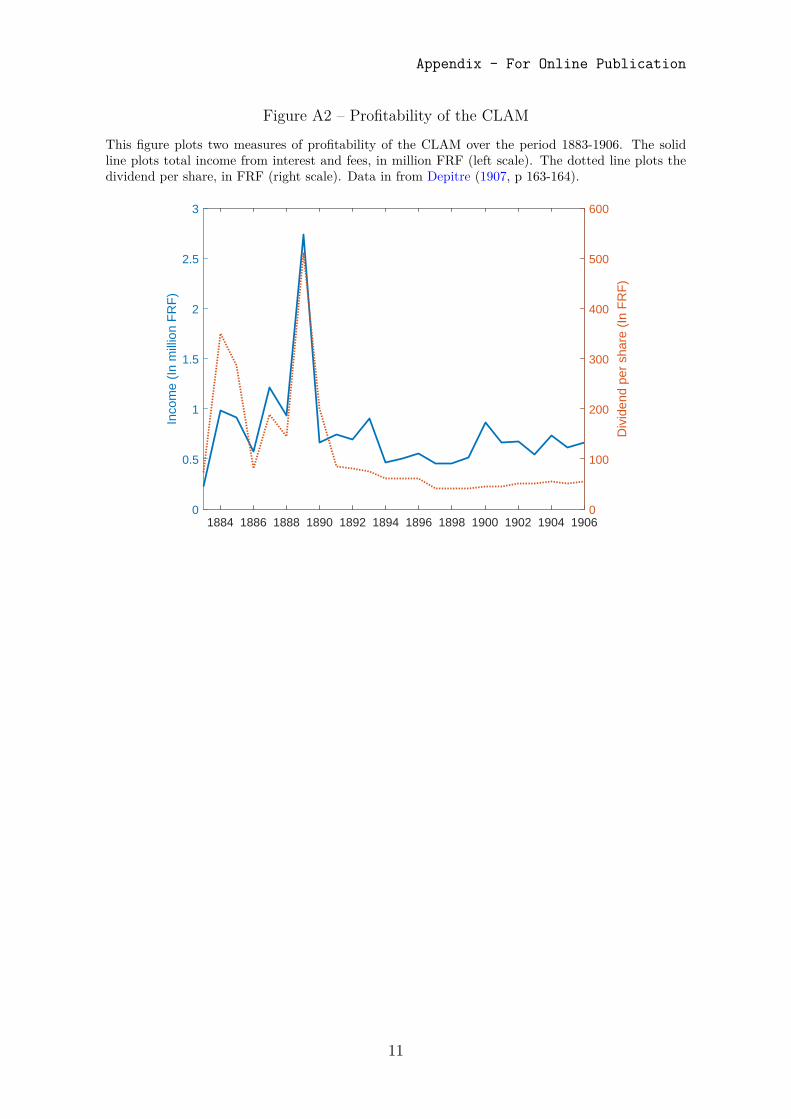
Appendix – For Online Publication
Figure A2 – Profitability of the CLAM
This figure plots two measures of profitability of the CLAM over the period 1883-1906. The solidline plots total income from interest and fees, in million FRF (left scale). The dotted line plots thedividend per share, in FRF (right scale). Data in from Depitre (1907, p 163-164).
1884 1886 1888 1890 1892 1894 1896 1898 1900 1902 1904 19060
0.5
1
1.5
2
2.5
3
Inco
me
(In
mill
ion
FR
F)
0
100
200
300
400
500
600
Div
iden
d pe
r sh
are
(In
FR
F)
11