
Competing with Complementors: An Empirical Look at …...
41
Competing with Complementors: An Empirical Look at Amazon.com* Feng Zhu Harvard University Boston, MA 02163 Email: [email protected] Qihong Liu University of Oklahoma Norman, OK 73019 Email: [email protected] Keywords: complementor, platform-based markets, Amazon, entry, co-opetition __________________ * For helpful discussions and insightful comments, we thank the associate editor and two anonymous reviewers, Juan Alcacer, Chris Forman, Shane Greenstein, Rebecca Henderson, Steve Herbert, Jerry Kane, Tobias Kretschmer, Michael Kummer, Christian Peukert, Gary Pisano, Henry Schneider, Aaron Smith, Scott Stern, Andy Wu, David Yoffie, participants in the TOM Red Zone Workshop and the Annual TOM Alumni Research Workshop at the Harvard Business School, IO Workshop at the University of Oklahoma, the Wharton Technology and Innovation Conference, the 13th International Industrial Organization Conference, the 6th Annual Conference on Internet Search and Innovation at Northwestern University, Platform Strategy Research Symposium, the Annual Meeting of the Academy of Management, and seminar participants at Bocconi University, Cheung Kong Graduate School of Business, Harvard Business School, University of Maryland, University of Michigan, University of Minnesota, New York University, University of Pennsylvania, Rice University, and University of Texas at Austin. Zhu gratefully acknowledges financial support from the Division of Research of the Harvard Business School.
Transcript of Competing with Complementors: An Empirical Look at …...

Competing with Complementors: An Empirical Look at Amazon.com*
Feng Zhu
Harvard University
Boston, MA 02163
Email: [email protected]
Qihong Liu
University of Oklahoma
Norman, OK 73019
Email: [email protected]
Keywords: complementor, platform-based markets, Amazon, entry, co-opetition
__________________
* For helpful discussions and insightful comments, we thank the associate editor and two anonymous
reviewers, Juan Alcacer, Chris Forman, Shane Greenstein, Rebecca Henderson, Steve Herbert, Jerry Kane,
Tobias Kretschmer, Michael Kummer, Christian Peukert, Gary Pisano, Henry Schneider, Aaron Smith, Scott
Stern, Andy Wu, David Yoffie, participants in the TOM Red Zone Workshop and the Annual TOM Alumni
Research Workshop at the Harvard Business School, IO Workshop at the University of Oklahoma, the
Wharton Technology and Innovation Conference, the 13th International Industrial Organization Conference,
the 6th Annual Conference on Internet Search and Innovation at Northwestern University, Platform Strategy
Research Symposium, the Annual Meeting of the Academy of Management, and seminar participants at
Bocconi University, Cheung Kong Graduate School of Business, Harvard Business School, University of
Maryland, University of Michigan, University of Minnesota, New York University, University of
Pennsylvania, Rice University, and University of Texas at Austin. Zhu gratefully acknowledges financial
support from the Division of Research of the Harvard Business School.

1
Competing with Complementors: An Empirical Look at Amazon.com
Abstract
Research summary: Platform owners sometimes enter complementors’ product
spaces and compete against them. Using data from Amazon.com to study Amazon’s
entry pattern into third-party sellers’ product spaces, we find that Amazon is more
likely to target successful product spaces. We also find that Amazon is less likely
to enter product spaces that require greater seller efforts to grow, suggesting that
complementors’ platform-specific investments influence platform owners’ entry
decisions. While Amazon’s entry discourages affected third-party sellers from
subsequently pursuing growth on the platform, it increases product demand and
reduces shipping costs for consumers. We consider the implications of these
findings for complementors in platform-based markets.
Managerial summary: Platform owners can exert considerable influence over
their complementors’ welfare. Many complementors with successful products are
pushed out of markets because platform owners enter their product spaces and
compete directly with them. To mitigate such risks, complementors could build
their businesses by aggregating non-blockbuster products or focusing on products
requiring significant platform-specific investments to grow. They should also
develop capabilities in new product discovery so that they could continually bring
innovative products to their platforms.

2
INTRODUCTION
Platform-based markets have become increasingly prevalent today (e.g., Moore, 1996; McGahan,
Vadasz, and Yoffie, 1997; Iansiti and Levien, 2004; Eisenmann, 2007; Kapoor and Agarwal, 2015;
Piezunka, Katila, and Eisenhardt, 2015). Often they are described as multi-sided in that platform
owners provide access to and support interaction among multiple groups of participants, such as
consumers and complementors (e.g., third-party service providers or app firms). A platform’s
success depends on its ability to bring the constituents of these groups on board (see, e.g., Rochet
and Tirole, 2003; Parker and Van Alstyne, 2005). Examples of platform-based markets include
video game consoles, smartphones, online auction markets, search engines, and social networking
sites. Thousands of entrepreneurs have built businesses and sell products and services on such
platforms. Collectively, these entrepreneurs create significant value. By the end of 2014, for
example, more than 1.7 million and 1.4 million applications had been developed for two popular
smartphone platforms, Google’s Android and Apple’s iOS, respectively, generating billions of
dollars of revenue for each platform owner.1
Platform owners can exert considerable influence over complementors’ welfare. Many
complementors with successful products have been pushed out of their markets not by competition
from counterparts, but by platform owners that choose to compete directly with the complementors
and appropriate the value from their innovations. For example, Netscape and Real Networks,
complementors of Microsoft’s Windows platform, were extinguished by the rival Microsoft
applications Internet Explorer and Windows Media Player; microblogging platform Twitter’s
release of its own client applications for mobile devices effectively locked out third-party client
applications; and Apple makes some previously essential third-party apps obsolete with every new
operating system it releases,2 sometimes simply rejecting apps for its devices if they compete with
its own current or planned offerings.3
1 Source: M. Graser (2015), “Apple doubles app store sales in 2014, setting a record,” Variety, 19 January,:
http://variety.com/2015/digital/news/apple-doubles-app-store-sales-in-2014-setting-a-record-1201396900/, accessed
February 2018. 2 See, e.g., K. Smith (2012), “10 popular Mac apps that Apple’s new operating system just made obsolete,” Business
Insider, 25 July, http://www.businessinsider.com/mountain-lion-apps-2012-7?op=1, accessed February 2018. 3 See, e.g., D. Rosenberg (2008), “Apple blocks competitive products from iPhone App Store--surprised?” CNET, 13
September, http://www.cnet.com/news/apple-blocks-competitive-products-from-iphone-app-store-surprised/; and R.
Singel (2009), “Apple rejects Google voice app, invites regulation,” Wired, 28 July,
http://www.wired.com/2009/07/apple-rejects-google-voice/, accessed February 2018.

3
These examples are consistent with the findings of several theoretical studies (e.g., Farrell
and Katz, 2000; Jiang, Jerath, and Srinivasan, 2011; Parker and Van Alstyne, 2014) that identify
incentives for profit-maximizing platform owners to imitate, and enter the product spaces of,
successful complementors. Other scholars (e.g., Gans and Stern, 2003; Iansiti and Levien, 2004)
observe that concern for the overall health of platform ecosystems should discourage platform
owners from competing directly with, and thereby sending negative signals to, complementors.
Consistent with the latter perspective, Gawer and Cusumano (2002) and Gawer and Henderson
(2007) find in an in-depth field study that Intel tries to avoid competing directly with
complementors that build devices on top of its microprocessors. Instead it enters markets in which
it is not satisfied with complementors’ products, and wants to motivate innovation through
competition. It would thus seem that if platform owners seek to improve consumer satisfaction
with the overall platform ecosystem, they should target the product spaces of underperforming
complementors.
Empirical evidence on platform owners’ entry strategies with respect to complementary
markets is scant. Intel’s complementors often have to make substantial platform-specific
investments to develop products compatible with Intel technologies. By committing to not
competing with them, Intel could encourage these complementors to make such investments. But
what about markets in which complementors do not have to make substantial platform-specific
investments? Will we observe different patterns for platform-owner entries in such markets? Are
platform owners more likely to target successful complementary products, or are they more likely
to target underperforming complementary products, which are often less likely to be noticed,
seeking to improve consumer satisfaction? How are consumers and complementors affected by
platform-owner entries? Our study pursues answers to these questions in order to further our
understanding of platform owners’ entry decisions across different product spaces and their
impacts on complementors.
We develop two hypotheses on platform owners’ entry patterns, concerning:
(1) what product spaces they will target, and (2) how their entry decisions are affected by platform-
specific investments. We then test these hypotheses using data from Amazon.com, the largest
online retailer in the United States and a platform on which third parties can sell products directly

4
to consumers. This empirical setting enables us to systematically analyze a platform owner’s entry
decisions into a wide range of complementary product spaces, in a setting in which third parties
typically do not need to make substantial platform-specific investments to sell products.
We collect data from Amazon in two rounds. In the first round, we identify a large set of
products offered by third-party sellers. In the second round, we check whether Amazon has chosen
to enter these product spaces. We find that Amazon enters three percent of complementors’ product
spaces over a ten-month period, and is more likely to enter the spaces of products with higher sales
and better reviews and that do not use Amazon’s fulfillment service. We also find that Amazon is
less likely to enter product spaces that require greater seller effort to grow. The result thus
highlights how complementors’ platform-specific investments influence platform owners’ entry
decisions, and helps explain the different entry patterns of Amazon and Intel (Gawer and
Cusumano, 2002; Gawer and Henderson, 2007). Our empirical evidence suggests that Amazon’s
entry strategy is likely premised on acquiring new information after forming partnerships with
third-party sellers. Using propensity-score matching to compare products affected and unaffected
by Amazon’s entry, we find that entry increases product demand and reduces shipping costs, and
affected third-party sellers are discouraged from growing their businesses on the platform.
Related literature
Our paper relates to several streams of literature. We add to the nascent stream of research on
platform-based markets, which currently centers on platform owners as the focal point of interest.
Scholars have examined platform owners’ pricing decisions (e.g., Rochet and Tirole, 2003; Parker
and Van Alstyne, 2005; Hagiu, 2006; Chen, Fan, and Li, 2012; Seamans and Zhu, 2014),
interactions between competing platforms (e.g., Armstrong, 2006; Economides and Katsamakas,
2006; Casadesus-Masanell and Llanes, 2011), the value of installed bases to platform owners seek-
ing to diversify into other markets (e.g., Eisenmann, Parker, and Van Alstyne, 2011; Edelman,
forthcoming) or introduce next-generation platforms (e.g., Claussen, Essling, and Kretschmer,
2015; Kretschmer and Claussen, 2015), platform owners’ management of complementors (e.g.,
Yoffie and Kwak, 2006; Parker and Van Alstyne, 2014; Cennamo and Panico, 2015; Cennamo

5
and Santalo, 2015), the timing of new platform owners’ entry into platform-based markets (e.g.,
Zhu and Iansiti, 2012), optimal information disclosure (e.g., Dai, Jin, and Luca, 2014; Nosko and
Tadelis, 2015), and platform governance choices, such as those related to exclusivity and limiting
the variety of applications (Cennamo and Santalo, 2013; Casadesus-Masanell and Halaburda,
2014). Studies of complementors tend to focus on positive outcomes of affiliation with platform
owners, inasmuch as complementors are afforded access to platforms’ installed bases (e.g.,
Venkatraman and Lee, 2004; Zhang and Li, 2010; Claussen, Kretschmer, and Mayrhofer, 2013).
The few studies that acknowledge potential expropriation threats from platform owners, excepting
the field studies of Gawer and Cusumano (2002) and Gawer and Henderson (2007), lack evidence
of platform owners’ entry patterns (Farrell and Katz, 2000; Jiang et al., 2011; Huang et al., 2013;
Qiu and Rao, 2017). By showing that complementors’ platform-specific investments may
help explain platform owners’ entry decisions, our study reconciles Intel’s avoidance
of direct competition with complementors and the frequency with which many
platform owners, including Microsoft, Apple, and Amazon, enter the product spaces
of complementors.
Our paper informs as well the literature on inter-organizational relationships, much of
which also emphasizes positive outcomes for participating firms (e.g., Eisenhardt and
Schoonhoven, 1996; Sarkar, Echambadi, and Harrison, 2001; Rothaermel, 2001, 2002; Gulati and
Higgins, 2003; Sarkar, Aulakh, and Madhok, 2009) and the value creation role played by hub firms
in inter-organizational networks (e.g., Zhang and Li, 2010; Kapoor and Lee, 2013). Consistent
with resource dependence theory, which identifies interdependence as the key motivator of tie
formation (e.g., Ozcan and Eisenhardt, 2009), studies in the inter-organization literature often find
small firms to be more likely to form ties with large firms.
The few recent studies in this literature that explore potential problems of value
misappropriation, often referred to as the “swimming with sharks” dilemma, largely focus on
whether small firms should establish ties with large firms (e.g., Katila, Rosenberger, and
Eisenhardt, 2008; Diestre and Rajagopalan, 2012, 2014; Huang et al., 2013; Kapoor, 2013; Hallen,
Katila, and Rosenberger, 2014; Pahnke et al., 2015). Platform-based markets differ from the R&D
and corporate investment settings in these studies. First, as platform owners control the access to

6
end users, complementors have to form ties with platform owners in the first place in order to
create any value. The aforementioned studies identify tensions between small firms’ resource
needs and the risk of value misappropriation, but do not address this risk in the specific
circumstance of platform-based markets, in which firms are obliged to form ties with large partners
in order to create value. Second, because platform-based markets, owing to network effects, often
evolve towards a single (or a few) dominant player(s) (e.g., Zhu and Iansiti, 2012), complementors
often do not have many potential partners from which to choose. Lastly, as the considerable value
complementors create for platform-based markets renders their support critical to the success of
platforms, platform owners might not want to alienate their complementors by misappropriating
the value they create.
Our study of platform owners’ entry into complementary product spaces is also related to
the literature on vertical integration and firm boundaries (e.g., Williamson, 1971, 1979; Helfat and
Teece, 1987; Pisano, 1990; Lieberman, 1991; Young-Ybarra and Wiersema, 1999; Leiblein,
Reuer, and Dalsace, 2002; Leiblein and Miller, 2003; Oxley and Sampson, 2004; Hoetker, 2005;
Lafontaine and Slade, 2007; Lajili, Madunic, and Mahoney, 2007; Bresnahan and Levin, 2013;
Alcacer and Oxley, 2014; Wan and Wu, forthcoming). Much of this literature studies how vertical
integration helps mitigate hold-up concerns due to incomplete contracts (e.g., Levy, 1985;
Mahoney, 1992; Baker and Hubbard, 2004). Complementors, typically being considerably
smaller, often cannot rely on governance structures like vertical integration to prevent platform
owners from offering functionally similar products. Platform owners do not experience hold-up
problems, but face instead a new dilemma: whether to use vertical integration to capture more
value or improve the quality of the platform ecosystem.
Lastly, our paper relates to the literature on co-opetition (Brandenburger and Nalebuff,
1997), which describes situations in which the firms that create a product’s value subsequently
compete to extract profit from that product. Co-opetition is exemplified by the relationship
between Intel and Microsoft (Casadesus-Masanell and Yoffie, 2007; Casadesus-Masanell,
Nalebuff, and Yoffie, 2007; Kapoor, 2013). The relationships in our setting differ from that
between Intel and Microsoft in that platform owners (e.g., Amazon) are much more powerful than
complementors (e.g., individual third-party sellers).

7
The rest of the paper proceeds as follows. We first develop hypotheses. We then introduce
the empirical setting and describe the data and variables. After presenting the empirical results and
robustness checks, we conclude by discussing managerial implications and future research.
HYPOTHESIS DEVELOPMENT
Because of a large number of complementary products developed for a platform, it is often not
possible for a platform owner to enter all complementary product spaces by itself. A profit-
maximizing platform owner seeking to capture more value is likely to target the most lucrative
product spaces. This strategic move allows the platform owner to free ride on complementors’
efforts in discovering or producing these complements. It is consistent with the predictions of the
“swimming with sharks” literature that large firms are strongly motivated to misappropriate value
created through engagement with small firms (e.g., Katila et al., 2008; Diestre and Rajagopalan,
2012; Huang et al., 2013; Hallen et al., 2014; Pahnke et al., 2015). It is also consistent with the
literature on co-opetition, which has long held that companies may be collaborators with respect
to value creation but become competitors when it comes to value capture (e.g., Brandenburger and
Nalebuff, 1997). Imitating successful products is one of the strategies platform owners employ to
capture value from or limit the bargaining power of complementors (e.g., Farrell and Katz, 2000).
Finally, integrating popular complementors with the platform may enhance a platform’s
attractiveness to its users, and thus increase its market power. We thus arrive at our first hypothesis:
Hypothesis 1a: Platform owners are more likely to compete with a complementor when its
products are successful.
Iansiti and Levien (2004) observe that platform owners’ survival depends on maintaining
the general health of their platform ecosystems, the growth of which depends on attracting the
broadest possible base of complementors, to which the practice of “squeezing” complementors is
antithetical. A platform owner’s entry into a complementor’s product space, if perceived to signal
an intent by the platform to misappropriate value from complementors’ innovations, may lead
existing complementors to switch to, and prospective complementors to affiliate with, other

8
platforms. Consumers favorably disposed to a complementor’s products, moreover, may react
negatively to having to switch to a rival platform to secure those products. Negative consequences
of platform owners’ entries into complementors’ product spaces can be significant in the case of
products that are extremely popular and enjoy loyal consumer bases. Gans and Stern (2003)
suggest that, rather than exploit all opportunities for gain, owners cultivate a reputation for
“fairness” to draw future start-ups with innovative products to their platforms. Gawer and
Henderson’s (2007) in-depth case study of Intel reveals that the company enters to compete only
when complementors’ products contain new platform interfaces, and even then it employs internal
structures and processes to signal its desire that complementors make money. Gawer and
Cusumano (2002) document instances of dissatisfaction with complementors’ performance that
motivated Intel to stimulate innovation through direct entry and competition.
Platform owners may also use direct entry to avoid opportunistic behavior on the part of
complementors. For example, third-party sellers may sell counterfeits on e-commerce platforms
and software firms may develop malware on computer operating systems. Such behavior reduces
consumer satisfaction. Consistent with this strategy, studies (e.g., Caves and Bradburd, 1988;
Oxley, 1997; Leiblein and Miller, 2003; Bresnahan and Levin, 2013) have shown that vertical
integration can be a preferred governance choice when there is a strong need but a high degree of
difficulty in ascertaining the quality of products produced by partners.
These arguments suggest that platform owners are likely to target product spaces in which
complementors’ efforts are perceived to be unsatisfactory. This leads us to hypothesize as follows:
Hypothesis 1b: Platform owners are more likely to compete with a complementor when its
products are less popular or earn low consumer satisfaction.
There are good reasons for Intel to commit to not competing directly with its
complementors. Absent an assurance that Intel will not subsequently enter the market to compete
with them, these complementors would have less incentive to take on costly and platform-specific
investments. This in turn would require Intel to either make such investments on its own to produce
these complements or else reduce overall demand for its microprocessors. In contrast, third-party
sellers on Amazon do not typically make costly investments. As a result, Amazon would not be as

9
concerned as Intel when pondering whether or not to enter complementors’ product spaces: some
third-party sellers might nevertheless be willing to offer their products on Amazon as long as they
can profit from these products for a short period of time. On the other hand, some third-party
products may require more investments to grow on Amazon. For example, Amazon consumers
may have many questions about these products before they make purchase decisions. Were
Amazon to enter such product spaces, it would have to develop the requisite knowledge to answer
consumer questions going forward, a costly and undesirable requirement. By deciding not to
compete with third-party sellers, Amazon, like Intel, encourages these third-party sellers to make
such investments. These considerations give rise to the following hypothesis:
Hypothesis 2: Platform owners are less likely to compete with a complementor when its products
require significant platform-specific investments to grow. 4
EMPIRICAL SETTING
Founded on July 5, 1994 as an online reseller of books, Amazon.com, Inc. quickly diversified into
many other product categories including DVDs, CDs, video games, apparel, furniture, toys, and
jewelry. As the largest online retailer in the United States,5 its website, as of March 2015, was
attracting 175 million visits per month (compared to 122 million and 82 million, respectively, for
the websites of eBay and Wal-Mart, its two largest competitors).6 Amazon also launched Auctions,
an online auctions service, in March 1999, and zShops—a fixed-price marketplace business—in
September 1999; these evolved into Amazon Marketplace, a service launched in November 2000
that allows third-party sellers to sell their products directly to Amazon customers. This move made
Amazon both a retailer and a platform provider. In 2013, Amazon had more than two million third-
4 Hypothesis 2 could be explained by either or both of two mechanisms: Platform owners either want to avoid reducing
complementors’ incentives to make platform-specific investments, or want to avoid making these investments
themselves. Because both mechanisms lead to the same empirical pattern, we cannot disentangle them through
empirical analysis. Future research could use qualitative approaches to examine the mechanism(s) at work. 5 For more information about Amazon’s performance in recent years, see: Amazon.com (2015), “Amazon sellers sold
record-setting more than two billion items worldwide in 2014,” 5 January, http://phx.corporate-
ir.net/phoenix.zhtml?c=176060&p=irol-newsArticle&ID=2002794, accessed February 2018. 6 Source: Statista.com (2015), “Most popular retail websites in the United States as of March 2015, ranked by visitors
(in millions),” Statista Inc., http://www.statista.com/statistics/271450/ monthly-unique-visitors-to-us-retail-websites/,
accessed February 2018.
10
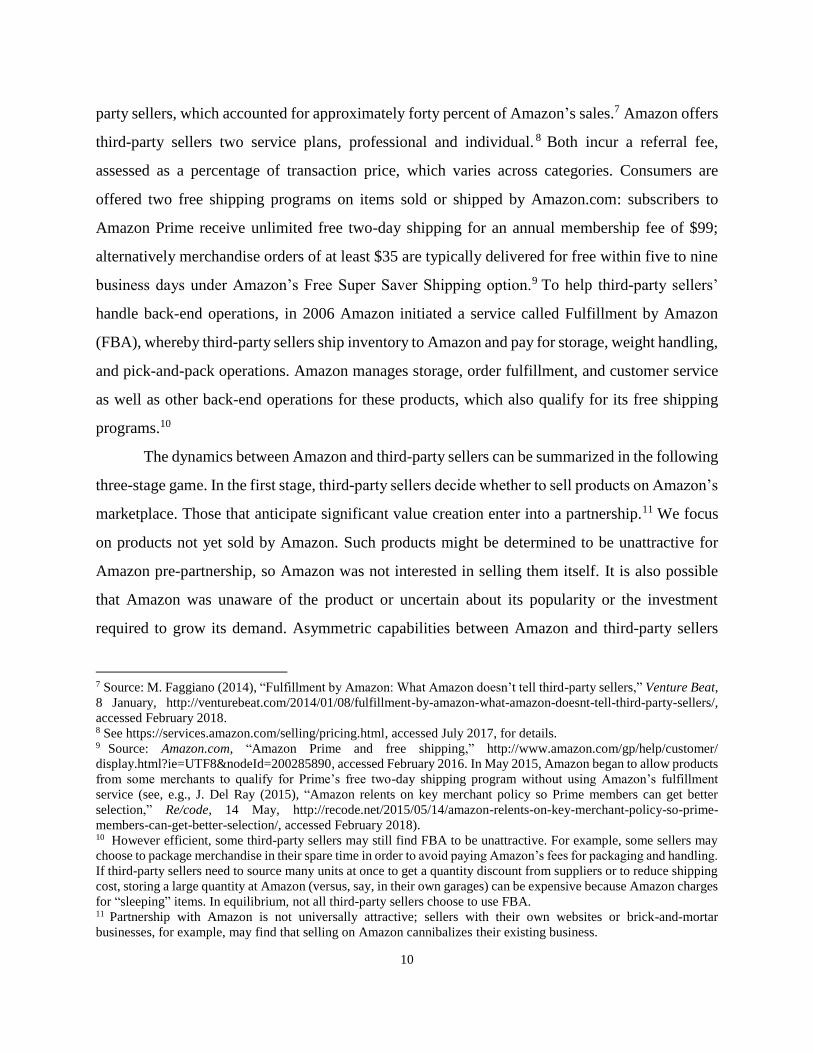
party sellers, which accounted for approximately forty percent of Amazon’s sales.7 Amazon offers
third-party sellers two service plans, professional and individual. 8 Both incur a referral fee,
assessed as a percentage of transaction price, which varies across categories. Consumers are
offered two free shipping programs on items sold or shipped by Amazon.com: subscribers to
Amazon Prime receive unlimited free two-day shipping for an annual membership fee of $99;
alternatively merchandise orders of at least $35 are typically delivered for free within five to nine
business days under Amazon’s Free Super Saver Shipping option.9 To help third-party sellers’
handle back-end operations, in 2006 Amazon initiated a service called Fulfillment by Amazon
(FBA), whereby third-party sellers ship inventory to Amazon and pay for storage, weight handling,
and pick-and-pack operations. Amazon manages storage, order fulfillment, and customer service
as well as other back-end operations for these products, which also qualify for its free shipping
programs.10
The dynamics between Amazon and third-party sellers can be summarized in the following
three-stage game. In the first stage, third-party sellers decide whether to sell products on Amazon’s
marketplace. Those that anticipate significant value creation enter into a partnership.11 We focus
on products not yet sold by Amazon. Such products might be determined to be unattractive for
Amazon pre-partnership, so Amazon was not interested in selling them itself. It is also possible
that Amazon was unaware of the product or uncertain about its popularity or the investment
required to grow its demand. Asymmetric capabilities between Amazon and third-party sellers
7 Source: M. Faggiano (2014), “Fulfillment by Amazon: What Amazon doesn’t tell third-party sellers,” Venture Beat,
8 January, http://venturebeat.com/2014/01/08/fulfillment-by-amazon-what-amazon-doesnt-tell-third-party-sellers/,
accessed February 2018. 8 See https://services.amazon.com/selling/pricing.html, accessed July 2017, for details. 9 Source: Amazon.com, “Amazon Prime and free shipping,” http://www.amazon.com/gp/help/customer/
display.html?ie=UTF8&nodeId=200285890, accessed February 2016. In May 2015, Amazon began to allow products
from some merchants to qualify for Prime’s free two-day shipping program without using Amazon’s fulfillment
service (see, e.g., J. Del Ray (2015), “Amazon relents on key merchant policy so Prime members can get better
selection,” Re/code, 14 May, http://recode.net/2015/05/14/amazon-relents-on-key-merchant-policy-so-prime-
members-can-get-better-selection/, accessed February 2018). 10 However efficient, some third-party sellers may still find FBA to be unattractive. For example, some sellers may
choose to package merchandise in their spare time in order to avoid paying Amazon’s fees for packaging and handling.
If third-party sellers need to source many units at once to get a quantity discount from suppliers or to reduce shipping
cost, storing a large quantity at Amazon (versus, say, in their own garages) can be expensive because Amazon charges
for “sleeping” items. In equilibrium, not all third-party sellers choose to use FBA. 11 Partnership with Amazon is not universally attractive; sellers with their own websites or brick-and-mortar
businesses, for example, may find that selling on Amazon cannibalizes their existing business.

11
may also render some third-party sellers better positioned than Amazon to sell the product. For
example, a third-party seller may have product-specific knowledge that Amazon lacks, making it
less costly for that seller to market the product and answer consumers’ inquires.
After partnering with third-party sellers for a while, Amazon decides whether or not to
enter the product market and sell to consumers directly in the second stage. Amazon may choose
not to do so because it makes a profit from transactions between third-party sellers and its users,
and will forego this income if it chooses to compete with these sellers. Amazon also has a
reputation for sacrificing profits for long-term growth, 12 which requires it to cultivate its
relationship with third-party sellers to help them grow, rather than to compete directly with them,
and risk driving them onto competing platforms like eBay or Wal-Mart. At the same time, its
partnerships allow Amazon to reduce uncertainty through observing demand, product
characteristics, consumer reviews, and the investment needed to grow product sales. Amazon’s
estimates of the benefits and costs of direct entry thus evolve over time and it may find some
product spaces particularly attractive to offer by itself. If it decides to enter, its entry pattern will
depend on its objectives, as hypothesized in H1a and H1b: Amazon may target popular products
that offer greater value capture opportunities or it may target products that are underperforming in
order to improve consumer satisfaction. In either case, however, as H2 hypothesizes, when the
investment required to grow product sales is high, Amazon will find direct entry unattractive and
will encourage third-party sellers to enter and make such investments themselves. In the third
stage, affected third-party sellers respond to Amazon’s entry by deciding whether to expand or
reduce their participation on the platform. Amazon’s entry may have a spillover effect: its impact
on a seller’s product may induce that seller to change its strategy for other products.
We do not need to assume that third-party sellers are myopic for them to enter the market
in the first stage. A forward-looking third-party seller may still find it profitable to sell on Amazon
for several reasons. First, the competition from Amazon is uncertain. Even if Amazon is more
likely to target attractive products, it is not guaranteed to enter because it is constrained by its
inability to offer all attractive products by itself. Second, a third-party seller may enter if its profits
12 See, e.g., Nasdaq (2014), “Amazon is unprofitable—and it’s completely on purpose,” 25 July,
http://www.nasdaq.com/video/amazon-is-unprofitable-and-its-completely-on-purpose-518340934, accessed
February 2018.

12
earned from product sales before Amazon enters can cover its entry cost, which could be quite low
in our setting. Finally, entry by Amazon reduces (most likely significantly) but does not necessarily
eliminate future profits for a third-party seller.
Data limitations constrain our analysis to the second and third stages.13 Our analysis is
hence conditional on the formation of a partnership and on Amazon not having entered third-party
product spaces during the first round of data collection. We further note that direct entry may not
be the only option considered in the second stage, when Amazon seeks to exploit the information
advantage afforded by the partnership. Amazon could also, for example, increase referral rates to
boost profits. Raising referral rates is not a perfect substitute for selective entry, however. First, a
high referral rate will force sellers to increase prices, which is inconsistent with Amazon’s
objective of becoming a low-price player, and this reduces the platform’s attractiveness relative to
rivals like Walmart and eBay. Direct entry, on the other hand, may enable Amazon to lower prices
and thereby enhance its competitiveness. Second, referral rates are usually determined at the
product category level. 14 Given the number of new products that third parties bring to the
marketplace, it is operationally difficult for Amazon to determine or negotiate a rate for each new
product. Amazon appears to take into consideration its ability to charge when determining referral
rates for different categories. For product categories that are extremely competitive (that is, when
margins are already low for third-party sellers), Amazon charges low referral rates (for example,
6% for computers and laptops); for categories in which it has substantial bargaining power, it
charges high referral rates (such as 45% for accessories of Amazon’s Kindle devices, which sellers
prefer to sell on Amazon). Direct entry enables Amazon at once to take advantage of the
heterogeneity among products within each product category and enhance its competitive position
against rivals.15 Our analysis captures the impact of referral rates by category-level fixed effects,
as they are the same for products in the same category.
13 We do not observe third-party sellers that choose not to partner with Amazon. For products that Amazon offers at
the time we first collect data, we are unable to tell whether Amazon or third-party sellers entered first. 14 See Amazon’s referral rates for different categories at
https://sellercentral.amazon.com/gp/seller/registration/participationAgreement.html/ref=asus_soa_p_fees?itemID=2
00336920, accessed December 2017. 15 This strategy appears to be used by other platform providers such as Apple, which charges a 30% commission rate
from app sales and in-app purchases and selectively enters certain app markets itself.

13
DATA AND VARIABLES
We begin by examining all product categories served by Amazon.16 We exclude digital products,
such as digital games, apps for Android, and Amazon Cloud Drive, as well as Amazon’s own
products, such as Kindle. We also exclude product categories for which it is difficult to readily
identify Amazon’s entry, such as Clothing & Shoes (Amazon and third parties may offer the same
shoes in different sizes, thereby complementing each other) or Automotive & Industrial (Amazon
and third parties may offer similar products for different car models or the same car models
released in different years). Categories like Books, Videos, and Music are also excluded, these
products being offered primarily by Amazon. Ultimately, we collect data from Amazon.com in
four product categories and associated subcategories—Electronics & Computers; Home, Garden
& Tools; Toys, Kids & Games; and Sports & Outdoors—that collectively accounted for
approximately 58 million products as of June 2013.
We collect data in two rounds, the first in June 2013, the second in April 2014.17 We
identify in the first round a set of products offered only by third-party sellers, and in the second,
check whether Amazon entered these product spaces during the intervening period. As we cannot
tell ex ante in which product spaces Amazon will choose to start selling, we need to collect
information on as many products as possible in the first round. Because of the large number of
products Amazon offers, it is practically impossible to gather information for every product listed
on Amazon. Thus, we design our program to check only 0.5 percent of products in each
subcategory.
For each product not offered by Amazon, we obtain price (Price), shipping cost (Shipping),
average customer rating (ProductRating), and total number of sellers that offer the product in new
condition (NumSellers). As a given product on Amazon may be available from many sellers for
different prices and shipping costs, we obtain price and shipping information from the default page
Amazon displays when users search for a product. We also obtain the ID of the default seller,
typically the one that offers the product at the lowest cost (i.e., price plus shipping cost), and
16 The latest list of product categories can be found at https://www.amazon.com/gp/site-
directory/ref=nav_shopall_fullstore, accessed June 2016. 17 Our data collection procedure adheres to Amazon’s robots exclusion protocol (available at http://www.
amazon.com/robots.txt, accessed April 2014).

14
capture the seller’s rating (SellerRating),18 computed as the average of all ratings received for past
transactions, and whether the seller uses Amazon’s fulfillment service (using a dummy variable,
FBA, coded 1 if third-party product distribution is handled by Amazon, and 0 otherwise). Amazon
does not publish sales data for each product, but does provide sales ranking data for products in
each category. Past research (e.g., Chevalier and Goolsbee, 2003; Sun, 2012) have identified a log-
linear relationship between sales rankings and actual sales, so we obtain ranking information for
each product (SalesRank). Rankings are negatively correlated with sales, a lower ranking indi-
cating higher sales. Products out of stock or sold only in used condition are excluded. Ultimately,
we obtain product information for 163,853 products in 22 subcategories.
Amazon provides on each product page a section that accommodates consumers’ product-
related questions. Amazon responds to the posting of a question by soliciting, via email, answers
from sellers and some past purchasers of the product. A question may elicit multiple answers.
Answers provided by a seller are displayed with a “Seller” icon. To assess sellers’ Amazon-
specific investment, we count the total number of answers provided by sellers.19 To account for
the fact that products were launched on Amazon at different times and those launched earlier are
more likely to have received more answers, we divide the total number of answers by the number
of months since the first question was posted to obtain the number of answers provided by sellers
per month (AverageSellerAnswers).20 Although this type of platform-specific investment seems
small, the profit margins from selling on Amazon, due to the competitive nature of the marketplace,
18 Amazon asks consumers who purchase products from third-party sellers to rate their satisfaction with the products
and the third-party sellers separately. The variable ProductRating captures satisfaction with products, SellerRating
sellers’ service quality (including whether products matched sellers’ descriptions and whether sellers responded to
inquiries in a timely manner). 19 Since Amazon makes the entry decision, it is important that it finds such investments, which mainly provide product
information, to be platform-specific. If Amazon chooses to compete with third-party sellers by offering their products
directly, these sellers may stop offering these products and then they will not make such investments. It is also possible
that third-party sellers will switch to other platforms to offer these products and make investments there. Even if
Amazon users can go to rival platforms to free-ride such investments (that is, if answers to customer questions are not
platform-specific), it is still not in Amazon’s interest to encourage such multi-homing behavior (that is, consumers
adopting multiple platforms). In other words, from Amazon’s perspective, it matters where such investments are made,
and so Amazon will consider such investments platform-specific. This is akin to consumer reviews on Amazon: while
such reviews are freely accessible to any online users, they give Amazon significant advantages – consumers visiting
product pages on other sites may still buy from Amazon after they read reviews on its site. Therefore, both consumer
reviews and answers from third-party sellers provide platform-specific value to Amazon. 20 The results are qualitatively unchanged when we use the logarithm of the total number of answers from the sellers
directly.

15
are likely to be small as well. Percentage-wise, such an investment could therefore still be
significant for the third-party sellers.
We also gather information on the total number of products offered on Amazon by each
third-party seller (NumProdBySeller) in our data set as well as for a subset of these third-party
sellers’ other products, including prices and whether they use Amazon’s fulfillment service. As
the number of products these third-party sellers offer varies between one and fifteen million, it is
not feasible to gather information about every such product; we therefore gather information on
up to forty products listed on the store page of each third-party seller.
Insert Table 1 here
For all products gathered in the first round, we collect the same set of information in the
second round. We find that Amazon has entered, between the two rounds, 4,852 (3%) of the
163,853 products identified in the first round as being offered only by third-party sellers. Table 1
reports the distribution of these products across subcategories for the entire sample and for those
affected by Amazon’s entry. We find the top four subcategories (Toys & Games; Sports &
Outdoors; Electronics; and Home & Kitchen) to account for more than 88% of Amazon entries
and the percentage of product entries in each subcategory to vary from 0%-7.34%. We observe
find zero entries in five subcategories (Computers & Accessories; Video Games; Software;
Gourmet Food; and Watches).21
Insert Table 2 here
Table 2 presents summary statistics for the product spaces entered and not entered by
Amazon, based on information collected in the first round. We take logarithms of several
21 This pattern is likely to reflect prior growth strategies. For example, Amazon signed an agreement with Toys “R”
Us in 2000 that gave Toys “R” Us the right to be the sole seller of toys, games, and baby products on Amazon. This
partnership, which was supposed to last 10 years, did not go well and ended in 2006. As a result, Amazon may have
delayed its own entry into product spaces under the Toys & Games category. Similarly, in 2001 Amazon partnered
with Circuit City, then a large electronics retailer, but the relationship ended in 2005. Source: M. Mangalindan (2006).
“How Amazon’s dream alliance with Toys ‘R’ Us went so sour, Wall Street Journal, 23 January.
http://www.wsj.com/articles/SB113798030922653260, accessed February 2018.

16
variables22 that exhibit skewed distributions. We find, for product prices and shipping costs, that
the products Amazon chooses to offer after the first round tend, on average, to have higher prices
and lower shipping costs. The latter result is consistent with the explanation that because it offers
free shipping through its prime and super saver shipping programs, Amazon does not want to offer
products that incur high shipping costs (such as bulky items).
We look next at products’ sales rankings and average consumer ratings. Because not all
products have consumer reviews, we compute average ratings only for products with at least one
review. If Amazon’s entry is motivated by capturing profits from popular products, we expect
Amazon to pick those with low rankings (that is, high demand) and high ratings. If, on the other
hand, Amazon is seeking to improve the customer experience by entering low-performing third-
party product spaces, we expect it to pick products with high rankings and low ratings. Our
evidence supports the former explanation.
We next look at the likelihood of a third-party product being distributed by Amazon. The
distribution service exhibits economies of scale: the more packages Amazon delivers, the lower
the average cost per package. Because Amazon already handles most of the logistics for products
that use its fulfillment service, direct entry would afford Amazon little opportunity to reduce its
cost further or improve the quality of delivery service. Moreover, Amazon already earns revenue
from third-party sellers using its fulfillment service. Hence, whether entry is motivated by profit
or the desire to improve the customer experience, the likelihood of entry should be lower for third-
party products distributed by Amazon. The information advantage afforded by order fulfillment
(inventory space requirements, suppliers, etc.), on the other hand, should facilitate, and thereby
increase the likelihood of, entering these product spaces. Summary statistics show that Amazon is
more likely to enter the spaces of products that use its distribution service.
We consider as well the number of sellers that offer a particular product. The intensity of
competition when a large number of sellers offer the same product may be a disincentive for
Amazon to enter. But a large number of sellers also suggests that sourcing is easy, which might
increase the likelihood of Amazon’s entry. Our finding that, on average, Amazon is more likely to
22 We add one to several variables to avoid taking a logarithm of zero.

17
enter spaces of products offered by many sellers suggests that convenience of sourcing dominates
competitive effects.
Examining the number of answers provided by third-party sellers per month, we find
Amazon’s entry choices to be associated with fewer answers from sellers. This finding is consistent
with our expectation that Amazon avoids product spaces that require greater effort to grow.
We examine as well the ratings of default third-party sellers. In the affected group, none
have ratings below 3. The high means of seller ratings in both groups and the small difference
between the means suggest that Amazon’s entry decision is likely dependent on product, but not
seller, attributes.
We next examine the total number of products default third-party sellers offer on Amazon.
Although Amazon may strategically avoid squeezing large third-party sellers owing to their
importance for value creation, in probabilistic terms, big sellers’ products are more likely to
become entry targets for Amazon. We find that products affected by Amazon’s entry tend to be
those offered by bigger sellers, suggesting that avoiding squeezing big sellers is not a strong
consideration in choosing which product spaces to enter.
Overall, the significant differences observed in Table 2 between the product spaces
Amazon chooses to enter and those it chooses not to enter show that its entry decisions are not
random.
EMPIRICAL ANALYSIS
Amazon’s entry pattern
We now model Amazon’s entry pattern in a regression framework to examine when third-party
products will compete with Amazon’s offerings. Many of the variables in Table 2 are correlated—
for example, products with good reviews or fulfilled by Amazon are also likely to be popular (i.e.,
have low rankings)—so it is important to conduct multivariate regression analysis to gain robust
insights into Amazon’s entry pattern.
Insert Table 3 here

18
Table 3 reports logit regression results from which we try to identify Amazon’s entry
pattern. We include from the first round data all products offered only by third-party sellers. The
dependent variable is a dummy, Entered, which takes a value of 1 if Amazon itself offers the
product in the second round, and 0 otherwise. All models include dummies for product
subcategories listed in Table 1. Model (1) includes such product information as prices, shipping
costs, and sales rankings. We add consumer product ratings and information about whether the
product is fulfilled by Amazon in Model (2). Because not all products have consumer reviews,
instead of average product ratings, we include dummy variables for different product rating levels.
The benchmark group consists of products with no ratings. Model (3) adds the logarithm of the
number of third-party sellers that offer the product and the number of answers provided by them
per month. In Model (4), we add the rating of the default third-party seller and the logarithm of the
total number of products offered by the seller. As we did for product ratings, we use dummy
variables to capture seller ratings. Sellers with no ratings are used as the benchmark group. For the
27 third-party sellers’ products with ratings between 1 and 3, we observe no entry. These
observations are consequently dropped during estimation due to lack of variation.
In all four models, we find entry by Amazon to be more likely for products with higher
prices, lower shipping costs, and greater demand. From the coefficients of the product rating
dummies, we find that the likelihood of Amazon’s entry increases with a product’s customer
rating. In contrast to the summary statistics reported in Table 2, we find, when we control for
various co-variants, that Amazon is less likely to enter a product space of a third-party seller that
uses Amazon’s FBA service. We also find that Amazon is more likely to enter product spaces
when the number of third-party sellers is large and when the product does not require much efforts
from third-party sellers to grow. Amazon’s entry decision seems not to depend on seller ratings,
nor to be deterred by seller size.
According to Model (4), doubling price, shipping cost, sales rank, number of third-party
sellers selling the same product, and total number of products sold by the default third-party seller
changes the odds of entry by Amazon by factors of 118%, 93%, 90%, 122%, and 108%,
respectively. The odds of Amazon entering are 25% higher for products with an average rating
exceeding 4 than for products with no rating, and 8.2% lower for products that use FBA than for

19
other products. A one-unit increase in AverageSellerAnswers reduces the log odds of Amazon’s
entry by 0.108 on average.23 These results are consistent with Amazon’s entry being motivated
primarily by the desire to capture more value, and provide support for Hypothesis 1a and
Hypothesis 2.
Impact of entry on products
Given Amazon’s entry pattern, we next evaluate the impact of Amazon’s entry on products.
Because the product spaces that Amazon enters are not chosen at random, we cannot simply
compare affected to unaffected products. We consequently use data from the first round to perform
propensity-score matching; that is, for each affected product we identify a product from the first-
round data that is similar except that it has not been affected by Amazon’s entry during the study
period (the unaffected product might be affected by Amazon’s entry subsequent to our study
period). We evaluate the impact of Amazon’s entry by comparing, using the second-round data,
affected products (that is, the treatment group) with their matched unaffected counterparts (the
control group). We use Model (4) from Table 3 to generate the propensity scores used to find
matches for the affected products.24 Because we have a large number of unaffected products, all
affected products except one are matched with unaffected products. We conduct balance
diagnostics for the propensity-score matching. The bias25 and associated t-statistics from a post-
matching examination of the mean differences of the treated and control groups suggest that the
two samples are quite similar. We also compare the distributions of the two samples by examining
the ratios of variable variances, and find that the distributions are similar between the two samples.
Finally, both Rubin’s B and Rubin’s R statistics (4.1 and 0.67, respectively) suggest that the
samples are sufficiently balanced.26
23 While we do not have data on these products’ profit margins, one would expect that the cost of answering the
questions should matter more for products with low profit margins. 24 We perform the matching using the single nearest-neighbor algorithm with a caliper of 0.01. 25 The bias is the % difference of the sample means in the treated and non-treated (full or matched) sub-samples as a
percentage of the square root of the average of the sample variances in the treated and non-treated groups (Rosenbaum
and Rubin, 1985). 26 Rubin’s B measures the absolute standardized difference of the means of the linear index of the propensity score in
the treated and (matched) control group, while Rubin’s R measures the ratio of treated to (matched) control variances

20
Table 4 assesses the impact of entry on products by comparing the treated to the control
group using observations in the second period. We first look at the products’ prices on Amazon.
For those that Amazon has entered, their prices are determined by Amazon. We find that prices
are similar between products affected by Amazon’s entry in the second period and those it does
not enter.
Insert Table 4 here
We also compare shipping fees. As Amazon offers free shipping programs (via its Prime
and Super Saver deals), when Amazon offers products, their shipping fees become zero. Although
third-party sellers have the option of offering free shipping or using Amazon’s distribution to take
advantage of its free shipping, third-party sellers’ shipping fees are higher by, on average, $1.84.
The large volume of products that Amazon ships gives it economies of scales in distribution and
also bargaining power with delivery firms, both of which help drive down shipping costs. Other
research also finds that consumers are sensitive to shipping fees and that free shipping offers are
very effective in generating additional sales (e.g., Lewis, Singh, and Fay, 2006). Hence, even
though the shipping cost is not zero, Amazon has incentives to subsidize shipping through margins
from product sales to strengthen its market power.
We find rankings for products Amazon entered in the second round to be 57% less than for
products in the control group. This result is not surprising, as Amazon’s lower shipping costs
decrease the overall costs of these products, and thus may also increase overall demand for them.
In addition, once the products are offered by Amazon, it may give preferential treatment to its own
offerings (e.g., prominent display on its web pages or in search results). Even when consumers
prefer buying from complementors, they may face extra costs in searching for them. The result is
consistent with theoretical studies showing that platform owners’ tying and bundling of their own
offerings forecloses customers’ access to complementors and thereby profitably captures the bulk
of the propensity score index. Rubin (2001) recommends that B be less than 25 and R be between 0.5 and 2 for the
samples to be considered sufficiently balanced.

21
of their markets (see, for example, Whinston, 1990, 2001; Carlton and Waldman, 2002; Nalebuff,
2004). Interestingly, we do not find differences between the average product ratings of affected
and unaffected products, suggesting that Amazon’s entry does not seem to increase consumer
satisfaction with the products.
Lastly, we examine the likelihood of third-party sellers continuing in the second round to
offer products entered by Amazon. Reduced demand consequent to Amazon’s entry could
discourage third-party sellers from continuing to sell the affected products. On the other hand,
subsequent to Amazon’s entry, it may take some time for these sellers to reduce accumulated
inventories while being the default sellers, in which case the products may continue to be offered
by the third-party sellers. We create a dummy, StopOffer, which is assigned a value of 1 if the
seller ceases to offer a product in the second round, and 0 otherwise. We find the turnover rate for
third-party sellers’ product offerings between the first and second rounds to be generally quite
high, exceeding 40% for both affected and unaffected products. The likelihood of these products
no longer being offered by the same third-party sellers in the second round is 6 percentage points
higher for products affected than for products unaffected by Amazon’s entry.
Overall, our results suggest that Amazon’s entry reduces shipping cost and, hence, the cost
to consumers of affected products, resulting in increased sales, but it also discourages third-party
sellers from continuing to offer the products.
Impact of entry on third-party sellers
Finally, we examine the impact of Amazon’s entry on third-party sellers by comparing shifts in
behavior between those affected and those unaffected by Amazon’s entry. The experience of
directly competing with Amazon helps affected third-party sellers realize that the entry threat from
Amazon is real and that they are unlikely to prevail. Hence, they may have less incentive to grow
their businesses on Amazon than do those unaffected by Amazon. We identify affected sellers
from those whose products are affected, and unaffected sellers from the control group. Because it
is possible, given that our matching is performed at the product level, that the same seller has
affected products in the treatment group and unaffected products in the control group, we drop all

22
sellers that show up in both groups.27 Our final data set consists of 954 affected and 1,527
unaffected sellers. Because multiple products of the same seller may be affected by Amazon’s
entry, we compute for each seller NumEntered as the number of a seller’s products affected by
Amazon’s entry. This variable takes a value of zero for unaffected sellers; for affected sellers, on
average, 1.59 (ranging from 1-28) products are affected by Amazon’s entry.
Because, being performed at the product level, our propensity-score matching does not
account for attributes of pre-existing differences among sellers, we use a difference-in-difference
approach together with seller-fixed effects to examine shifts in sellers’ strategies. We create two
dummy variables: Affected, which takes a value of 1 if the seller is affected by Amazon’s entry,
and 0 otherwise, and After, which takes a value of 0 if it is the first round, and 1 otherwise.
Insert Table 5 here
We first examine, in Models (1) and (2) of Table 5, changes in the total number of products
offered by third-party sellers over the two periods. The dependent variable,
Log(NumProdBySeller), is the logarithm of the total number of products offered by a third-party
seller in each round. We include as independent variables After and its interaction with Affected.
Because we control for seller-fixed effects, the main effect of Affected is absorbed. The coefficient
of the interaction variable in Model (1) suggests that affected sellers reduce the number of products
offered on Amazon by 24.1% relative to unaffected sellers in the second period. We obtain similar
results from Model (2), in which we replace the variable Affected with Log(NumEntered) to better
capture the heterogeneous impact of Amazon’s entry on these sellers.
In Models (3)-(6) of Table 5, we examine changes in seller behavior at the individual product
level, using data collected on other products offered by these sellers. We control in these models
for product-level fixed effects. For products that continue to be offered by third-party sellers in the
second round, we examine shifts in seller strategies regarding whether or not to use Amazon’s
distribution channels, as captured by FBA. Sellers that stopped offering the products for which we
collected data in the first round were dropped from the analyses. Although our dependent variable
27 Our results do not change qualitatively if we include these sellers as affected sellers.
23
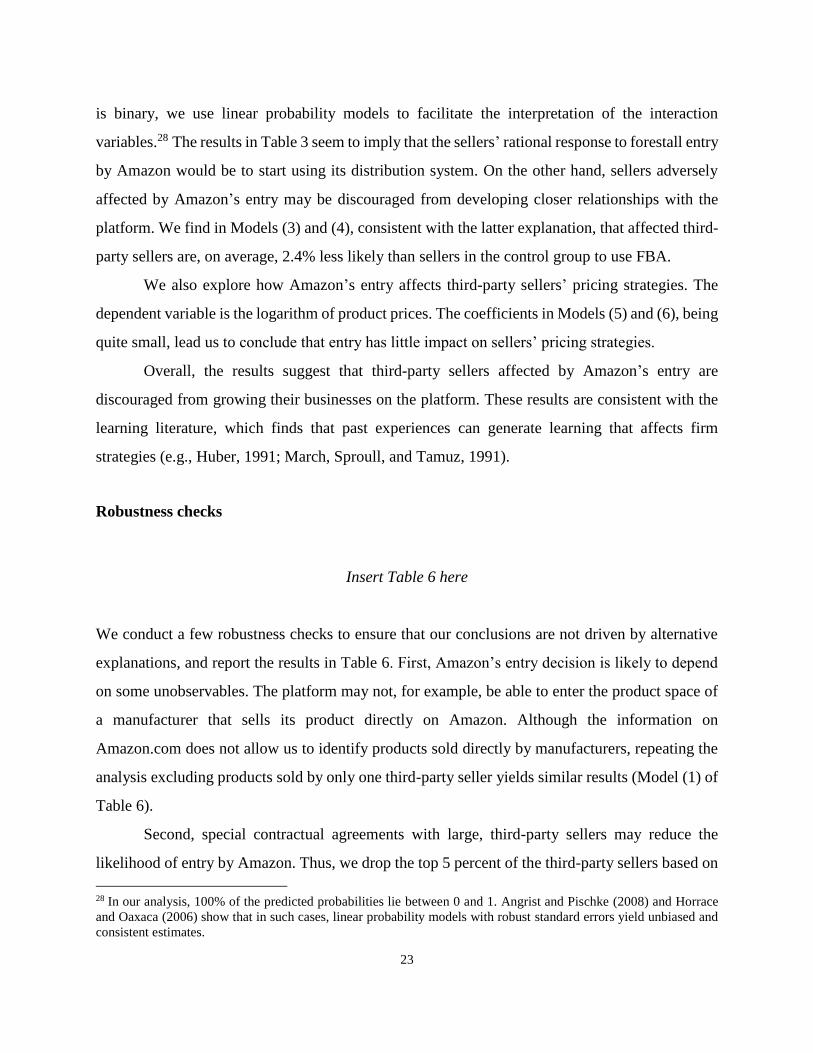
is binary, we use linear probability models to facilitate the interpretation of the interaction
variables.28 The results in Table 3 seem to imply that the sellers’ rational response to forestall entry
by Amazon would be to start using its distribution system. On the other hand, sellers adversely
affected by Amazon’s entry may be discouraged from developing closer relationships with the
platform. We find in Models (3) and (4), consistent with the latter explanation, that affected third-
party sellers are, on average, 2.4% less likely than sellers in the control group to use FBA.
We also explore how Amazon’s entry affects third-party sellers’ pricing strategies. The
dependent variable is the logarithm of product prices. The coefficients in Models (5) and (6), being
quite small, lead us to conclude that entry has little impact on sellers’ pricing strategies.
Overall, the results suggest that third-party sellers affected by Amazon’s entry are
discouraged from growing their businesses on the platform. These results are consistent with the
learning literature, which finds that past experiences can generate learning that affects firm
strategies (e.g., Huber, 1991; March, Sproull, and Tamuz, 1991).
Robustness checks
Insert Table 6 here
We conduct a few robustness checks to ensure that our conclusions are not driven by alternative
explanations, and report the results in Table 6. First, Amazon’s entry decision is likely to depend
on some unobservables. The platform may not, for example, be able to enter the product space of
a manufacturer that sells its product directly on Amazon. Although the information on
Amazon.com does not allow us to identify products sold directly by manufacturers, repeating the
analysis excluding products sold by only one third-party seller yields similar results (Model (1) of
Table 6).
Second, special contractual agreements with large, third-party sellers may reduce the
likelihood of entry by Amazon. Thus, we drop the top 5 percent of the third-party sellers based on
28 In our analysis, 100% of the predicted probabilities lie between 0 and 1. Angrist and Pischke (2008) and Horrace
and Oaxaca (2006) show that in such cases, linear probability models with robust standard errors yield unbiased and
consistent estimates.

24
the total number of products they carry in the first round, and repeat the analysis. We continue to
find similar results (Model (2) of Table 6).29
Third, although our logit regression includes a large number of product characteristics, it
is possible that Amazon’s entry decisions depend on other unobservables. Amazon may, for
example, target products with high growth rates instead of current sales figures. Our main
argument that Amazon selects more promising product spaces to enter continues to hold in this
case. Alternatively, Amazon may enter product lines that have reached the end of their growth
phases and, as a result, after Amazon’s entry, third-party sellers choose to stop offering these
products, even though this alternative story is inconsistent with our finding that third-party sellers
are discouraged to grow their businesses after Amazon’s entry. We conduct several robustness
checks. First, we exclude five product subcategories (Toys & Games, Electronics, Computers &
Accessories, Video Games, and Software) in which products are likely to exhibit significant trends.
For the remaining product subcategories, as new products are likely to exhibit great demand
variation, we exclude all products that only became available on Amazon.com after January 1,
2013. Demand for the remaining products in our data set is likely to be relatively stable. Repeating
the logit regression with these products reveals a similar entry pattern (Model (3) of Table 6). The
influence of several variables, like product rating variables and FBA, becomes greater.
Lastly, our analysis assumes zero shipping costs for products offered by Amazon, even if
their prices are below the $35 threshold to qualify for Amazon’s free shipping offers. This
assumption is consistent with the finding that most online shoppers add extra items to their
shopping baskets to qualify for free delivery.30 As a robustness check, we replicate the analysis by
removing all products priced at less than $35. The result, reported in Model (4) of Table 6, shows
a similar entry pattern.31
Finally, we test the sensitivity of the results from propensity-score matching by estimating
Rosenbaum bounds (Rosenbaum, 2002; Leuven and Sianesi, 2003), which measure how strongly
an unobservable factor must influence the selection process to nullify causal effects identified by
29 In Models (2)-(4), we observe no Amazon entry for products by sellers with ratings between 3 and 4. These
observations are thus dropped due to lack of variation. 30 See, e.g., https://econsultancy.com/blog/65011-how-far-will-customers-go-to-qualify-for-free-shipping/, accessed
June 2017. 31 Replicating, in unreported regressions, the analyses in Tables 4 and 5 yields similar results.

25
the propensity-matching analysis. 32 We find that, depending on the outcome variable, an
unobservable variable would have to change the odds of selection into the treatment group by 30%
to more than 100% for the significant treatment effects in Table 4 to disappear.33 These thresholds
being conservative estimates, any confounding unobservable would need to have an extremely
high, almost deterministic influence on selection into the treatment group and outcome variables
(DiPrete and Gangl, 2004). The effect of Amazon’s entry on affected products and sellers is hence
unlikely to be negated by factors unobserved in our study.
DISCUSSION AND CONCLUSION
Our research provides the first large-scale empirical study of the tension complementors face when
they work with platform owners, and highlights the importance for complementors to take value
capture into account when building businesses on platforms. As platform owners are often strategic
players, complementors need to understand the incentives and capabilities of platforms and not
treat platform-based markets as being like regular markets. Our study complements the studies of
Intel (Gawer and Cusumano 2002; Gawer and Henderson 2007) in that we focus on a setting that
requires low platform-specific investments. We find that Amazon’s entry pattern differs from
Intel’s, and show that the level of platform-specific investment can explain this difference and thus
help generalize the findings of these studies.
As in any empirical study, one may worry about whether the entry pattern we have
documented merely reflects coincidence: Amazon could have used an independent process rather
than data about third-party products to identify which products to source. Although this possibility
is difficult to rule out absent direct observation of Amazon’s operations, several indications
suggest that the entry pattern is beyond coincidence. Were Amazon’s merchandise planning
32 Labeling the probability of a product being in the treatment group 𝑝𝑖 , and the probability of the matched product
being in the control group pj, Rosenbaum (2002) gives the bounds on the odds ratio for the products being matched
as: 1
Γ≤
𝑝𝑖/(1−𝑝𝑖)
𝑝𝑗/(1−𝑝𝑗)≤ Γ, where Γ ≥ 1. Based on the intuition that Γ should be close to 1 if the unobservable does not play
a significant role in selection, Rosenbaum develops test statistics to show how far Γ must be from 1 for the
unobservable to nullify the treatment effect. 33 Note that the threshold we find is on the same order of magnitude as the Rosenbaum bounds results reported by
DiPrete and Gangl (2004), Sen, Shin, and Sudhir (2011), and Sun and Zhu (2013).

26
process completely independent of data related to third-party products, the dummy variable FBA
would not be highly significant in all specifications of our logit regressions. Moreover, Brad
Stone’s interviews with current and former Amazon executives suggest that Amazon does, indeed,
use its Marketplace as a learning tool to decide whether it should enter particular product markets
(Stone, 2013). Regardless of how Amazon makes its entry decisions, our research shows that
complementors can predict Amazon’s entry pattern using product characteristics, and formulate
strategic responses accordingly.34
Our empirical design also involves two selection issues. The first relates to the entry of
complementors or complementary products that may affect the sample of products observed in the
data. This selection issue is mitigated by low entry cost; bringing a product already being sold on
another site to Amazon involves a low platform-specific investment (a seller needs only a seller
account and a product page).35 In practice, it is difficult to find products sold by third-party sellers
on other e-commerce sites that are not available on Amazon.
The second selection issue relates to the timing of our data collection. We examine products
offered by third-party sellers in June 2013. Given our finding that Amazon chooses to enter
attractive product lines, to the extent that its strategy is consistent over time, Amazon would have
already selected the most attractive product lines to enter by June 2013. Many of the products in
our first-round dataset were likely to appear less attractive at that time, so Amazon was initially
not eager to enter, devoting its attention to other attractive product spaces first. Thus, our result
provides a conservative estimate; that is, Amazon’s tendency to choose attractive product lines
would have been more pronounced had we collected data from an earlier period.36
34 Note that our research does not imply that individuals charged with obtaining new merchandise at Amazon must
have access to detailed transaction data for third-party products. Amazon publishes data related to third-party products
(e.g., consumer reviews and product ranks) on its website, Amazon.com, which can simply be browsed to obtain this
information. 35 Amazon does charge fees, but in the worst case the seller can increase the product price to cover the fees and still
benefit from Amazon’s huge customer base. 36 To confirm the direction of the sample selection bias, we repeat the logit analysis including only third-party products
launched on Amazon in 2013. The idea is that these products being newly launched by third-party sellers, Amazon is
likely to still be learning about their potential and most likely hasn’t already cherry-picked the best ones. Consistent
with our expectation, except for shipping cost and total number of products offered by the default third-party seller,
the magnitudes of the coefficients are all greater with this sample.

27
Managerial implications
While our research focuses on Amazon.com as the empirical setting, our results have implications
for complementors participating in many different platform-based markets. We show that,
although Amazon cares about its long-term growth, it still has incentives to appropriate value from
third-party sellers selling successful products on its platform. As a result, the appropriation risks
would be even higher for complementors when they work with platform owners that focus on
short-term profit maximization.
Our results also distinguish between factors that do, and those that do not, influence
platform owners’ incentives to squeeze complementors. We find, for instance, that contrary to the
conventional wisdom that firms typically find competitive markets unattractive for entry (e.g.,
Berry and Reiss, 2007), the intensity of competition among complementors does not seem to deter
platform owners’ entry. We observe across many instances of entry that Amazon may present itself
as the default seller even when the same product is offered at lower cost (i.e., product price plus
shipping cost), with a comparable shipping speed by third-party sellers with high ratings. Amazon
sometimes notes on its product pages that products may be offered at lower prices by third-party
sellers, but even consumers who notice this message (and many surely do not) may not be disposed
to spend time examining the list of third-party sellers. Competition thus does not seem to deter
Amazon; after all, third-party sellers are competing with Amazon on its website under its rules.
Similar scenarios take place in other settings. Applications supplied by platform owners (such as
Microsoft and Apple), for example, are often bundled with their respective platforms (here,
Windows and iOS). Unbundled rival complementary products consequently are handicapped by
the extra cost consumers need to incur in searching for, acquiring, and installing them. In the end,
consumers may opt for platform owners’ copycats even when the quality is inferior to
complementors’ original innovations.
Our results, although they may paint a gloomy picture for complementors in various
platform-based markets, nevertheless suggest a number of strategies complementors can employ
to mitigate the risk of value misappropriation. Whereas platform owners tend to target popular
products, complementors that build their businesses around aggregating non-blockbuster products
or services (see, e.g., Zentner, Smith, and Kaya, 2013) are less likely to face direct competition

28
from platform owners. Complementors that choose to focus on popular products need to develop
capabilities in new product discovery that enable them to continually bring innovative products to
the platform. Our results also show that complementors’ platform-specific investments reduce the
likelihood of entry.
In our setting, the platform owner uses information acquired through partnerships with (for
instance, product attributes and demand, supplier information, and product and customer service
ratings) against third-party sellers. Complementors can initiate impediments to learning and
procurement by platform owners, for example, by strategically increasing prices to make products
appear less popular, concealing supplier information, seeking exclusive contracts with
manufacturers as sole suppliers, or manufacturing or customizing proprietary complementary
products.
We also note that although Amazon’s entry can harm complementors and could reduce
the number of innovative products consumers can find on the site, consumers nevertheless benefit
from Amazon’s efficient distribution systems and because of it are more likely to purchase the
products. Consumer welfare may, hence, increase. Our empirical results suggest that Amazon’s
entry strategy is consistent with its objective of being a low-price player.
Limitations and future research
Future research could extend our study in various directions. Our study, for example, involves a
setting in which it is difficult for complementors to deter entry by the platform owner, due to the
massive size and bargaining power of Amazon relative to any given third-party seller. Amazon
can easily enter into most sellers’ markets, yet individual third-party sellers do not have much
market power and lack the means to effectively retaliate or deter entry by Amazon. In some
markets, the complementors (for example, Microsoft vs. Intel) may have significant market power
as well, and can more effectively retaliate. In other markets, complementors may have recourse to
defense mechanisms like patents to protect their innovations (see, e.g., Teece, 1986). Huang et al.
(2013) find that SAP’s platform is more likely to be joined by software firms with a greater stock
of patents and copyrights. Acquisition may be the only avenue open to platform owners seeking

29
to enter the product spaces of complementors with strong defense mechanisms (see, e.g., Lee and
Lieberman, 2010). Li and Agarwal’s (2015) study of Facebook’s acquisition of Instagram, a
popular photo-sharing application, shows the move to have expanded demand by attracting new
users who previously did not use any photo-sharing applications. This result mirrors our finding
that Amazon’s entry increases the popularity of affected products. Future research could assess the
generalizability of our results to other settings in which complementors may deter entry by
platform owners, and the platform owners may also use different entry strategies.
Data limitations prevent our study from examining how Amazon’s entry strategies affect
its growth. Although existing or prospective complementors discouraged by Amazon’s entry may
bring fewer innovative products to the platform, if Amazon’s entries attract more consumers and
reduce the cost of offered products, the expanded customer base could incentivize more third-party
sellers to join the platform. How Amazon’s direct competition against its complementors affects
platform growth thus remains an open question.
Finally, complementors should be aware that although it is the most threatening and visible
form of squeezing, direct entry into their product spaces is not the only approach platforms employ
to appropriate value from complementors’ innovations (see, e.g., Edelman, 2014). For example,
eBay, being purely a marketplace, has not developed the capability to operate as a retailer and so
is not positioned to compete directly with third-party sellers, but has nevertheless increased its
service fees several times to capture more value from sellers. Apple often uses terms and conditions
to reject applications that compete directly with its own offerings, and Facebook, by reducing the
number of game posts on its news feed, weakened the large third-party game publisher Zynga.37
Future research could explore other strategies platform owners employ to squeeze complementors
and their impact on complementors.
37 Source: J. Constine (2012), “Why Zynga failed,” TechCrunch, 5 October, http://techcrunch.com/2012/10/05/more-
competitors-smarter-gamers-expensive-ads-less-virality-mobile/, accessed February 2018.

30
REFERENCES
Adner R, Kapoor R. 2010. Value creation in innovation ecosystems: How the structure of technological
interdependence affects firm performance in new technology generations. Strategic Management
Journal 31(3): 306–333.
Ahuja G. 2000. The duality of collaboration: Inducements and opportunities in the formation of interfirm
linkages. Strategic Management Journal 21(3): 317–343.
Alcacer J, Oxley J. 2014. Learning by supplying. Strategic Management Journal 35(2): 204–223.
Angrist JD, Pischke J-S. 2008. Mostly Harmless Econometrics: An Empiricist’s Companion. Princeton
University Press.
Armstrong M. 2006. Competition in two-sided markets. Rand Journal of Economics 37(3): 668–691.
Baker GP, Hubbard TN. 2004. Contractibility and asset ownership: On-board computers and governance
in U.S. trucking. Quarterly Journal of Economics 119(4): 1443–1479.
Berry S, Reiss P. 2007. Empirical models of entry and market structure. Mark Armstrong, Robert Porter,
eds., Handbook of Industrial Organization, vol. 3, chap. 29. North Holland, New York, 1845–1886.
Brandenburger AM, Nalebuff BJ. 1997. Co-Opetition. Currency Doubleday.
Bresnahan T, Levin J. 2013. Vertical integration and market structure. Robert Gibbons, John Roberts, eds.,
The Handbook of Organizational Economics, chap. 21. Princeton University Press, 853–890.
Carlton DW, Waldman M. 2002. The strategic use of tying to preserve and create market power in evolving
industries. RAND Journal of Economics 33(2): 194–220.
Casadesus-Masanell R, Halaburda H. 2014. When does a platform create value by limiting choice? Journal
of Economics & Management Strategy 23(2): 259–293.
Casadesus-Masanell R, Llanes G. 2011. Mixed source. Management Science 57(7): 1212–1230.
Casadesus-Masanell R, Nalebuff BJ, Yoffie D. 2007. Competing complements. NET Institute Working
Paper No. 07-44.
Casadesus-Masanell R, Yoffie D. 2007. Wintel: Cooperation and conflict. Management Science 53(4):
584–598.
Caves RE, Bradburd RM. 1988. The empirical determinants of vertical integration. Journal of Economic
Behavior and Organization 3(9): 265–279.
Cennamo C, Panico C. 2015. What drives a platform’s strategy? Usage, membership, and competition
effects. Working paper.
Cennamo C, Santalo J. 2013. Platform competition: Strategic trade-offs in platform markets. Strategic
Management Journal 34(11): 1331–1350.
Cennamo C, Santalo J. 2015. Value creation and free-riding in platform markets: The asymmetric impact
of competition on quality across the platform life cycle. Working paper.
Chen J, Fan M, Li M. 2012. Advertising versus brokerage model for online trading platforms. NET Institute
Working Paper No. 12-12.
Chevalier J, Goolsbee A. 2003. Measuring prices and price competition online: Amazon.com and
BarnesandNoble.com. Quantitative Marketing and Economics 1(2): 203–222.
Claussen J, Essling C, Kretschmer T. 2015. When less can be more—Setting technology levels in
complementary goods markets. Research Policy 44(2): 328–339.
Claussen J, Kretschmer T, Mayrhofer P. 2013. The effects of rewarding user engagement—The case of
Facebook apps. Information Systems Research 24(1): 186–200.
Dai W, Jin G, Lee J, Luca M. 2014. Optimal aggregation of consumer ratings: Application to Yelp.com.
NBER Working Paper 18567.
Diestre, L, Rajagopalan N. 2012. Are all sharks dangerous? New biotechnology ventures and partner
selection in R&D alliances. Strategic Management Journal 33(10): 1115–1134.
Diestre L, Rajagopalan N. 2014. Response to Mason and Drakeman’s commentary on “Fishing for sharks:
partner selection in biopharmaceutical R&D alliances.” Strategic Management Journal 35(10): 1566–
1568.

31
DiPrete TA, Gangl M. 2004. Assessing bias in the estimation of causal effects: Rosenbaum bounds on
matching estimators and instrumental variables estimation with imperfect instruments. Sociological
Methodology 24(1): 271–310.
Economides N, Katsamakas E. 2006. Two-sided competition of proprietary vs. open source technology
platforms and the implications for the software industry. Management Science 52(7): 1057–1071.
Edelman B. 2014. Mastering the intermediaries: Strategies for dealing with the likes of Google, Amazon,
and Kayak. Harvard Business Review 92(6): 86–92.
Edelman B. Forthcoming. Leveraging market power through tying: Does Google behave anti-
competitively? Journal of Competition Law and Economics.
Eisenhardt KM, Schoonhoven CB. 1996. Resource-based view of strategic alliance formation: Strategic
and social effects in entrepreneurial firms. Organization Science 7(2): 136–150.
Eisenmann TR. 2007. Managing networked businesses: Course overview for educators. HBS note no.807-
104.
Eisenmann TR, Parker G, Van Alstyne MW. 2011. Platform envelopment. Strategic Management Journal
32(12): 1270–1285.
Farrell J, Katz ML. 2000. Innovation, rent extraction, and integration in systems markets. Journal of
Industrial Economics 48(4): 413–432.
Gans JS, Stern S. 2003. The product market and the market for “ideas”: Commercialization strategies for
technology entrepreneurs. Research Policy 32(2): 333–350.
Gawer A, Cusumano MA. 2002. Platform Leadership: How Intel, Microsoft, and Cisco Drive Industry
Innovation. Harvard Business School Press.
Gawer A, Henderson R. 2007. Platform owner entry and innovation in complementary markets: Evidence
from Intel. Journal of Economics & Management Strategy 16(1): 1–34.
Gulati R, Higgins MC. 2003. Which ties matter when? The contingent effects of interorganizational
partnerships on IPO success. Strategic Management Journal 24(2): 127–144.
Hagiu A. 2006. Pricing and commitment by two-sided platforms. Rand Journal of Economics 37(3): 720–
737.
Hallen B, Katila R, Rosenberger JD. 2014. How do social defenses work? A resource-dependence lens on
technology ventures, venture capital investors, and corporate relationships. Academy of Management
Journal 57(4): 1078–1101.
Heeb R. 2003. Innovation and vertical integration in complementary markets. Journal of Economics &
Management Strategy 12(3): 387–417.
Helfat CE, Teece DJ. 1987. Vertical integration and risk reduction. Journal of Law, Economics, and
Organization 3(1): 47–67.
Hoetker G. 2005. How much you know versus how well I know you: Selecting a supplier for a technically
innovative component. Strategic Management Journal 26(1): 75–96.
Horrace WC, Oaxaca RL. 2006. Results on the bias and inconsistency of ordinary least squares for the
linear probability model. Economics Letters 90(3): 321–327.
Huang P, Ceccagnoli M, Forman C, Wu DJ. 2013. Appropriability mechanisms and the platform
partnership decision: Evidence from enterprise software. Management Science 59(1): 102–121.
Huber GP. 1991. Organizational learning: The contributing processes and the literatures. Organization
Science 2(1): 88–115.
Iansiti M, Levien R. 2004. The Keystone Advantage: What the New Dynamics of Business Ecosystems
Mean for Strategy, Innovation, and Sustainability. Harvard Business School Press.
Jiang B, Jerath K, Srinivasan K. 2011. Firm strategies in the “mid tail” of platform-based retailing.
Marketing Science 30(5): 757–775.
Kapoor R. 2013. Collaborating with complementors: What do firms do? Advances in Strategic Management
30(1): 3–26.
Kapoor R, Agarwal S. 2015. Sustaining superior performance in business ecosystems: Evidence from
application software developers in the iOS and Android smartphone ecosystems. Working paper.

32
Kapoor R, Lee JM. 2013. Coordinating and competing in ecosystems: How organizational forms shape new
technology investments. Strategic Management Journal 34(3): 274–296.
Katila R, Rosenberger JD, Eisenhardt KM. 2008. Swimming with sharks: Technology ventures, defense
mechanisms and corporate relationships. Administrative Science Quarterly 53(2): 295–332.
Kretschmer T, Claussen J. 2015. The effects of backward compatibility: Hardware demand, software
supply, and the role of technology. Working paper.
Lafontaine F, Slade M. 2007. Vertical integration and firm boundaries: The evidence. Journal of Economic
Literature 45(3): 629–685.
Lajili K, Madunic M, Mahoney JT. 2007. Testing Organizational Economics Theories of Vertical
Integration, vol. 4, chap. 13, 343–368.
Lee G, Lieberman M. 2010. Acquisition vs. internal development as modes of market entry. Strategic
Management Journal 31(2): 140–158.
Leiblein MJ, Miller DJ. 2003. An empirical examination of transaction- and firm-level influences on the
vertical boundaries of the firm. Strategic Management Journal 24(9): 839–859.
Leiblein MJ, Reuer JJ, Dalsace F. 2002. Do make or buy decisions matter? The influence of governance on
technological performance. Strategic Management Journal 23(9): 817–833.
Leuven E, Sianesi B. 2003. PSMATCH2: Stata module to perform full Mahalanobis and propensity score
matching, common support graphing and covariate imbalance testing. Available at
http://ideas.repec.org/c/boc/bocode/s432001.html.
Levy DT. 1985. The transactions cost approach to vertical integration: An empirical examination. Review
of Economics and Statistics 67(3): 438–445.
Lewis M, Singh V, Fay S. 2006. An empirical study of the impact of nonlinear shipping and handling fees
on purchase incidence and expenditure decisions. Marketing Science 25(1): 51–64.
Li Z, Agarwal A. 2015. The impact of platform integration on consumer demand in complementary
markets: Evidence from Facebook’s integration of Instagram. Working paper.
Lieberman MB. 1991. Determinants of vertical integration: An empirical test. Journal of Industrial
Economics 39(5): 451–466.
Mahoney JT. 1992. The choice of organizational form: Vertical integration versus other methods of vertical
integration. Strategic Management Journal 13(8): 559–584.
March, JG, Lee SS, Tamuz M. 1991. Learning from samples of one or fewer. Organization Science 2(1):
1–13.
McGahan AM, Vadasz LL, Yoffie DB. 1997. Creating value and setting standards: The lessons of consumer
electronics for personal digital assistants. In David B. Yoffie (Ed.), Competing in the Age of Digital
Convergence. Boston, Massachusetts: Harvard Business School Press, 227–264.
Moore JF. 1996. The Death of Competition: Leadership and Strategy in the Age of Business Ecosystems.
New York: Harper Business.
Nalebuff, B. 2004. Bundling as an entry barrier. Quarterly Journal of Economics 119(1): 159–187.
Nosko C, Tadelis S. 2015. The limits of reputation in platform markets: An empirical analysis and field
experiment. NBER Working Paper No. 20830.
Oxley JE. 1997. Appropriability hazards and governance in strategic alliances: A transaction cost approach.
Journal of Law, Economics, and Organization 13(2): 387–409.
Oxley JE, Sampson RC. 2004. The scope and governance of international R&D alliances. Strategic
Management Journal 25(8-9): 723–749.
Ozcan I, Eisenhardt KM. 2009. Origin of portfolios: Entrepreneurial firms and strategic action. Academy
of Management Journal 52(2): 246–279.
Pahnke, EC, McDonald R, Wang D, Hallen B. 2015. Exposed: Venture capital, competitor ties, and
entrepreneurial innovation. Academy of Management Journal 58(5): 1334–1360.
Parker G, Van Alstyne MW. 2005. Two-sided network effects: A theory of information product design.
Management Science 51(10): 1494–1504.

33
Parker G, Van Alstyne MW. 2014. Innovation, openness, and platform control. Available at SSRN:
http://ssrn.com/abstract=1079712.
Piezunka H, Katila R, Eisenhardt KM. 2015. Big fish or big pond? Seller’s dilemma in intermediary
selection. Working paper.
Pisano GP. 1990. The R&D boundaries of the firm: An empirical analysis. Administrative Science
Quarterly 35(1): 153–176.
Qiu Y, Rao R. 2017. Assortment as a strategic signaling tool and platform design. Working paper.
Rochet J-C, Tirole J. 2003. Platform competition in two-sided markets. Journal of European Economic
Association 1(4): 990–1029.
Rosenbaum PR. 2002. Observational Studies. 2nd ed. New York: Springer.
Rosenbaum PR, Rubin DB. 1985. Constructing a control group using multivariate matched sampling
methods that incorporate the propensity score. American Statistician 39(1): 33–38.
Rothaermel FT. 2001. Complementary assets, strategic alliances, and the incumbent’s advantage: An
empirical study of industry and firm effects in the biopharmaceutical industry. Research Policy 30(8):
1235–1251.
Rothaermel FT. 2002. Technological discontinuities and interim cooperation: What determines a start-up’s
attractiveness as an alliance partner? IEEE Transactions on Engineering Management 49(4): 388–397.
Rubin, DB. 2001. Using propensity scores to help design observational studies: Application to the tobacco
litigation. Health Services & Outcomes Research Methodology 2(3-4): 169–188.
Sarkar MB, Echambadi R, Harrison JS. 2001. Alliance entrepreneurship and firm market performance.
Strategic Management Journal 22(6-7): 701–711.
Sarkar MB, Aulakh PS, Madhok A. 2009. Process capabilities and value generation in alliance portfolios.
Organization Science 20(3): 583–600.
Seamans R, Zhu F. 2014. Responses to entry in multi-sided markets: The impact of Craigslist on local
newspapers. Management Science 60(2): 476–493.
Sen B, Shin J, Sudhir K. 2011. Demand externalities from co-location: Evidence from a natural experiment.
Working paper, Yale University.
Stone B. 2013. The Everything Store: Jeff Bezos and the Age of Amazon. Little, Brown and Company.
Sun M. 2012. How does the variance of product ratings matter? Management Science 58(4): 696–707.
Sun M, Zhu F. 2013. Ad revenue and content commercialization: Evidence from blogs. Management
Science 59(10): 2314–2331.
Teece DJ. 1986. Profiting from technological innovation: Implications for integration, collaboration,
licensing, and public policy. Research Policy 15(6): 285–305.
Tirole J. 2005. The analysis of tying cases: A primer. Competition Policy International 1(1): 1–25.
Venkatraman N, Lee C-H. 2004. Preferential linkage and network evolution: A conceptual model and
empirical test in the U.S. video game sector. Academy of Management Journal 47(6): 876–892.
Wan Z, Wu B. Forthcoming. When suppliers climb the value chain: A theory of value distribution in vertical
relationships. Management Science.
Whinston MD. 1990. Tying, foreclosure, and exclusion. American Economic Review 80(4): 837–859.
Whinston MD. 2001. Exclusivity and tying in U.S. v. Microsoft: What we know, and don’t know. Journal
of Economic Perspectives 15(2): 63–80.
Williamson OE. 1971. The vertical integration of production: Market failure considerations. American
Economic Review 61(2): 112–123.
Williamson OE. 1979. Transaction-cost economics: The governance of contractual relations. Journal of
Law and Economics 22(2): 233–261.
Yoffie DB, Kwak M. 2006. With friends like these: The art of managing complementors. Harvard Business
Review 84(9).
Young-Ybarra C, Wiersema M. 1999. Strategic flexibility in information technology alliances: The
influence of transaction cost economics and social exchange theory. Organization Science 10(4): 439–
459.

34
Zentner A, Smith MD, Kaya C. 2013. How video rental patterns change as consumers move online.
Management Science 59(11): 2622–2634.
Zhang Y, Li H. 2010. Innovation search of new ventures in a technology cluster: The role of ties with
service intermediaries. Strategic Management Journal 31(1): 88–109.
Zhu F, Iansiti M. 2012. Entry into platform-based markets. Strategic Management Journal 33(1): 88–106.

35
Table 1: Distribution of products across subcategories
All Products Affected
Subcategory Freq. % of All Products Freq. % of Products
Toys & Games 63,335 38.65 2,288 3.61
Sports & Outdoors 31,955 19.50 1,052 3.29
Home & Kitchen 26,141 15.95 730 2.79
Electronics 23,081 14.09 328 1.42
Baby 3,389 2.07 87 2.57
Home Improvement 3,136 1.91 79 2.52
Health & Personal Care 2,777 1.69 36 1.30
Office Products 1,985 1.21 56 2.82
Patio, Lawn & Garden 1,636 1.00 40 2.44
Pet Supplies 1,405 0.86 18 1.28
Automotive 1,396 0.85 30 2.15
Kitchen & Dining 1,093 0.67 25 2.29
Industrial & Scientific 866 0.53 26 3.00
Arts, Crafts & Sewing 456 0.28 29 6.36
Beauty 410 0.25 6 1.46
Computers & Accessories 306 0.19 0 0.00
Musical Instruments 286 0.17 21 7.34
Video Games 89 0.05 0 0.00
Appliances 56 0.03 1 1.79
Software 45 0.03 0 0.00
Gourmet Food 8 0.00 0 0.00
Watches 2 0.00 0 0.00
Total 163,853 100.00 4,852 2.96

36
Table 2: Comparison of products affected and unaffected by Amazon’s entry
Affected Unaffected
Variable Mean Std. Dev. Min Max Mean Std. Dev. Min Max Mean Difference
Log(Price) 3.06 1.11 0.01 7.7 2.92 1.18 0.01 9.71 0.14 (0.02)
Log(Shipping) 0.65 0.97 0 5.03 0.88 1.02 0 6.29 –0.22 (0.01)
Log(SalesRank) 10.76 2.07 0 15.15 11.55 2.24 0 15.15 –0.79 (0.03)
ProductRating 4.24 0.75 1 5 4.18 0.88 1 5 0.06 (0.02)
FBA 0.40 0.49 0 1 0.31 0.46 0 1 0.09 (0.01)
Log(NumSellers) 1.84 1.08 0 5.6 1.31 1.10 0 5.55 0.53 (0.02)
AverageSellerAnswers 0.008 0.11 0 3.81 0.014 0.47 0 76.25 –0.007 (0.007)
SellerRating 4.88 0.22 3 5 4.86 0.23 1 5 0.02 (0.003)
Log(NumProdBySeller) 7.88 2.00 0 16.49 7.52 2.03 0 16.49 0.36 (0.03) Note: The last column includes the mean difference with the standard error in parentheses.

37
Table 3: Logit regressions for analyzing Amazon’s entry pattern
Variables (1) (2) (3) (4)
Log(Price) 0.218 0.212 0.231 0.254 (0.013) (0.013) (0.013) (0.013)
Log(Shipping) -0.172 -0.186 -0.105 -0.100 (0.016) (0.018) (0.018) (0.019)
Log(SalesRank) -0.180 -0.162 -0.134 -0.143 (0.008) (0.008) (0.008) (0.008)
1 ≤ ProductRating < 2 -0.144 -0.191 -0.167 (0.149) (0.149) (0.149)
2 ≤ ProductRating < 3 0.126 0.030 0.076 (0.091) (0.091) (0.091)
3 ≤ ProductRating < 4 0.299 0.167 0.216 (0.051) (0.051) (0.052)
4 ≤ ProductRating ≤ 5 0.347 0.213 0.250 (0.036) (0.037) (0.037)
FBA -0.117 -0.192 -0.082 (0.038) (0.038) (0.039)
Log(NumSellers) 0.350 0.322 (0.015) (0.015)
AverageSellerAnswers -0.117 -0.108 (0.057) (0.054)
3 ≤ SellerRating < 4 0.160 (1.028)
4 ≤ SellerRating ≤ 5 0.184 (0.152)
Log(NumProdBySeller) 0.121 (0.008)
Dummies for Categories Yes Yes Yes Yes
Observations 163,853 163,853 163,853 163,826
Pseudo R-squared 0.031 0.034 0.046 0.052
Note: Heteroskedasticity–adjusted standard errors are in parentheses.

38
Table 4: Impact of Amazon’s entry on third-party products
Variable Treated Controls Difference S.E. T–stat
Log(Price) 3.06 3.09 –0.02 0.02 –1.01
Log(Shipping) 0.00 0.61 –0.61 0.01 –43.59
Log(SalesRank) 10.41 11.26 –0.85 0.05 –18.07
ProductRating 4.21 4.20 0.01 0.02 0.39
StopOffering 0.50 0.44 0.06 0.01 6.40

Table 5: Impact of Amazon’s entry on third-party sellers
(1) (2) (3) (4) (5) (6)
Variables Log(NumProdBySeller) Log(NumProdBySeller) FBA FBA Log(Price) Log(Price)
After -0.211 -0.239 -0.003 -0.006 -0.008 -0.014 (0.044) (0.043) (0.002) (0.002) (0.004) (0.002)
Affected X After -0.241 -0.024 0.004
(0.075) (0.002) (0.004)
Log(NumEntered) X After -0.191 -0.017 0.010 (0.077) (0.002) (0.002)
Observations 4,962 4,962 133,622 133,622 133,622 133,622
R–squared 0.032 0.030 0.004 0.004 0.000 0.001
Number of Sellers 2,481 2,481 2,248 2,248 2,248 2,248
Number of Products 66,811 66,811 66,811 66,811
Specifications FE FE FE FE FE FE
Note: The unit of observation is at the seller level in Models (1) and (2) and at the product level in Models (3)-(6). Heteroskedasticity–adjusted standard errors
are in parentheses.
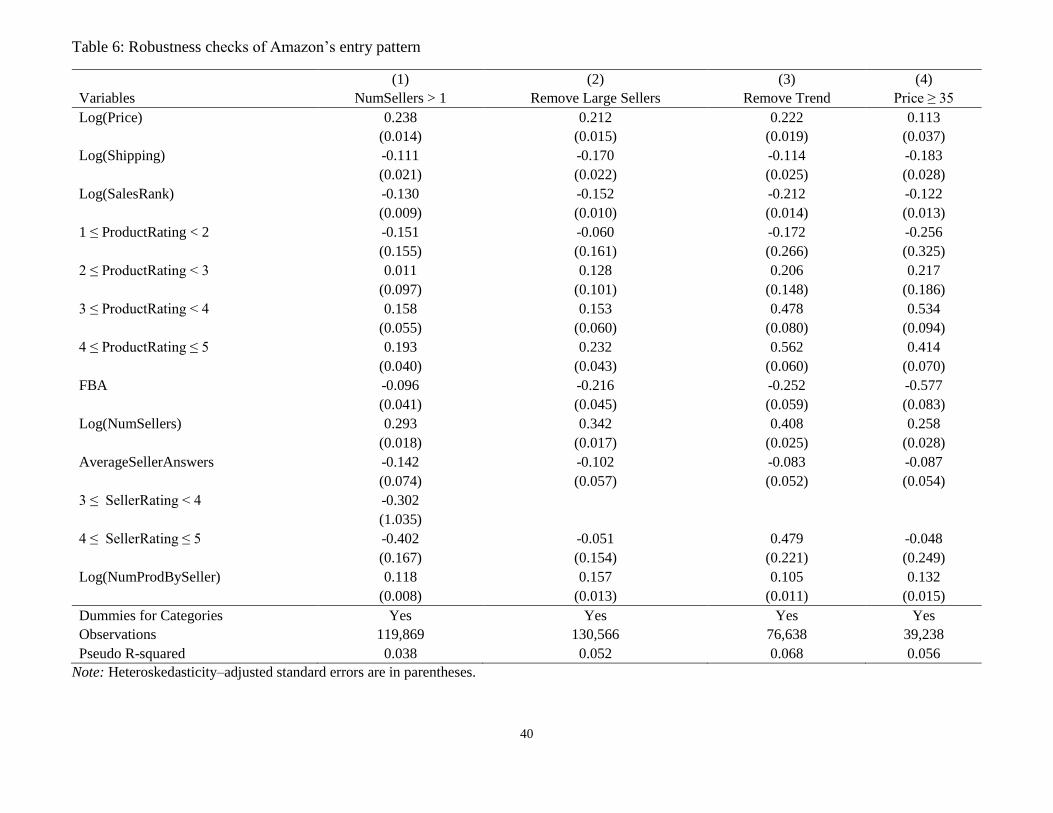
40
Table 6: Robustness checks of Amazon’s entry pattern
(1) (2) (3) (4)
Variables NumSellers > 1 Remove Large Sellers Remove Trend Price ≥ 35
Log(Price) 0.238 0.212 0.222 0.113 (0.014) (0.015) (0.019) (0.037)
Log(Shipping) -0.111 -0.170 -0.114 -0.183 (0.021) (0.022) (0.025) (0.028)
Log(SalesRank) -0.130 -0.152 -0.212 -0.122 (0.009) (0.010) (0.014) (0.013)
1 ≤ ProductRating < 2 -0.151 -0.060 -0.172 -0.256 (0.155) (0.161) (0.266) (0.325)
2 ≤ ProductRating < 3 0.011 0.128 0.206 0.217 (0.097) (0.101) (0.148) (0.186)
3 ≤ ProductRating < 4 0.158 0.153 0.478 0.534 (0.055) (0.060) (0.080) (0.094)
4 ≤ ProductRating ≤ 5 0.193 0.232 0.562 0.414 (0.040) (0.043) (0.060) (0.070)
FBA -0.096 -0.216 -0.252 -0.577 (0.041) (0.045) (0.059) (0.083)
Log(NumSellers) 0.293 0.342 0.408 0.258 (0.018) (0.017) (0.025) (0.028)
AverageSellerAnswers -0.142 -0.102 -0.083 -0.087 (0.074) (0.057) (0.052) (0.054)
3 ≤ SellerRating < 4 -0.302
(1.035)
4 ≤ SellerRating ≤ 5 -0.402 -0.051 0.479 -0.048 (0.167) (0.154) (0.221) (0.249)
Log(NumProdBySeller) 0.118 0.157 0.105 0.132 (0.008) (0.013) (0.011) (0.015)
Dummies for Categories Yes Yes Yes Yes
Observations 119,869 130,566 76,638 39,238
Pseudo R-squared 0.038 0.052 0.068 0.056
Note: Heteroskedasticity–adjusted standard errors are in parentheses.