Competing with Complementors: An Empirical Look at … Files/15-044_d9d88071-7cf7... · 2003;...
37
Competing with Complementors: An Empirical Look at Amazon.com Feng Zhu Qihong Liu Working Paper 15-044
Transcript of Competing with Complementors: An Empirical Look at … Files/15-044_d9d88071-7cf7... · 2003;...

Competing with Complementors: An Empirical Look at Amazon.com
Feng Zhu Qihong Liu
Working Paper 15-044
Working Paper 15-044
Copyright © 2014, 2016 by Feng Zhu and Qihong Liu
Working papers are in draft form. This working paper is distributed for purposes of comment and discussion only. It may not be reproduced without permission of the copyright holder. Copies of working papers are available from the author.
Competing with Complementors: An Empirical Look at Amazon.com
Feng Zhu Harvard Business School
Qihong Liu University of Oklahoma
Competing with Complementors: An Empirical Look at
Amazon.com∗
Feng Zhu
Harvard University
Boston, MA 02163
Email: [email protected]
Qihong Liu
University of Oklahoma
Norman, OK 73019
Email: [email protected]
February 4, 2016
∗For helpful discussions and insightful comments, we thank Juan Alcacer, Chris Forman, Shane Green-stein, Rebecca Henderson, Steve Herbert, Jerry Kane, Michael Kummer, Christian Peukert, Gary Pisano,Henry Schneider, Aaron Smith, David Yoffie, participants in the Second Annual TOM Alumni ResearchWorkshop at the Harvard Business School, IO Workshop at the University of Oklahoma, the WhartonTechnology and Innovation Conference, the 13th International Industrial Organization Conference, the 6thAnnual Conference on Internet Search and Innovation at Northwestern University, Platform Strategy Re-search Symposium, the Annual Meeting of the Academy of Management, and seminar participants at BocconiUniversity, Cheung Kong Graduate School of Business, Harvard Business School, University of Maryland,University of Michigan, University of Minnesota, New York University, Rice University, and University ofTexas at Austin. Zhu gratefully acknowledges financial support from the Division of Research of the HarvardBusiness School.
Competing with Complementors: An Empirical Look atAmazon.com
Abstract
Platform owners sometimes enter complementors’ product spaces to compete against
them directly. Prior studies have offered two possible explanations for such entries:
platform owners may target the most successful complementors so as to appropriate
value from their innovations, or they may target poor performing complementors to
improve the platforms’ overall quality. Using data from Amazon.com, we analyze the
patterns of Amazon’s entry into its third-party sellers’ product spaces. We find evi-
dence consistent with the former explanation: that the likelihood of Amazon’s entry
is positively correlated with the popularity and customer ratings of third-party sellers’
products. We also find that Amazon’s entry reduces the shipping costs of affected
products and hence increases their demand. Results also show that small third-party
sellers affected by Amazon’s entry appear to be discouraged from growing their busi-
nesses on the platform subsequently. The results have implications for complementors
participating in various platform-based markets.
1
1 Introduction
Platform-based markets have become increasingly prevalent, and comprise a large and rapidly
growing share of today’s economy (e.g., Eisenmann 2007). Such markets are often de-
scribed as multi-sided because multiple groups of participants—such as consumers and
complementors—need to gain access to the same platform to interact with each other, and
a platform’s success depends on its ability to bring them on board (e.g., Rochet and Tirole
2003; Parker and Van Alstyne 2005). Examples of such markets are as diverse as video
game consoles, smartphones, online auction markets, search engines, and social networking
sites. Thousands of entrepreneurs have built businesses and sell products and services on
such platforms. Collectively, these entrepreneurs—who operate as complementors to the
platforms—create significant value. By the end of 2014, for example, more than 1.7 mil-
lion and 1.4 million applications had been developed for two popular smartphone platforms,
Google’s Android and Apple’s iOS, respectively, generating billions of dollars of revenue for
each platform owner.1
At the same time, platform owners can exert considerable influence over individual com-
plementors’ livelihoods. In particular, they may choose to imitate successful complementors
and offer similar products. Many complementors have been pushed out of their markets not
by competition from other complementors, but because platform owners compete directly
against them and appropriate the value from their innovations. For example, Netscape and
Real Networks, complementors on Microsoft’s Windows platform, were extinguished by rival
Microsoft applications Internet Explorer and Windows Media Player; microblogging plat-
form Twitter’s release of its own client applications for mobile devices effectively locked out
third-party client applications; and Apple makes some previously essential third-party apps
1Source: Graser M. 2015. Apple doubles app store sales in 2014, set-ting a record. Variety. 19 January: http://variety.com/2015/digital/news/apple-doubles-app-store-sales-in-2014-setting-a-record-1201396900/, accessed August 2015.
2
obsolete with every new operating system it releases2—and sometimes simply rejects apps
for its devices if they compete with its own current or planned offerings.3
Such strategic behavior on the part of platforms should come as no surprise. Recent stud-
ies on inter-organizational relationships suggests that interdependence may expose young
firms with high resource needs and high value innovations to the risk of value misappropri-
ation (e.g., Gans and Stern 2003; Katila et al. 2008; Diestre and Rajagopalan 2012; Huang
et al. 2013; Hallen et al. 2013; Pahnke et al. forthcoming). Complementors in platform-based
markets are vulnerable to such risks, as they depend entirely on the platforms to reach their
customers. Typically small relative to platforms, they often lack adequate resources to pro-
tect their innovations. In a similar vein, the literature on co-opetition has long held that
companies may be collaborators with respect to value creation but become competitors when
it comes to value capture (e.g., Brandenburger and Nalebuff 1997). In platform-based mar-
kets, one strategy platforms employ to capture value from or limit the bargaining power of
complementors is to imitate their successful products (e.g., Farrell and Katz 2000).
On the other hand, squeezing complementors can have negative consequences for a plat-
form owner, who will not generally have the capabilities to enter all possible complementary
markets, and so must encourage the widespread entry of complementors to grow its market.
A platform that enters a complementor’s product space signals to all complementors that
they may not, in the end, be able to capture value from their innovations, leading current
complementors to switch to, and potential complementors to affiliate with, other platforms.
Gans and Stern (2003) point that rather than exploiting all opportunities to gain, a firm can
2See, for example, Smith K. 2012. 10 popular Mac apps that Apple’s new operating system just madeobsolete. Business Insider. 25 July: http://www.businessinsider.com/mountain-lion-apps-2012-7?op=1, accessed August 2015.
3See, for example, Rosenberg D. 2008. Apple blocks competitive products fromiPhone App Store–surprised?. CNET. 13 September: http://www.cnet.com/news/apple-blocks-competitive-products-from-iphone-app-store-surprised/ and Singel R. 2009.Apple rejects Google voice app, invites regulation. Wired. 28 July: http://www.wired.com/2009/07/apple-rejects-google-voice/,, accessed August 2015.
3
develop a reputation for “fairness” to encourage future start-ups to approach them with new
innovations. Iansiti and Levien (2004) suggest, consistent with these arguments, that plat-
forms need to maintain the health of their entire ecosystem for the simple reason that their
survival depends on doing so. Gawer and Henderson (2007) conduct a detailed case study of
Intel. They show that Intel does not enter to compete with complementors’ products, except
when complementors’ products contain new platform interfaces. Even when Intel chooses to
enter its complementors’ markets, the company uses certain organizational structures and
processes to signal it still wants the complementors to make money. Gawer and Cusumano
(2002) document that Intel enters certain complementary markets when it is not satisfied
with these complementors’ performance and wants to use competition to stimulate their
innovation efforts.
Overall, despite its importance, we have scant empirical evidence to help us understand
platform owners’ strategies with respect to complementary markets. While there have been
a few high-profile examples, it remains unclear how often platform owners enter their com-
plementors’ markets. What are the dominant motivations behind such entries: are platform
owners more likely to target successful complementary products, or are they more likely
to target underperforming complementary products, which are often less likely to be no-
ticed, seeking to improve customer satisfaction? How are the consumers and complementors
affected by such platform owner entries? Answers to these questions have important impli-
cations for complementors’ strategies and consumer welfare.
Our research seeks to answer these questions using data from Amazon.com, which is both
the largest online retailer in the United States and a platform on which third-parties can sell
products directly to customers. This empirical setting allows us to systematically analyze a
platform owner’s incentives to enter (or not to enter) a wide range of complementary product
spaces. None of these complementary products embody new platform interfaces. We collect
data from Amazon in two rounds. In the first round, we identify a large set of products
4
offered by third-party sellers, and in the second, we check whether Amazon has chosen to
enter their product spaces. We find that Amazon entered 3% of complementors’ product
spaces over a 10-month period. We also find that Amazon is more likely to enter when third-
party products have higher sales and better reviews, and do not use Amazon’s fulfilment
service. Using propensity-score matching to compare products affected and unaffected by
Amazon’s entry, we find entry to increase product demand by virtue of reducing shipping
costs to consumers. At the same time, small third-party sellers affected by Amazon’s entry
appear to be discouraged from growing their businesses on Amazon.com.
1.1 Related Literature
Our paper contributes to three streams of literature. We add to the nascent stream of
research on platform-based markets, which currently centers on platform owners as the focal
point of interest. Scholars have examined platform owners’ pricing decisions on different
sides of the market (e.g., Rochet and Tirole 2003; Parker and Van Alstyne 2005; Hagiu 2006;
Chen et al. 2012; Seamans and Zhu 2014; Hao and Fan forthcoming), interactions between
competing platforms (e.g., Armstrong 2006; Economides and Katsamakas 2006; Casadesus-
Masanell and Llanes 2011), the value of installed bases to platform owners seeking to diversify
into other markets (e.g., Eisenmann et al. 2011; Edelman forthcoming) or to introduce next-
generation platforms (e.g., Claussen et al. 2015; Kretschmer and Claussen 2015), platform
owners’ management of complementors (e.g., Yoffie and Kwak 2006; Parker and Van Alstyne
2014; Cennamo and Panico 2015; Cennamo and Santalo 2015), timing of new platform
owners’ entry into platform-based markets (e.g., Zhu and Iansiti 2012), optimal information
disclosure (e.g., Dai et al. 2014; Nosko and Tadelis 2015), and platform governance choices
such as those regarding exclusivity and limiting the variety of applications (Cennamo and
Santalo 2013; Casadesus-Masanell and Halaburda 2014). Studies of complementors tend to
focus on positive outcomes of affiliating with platform owners, given that platforms provide
5
complementors access to their installed bases (e.g., Venkatraman and Lee 2004; Ceccagnoli
et al. 2012; Claussen et al. 2013). The few studies that acknowledge potential expropriation
threats from platform owners lack evidence of platform owners’ entry patterns (Farrell and
Katz 2000; Jiang et al. 2011; Huang et al. 2013).
Our paper informs as well the literature on inter-organizational relationships, much
of which also emphasizes positive outcomes for participating firms (e.g., Eisenhardt and
Schoonhoven 1996; Rothaermel 2001, 2002; Gulati and Higgins 2003; Gulati et al. 2009) and
the value creation role played by hub firms in inter-organizational networks (e.g., Kapoor
and Lee 2013). Consistent with resource dependence theory, which identifies interdepen-
dence as the key motivator of tie formation (e.g., Ozcan and Eisenhardt 2009), studies in
the inter-organization literature often find complementors to be more likely to form ties with
dominant platform owners. The few studies that explore potential problems of value misap-
propriation, known as the “swimming with sharks” dilemma, largely focus on whether small
firms should establish ties with large firms (e.g., Katila et al. 2008; Diestre and Rajagopalan
2012; Huang et al. 2013; Hallen et al. 2013; Pahnke et al. forthcoming). Although all identify
tensions between small firms’ resource needs and the risk of value misappropriation, these
studies do not address this risk in situations where firms are obliged to form ties with large
partners if they want to create value in the first place, as they are in platform-based markets.
The platform-based market setting also differs from conventional supply chains. For ex-
ample, merchants like CVS, one of the largest U.S. pharmacy chains, buy products from their
suppliers and then resell them to consumers. They may choose to offer their private labels to
compete with their suppliers. In such cases, merchants bear all the cost of experimentation
(e.g., promotion and logistics costs). In the platform setting, complementors bear the cost
of experimentation for their products. They devote efforts into discovering innovative and
interesting products that, in their absence, might never have occurred to platform owners
to offer. They often pay platform owners to promote these products as well. For example,
6

many third-party sellers on Amazon.com pay Amazon to advertise their products on its site.
Therefore, complementors in platform-based markets create substantially more value than
upstream suppliers in supply chains. Neither do merchants’ private label entries typically
push suppliers out of the market. Extant research on merchants’ entry into suppliers’ prod-
uct spaces tends to find the formers’ products to be of lower quality and, in equilibrium,
to co-exist with suppliers’ products by targeting consumer segments with different price
sensitivities (e.g., Chintagunta et al. 2002; Steenkamp and Kumar 2007; Yehezkel 2008).
Lastly, our paper relates to the literature on co-opetition (Brandenburger and Nalebuff
1997), which describes situations in which the value of a product is created by firms that sub-
sequently compete to extract profit from it. The relationship between Intel and Microsoft is a
prominent example of co-opetition (Casadesus-Masanell and Yoffie 2007; Casadesus-Masanell
et al. 2007): here Microsoft’s dependence on its installed base of PCs and Intel’s dependence
on new PC sales create conflict over their incentives to invest in new generations of PCs. In
our setting, Amazon and third-party sellers cooperate to create value for customers, but can
come into conflict about how to divide up the pie. Direct entry into their product spaces is
one way Amazon can capture more of the value jointly created with third-party sellers. The
relationships in our setting differ from that between Intel and Microsoft in that platform
owners (e.g., Amazon) are much more powerful than complementors (e.g., individual third-
party sellers). Our results highlight the importance of small firms considering value capture
more seriously when entering into value-creating partnerships with large firms.
The rest of the paper proceeds as follows. Section 2 discusses our empirical setting.
Section 3 discusses our data and variables. Section 4 presents our empirical results. We
discuss managerial implications and conclude in Section 5.
7
2 Empirical Setting
Founded on July 5, 1994 as an online reseller of books, Amazon.com, Inc. quickly diversified
into many other product categories including DVDs, CDs, video games, apparel, furniture,
toys, and jewelry. Today it is the largest online retailer in the United States. 4 As of March
2015, its website attracted 175 million visits per month (compared to 122 million and 82
million, respectively, for the websites of eBay and Wal-Mart, its two largest competitors). 5
Amazon also launched Auctions, an online auctions service, in March 1999, and zShops—a
fixed-price marketplace business—in September 1999: these evolved into Amazon Market-
Place, a service launched in November 2000 that allows third-party sellers to sell their prod-
ucts directly to Amazon customers. This move made Amazon both retailer and platform
provider. In 2013, Amazon had more than 2 million third-party sellers and they accounted
for approximately 40% of Amazon’s sales.6 Amazon offers two free shipping programs: sub-
scribers to Amazon Prime receive unlimited free two-day shipping on items sold or shipped
by Amazon.com for an annual membership fee of $99; merchandise orders of at least $35
are typically delivered for free within five to nine business days under Amazon’s Free Super
Saver Shipping option.7
Several factors may increase Amazon’s incentives to enter third-party sellers’ product
4For more information about Amazon’s performance in recent years, see, for example: Amazon.com. 2015.Amazon sellers sold record-setting more than 2 billion items worldwide in 2014. 5 January: http://phx.corporate-ir.net/phoenix.zhtml?c=176060&p=irol-newsArticle&ID=2002794, accessed, August 2015.
5Source: Statista.com. 2015. Most popular retail websites in the United States as of March2015, ranked by visitors (in millions). Statista Inc. http://www.statista.com/statistics/271450/monthly-unique-visitors-to-us-retail-websites/, accessed August 2015.
6Source: Faggiano M. 2014. Fulfillment by Amazon: What Amazon doesn’t tellthird-party sellers. Venture Beat. 8 January: http://venturebeat.com/2014/01/08/fulfillment-by-amazon-what-amazon-doesnt-tell-third-party-sellers/ , accessed August 2015.
7Source: Amazon.com. Amazon Prime and free shipping. http://www.amazon.com/gp/help/customer/display.html?ie=UTF8&nodeId=200285890, accessed August 2015. Starting in May 2015, Amazon al-lowed products from some merchants to qualify for Prime’s free two-day shipping program without usingAmazon’s fulfillment service (see, for example: Del Ray J. 2015. Amazon relents on key merchant pol-icy so Prime members can get better selection. Re/code. 14 May: http://recode.net/2015/05/14/amazon-relents-on-key-merchant-policy-so-prime-members-can-get-better-selection/ , accessedAugust 2015).
8
http://venturebeat.com/2014/01/08/fulfillment-by-amazon-what-amazon-doesnt-tell-third-party-sellers/
spaces. First, having complete transaction data for third parties selling on its platform,
Amazon can readily identify hit products or those whose performance Amazon could help
improve.
Second, having been a retailer for many years itself, Amazon has the capabilities needed
to resell third-party products with high-quality service, so the barrier to its entry would be
low.
In addition, one risk of relying on third-party sellers to fulfill its customers’ needs is
that Amazon cannot entirely control the authenticity of their products and the quality of
customer services. This lack of control can sometimes get Amazon into trouble, both with
its customers and the product manufacturers.8 Amazon may prefer selling products itself to
mitigate such risks.
Finally, one would expect that after its entry, Amazon could easily promote such products
on its own site, which would likely make it the single largest seller for these products. Selling
large volumes of those products would give Amazon significant bargaining power with the
product suppliers. Amazon could translate the lower costs at which it could obtain these
products over third-party sellers into either higher profits or lower prices to consumers, the
latter further increasing customer satisfaction.
Meanwhile, there are several factors that might reduce Amazon’s incentives to enter
third-parties’ product spaces. First, Amazon already makes a profit from these sellers; for
example, it receives referral fees from third-party sales ranging from 6%-45% of products’
purchase prices, as well as charging larger sellers a monthly membership fee, but it might
have to lose this income if it chose to compete against them.9
Second, Amazon generates revenues from third-party sellers through a service called
8Source: NG S, Rockoff J. 2013. Amazon and J&J Clash Over Third-Party Sales. Wall Street Journal. 10November: http://www.wsj.com/articles/SB10001424052702303460004579190270427483810, accessedAugust 2015.
9Source: Amazon.com. Selling on Amazon fee schedule. https://sellercentral.amazon.com/gp/seller/registration/participationAgreement.html, accessed August 2015.
9
“Fulfillment by Amazon,” which helps handle third-party sellers’ back-end operations. To
use this service, third-party sellers simply ship their inventory to Amazon, and pay Amazon
for storage, weight handling, and pick & pack operations. Amazon then manages their entire
back-end operations, including storage, customer order fulfillment, and customer service.
These products also qualify for Amazon free shipping programs. While this service provides
Amazon more data to optimize its entry strategy, because Amazon already handles most of
the logistics for these products, direct entry would afford little opportunity to improve the
quality of customer service for these products.
Finally, Amazon has established a reputation for sacrificing profits in favor of long-term
growth.10 It tries to keep prices on its core business below those of competitors and invests
heavily in such diverse areas as online grocery, hardware devices, and cloud computing
services.11 Amazon’s focus on long-term growth rather than short-term profits requires it to
cultivate its relationship with third-party sellers to help them grow, rather than competing
directly with them, and risking driving them onto competing platforms like eBay or Wal-
Mart.
In sum, whether Amazon chooses to enter third-party sellers’ product space, and if it
does, which product spaces it is most likely to enter, are empirical questions. Many platform
providers today face similar trade-offs in managing relationships with complementors (e.g.,
short-term profitability vs. long-term growth). Results from Amazon.com can help us better
understand the incentives that influence platform providers’ entry decisions with respect to
complementors’ market spaces.
10See, for example: Nasdaq. 2014. Amazon Is unprofitable — andit’s completely on purpose. 25 July: http://www.nasdaq.com/video/amazon-is-unprofitable---and-its-completely-on-purpose-518340934, accessed August 2015.
11Source: The Guardian. 2014. What does Amazon care for losses? Its plan is for worlddomination. The Guardian. 26 July: http://www.theguardian.com/technology/2014/jul/27/amazon-losses-falling-shares-world-domination-jeff-bezos, accessed August 2015.
10
3 Data and Variables
We collect data from Amazon.com on four product categories and associated subcategories:
(1) Electronics & Computers, (2) Home, Garden & Tools, (3) Toys, Kids & Games, and (4)
Sports & Outdoors. In total, these four categories collectively accounted for approximately
58 million products as of June 2013. Categories like Books and Music are excluded, as
products therein are offered primarily by Amazon.
We collect data in two rounds, first in June 2013 and then in April 2014. 12 We identify in
the first round a set of products offered only by third-party sellers, and then, in the second
round, check whether Amazon has entered these product spaces in the intervening period.
As we cannot know ex ante which product spaces Amazon will choose to start selling itself,
we need to collect information on as many products as possible in the first round. One
challenge for collecting many data from Amazon is that Amazon bans an IP address for a
few hours if it tries to access Amazon’s pages too frequently. We try to circumvent this IP
blockage by accessing Amazon via 30 different proxies and introducing a delay of several
seconds after each access. Because of the large number of products Amazon offers, it is
practically impossible to gather information from every product listed on Amazon. Thus,
we design our program to check only 0.5% of products under each subcategory.
We obtain, for each product not offered by Amazon, price (Price), shipping cost (Ship-
ping), average customer rating (AverageRating), and total number of sellers that offer the
product in new condition (NumSellers). Note that many sellers may sell the same product
on Amazon for different prices and shipping costs, so we obtain the price and shipping infor-
mation from the default page Amazon displays when users search for the product. We also
obtain the ID of the default seller, typically the one that offers the product at the lowest
cost (i.e., price plus shipping cost), and capture whether the seller uses Amazon’s fulfillment
12Our data collection procedure adheres to Amazon’s robots exclusion protocol (available at http://www.amazon.com/robots.txt, accessed April 2014).
11
service using a dummy variable, FulfilledByAmazon, coded 1 if third-party product distribu-
tion is handled by Amazon, and 0 otherwise. Amazon does not publish sales data for each
product, but does provide sales ranking data for products in each product category. Past
research (e.g., Chevalier and Goolsbee 2003; Sun 2012) have identified a log-linear relation-
ship between sales ranks and actual sales, so we obtain ranking information for each product
(SalesRank ). Rankings are negatively correlated with sales, a lower ranking indicating higher
sales. Products out of stock or sold only in used condition are excluded. In total, we obtain
product information for 163,853 products in 22 subcategories.
We also gather information on the total number of products offered on Amazon by each
third-party seller (NumProdBySeller ) in our data set as well as for a subset of these third-
party sellers’ other products including prices and whether they use Amazon’s fulfillment
service. As the number of products these third-party sellers offer varies between 1 and 15
million, it is not feasible to gather information about every such product; we therefore gather
information on up to 40 products listed on the store page of each third-party seller.
For all products we gather in the first round, we gather the same set of information again
in the second round. Of the 163,853 products identified in the first round as being offered
only by third-party sellers, we find that Amazon has entered 4,852 (3%) of these product
spaces between the two rounds. Table 1 provides the distribution of these products across
subcategories for the whole sample and for those affected by Amazon’s entry. We find the top
four subcategories (Toys & Games, Sports & Outdoors, Electronics, and Home & Kitchen) to
account for more than 88% of Amazon entries and the percentage of product entries in each
subcategory to vary from 0 to 7.34%. We observe no entries in five subcategories (Computers
& Accessories, Video Games, Software, Grocery & Gourmet Food, and Watches).13
13This pattern is likely to reflect Amazon’s growth strategies in the past. For example, Amazon signed anagreement with Toys “R” Us in 2000 that gave Toys “R” Us the rights to be the sole seller of toys, games andbaby products on Amazon. This partnership, which was supposed to last 10 years, did not go well and endedin 2006. As a result, Amazon may have delayed its own entry into product spaces under the Toys & Gamescategory. Similarly, in 2001 Amazon partnered with Circuit City, a large electronics retailer then, but the
12
Table 2 presents summary statistics for the product spaces that Amazon has and has not
entered, based on product information collected in the first round. We take logarithms of
several variables that exhibit skewed distributions. Looking at product prices and shipping
costs, we find that, on average, the products Amazon chooses to offer after the first round
tend to have higher prices and lower shipping costs. The latter result is consistent with the
explanation that, as Amazon offers free shipping through its prime or super saver shipping
programs, it does not want to enter the spaces of products that require high shipping costs
(e.g., bulky items).
We look next at the products’ sales rankings and average consumer ratings. Because not
all products have consumer reviews, we compute average ratings only for products with at
least one review. If Amazon’s entry is motivated by capturing profits from popular products,
we expect Amazon to pick those with low rankings (i.e., high demand) and high customer
ratings. On the other hand, if Amazon is seeking to help improve customer experience by
entering third-parties’ low-performing products, we expect it to pick products with high
rankings and low ratings for its entry. Our evidence supports the former explanation, that
is, that Amazon is more likely to pick lower ranked (i.e., more popular) and higher rated
products (i.e., greater customer satisfaction).
We next look at the likelihood of a third-party product being distributed by Amazon.
When a product is distributed by Amazon, the platform generates additional profits from
this service from these sellers, in addition to a percentage of sales revenue. Because con-
sumers who purchase these products already benefit from Amazon’s high-quality distribution
service, there is little room to improve customer experience by direct entry. Whether entry
is motivated by profits or the desire to improve the customer experience, the likelihood of
entry should be lower for third-party products distributed by Amazon. On the other hand,
relationship ended in 2005. Source: Mangalindan M. 2006. How Amazon’s dream alliance with Toys “R” Uswent so sour. Wall Street Journal. 23 January: http://www.wsj.com/articles/SB113798030922653260,accessed August 2015.
13
Amazon’s additional information advantage from fulfilling these products (e.g., knowledge
of inventory space requirements, the suppliers from which they are sourced, etc.) should
facilitate, and thereby increase the likelihood of, entry. The summary statistics show that
Amazon is more likely to enter the spaces of products that use its distribution service.
We also look at the number of sellers offering that product. When a large number of
sellers offer same product, the intensity of competition may reduce Amazon’s incentive to
enter. On the other hand, a large number of sellers suggest that sourcing the product is easy,
which might increase the likelihood of Amazon’s entry. We find that on average, Amazon is
more likely to enter spaces of products offered by many sellers, suggesting that convenience
of sourcing dominates competitive effects.
Lastly, we examine the total number of products default third-party sellers offer on
Amazon. On one hand, Amazon may strategically avoid squeezing large third-party sellers
because they are important for value creation, but in probabilistic terms, products by big
sellers are more likely to become targets of entry by Amazon. We find that products affected
by Amazon’s entry tend to be those offered by bigger sellers, suggesting that avoiding big
sellers is not a strong incentive when Amazon chooses which products to offer itself.
The significant differences observed in Table 2 between the product spaces Amazon
chooses to enter and not to enter suggest that its entry decisions are not random. Amazon
is more likely to target for entry products that are popular and have good reviews.
4 Empirical Analysis
4.1 Amazon’s Entry Pattern
We explicitly model Amazon’s entry pattern in a regression framework. Many of the variables
in Table 2 are correlated—for example, products with good reviews or fulfilled by Amazon are
also likely to be popular (i.e., have low rankings)—so it is important to conduct multivariate
14

regression analysis to gain robust insights into Amazon’s entry pattern.
Table 3 reports logit regression results from which we try to identify Amazon’s entry
pattern. We include all products offered only by third-party sellers from the first round data
collection. The dependent variable is a dummy, Entered, which is 1 if Amazon offers the
product in the second round by itself, and 0 otherwise. Model (1) includes product informa-
tion such as prices, shipping costs, and sales rankings, and we add the customer ratings in
Model (2). Because not all products have consumer reviews, we include, instead of average
consumer ratings, dummy variables for different product rating levels. The benchmark group
consists of products with no ratings. We also include information on whether the product is
fulfilled by Amazon and the logarithm of the total number of third-party sellers offering the
same product. In Model (3), we add as additional controls dummies for product categories,
and in Model (4), the logarithm of the total number of products offered by the third-party
sellers.
We find, in all four models, that entry by Amazon is more likely for products with higher
prices, lower shipping costs, and greater demand. We also find, from the coefficients of
the product rating dummies, that Amazon’s likelihood of entry increases with a product’s
customer rating. Interestingly, in contrast to summary statistics in Table 2, we find, when
controlling for various co-variants, that Amazon is less likely to enter a product space of a
third-party seller that uses Amazon’s distribution system. We also find that Amazon is more
likely to enter product spaces when the number of third-party sellers is large, and that it does
not seem deterred by the size of third-party sellers. Overall, these results are consistent with
the view that Amazon’s entry is motivated primarily by its desire to capture more value.
4.2 Impact of Entry on Third-Party Products
We next evaluate the impact of Amazon’s entry on third-party products. Because the product
spaces Amazon enters are not chosen at random, we cannot simply compare affected to
15
unaffected products to evaluate the impact of Amazon’s entry. We first use data from the
first round to conduct propensity-score matching. With propensity-score matching, for each
affected product, we use the first-round data to identify an unaffected product that is very
similar to it except that this product has not been affected by Amazon’s entry during our
study period (it is possible that the unaffected product became affected by Amazon’s entry
after our study period). We can then identify the impact of Amazon’s entry by using the
second-round data to compare the affected products (treatment group) to their matched
unaffected counterparts (control group). We use Model (4) from Table 3 to generate the
propensity scores that we use to find matches for the affected products.14 Because we have
a large number of unaffected products, all affected products are matched with unaffected
products during matching, except one.
Table 4 presents the results. First, we look at the products’ prices on Amazon. For
those that Amazon has entered, their prices are determined by Amazon. We find that the
prices for the products affected by Amazon’s entry in the second period are not statistically
different from those it does not enter.
We also compare their shipping fees. As Amazon offers free shipping programs (via its
prime and super saver deals), when Amazon offers products, their shipping fees become zero.
Although third-party sellers have the option of offering free shipping for their products or
using Amazon’s distribution to take advantage of its free shipping offers, third-party sellers’
shipping fees are, on average, significantly higher.
Examining their sales rankings, we find demand in the second round to be greater for
products Amazon started selling itself than for products in the control group. This is not
surprising, as Amazon’s lower shipping costs decrease the overall costs of these products to
consumers. Interestingly, we do not find significant differences between the average customer
ratings of affected and unaffected products, suggesting that Amazon’s entry does not seem
14We perform the matching using the single nearest-neighborhood algorithm with a caliper of 0.01.
16
to increase consumer satisfaction with the products.
Lastly, we examine the likelihood of third-party sellers continuing to offer, in the second
round, products entered by Amazon. Reduced demand consequent to Amazon’s entry could
discourage third-party sellers from continuing to sell the affected products. On the other
hand, subsequent to Amazon’s entry, it may take some time for these sellers to reduce
inventories accumulated while being the default sellers, in which case the products may
continue to by offered by the third-party sellers. We create a dummy, StopOffer, which is 1
if the seller ceases to offer a product in the second, and 0 otherwise. We find the turnover rate
for product offerings by third party sellers between the first and second rounds to be generally
quite high, exceeding 40% for both affected and unaffected products. The likelihood of these
products no longer being offered by the same third-party sellers in the second round is six
percentage points higher for products affected than for products unaffected by Amazon’s
entry.
Overall, our results suggest that Amazon’s entry reduces the shipping cost—and hence
the cost to consumers—of affected products, resulting in increased sales of these products,
but it also discourages third-party sellers from continuing to offer the products.
4.3 Impact of Entry on Third-Party Sellers
We examine the impact of Amazon’s entry on third-party sellers by comparing shifts in
behavior between sellers affected and those unaffected by Amazon’s entry. We identify
affected sellers from those whose products are affected, and unaffected sellers from the control
group. Because our matching is conducted at the product level, it is possible that the same
seller has affected products in the treatment group and unaffected products in the control
group, and so we drop all sellers that show up in both groups.15 Our final data set consists of
966 affected, and 1,544 unaffected, sellers. Because multiple products of the same seller may
15Our results do not change qualitatively if we include these sellers as affected sellers.
17
be affected by Amazon’s entry, we compute, for each seller, NumEntered, being the total
number of products offered by the seller that are affected by Amazon’s entry. For unaffected
sellers, this variable has a value of 0; for affected sellers, on average, each has 1.61 products
that are impacted by Amazon’s entry (ranging from 1 to 28).
Because our propensity-score matching, performed at the product level, does not ac-
count for attributes of pre-existing differences among these sellers, we use a “difference-in-
differences” approach together with seller-fixed effects to examine shifts in sellers’ strategies.
We create two dummy variables Affected, which is 1 if the seller is affected by Amazon’s
entry and 0 otherwise, and After, which is 0 if it is the first round and 1 otherwise.
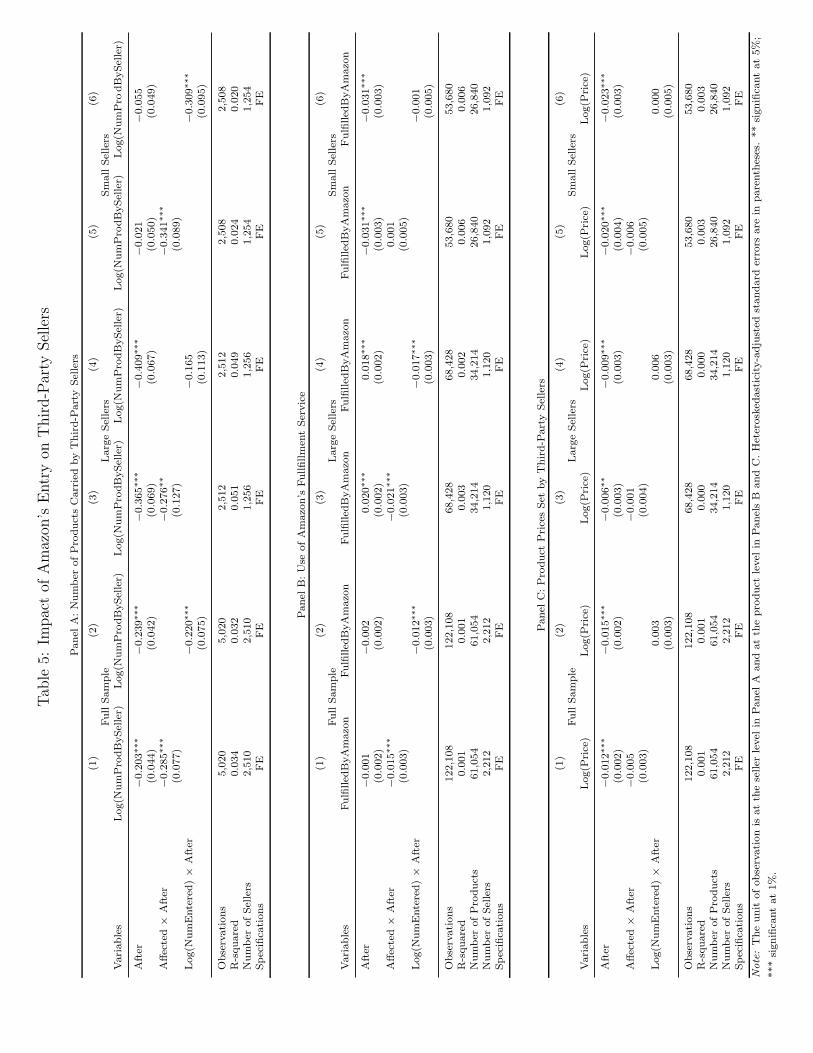
We first examine changes in the total number of products offered by third-party sellers
over the two periods in Panel A. The dependent variable, Log(NumProdBySeller), is the
logarithm of the total number of products offered by a third-party seller in each round.
We include as independent variables After and its interaction with Affected. Because we
control for seller-fixed effects, the main effect of Affected is absorbed. Model (1) of Panel
A shows our result. Our finding that the interaction variable is negative and significant
suggests that affected sellers are more likely than unaffected sellers to reduce the numbers of
products they offer on Amazon. Model (2), in which we replace the variable Affected with
Log(NumEntered) to better capture the heterogenous impact of Amazon’s entry on these
sellers, yields similar results. As large sellers may behave differently from small sellers, in
Models (3)-(6), we repeat the analyses in Models (1)-(2) for large sellers and small sellers,
respectively. We define a seller as a large (small) seller if it offers more (fewer) products
than the median number of products offered by all sellers in the first round. We find that
the effect is greater and more significant for small sellers.
We next examine changes in seller behavior at the individual product level using data
collected on other products offered by these sellers in Panels B and C of Table 5 . We thus
control for product-level fixed effects in these two panels. For those products that continue
18

to be offered by the third-party sellers in the second round, we examine shifts in sellers’
strategies regarding whether or not to use Amazon’s distribution channels, as captured by
FulfilledByAmazon. Some sellers stopped offering the products we collect data for in the
first round, so we drop them from the analyses. Although our dependent variable is binary,
we use linear probability models to facilitate interpretation of the interaction variables. 16
The results in Table 3 seem to imply that sellers’ rational response to forestall entry by
Amazon would be to start using its distribution system. On the other hand, sellers adversely
affected by Amazon’s entry may be discouraged from developing closer relationships with
the platform. We replicate the analysis in Panel A and report the results in Panel B. We
find that, consistent with the latter explanation, Amazon’s distribution system is less likely
to be used by affected third-party sellers than by sellers in the control group. We also find
that this effect is only significant for large sellers, and the magnitude of the effect appears
to be small. The result suggests that the primary response for small sellers is to carry fewer
products, rather than adjust their inventory strategies.
We examine how Amazon’s entry affects third-party sellers’ pricing strategies. The de-
pendent variable is the logarithm of the product prices. Our results reported in Panel C
reveal no significant shifts in sellers’ pricing strategies for both large and small sellers.
Overall, the results reported in Table 5 suggest that when affected by Amazon’s entry,
third-party sellers, particularly small ones, are discouraged from growing their businesses on
the platform.
4.4 Robustness Checks
We conduct a few robustness checks to ensure that our conclusions are not driven by al-
ternative explanations and report the results in Table 6. First, Amazon’s entry decision is
16In our analysis, 100% of the predicted probabilities lie between zero and one. Angrist and Pischke (2008)and Horrace and Oaxaca (2006) show that in such cases, linear probability models with robust standard errorsyield unbiased and consistent estimates.
19
likely to depend on some unobservables. The platform may not, for example, be able to
enter the product space of a manufacturer that sells its product directly on Amazon (e.g.,
Dumrongsiri et al. 2008). Although the information on Amazon.com does not allow us to
identify products sold directly by manufacturers, repeating the analysis excluding products
sold by only one third-party seller yields similar results (Model (1) of Table 6).
Second, our logit regressions implicitly assume that entry probability is primarily corre-
lated to product characteristics rather than seller characteristics. To confirm this assump-
tion, we add third-party sellers’ ratings in the logit regressions. The rating of each seller
is computed as the average of all ratings the seller receives from its past transactions, and
captures the seller’s service quality instead of quality of his or her products. The rating is
likely to be correlated to variables such as Price, Shipping, and FulfilledByAmazon : Sellers
with greater service quality are likely to command higher prices; they are also likely to use
Amazon’s fulfillment services or have efficient distribution systems themselves, both result-
ing in lower shipping costs. If Amazon’s entry decisions are not orthogonal to seller ratings,
inclusion of seller ratings is likely to have a large impact on the magnitude and significance
of current predictors. Model (2) of Table 6 reports results after including seller ratings. Only
27 products are sold by sellers with ratings between 1 and 3 and for all these products, we
observe no entry. As a result, these observations are dropped during estimation due to lack
of variation. We find that seller ratings have no influence on entry probability. Moreover,
after including seller ratings, the results for other variables are virtually unchanged from
those in Model (4) of Table 3, although we expect seller ratings to be correlated with several
other variables. The result thus confirms our empirical assumption and boosts confidence in
our empirical approach.
Third, special contractual agreements with large, third-party sellers may reduce the like
liho cod of entry by Amazon. We drop top 10% of the third-party sellers based on the total
number of products they carry in the first round and repeat the analysis. We continue to
20
find similar results (Model (3) of Table 6).
Finally, although our logit regression includes a large number of product characteristics,
it is possible that Amazon’s entry decisions depend on other unobservables. Amazon may, for
example, look at growth in product sales instead of current sales figures. While our conclusion
that Amazon selects more promising product spaces to enter continues to hold in such cases,
we take three approaches to examine robustness. First, we exclude five product subcategories
(Toys & Games, Electronics, Computers & Accessories, Video Games, and Software) in which
products are likely to exhibit significant trends. For the remaining product subcategories,
as new products are likely to exhibit great demand variation, we exclude all products that
became available on Amazon.com after January 1, 2013. Demand for the remaining products
in our data set is likely to be relatively stable. Repeating the logit regression with these
products reveals a similar entry pattern (Model (4) of Table 6). The influence of several
variables like our rating variables and FulfilledByAmazon become greater.17
We also test the sensitivity of our results from propensity-score matching by estimating
Rosenbaum bounds (Rosenbaum 2002; Leuven and Sianesi 2003), which measure how strong
an influence an unobservable factor must have on the selection process to nullify the identi-
fied causal effects from the propensity-matching analysis.18 We find that, depending on the
outcome variable, an unobservable variable would have to change the odds of selection into
the treatment group by an amount ranging from 30% to more than 100% for the significant
treatment effects in Table 4 to disappear.19 In addition, these thresholds are conservative
estimates and hence any confounding unobservable would need to have an extremely high,
17Replicating, in unreported regressions, the analyses in Tables 4 and 5 yields similar results.18If we label the probability of a product being in the treatment group pi, and the probability of the
matched product being in the control group pj , Rosenbaum (2002) gives the bounds on the odds ratio forthe products being matched as: 1
Γ ≤ pi/(1−pi)pj/(1−pj)
≤ Γ, where Γ ≥ 1. Based on the intuition that Γ should beclose to 1 if the unobservable does not play a significant role in selection, Rosenbaum develops test statisticsto show how far Γ must be from 1 for the unobservable to nullify the treatment effect.
19Note that the threshold we find is on the same order of magnitude as the Rosenbaum bounds resultsreported by DiPrete and Gangl (2004) and Sen et al. (2011).
21
almost deterministic influence on selection into the treatment group and our outcome vari-
ables (DiPrete and Gangl 2004). Hence, the effect of Amazon’s entry on affected products
and sellers is unlikely to be negated by factors unobserved in our study.
5 Discussion and Conclusion
Our research provides the first large-scale empirical study of co-opetition between platform
owners and complementors using data from Amazon.com, and highlights the importance
for complementors of taking value capture into account when building businesses on plat-
forms. As platform owners are often strategic players, complementors need to understand
the incentives and capabilities of platforms and not treat platform-based markets as regular
markets.
Just like any other empirical studies, one may worry whether the entry pattern we have
documented merely reflects coincidence: Amazon could have used an independent process to
identify these products to source by itself instead of using data about third-party products.
Although this possibility is hard to rule out without direct observations of Amazon’s opera-
tions, several indications suggest that the entry pattern is beyond sheer coincidence. First,
in our logit regressions, if Amazon’s merchandise planning process is completely independent
of data related to third-party products, the dummy variable, FulfilledByAmazon, should not
be highly significant in all specifications. Second, interviews by Brad Stone with current and
former Amazon executives suggest that Amazon indeed uses its Marketplace as a learning
tool to decide whether it should get into certain product markets (Stone 2013). For example,
according to Stone (2013), Randy Miller, the former Director of Merchandise Planning at
Amazon, said “If you don’t know anything about the business, launch it through the Mar-
ketplace, bring retailers in, watch what they do and what they sell, understand it, and then
get into it” (Stone 2013, p. 182). Our research thus complements the field interviews by
22
examining the extent of Amazon’s entry, product spaces Amazon is more likely to target,
and the impact of entry.20
While our research focuses on Amazon.com as the empirical setting, our results have
implications for complementors participating in many different platform-based markets. We
show that, although Amazon cares about its long-term growth, it still has incentives to
appropriate value from third-party sellers selling successful products on its platform. As a
result, the appropriation risks would be even higher for complementors when they work with
platform owners that focus on short-term profit maximization.
Our results also inform complementors’ strategies in different platform-based markets,
and highlight factors that do and do not influence platform owners’ incentives to squeeze
complementors out of the market. We find, for instance, contrary to the conventional wisdom
that firms typically find competitive markets unattractive for entry (e.g., Berry and Reiss
2007), that intensity of competition among complementors does not seem to affect platform
owners’ entry decisions. In our setting, we observe across many instances of Amazon entry
that Amazon may present itself as the default seller even when third-party sellers’ products
are offered at lower cost (i.e., product price plus shipping cost) with comparable shipping
speeds, and these third-party sellers have high ratings. Although Amazon sometimes notes
on its product pages that products may be offered at lower cost by third-party sellers, even
consumers who notice this message (and many likely don’t) may not be disposed to spend
time examining the list of third-party sellers. Competition thus does not seem to influence
Amazon’s choice of products to offer: after all, third-party sellers will be competing with
Amazon on its web site under its rules. Similar scenarios take place in other settings.
Applications supplied by platform owners (e.g., Microsoft and Apple), for example, are
20Note that our research does not imply that individuals in charge of obtaining new merchandises atAmazon must have access to detailed transaction data for third-party products. As Amazon publishes datarelated to third-party products on its website (e.g., consumer reviews and product ranks), they can simplybrowse Amazon.com to obtain such information.
23
often bundled with their respective platforms (e.g., Windows and iOS). Unbundled rival
complementary products consequently are handicapped by the extra cost consumers need
to incur acquiring, searching for, and installing them. In the end, consumers may opt
for platform owners’ copycats even when the quality is inferior to complementors’ original
innovations.
While our results may paint a gloomy picture for complementors in various platform-
based markets, they do suggest several strategies complementors can use to mitigate the risk
of being squeezed. Complementors might, for example, focus on products platform owners do
not want to sell. As platforms tends to target popular products, complementors that build
their businesses around aggregating non-blockbuster products or services (e.g., Zentner et al.
2013) are less likely to face direct competition from platform owners.
Complementors can also seek ways to impede entry by platform owners. In our setting,
third-party sellers can try to sign exclusive contracts with manufacturers to be the sole
suppliers of certain products, or try to conceal their suppliers’ information from Amazon.
They may also choose to manufacture some complementary products on their own. In other
markets, complementors may use patents to protect their innovations.
Finally, complementors may choose to share more value with platform owners to reduce
their incentives to enter. Our results show, for example, that complementors’ use of Amazon’s
fulfillment services reduces the likelihood of its entry. In other settings, sometimes platform
owners enter complementary markets because complementors limit platform owners’ ability
to monetize their services. For example, Twitter released its own client app to compete with
third-party client apps because owning the client app helped it monetize its service. 21
Although Amazon’s entry can harm complementors and may potentially reduce the num-
ber of innovative products consumers can find on the site, our results show that such entry
21See, for example: Flip the Media. 2008. To tweet, perchance to monetize. 22 October: http://flipthemedia.com/2008/10/1593/ and Twitip. 2010. Twitter takes control over client apps - good orbad?. 15 April: http://www.twitip.com/twitter-takes-control-over-apps/, accessed August 2015.
24
can allow consumers to benefit from Amazon’s efficient distribution systems, and that they
are more likely to purchase the products. Hence, consumer welfare may actually increase—so
the overall social welfare effect of platform owner entry in this case is not clear.
Future research could extend our study in various directions. Our study, for example,
involves a setting in which it is difficult for complementors to deter entry by the platform
owner. In platform markets like the software industry, complementors may be able to em-
ploy defense mechanisms such as patents to protect their innovations (e.g., Wen et al. 2013).
Consistent with this logic, Huang et al. (2013) find that software firms with a greater stock
of patents and copyrights are more likely to join SAP’s platform. Acquisition may be the
only avenue open to platform owners seeking to enter the product spaces of complementors
with strong defense mechanisms. Li and Agarwal (2015) study Facebook’s acquisition of
Instagram, a popular photo-sharing application, and show that this move expands demand
for the latter by attracting new users who previously did not use any photo-sharing applica-
tions. The result mirrors our finding that Amazon’s entry increases the popularity of affected
products. Future research could assess the generalizability of our results to other settings in
which platform owners use different entry strategies.
Data limitations prevent our study from examining how Amazon’s entry strategies affect
its growth. Current or potential complementors discouraged by Amazon’s entry may bring
fewer innovative products to the platform. But if Amazon’s entries attract more consumers
and lower the cost of offered products, the expanded consumer base could incentivize more
third-party sellers to join the platform. Thus, how Amazon’s direct competition against its
complementors affects platform growth remains an open question.
Finally, complementors should be aware that, although the most threatening and visible
form of squeezing, direct entry into their product spaces is not the only approach available
to platforms for appropriating value from complementors’ innovations (e.g., Edelman 2014).
For example, being purely a marketplace, eBay has not developed the capability to operate
25
as a retailer and so is not positioned to compete directly with third-party sellers. But eBay
has increased its service fees several times to capture more value from its sellers. Apple
often uses terms and conditions to reject applications that compete directly with its own
offerings. Facebook reduced the number of game posts from Zynga, a large third-party game
publisher, on its newsfeed, which weakened Zynga.22 Future research could explore how
platform owners employ different strategies to squeeze complementors.
References
Angrist, Joshua D., Jorn-Steffen Pischke. 2008. Mostly Harmless Econometrics: An Empiricist’sCompanion . Princeton University Press.
Armstrong, Mark. 2006. Competition in two-sided markets. Rand Journal of Economics 37(3)668–691.
Berry, Steven, Peter Reiss. 2007. Empirical models of entry and market structure. Mark Armstrong,Robert Porter, eds., Handbook of Industrial Organization , vol. 3, chap. 29. North Holland, NewYork, 1845–1886.
Brandenburger, Adam M., Barry J. Nalebuff. 1997. Co-Opetition . Currency Doubleday.
Casadesus-Masanell, Ramon, Hanna Halaburda. 2014. When does a platform create value bylimiting choice? Journal of Economics & Management Strategy 23(2) 259–293.
Casadesus-Masanell, Ramon, Gaston Llanes. 2011. Mixed source. Management Science 57(7)1212–1230.
Casadesus-Masanell, Ramon, Barry J. Nalebuff, David Yoffie. 2007. Competing complements. NETInstitute Working Paper No. 07-44.
Casadesus-Masanell, Ramon, David Yoffie. 2007. Wintel: Cooperation and conflict. ManagementScience 53(4) 584–598.
Ceccagnoli, Marco, Chris Forman, Peng Huang, D.J. Wu. 2012. Cocreation of value in a platformecosystem: The case of enterprise software. MIS Quarterly 36(1) 263–290.
Cennamo, Carmelo, Claudio Panico. 2015. What drives a platform’s strategy? Usage, membership,and competition effects. Working paper.
Cennamo, Carmelo, Juan Santalo. 2013. Platform competition: Strategic trade-offs in platformmarkets. Strategic Management Journal 34(11) 1331–1350.
Cennamo, Carmelo, Juan Santalo. 2015. Value creation and free-riding in platform markets: Theasymmetric impact of competition on quality across the platform life cycle. Working paper.
Chen, Jianqing, Ming Fan, Mingzhi Li. 2012. Advertising versus brokerage model for online tradingplatforms. NET Institute Working Paper No. 12-12.
22Source: Constine J. 2012. Why Zynga failed. TechCrunch. 5 October: http://techcrunch.com/2012/10/05/more-competitors-smarter-gamers-expensive-ads-less-virality-mobile/, accessed August2015.
26
Chevalier, Judith, Austan Goolsbee. 2003. Measuring prices and price competition online: Ama-zon.com and BarnesandNoble.com. Quantitative Marketing and Economics 1(2) 203–222.
Chintagunta, Pradeep K., Andre Bonfrer, Inseong Song. 2002. Investigating the effects of store-brand introduction on retail demand and pricing behavior. Management Science 48(10) 1242–1267.
Claussen, Jorg, Christian Essling, Tobias Kretschmer. 2015. When less can be more - settingtechnology levels in complementary goods markets. Research Policy 44(2) 328–339.
Claussen, Jorg, Tobias Kretschmer, Philip Mayrhofer. 2013. The effects of rewarding user engage-ment - The case of Facebook apps. Information Systems Research 24(1) 186–200.
Dai, Weijia, Ginger Jin, Jungmin Lee, Michael Luca. 2014. Optimal aggregation of consumerratings: Application to Yelp.com. NBER Working Paper 18567.
Diestre, Luis, Nandini Rajagopalan. 2012. Are all sharks dangerous? New biotechnology venturesand partner selection in R&D alliances. Strategic Management Journal 33(10) 1115–1134.
DiPrete, Thomas A., Markus Gangl. 2004. Assessing bias in the estimation of causal effects: Rosen-baum bounds on matching estimators and instrumental variables estimation with imperfectinstruments. Sociological Methodology 24(1) 271–310.
Dumrongsiri, Aussadavut, Ming Fan, Apurva Jain, Kamran Moinzadeh. 2008. A supply chainmodel with direct and retail channels. European Journal of Operational Research 187(3)691–718.
Economides, Nicholas, Evangelos Katsamakas. 2006. Two-sided competition of proprietary vs.open source technology platforms and the implications for the software industry. ManagementScience 52(7) 1057–1071.
Edelman, Benjamin. 2014. Mastering the intermediaries: Strategies for dealing with the likes ofGoogle, Amazon, and Kayak. Harvard Business Review 92(6) 86–92.
Edelman, Benjamin. forthcoming. Leveraging market power through tying: Does Google behaveanti-competitively? Journal of Competition Law and Economics .
Eisenhardt, Kathleen M., Claudia Bird Schoonhoven. 1996. Resource-based view of strategic al-liance formation: Strategic and social effects in entrepreneurial firms. Organization Science7(2) 136–150.
Eisenmann, Thomas R. 2007. Managing networked businesses: Course overview for educators. HBSnote no.807-104.
Eisenmann, Thomas R., Geoffrey Parker, Marshall W. Van Alstyne. 2011. Platform envelopment.Strategic Management Journal 32(12) 1270–1285.
Farrell, Joseph, Michael L. Katz. 2000. Innovation, rent extraction, and integration in systemsmarkets. Journal of Industrial Economics 48(4) 413–432.
Gans, Joshua S., Scott Stern. 2003. The product market and the market for “ideas”: Commercial-ization strategies for technology entrepreneurs. Research Policy 32(2) 333–350.
Gawer, Annabelle, Michael A. Cusumano. 2002. Platform Leadership: How Intel, Microsoft, andCisco Drive Industry Innovation . Harvard Business School Press.
Gawer, Annabelle, Rebecca Henderson. 2007. Platform owner entry and innovation in comple-mentary markets: Evidence from Intel. Journal of Economics & Management Strategy 16(1)1–34.
27
Gulati, Ranjay, Monica C. Higgins. 2003. Which ties matter when? The contingent effects ofinterorganizational partnerships on IPO success. Strategic Management Journal 24(2) 127–144.
Gulati, Ranjay, Dovev Lavie, Harbir Singh. 2009. The nature of partnering experience and thegains from alliances. Strategic Management Journal 30(11) 1213–1233.
Hagiu, Andrei. 2006. Pricing and commitment by two-sided platforms. Rand Journal of Economics37(3) 720–737.
Hallen, Benjamin, Riitta Katila, Jeff Rosenberger. 2013. Unpacking social defenses: A resource-dependence lens on technology ventures, venture capital, and corporate relationships. Academyof Management Journal .
Hao, Lin, Ming Fan. forthcoming. An analysis of pricing models in the electronic book market.MIS Quarterly .
Horrace, William C., Ronald L. Oaxaca. 2006. Results on the bias and inconsistency of ordinaryleast squares for the linear probability model. Economics Letters 90(3) 321–327.
Huang, Peng, Marco Ceccagnoli, Chris Forman, D.J. Wu. 2013. Appropriability mechanisms andthe platform partnership decision: Evidence from enterprise software. Management Science59(1) 102–121.
Iansiti, Marco, Roy Levien. 2004. The Keystone Advantage: What the New Dynamics of BusinessEcosystems Mean for Strategy, Innovation, and Sustainability . Harvard Business School Press.
Jiang, Baojun, Kinshuk Jerath, Kannan Srinivasan. 2011. Firm strategies in the “mid tail” ofplatform-based retailing. Marketing Science 30(5) 757–775.
Kapoor, Rahul, Joon M. Lee. 2013. Coordinating and competing in ecosystems: How organizationalforms shape new technology investments. Strategic Management Journal 34(3) 274–296.
Katila, Riitta, Jeff D. Rosenberger, Kathleen M. Eisenhardt. 2008. Swimming with sharks: Tech-nology ventures, defense mechanisms and corporate relationships. Administrative ScienceQuarterly 53(2) 295–332.
Kretschmer, Tobias, Jorg Claussen. 2015. The effects of backward compatibility: Hardware demand,software supply, and the role of technology. Working paper.
Leuven, Edwin, Barbara Sianesi. 2003. PSMATCH2: Stata module to perform full Mahalanobisand propensity score matching, common support graphing and covariate imbalance testing.http://ideas.repec.org/c/boc/bocode/s432001.html.
Li, Zhuoxin, Ashish Agarwal. 2015. The impact of platform integration on consumer demand incomplementary markets: Evidence from Facebook’s integration of Instagram. Working paper.
Nosko, Chris, Steven Tadelis. 2015. The limits of reputation in platform markets: An empiricalanalysis and field experiment. NBER Working Paper No. 20830.
Ozcan, Inar, Kathleen M. Eisenhardt. 2009. Origin of portfolios: Entrepreneurial firms and strategicaction. Academy of Management Journal 52(2) 246–279.
Pahnke, Emily C., Rory McDonald, Dan Wang, Benjamin Hallen. forthcoming. Exposed: Venturecapital, competitor ties, and entrepreneurial innovation. Academy of Management Journal .
Parker, Geoffrey, Marshall W. Van Alstyne. 2005. Two-sided network effects: A theory of informa-tion product design. Management Science 51(10) 1494–1504.
28
Parker, Geoffrey, Marshall W. Van Alstyne. 2014. Innovation, openness, and platform control.Available at SSRN: http://ssrn.com/abstract=1079712.
Rochet, Jean-Charles, Jean Tirole. 2003. Platform competition in two-sided markets. Journal ofEuropean Economic Association 1(4) 990–1029.
Rosenbaum, Paul R. 2002. Observational Studies . 2nd ed. New York: Springer.
Rothaermel, Frank T. 2001. Complementary assets, strategic alliances, and the incumbent’s ad-vantage: An empirical study of industry and firm effects in the biopharmaceutical industry.Research Policy 30(8) 1235–1251.
Rothaermel, Frank T. 2002. Technological discontinuities and interfirm cooperation: What de-termines a start-up’s attractiveness as alliance partner? IEEE Transactions on EngineeringManagement 49(4) 388–397.
Seamans, Robert, Feng Zhu. 2014. Responses to entry in multi-sided markets: The impact ofCraigslist on local newspapers. Management Science 60(2) 476–493.
Sen, Boudhayan, Jiwoong Shin, K. Sudhir. 2011. Demand externalities from co-location: Evidencefrom a natural experiment. Working paper, Yale University.
Steenkamp, Jan Benedict, Nirmalya Kumar. 2007. Private Label Revolution: What Retailers AndManufacturers Should Know About Store Brands . Harvard Business School Press: Cambridge,MA.
Stone, Brad. 2013. The Everything Store: Jeff Bezos and the Age of Amazon . Little, Brown andCompany.
Sun, Monic. 2012. How does the variance of product ratings matter? Management Science 58(4)696–707.
Venkatraman, N., Chi-Hyon Lee. 2004. Preferential linkage and network evolution: A conceptualmodel and empirical test in the U.S. video game sector. Academy of Management Journal47(6) 876–892.
Wen, Wen, Chris Forman, Stuart Graham. 2013. The impact of intellectual property rights enforce-ment on open source software project success. Information Systems Research 24(4) 1131–1146.
Yehezkel, Yaron. 2008. Retailers’ choice of product variety and exclusive dealing under asymmetricinformation. RAND Journal of Economics 39(1) 115–143.
Yoffie, David B., Mary Kwak. 2006. With friends like these: The art of managing complementors.Harvard Business Review 84(9).
Zentner, Alejandro, Michael D. Smith, Cuneyd Kaya. 2013. How video rental patterns change asconsumers move online. Management Science 59(11) 2622–2634.
Zhu, Feng, Marco Iansiti. 2012. Entry into platform-based markets. Strategic Management Journal33(1) 88–106.
29
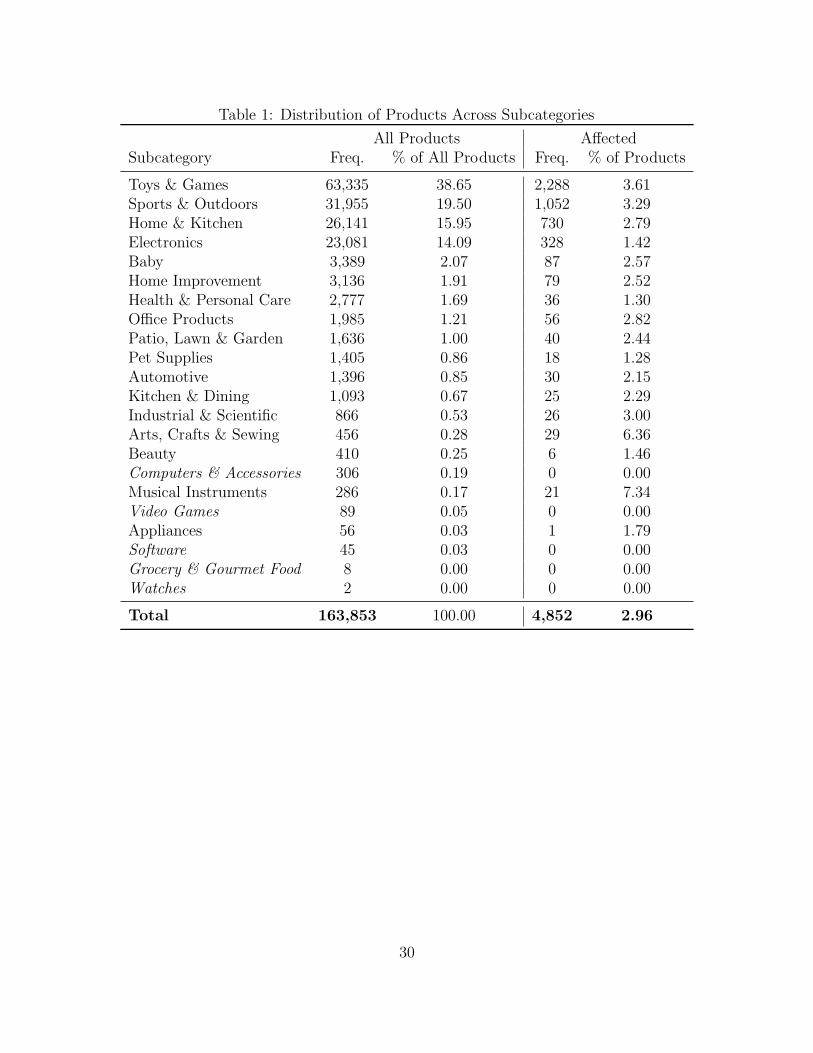
Table 1: Distribution of Products Across Subcategories
All Products AffectedSubcategory Freq. % of All Products Freq. % of Products
Toys & Games 63,335 38.65 2,288 3.61Sports & Outdoors 31,955 19.50 1,052 3.29Home & Kitchen 26,141 15.95 730 2.79Electronics 23,081 14.09 328 1.42Baby 3,389 2.07 87 2.57Home Improvement 3,136 1.91 79 2.52Health & Personal Care 2,777 1.69 36 1.30Office Products 1,985 1.21 56 2.82Patio, Lawn & Garden 1,636 1.00 40 2.44Pet Supplies 1,405 0.86 18 1.28Automotive 1,396 0.85 30 2.15Kitchen & Dining 1,093 0.67 25 2.29Industrial & Scientific 866 0.53 26 3.00Arts, Crafts & Sewing 456 0.28 29 6.36Beauty 410 0.25 6 1.46Computers & Accessories 306 0.19 0 0.00Musical Instruments 286 0.17 21 7.34Video Games 89 0.05 0 0.00Appliances 56 0.03 1 1.79Software 45 0.03 0 0.00Grocery & Gourmet Food 8 0.00 0 0.00Watches 2 0.00 0 0.00
Total 163,853 100.00 4,852 2.96
30
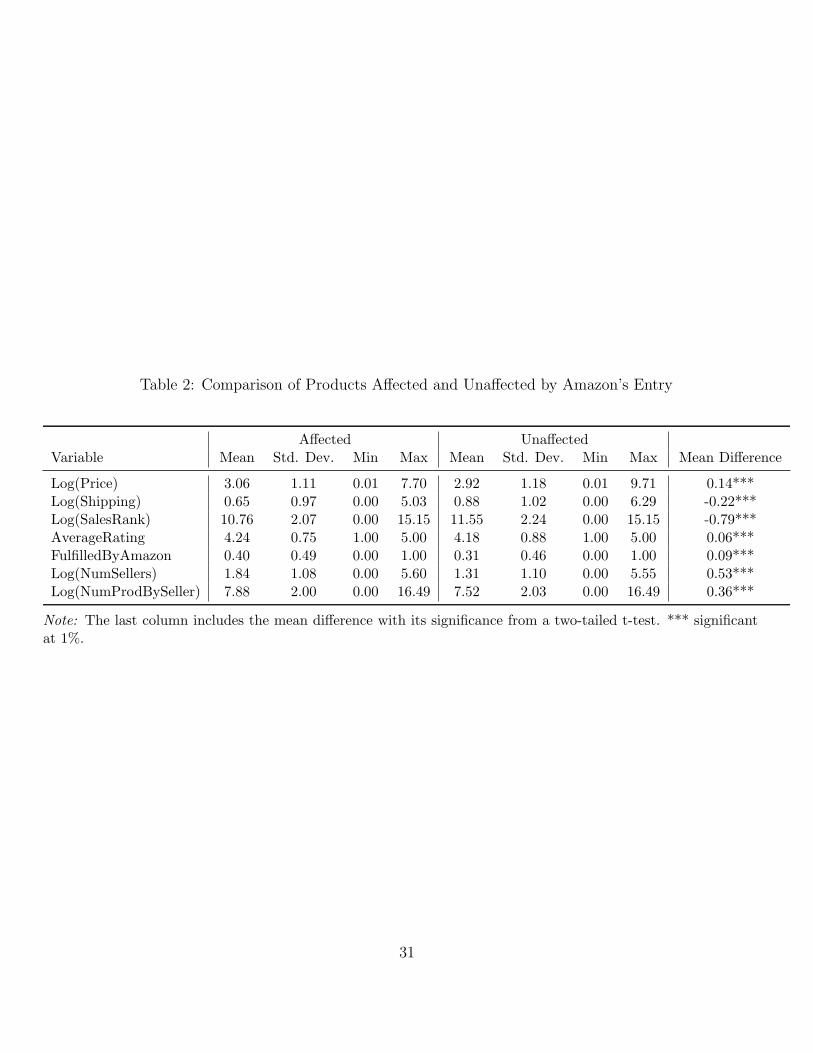
Table 2: Comparison of Products Affected and Unaffected by Amazon’s Entry
Affected UnaffectedVariable Mean Std. Dev. Min Max Mean Std. Dev. Min Max Mean Difference
Log(Price) 3.06 1.11 0.01 7.70 2.92 1.18 0.01 9.71 0.14***Log(Shipping) 0.65 0.97 0.00 5.03 0.88 1.02 0.00 6.29 -0.22***Log(SalesRank) 10.76 2.07 0.00 15.15 11.55 2.24 0.00 15.15 -0.79***AverageRating 4.24 0.75 1.00 5.00 4.18 0.88 1.00 5.00 0.06***FulfilledByAmazon 0.40 0.49 0.00 1.00 0.31 0.46 0.00 1.00 0.09***Log(NumSellers) 1.84 1.08 0.00 5.60 1.31 1.10 0.00 5.55 0.53***Log(NumProdBySeller) 7.88 2.00 0.00 16.49 7.52 2.03 0.00 16.49 0.36***
Note: The last column includes the mean difference with its significance from a two-tailed t-test. *** significantat 1%.
31
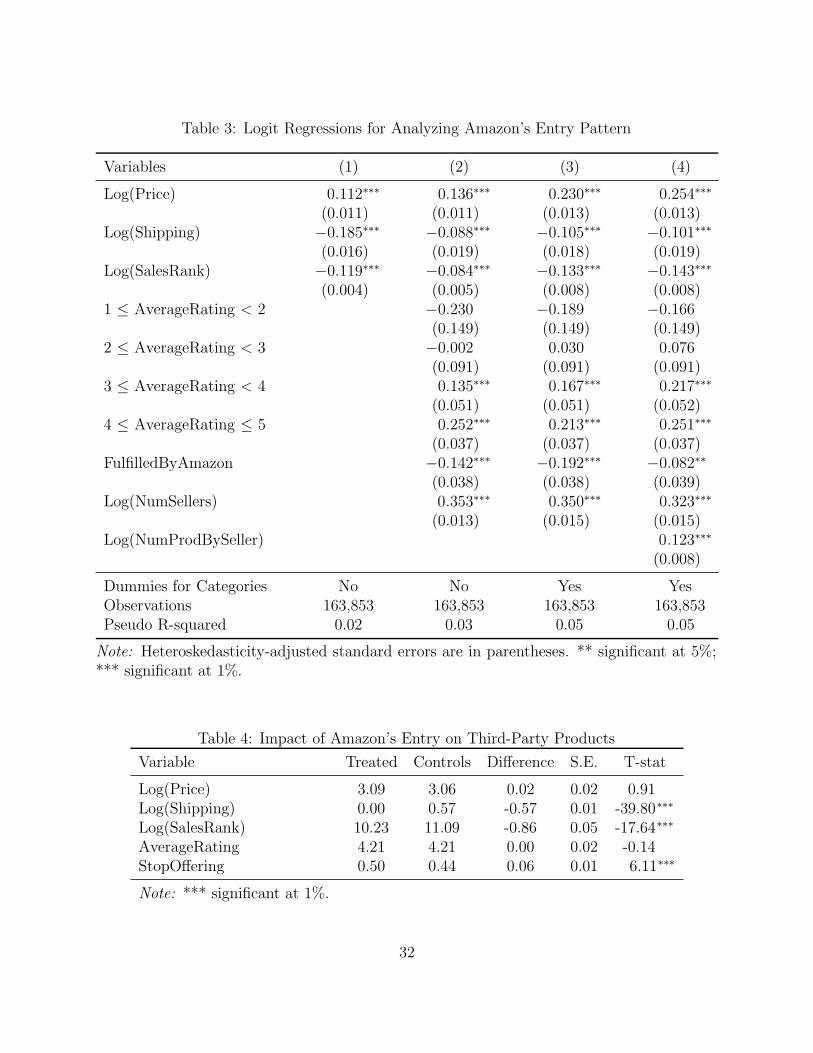
Table 3: Logit Regressions for Analyzing Amazon’s Entry Pattern
Variables (1) (2) (3) (4)
Log(Price) 0.112∗∗∗ 0.136∗∗∗ 0.230∗∗∗ 0.254∗∗∗
(0.011) (0.011) (0.013) (0.013)Log(Shipping) −0.185∗∗∗ −0.088∗∗∗ −0.105∗∗∗ −0.101∗∗∗
(0.016) (0.019) (0.018) (0.019)Log(SalesRank) −0.119∗∗∗ −0.084∗∗∗ −0.133∗∗∗ −0.143∗∗∗
(0.004) (0.005) (0.008) (0.008)1 ≤ AverageRating < 2 −0.230 −0.189 −0.166
(0.149) (0.149) (0.149)2 ≤ AverageRating < 3 −0.002 0.030 0.076
(0.091) (0.091) (0.091)3 ≤ AverageRating < 4 0.135∗∗∗ 0.167∗∗∗ 0.217∗∗∗
(0.051) (0.051) (0.052)4 ≤ AverageRating ≤ 5 0.252∗∗∗ 0.213∗∗∗ 0.251∗∗∗
(0.037) (0.037) (0.037)FulfilledByAmazon −0.142∗∗∗ −0.192∗∗∗ −0.082∗∗
(0.038) (0.038) (0.039)Log(NumSellers) 0.353∗∗∗ 0.350∗∗∗ 0.323∗∗∗
(0.013) (0.015) (0.015)Log(NumProdBySeller) 0.123∗∗∗
(0.008)
Dummies for Categories No No Yes YesObservations 163,853 163,853 163,853 163,853Pseudo R-squared 0.02 0.03 0.05 0.05
Note: Heteroskedasticity-adjusted standard errors are in parentheses. ** significant at 5%;*** significant at 1%.
Table 4: Impact of Amazon’s Entry on Third-Party Products
Variable Treated Controls Difference S.E. T-stat
Log(Price) 3.09 3.06 0.02 0.02 0.91Log(Shipping) 0.00 0.57 -0.57 0.01 -39.80∗∗∗
Log(SalesRank) 10.23 11.09 -0.86 0.05 -17.64∗∗∗
AverageRating 4.21 4.21 0.00 0.02 -0.14StopOffering 0.50 0.44 0.06 0.01 6.11∗∗∗
Note: *** significant at 1%.
32
Tab
le5:
Impac
tof
Am
azon
’sE
ntr
yon
Third-P
arty
Sel
lers
Panel
A:N
um
ber
ofP
roduct
sC
arr
ied
by
Thir
d-P
art
ySel
lers
(1)
(2)
(3)
(4)
(5)
(6)
Full
Sam
ple
Larg
eSel
lers
Sm
all
Sel
lers
Vari
able
sLog(N
um
Pro
dB
ySel
ler)
Log(N
um
Pro
dB
ySel
ler)
Log(N
um
Pro
dB
ySel
ler)
Log(N
um
Pro
dB
ySel
ler)
Log(N
um
Pro
dB
ySel
ler)
Log(N
um
Pro
dB
ySel
ler)
Aft
er−
0.2
03∗∗∗
−0.2
39∗∗∗
−0.3
65∗∗∗
−0.4
09∗∗∗
−0.0
21
−0.0
55
(0.0
44)
(0.0
42)
(0.0
69)
(0.0
67)
(0.0
50)
(0.0
49)
Affec
ted×
Aft
er−
0.2
85∗∗∗
−0.2
76∗∗
−0.3
41∗∗∗
(0.0
77)
(0.1
27)
(0.0
89)
Log(N
um
Ente
red)×
Aft
er−
0.2
20∗∗∗
−0.1
65
−0.3
09∗∗∗
(0.0
75)
(0.1
13)
(0.0
95)
Obse
rvati
ons
5,0
20
5,0
20
2,5
12
2,5
12
2,5
08
2,5
08
R-s
quare
d0.0
34
0.0
32
0.0
51
0.0
49
0.0
24
0.0
20
Num
ber
ofSel
lers
2,5
10
2,5
10
1,2
56
1,2
56
1,2
54
1,2
54
Spec
ifica
tions
FE
FE
FE
FE
FE
FE
Panel
B:U
seofA
mazo
n’s
Fullfillm
ent
Ser
vic
e
(1)
(2)
(3)
(4)
(5)
(6)
Full
Sam
ple
Larg
eSel
lers
Sm
all
Sel
lers
Vari
able
sFulfi
lled
ByA
mazo
nFulfi
lled
ByA
mazo
nFulfi
lled
ByA
mazo
nFulfi
lled
ByA
mazo
nFulfi
lled
ByA
mazo
nF
ulfi
lled
ByA
mazo
n
Aft
er−
0.0
01
−0.0
02
0.0
20∗∗∗
0.0
18∗∗∗
−0.0
31∗∗∗
−0.0
31∗∗∗
(0.0
02)
(0.0
02)
(0.0
02)
(0.0
02)
(0.0
03)
(0.0
03)
Affec
ted×
Aft
er−
0.0
15∗∗∗
−0.0
21∗∗∗
0.0
01
(0.0
03)
(0.0
03)
(0.0
05)
Log(N
um
Ente
red)×
Aft
er−
0.0
12∗∗∗
−0.0
17∗∗∗
−0.0
01
(0.0
03)
(0.0
03)
(0. 0
05)
Obse
rvati
ons
122,1
08
122,1
08
68,4
28
68,4
28
53,6
80
53,6
80
R-s
quare
d0.0
01
0.0
01
0.0
03
0.0
02
0.0
06
0.0
06
Num
ber
ofP
roduct
s61,0
54
61,0
54
34,2
14
34,2
14
26,8
40
26,8
40
Num
ber
ofSel
lers
2,2
12
2,2
12
1,1
20
1,1
20
1,0
92
1,0
92
Spec
ifica
tions
FE
FE
FE
FE
FE
FE
Panel
C:P
roduct
Pri
ces
Set
by
Thir
d-P
art
ySel
lers
(1)
(2)
(3)
(4)
(5)
(6)
Full
Sam
ple
Larg
eSel
lers
Sm
all
Sel
lers
Vari
able
sLog(P
rice
)Log(P
rice
)Log(P
rice
)Log(P
rice
)Log(P
rice
)Log(P
rice
)
Aft
er−
0.0
12∗∗∗
−0.0
15∗∗∗
−0.0
06∗∗
−0.0
09∗∗∗
−0.0
20∗∗∗
−0.0
23∗∗∗
(0.0
02)
(0.0
02)
(0.0
03)
(0.0
03)
(0.0
04)
(0.0
03)
Affec
ted×
Aft
er−
0.0
05
−0.0
01
−0.0
06
(0.0
03)
(0.0
04)
(0.0
05)
Log(N
um
Ente
red)×
Aft
er0.0
03
0.0
06
0.0
00
(0.0
03)
(0.0
03)
(0.0
05)
Obse
rvati
ons
122,1
08
122,1
08
68,4
28
68,4
28
53,6
80
53,6
80
R-s
quare
d0.0
01
0.0
01
0.0
00
0.0
00
0.0
03
0.0
03
Num
ber
ofP
roduct
s61,0
54
61,0
54
34,2
14
34,2
14
26,8
40
26,8
40
Num
ber
ofSel
lers
2,2
12
2,2
12
1,1
20
1,1
20
1,0
92
1,0
92
Spec
ifica
tions
FE
FE
FE
FE
FE
FE
Note
:T
he
unit
ofobse
rvati
on
isat
the
seller
level
inPanel
Aand
at
the
pro
duct
level
inPanel
sB
and
C.H
eter
osk
edast
icity-a
dju
sted
standard
erro
rsare
inpare
nth
eses
.**
signifi
cant
at
5%
;
***
signifi
cant
at
1%
.
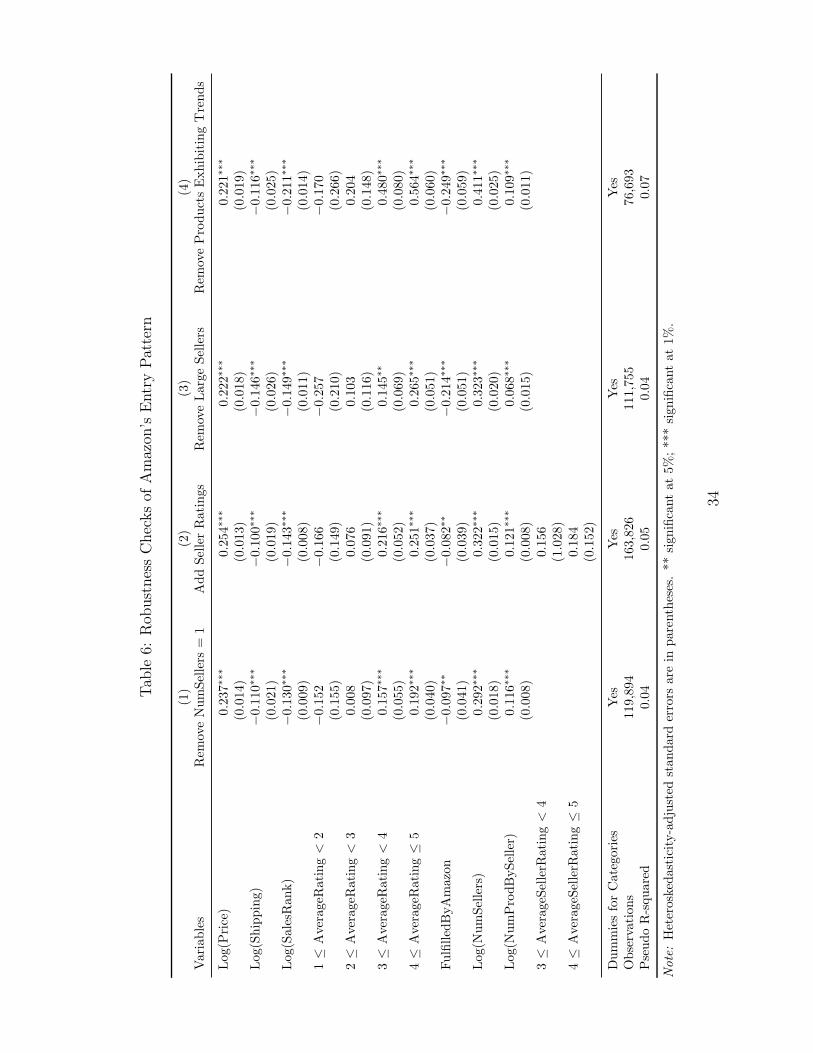
Tab
le6:
Rob
ust
nes
sC
hec
ks
ofA
maz
on’s
Entr
yPat
tern
(1)
(2)
(3)
(4)
Var
iabl
esR
emov
eN
umSe
llers
=1
Add
Selle
rR
atin
gsR
emov
eLar
geSe
llers
Rem
ove
Pro
duct
sE
xhib
itin
gT
rend
s
Log
(Pri
ce)
0.23
7∗∗∗
0.25
4∗∗∗
0.22
2∗∗∗
0.22
1∗∗∗
(0.0
14)
(0.0
13)
(0.0
18)
(0.0
19)
Log
(Shi
ppin
g)−
0.11
0∗∗∗
−0.
100∗
∗∗
−0.
146∗
∗∗
−0.
116∗
∗∗
(0.0
21)
(0.0
19)
(0.0
26)
(0.0
25)
Log
(Sal
esR
ank)
−0.
130∗
∗∗
−0.
143∗
∗∗
−0.
149∗
∗∗
−0.
211∗
∗∗
(0.0
09)
(0.0
08)
(0.0
11)
(0.0
14)
1≤
Ave
rage
Rat
ing
<2
−0.
152
−0.
166
−0.
257
−0.
170
(0.1
55)
(0.1
49)
(0.2
10)
(0.2
66)
2≤
Ave
rage
Rat
ing
<3
0.00
80.
076
0.10
30.
204
(0.0
97)
(0.0
91)
(0.1
16)
(0.1
48)
3≤
Ave
rage
Rat
ing
<4
0.15
7∗∗∗
0.21
6∗∗∗
0.14
5∗∗
0.48
0∗∗∗
(0.0
55)
(0.0
52)
(0.0
69)
(0.0
80)
4≤
Ave
rage
Rat
ing≤
50.
192∗
∗∗
0.25
1∗∗∗
0.26
5∗∗∗
0.56
4∗∗∗
(0.0
40)
(0.0
37)
(0.0
51)
(0.0
60)
Ful
fille
dByA
maz
on−
0.09
7∗∗
−0.
082∗
∗−
0.21
4∗∗∗
−0.
249∗
∗∗
(0.0
41)
(0.0
39)
(0.0
51)
(0.0
59)
Log
(Num
Selle
rs)
0.29
2∗∗∗
0.32
2∗∗∗
0.32
3∗∗∗
0.41
1∗∗∗
(0.0
18)
(0.0
15)
(0.0
20)
(0.0
25)
Log
(Num
Pro
dByS
elle
r)0.
116∗
∗∗
0.12
1∗∗∗
0.06
8∗∗∗
0.10
9∗∗∗
(0.0
08)
(0.0
08)
(0.0
15)
(0.0
11)
3≤
Ave
rage
Selle
rRat
ing
<4
0.15
6(1
.028
)4≤
Ave
rage
Selle
rRat
ing≤
50.
184
(0.1
52)
Dum
mie
sfo
rC
ateg
orie
sY
esY
esY
esY
esO
bser
vation
s11
9,89
416
3,82
611
1,75
576
,693
Pse
udo
R-s
quar
ed0.
040.
050.
040.
07
Not
e:H
eter
oske
dast
icity-
adju
sted
stan
dard
erro
rsar
ein
pare
nthe
ses.
**si
gnifi
cant
at5%
;**
*si
gnifi
cant
at1%
.
34