Compensation and cost of conservation payments for ...
24
Compensation and cost of conservation payments for biodiversity by Bart Minten 1 Cornell University May 2003 Slash-and-burn agriculture in poor tropical countries is one of the main causes of deforestation, leading to environmental costs and to potential externality effects on lowland agricultural productivity. Under innovative environmental policies, direct conservation payments to farmers are starting to be implemented to induce them to abandon slash-and-burn agriculture as well as the use of forest resources altogether. However, appropriate compensation levels are often difficult to get at. Using a stochastic payment card format in a case study in Madagascar, it is estimated that farmers would abandon slash-and-burn agriculture and forest use for median annual compensation payments at a lower bound of around 85$ and 177$ per household respectively. As expected, the econometric analysis shows that there exists a systematic relation between poverty and the required compensation for forgone land use. While poorer households depend relatively more on forest products, they accept a lower amount to abandon slash- and-burn agriculture and forest use. Better educated and older households require higher payments. 1 Cornell Food and Nutrition Policy Program, Cornell University; Address: Ilo program, BP 6317, Antananarivo 101, Madagascar; e-mail: [email protected] . I would like to thank Jurg Brand, Tim Healy, Andy Keck, and Claude Randrianarisoa for help with the set-up of survey, helpful discussions and comments on preliminary results. The field work for this research was financed by ONE (Office National de l’Environnement), PAGE (Projet d’Appuie à la Gestion de l’Environnement) and by the Ilo program. The two last projects are financed by USAID-Madagascar. Any remaining errors are solely my responsibility.
Transcript of Compensation and cost of conservation payments for ...
Compensation and cost of conservation payments for biodiversity
by
Bart Minten1
Cornell University
May 2003
Slash-and-burn agriculture in poor tropical countries is one of the main causes of
deforestation, leading to environmental costs and to potential externality effects on
lowland agricultural productivity. Under innovative environmental policies, direct
conservation payments to farmers are starting to be implemented to induce them to
abandon slash-and-burn agriculture as well as the use of forest resources altogether.
However, appropriate compensation levels are often difficult to get at. Using a stochastic
payment card format in a case study in Madagascar, it is estimated that farmers would
abandon slash-and-burn agriculture and forest use for median annual compensation
payments at a lower bound of around 85$ and 177$ per household respectively. As
expected, the econometric analysis shows that there exists a systematic relation between
poverty and the required compensation for forgone land use. While poorer households
depend relatively more on forest products, they accept a lower amount to abandon slash-
and-burn agriculture and forest use. Better educated and older households require
higher payments.
1 Cornell Food and Nutrition Policy Program, Cornell University; Address: Ilo program, BP 6317, Antananarivo 101, Madagascar; e-mail: [email protected]. I would like to thank Jurg Brand, Tim Healy, Andy Keck, and Claude Randrianarisoa for help with the set-up of survey, helpful discussions and comments on preliminary results. The field work for this research was financed by ONE (Office National de l’Environnement), PAGE (Projet d’Appuie à la Gestion de l’Environnement) and by the Ilo program. The two last projects are financed by USAID-Madagascar. Any remaining errors are solely my responsibility.
1
1. Introduction
In most developing countries, one of the major reasons for biodiversity loss due to human
activities is slash-and-burn agriculture by local farmers (Barrett, 1999). In order to
preserve biodiversity, governments often resort to setting aside land in protected areas.
The establishment of these protected areas imposes costs on the agricultural households
surrounding the area and lead often to conflicts if not done properly or if compensation
mechanisms do not exist (Wells et al., 1990; Ghimire, 1994; Kramer et al., 1994).
Improper relations often lead to unsustainability in management of the protected area as
well as problems for sustainable resource use.
The loss of biodiversity contained in tropical forests is a cause of global concern.
However, the current costs of preservation are often not off-set by user values through for
example tourism and it seems that the costs are disproportionally borne by the people
surrounding the area rich in biodiversity. While most people would acknowledge that the
total economic benefits - taking into account non-use values (option, existence and
bequest values) could easily compensate for the imposed costs - the issue of regional and
intergenerational compensation remains to be tackled in a more satisfactory manner.
Recently, innovative policies using conservation contracts to contribute to biodiversity
conservation have been put in place in different parts of the world (Pagiola et al., 2002;
Ferraro, 2000).2 In this type of contracts, direct payments are given to resource managers
for biodiversity conservation services through protection of biodiversity-rich sites. The
benefits provided through the contract provide an incentive to the resource manager to
maintain the resource, for example recompensing direct costs incurred to maintain the
resource (e.g. surveillance) and opportunity costs from not exploiting the resource. While
the advantages and disadvantages of this type of policy are still being debated (Swart,
2 They include for example Costa Rica Environmental Services Program, Zimbabwe’s CAMPFIRE program, El Salvador Natural Resource Management Project, US’s Conservation Reserve Program, Columbia’s Carea valley and Madagascar’s ANGAP’s entry fees program.
2
2003; Ferraro and Kiss, 2003), one important issue relates to appropriate compensation
mechanisms for resource managers. 3
Madagascar is a good case study to evaluate conservation payments for biodiversity
given that some organizations are starting to practice it (Durbin, 2002) and given that the
country is characterized by a high bio-diversity and a richness of endemic species.4 As
the vast majority of Madagascar’s exceptional biodiversity is concentrated in the less than
20% of the island that remains forested (Barrett, 1999), forest degradation and
fragmentation due to human activities is considered the main threat to their unique bio-
system (Jarosz, 1993; Keck et al., 1994).5
Through better insights in valuation of resources by the local population, planners might
come up with more appropriate and cost efficient compensation levels to ensure
sustainable resource use. A survey was therefore organized with farmers that practice
slash-and-burn agriculture (“tavy”) in the forest region of Northeastern Madagascar
(Maroantsetra). A valuation questionnaire, using the contingent valuation technique
through a stochastic payment card method (see Wang and Whittington, 2000), was
implemented in order to estimate the benefits of slash-and-burn agriculture and forest
use. This type of methodology is appropriate in conducting ex ante assessments of
environmental interventions and could lead to a better targeting of mitigating efforts.
The contribution of this analysis is threefold. First, it proposes a simple and easy
replicable methodology to estimate appropriate compensation level for agricultural
households to abandon slash-and-burn agriculture and forest use. Second, it illustrates the
3 Alternative policies have tried to develop an incentive system so that farmers would intensify on their existing land (and especially their lowland) while refraining from extensive agriculture in forest area. Compensation mechanism might include improved rice seeds, better infrastructure, etc. 4 Madagascar has been recognized as one of the twelve megadiversity countries (McNeely et al., 1990). Madagascar’s unique biodiversity stems from the fact that few plants and animals were present as the island split from Africa in the Gondwana supercontinent splitup. Over 80% of its plants, 95% of its reptiles, 99% of its amphibians, and close to 100% of its primates are found nowhere else in the world (White, 1983). 5 This has been recognized by government and international agencies alike. Hence, Madagascar was one of the first countries to start with a National Environmental Action Plan and set aside significant amounts of forests in protected areas (Larson, 1994).
3
effect of different determinants in natural resource valuation by rural households in self-
subsistence settings. Third, it shows the applicability of contingent valuation techniques
in rural, little monetized, settings of developing countries where biodiversity rich sites are
often found. The structure of the paper is as follows. First, the conceptual framework is
presented. Second, the methodology and data are discussed. Third, the survey site,
household characteristics and slash-and-burn practices are described. The analysis of the
magnitude and econometric results of the valuation questions are presented in the next
section. We finish with the conclusions.
2. Conceptual Framework
The implementation of conservation contracts for biodiversity leads to a reduction of the
land available to the rural agricultural households surrounding the area. To motivate the
econometric investigation, a model of an agricultural household can be specified as such:
Where: Xa, Xf, Xl, and Xm are quantities of agricultural goods, forest goods, leisure and
market goods respectively; Pa, Pf, Pl, and Pm are prices of agricultural goods, forest
goods, leisure and market goods respectively; Y is total endogenous income; T0, Ta, Tfc,
and Tf are total area endowment, area devoted to agriculture, converted forest area, and
area under forest respectively; L0, La, Lc, Lf and Ll total time endowment, labor allocated
to agriculture, forest clearing, gathering of forest products, and leisure respectively.
0,,,,,,,,,,
)(),()),(,(
.
),,,(
0
0
,,,
≥
++≥
+++≥
++++=
≤++
ffcalmfalcaf
ffca
lcaf
fffffccaaal
mmffaa
maflLLLL
TTTXXXXLLLL
TTTTLLLLL
TITLhPTLgTLfPwLY
YXPXPXPts
XXXXUMaxclaf
4
The maximization problem states that the household allocates time in such a way that it
maximizes utility given an income constraint where income can be obtained from wage
labor, agricultural activities, forest products, and exogenous income. Labor allocation is
constrained through a time endowment and area use through an area endowment. It is
assumed that the utility function is quasi-concave with respect to each argument X.
Agricultural production is strictly increasing in land and agricultural labor and concave in
each. Additional land (Tfc) can be brought into production through clearing uncultivated
forest using just labor (i.e. slash-and-burn or “tavy”) which translates into agricultural
land by a monotone concave production technology for both land and labor. Forest can be
used to collect products from. The quantity of products collected depends on the area
under forests and the time allocated to it (in a concave and increasing manner). The
household can also hire out its time at a parametric wage rate w. Finally, exogenous
transfers (I) supplement other types of income.
Assuming an interior solution, first-order conditions and comparative statistics imply that
a loss of forest area will lead to the following6:
(i) Labor will be used in agriculture and collection in the remaining forests up to
the point where its marginal return equals the village level wage rate. A loss
of forest area would mean that more labor would be devoted to agricultural
production on existing land, to collection of forest products on still accessible
forested land, or to wage labor. Higher wages through growth in the rest of the
economy (f.ex. created by tourists) would be associated with less agricultural
and forest activities.
(ii) Higher initial endowments of land, in terms of land quality or irrigation that
increase the marginal productivity of existing land, would lead to less demand
for forested areas. This applies also to technical assistance to the degree that it
allows farmers to increase the productivity of their preexisting land
endowment rather than to expand production onto hithertho forested areas. To
6 The problem can be solved explicitly if one assumes a specific functional form. To derive closed form solutions, one could use standard Cobb-Douglas agricultural production and forest production functions.
5
the extent that policies could lead to a shift of existing production function,
part of the income loss could be off-set.
(iii) Investment in land-intensification technologies will be undertaken only if the
higher agricultural productivity ensures that the effect is sufficient to offset
the associated loss in wages or forest income.
Hence, the likely effect of the reduction in available land can be summarized as follows:
a) Loss in income from forest products due to loss of forest land; b) Loss in agricultural
income due to loss in agricultural land; c) Adjustment to losses through increases in
exogenous income and through labor re-allocation to land intensification or to off-farm
labor. Given this is a land constrained solution, a contingent valuation question was
formulated to try to evaluate the willingness-to-accept compensation of the rural
households after land use losses. The willingness to accept (WTA) compensation for
foregoing land use is the quantity of money which, if given to the individual after the loss
of land, would leave him or her at the same level of utility as if no loss of land had
occurred. This can be written in terms of the indirect utility function v which describes
the maximum utility achievable at given prices and income (Varian, 1992):
v(P,Y1) = v(P, Y0+WTA)
where Y0 and Y1 is income with and without slash-and-burn agriculture respectively.
3. Data and methodology
The empirical analysis is based on primary data that were gathered in Madagascar in a
collaborative effort between ONE (Office National de l’Environnement), the Ilo program
of Cornell University, and the PAGE (Projet d’Appuie à la Gestion de l’Environnement)
project run by the International Resources Group. A survey was organized in November
2001 with 120 farmers that practice slash-and-burn agriculture in northeastern
Madagascar, in the area northwest of the city Maroantsetra. The farmers were randomly
selected within a census of 52 watersheds. The area is renowned for its high and rather
untouched forest resources. However, increasing population pressure leads people to
encroach into the forest.
6
The survey consisted of two parts. First, it collected data on demographic variables,
income generating activities (agricultural and non-agricultural), slash-and-burn
agriculture, and wealth (including land and livestock possession, buyer status of rice,
length of lean period, and access to credit). This information allows us to have insights in
the economic situation of rural agricultural households in the area. Then, two contingent
valuation questions were asked similar to the one used by Shyamsundar and Kramer
(1996). The valuation questions were formulated in the following way:
“Suppose that you are compensated in rice not to use the forest. In a first situation, you can transform the
forest for agricultural production. In this case, you will obtain rice, maize or other agricultural production,
but you will have lost the benefits of the existence of the forest. In a second situation, access to the forest
will be limited: you will not be allowed to do slash-and-burn agriculture but you will be allowed to use
forest products for wood, medicinal plants, hunting, …The forest might also reduce flooding of ricefields in
the lowlands. Are you willing to give up the practice of slash-and-burn agriculture for a compensation?
(Yes/No) If yes, how much is the quantity of sobika of rice every year that you would need to give up slash-
and-burn agriculture?”
Instead of the widely used and recommended dichotomous choice valuation question
(Arrow et al., 1993), a stochastic payment card method (Wang and Whittington, 2000)
was implemented for different reasons: (1) Given logistical constraints, a relatively small
sample had to be relied upon. The payment card format gives the benefit of having extra
information beyond the yes/no question (For papers that discuss the benefits of
information beyond dichomotous choices, see Blamey et al. (1999) and Ready et al.
(2001)). (2) Whittington (1998) shows that a main problem in contingent valuation
studies is that the range that is offered is often not large enough to allow for a robust
estimation of the valuation function. Moreover, as we had little a priori knowledge about
the valuation function, we had to make sure that extreme levels were included in the bids
on the payment card. Given the small sample, this could not have been achieved in the
dichotomous choice variable format. (3) Uncertainty (for example on the future price
evolution of agricultural and wood products) and imperfect information (household chief
had to answer immediately during the interview and could not consult with family
members and/or village leaders) is allowed for in this format.
7
The stochastic payment card system was set up as follows. First, an open-ended valuation
question was asked on the amount of sobika of rice that they had to be offered ‘for sure’
to abandon slash-and-burn agriculture. A sobika is a local basket that contains about 12
kgs of rice. This type of value indication was preferred to local currency as the local
economy is largely non-monetized. It was hoped that the open-ended question would
reduce the starting point bias. Then, in follow-up questions, respondents were shown
different levels on the payment card, ranging from 1 to 1000 sobika. References on the
payment card were made to the value of locally traded goods such as a bicycle, radio, etc.
For every level on the card, the interviewees had to respond to the proposition to abandon
slash-and-burn agriculture with: 1. Accept to pay for sure; 2. A little bit in doubt but
would say yes; 3. Not yes or no, do not know; 4. A little bit in doubt but would say no; 5.
Will not pay for sure. In a second valuation question, respondents were asked to evaluate
the same situation as the one described above but in this second scenario, farmers were
not allowed to use any products of the forest anymore, i.e. they had to abandon forest use
all together.
In the set-up of the stochastic payment card format, the Willingness to Accept (WTA) is
manifested through a variable Ii such that:
Ii=1 if WTAi < ti and
Ii=0 if ti ≤ WTAi
where ti is the bid offered to the household i. The overall valuation curve allows us to
deduct median and mean WTA for the population as a whole. The probability of a
response to a bid ti when the household has a vector of covariates X is given by:
prob(II=1|X) = Φ(Xi β-αti)
where Φ denotes the cumulative standard normal distribution and β and α are parameters.
The vector of covariates used in the econometric analysis includes variables on household
composition, background, wealth and use of upland agriculture.
4. Description survey site and household activities
8
The communities in the northeastern rain forests in Madagascar are rural and almost
exclusively agricultural. Almost all of the households report that agriculture is their main
profession. Average size of the household is six members (Table 1). Education levels are
low: on average, the head of the household has only studied for a period of three years.
22 % of the heads of households state they have never been to school. 8% of the
households are female-headed and the average age of the head of household is 43 years.
Most of the households in the sample possess lowland as well as upland plots. The
average area of both types of land is equal, around 73 ares. Hence, the households in the
area do not depend exclusively on slash-and-burn agriculture for their income. In total,
they own 1.5 ha of agricultural land, significantly above the national average
(Randrianarisoa and Minten, 2001). On top, the average household reports to own almost
60 ares of savoka forest and 56 ares of primary forest. Other types of wealth include
livestock. A household owns on average 1 zebu. However, livestock ownership is
unevenly distributed as 70% of the households report not to own any livestock at all.
Total rice - the main staple - production per household was estimated to be around 910 kg
last year, i.e. around 150 kg per capita. This amounts to average rice yields of 1.3 ton per
hectare, significantly below the averages that were reported by the rice farmers in the
lowlands (Brand et al., 2002). 76% of the households report that this rice production is
not sufficient and that they have to buy rice during the lean period or rely on other food
for subsistence. The reported length of the lean period, when households reduce
consumption levels compared to the rest of the year, is estimated to be almost four
months.
The composition of the monetary income of the households shows that income from rice
is less important. Most of the rice that is produced is used towards own consumption.
While overall monetary annual income is evaluated at 1.4 M Fmg ($200) per household,
income from rice is only 0.07 M Fmg, i.e. less than 5% of the total. Income from tavy
products makes up half of the monetary income of the households (0.7M Fmg). While the
total area of upland cultivated is equal to the area of lowland, the monetary income from

9
production on uplands is significantly higher than for lowlands, indicating the presence of
higher margin crops or more cash crops on the uplands than on lowlands.
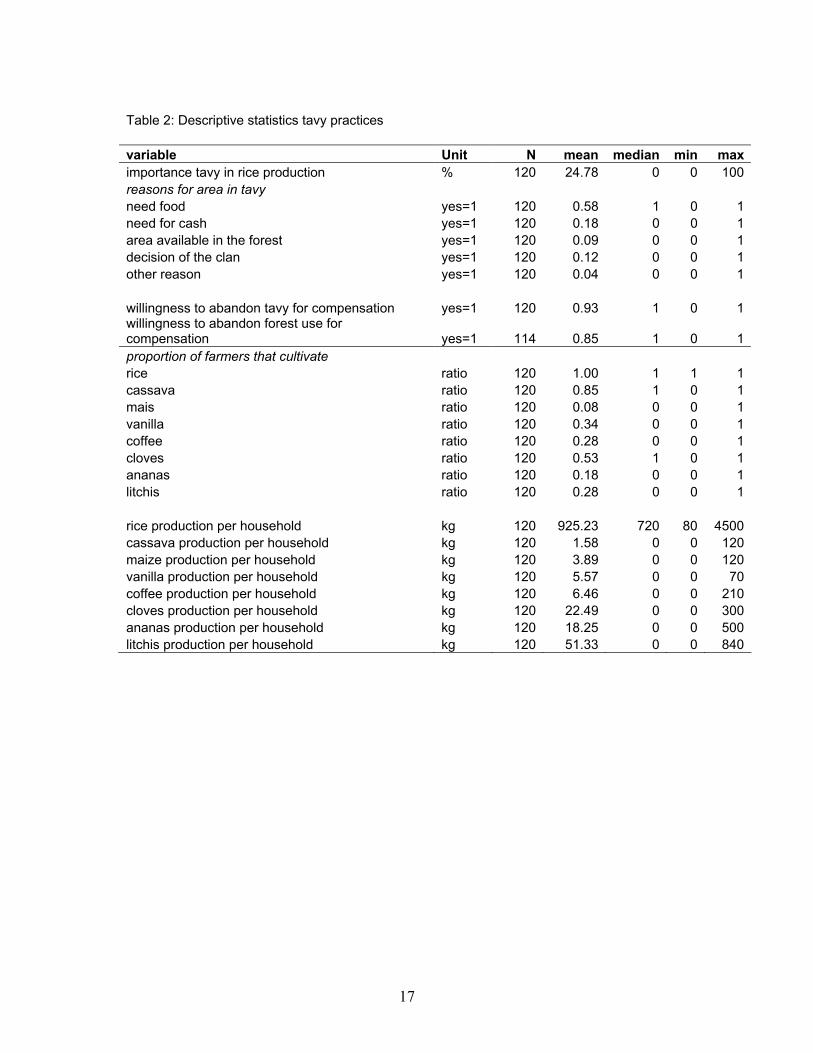
Table 2 shows the importance of the different crops in the area. The importance of cash
crops is striking. While rice and cassava are cultivated by almost all the household, a
significant portion of them also report to produce cash crops such as vanilla, coffee,
cloves, pineapple, or litchis. This importance of cash crops in livelihood is typical for the
Eastern forest area in Madagascar. Monetary income from forest products is shown to be
almost twice as high as for income from rice. Overall, quite some income diversification
is noticed among these households.
In further analysis, the length of the lean period is used as an indication of the poverty
level of the household (see Barrett and Dorosh, 1996). When poverty terciles are used to
look at income composition, some revealing trends appear. Richer households have more
lowland and upland and sell relatively more rice and tavy products. Poorer households
rely relatively more on the sales of forest products.7 This seems to confirm the hypothesis
of Freudenberger (1999) that it is the richer households that engage relatively more in
tavy agriculture than the poorer ones.8
Table 2 further presents some statistics on tavy practices in the area. The importance of
tavy in rice production is relatively minor. The stated reason for tavy production is
mainly as a need to obtain food (58%). Anecdotic evidence suggests that households
often rely on tavy rice for their consumption in the lean period as the production period is
different than the one for lowland rice. Only 18% of the households mention that they
practice tavy for need of cash. When households were asked if they were willing to give
up tavy for compensation, 93% agreed that they were willing to do so. For forest use,
only 85% accepted. Hence, when conservation payments would be used, it seems that a
small group of people would be unwilling to accept those and change their lifestyle
7 Kerr (2002) presents similar findings in India: livelihoods of the landless poor often depend on gathering of products from the forest. 8 Freudenberger (1999) looked at these issues in the area of Fianarantsoa. She mentions that the richer households do tavy to establish property rights on particular fields.
10
accordingly. No major differences in socio-economic characteristics were detected for the
protest respondents.
The previous section gives us a sense of the socio-economic situation of the households
that live in the area. The agricultural and income statistics illustrate that setting land aside
will clearly impose costs on the surrounding population given the importance of tavy and
forest use for livelihood. In a next stage, it is tried to attach monetary values to the loss of
forests or land as expressed by the household itself. To this, we now turn.
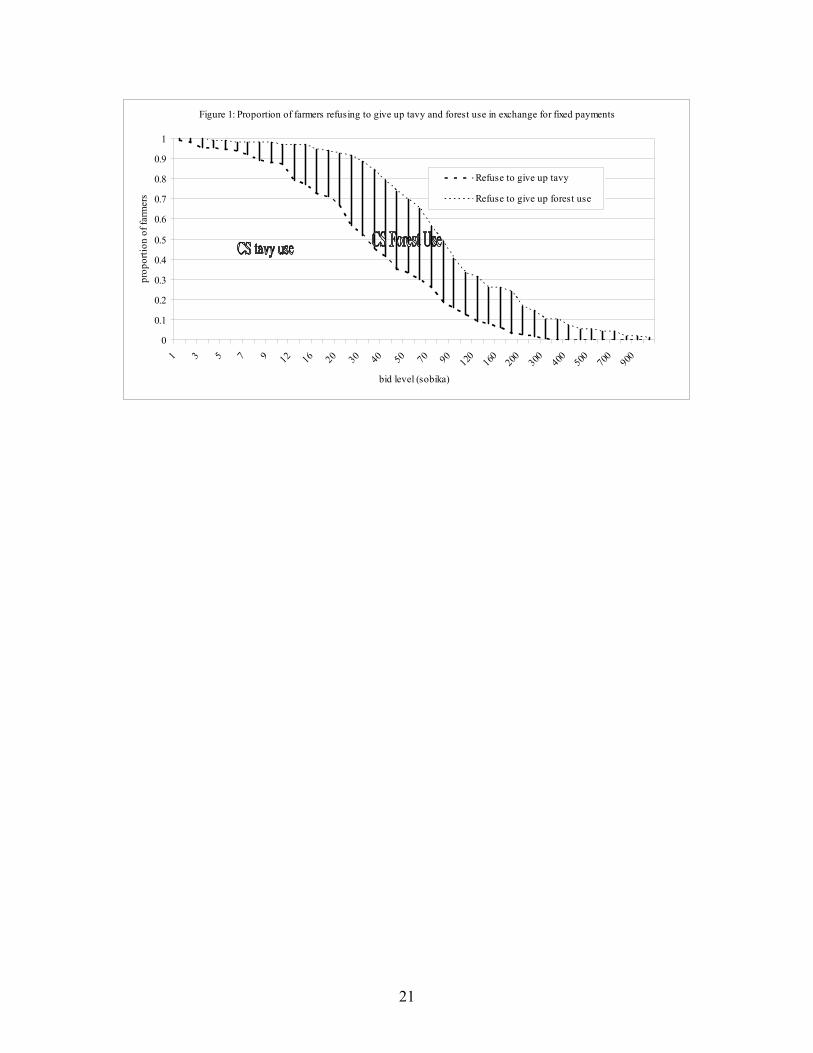
5. Willingness-To-Accept analysis
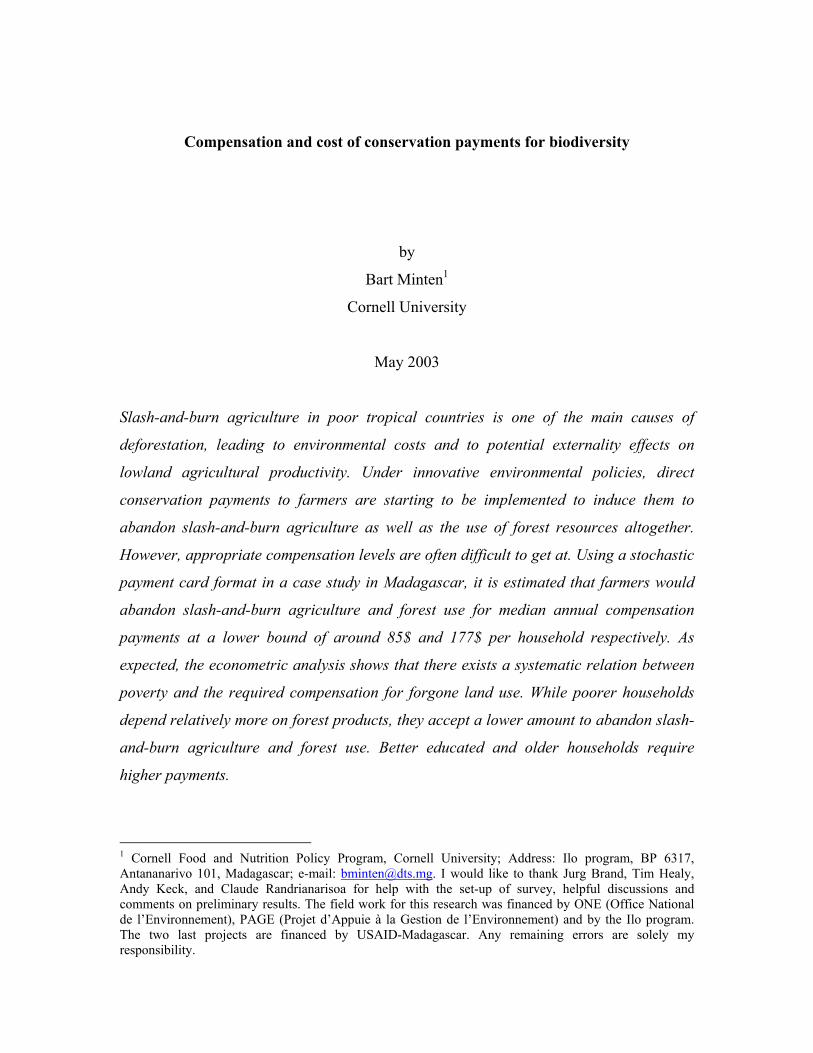
The results of the reported valuation to abandon slash-and-burn agriculture as well as
forest use are shown in Figure 1. The graph shows the upper-bound level at which a
specific proportion of farmers refuse (“do not accept for sure”) to give up tavy and forest
use. The median level of the upper bound at which tavy farmers would still refuse to give
up tavy use is 32 sobika, i.e. around 380 kgs of paddy rice and equivalent to 59$. This
indicates that if a vote would be held on that offer (or any lower offer for that matter) for
the farming population as a whole, at least 50% of the population would refuse to accept.
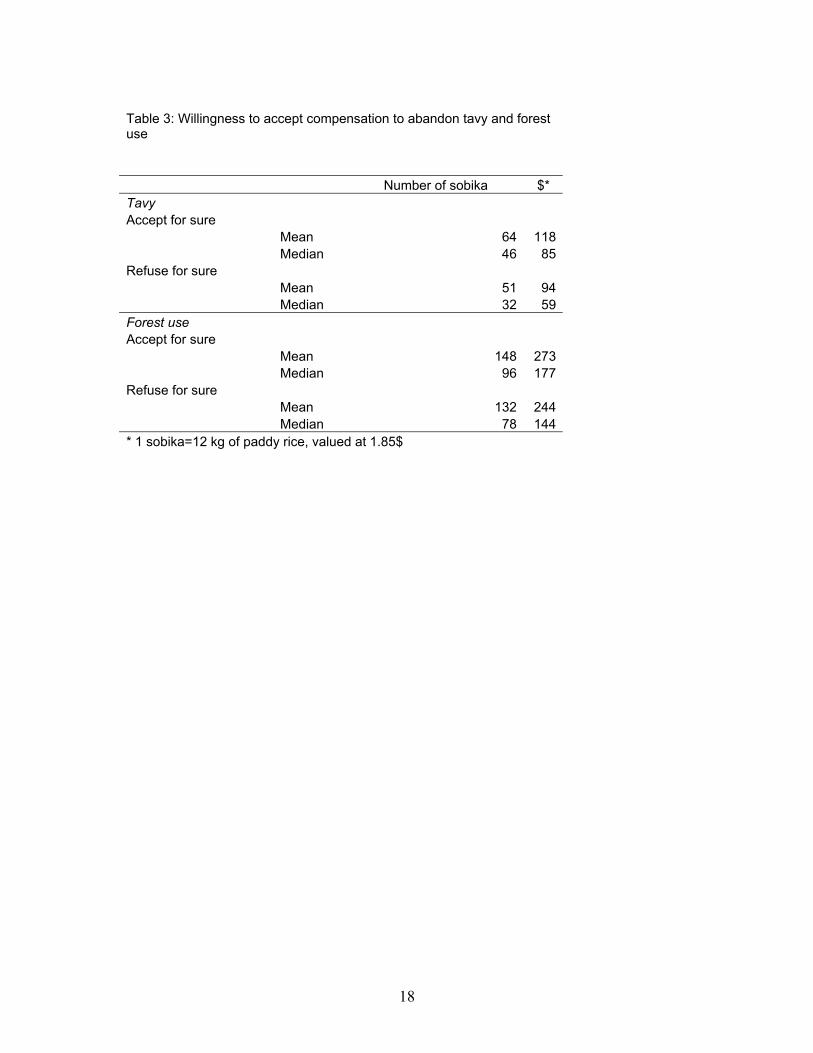
Table 3 indicates the results on the median and mean (area under the curve and calculated
through linear approximation) for the refusal and the acceptance level to give up tavy use.
The median acceptance level (“do accept for sure”) is evaluated at 46 sobikas (=85$).
The mean is evaluated slightly higher, i.e. at 118$. It is striking that the mean required
compensation is close to the reported monetary income from tavy products, as reported in
Table 1 (119$).9 This might confirm the validity of the applied WTA format.
As expected, the valuation function for forest use is dominant over the whole domain to
the tavy use valuation function. The median WTA to abandon forest use is evaluated at
96 sobika of paddy rice (177$). The large difference between the tavy use and forest use
numbers - higher than the actual income of forest products - might illustrate the 9 These results are significantly below the estimates by Ferraro (1994) based on cash-flow analysis for the Ranomafana area and by Shyamsundar and Kramer (1996) based on similar contingent valuation question for the Mantadia park in Madagascar. This might be due to the higher poverty in the Maroantsetra area.
11
substitution possibilities for remunerative activities of hillside agriculture by other
activities. These substitution possibilities seem to exist less for forest products. The large
difference might also indicate the non-monetary benefits of forest use as the difference is
significantly larger than the monetary income out of forest use found in Table 1.
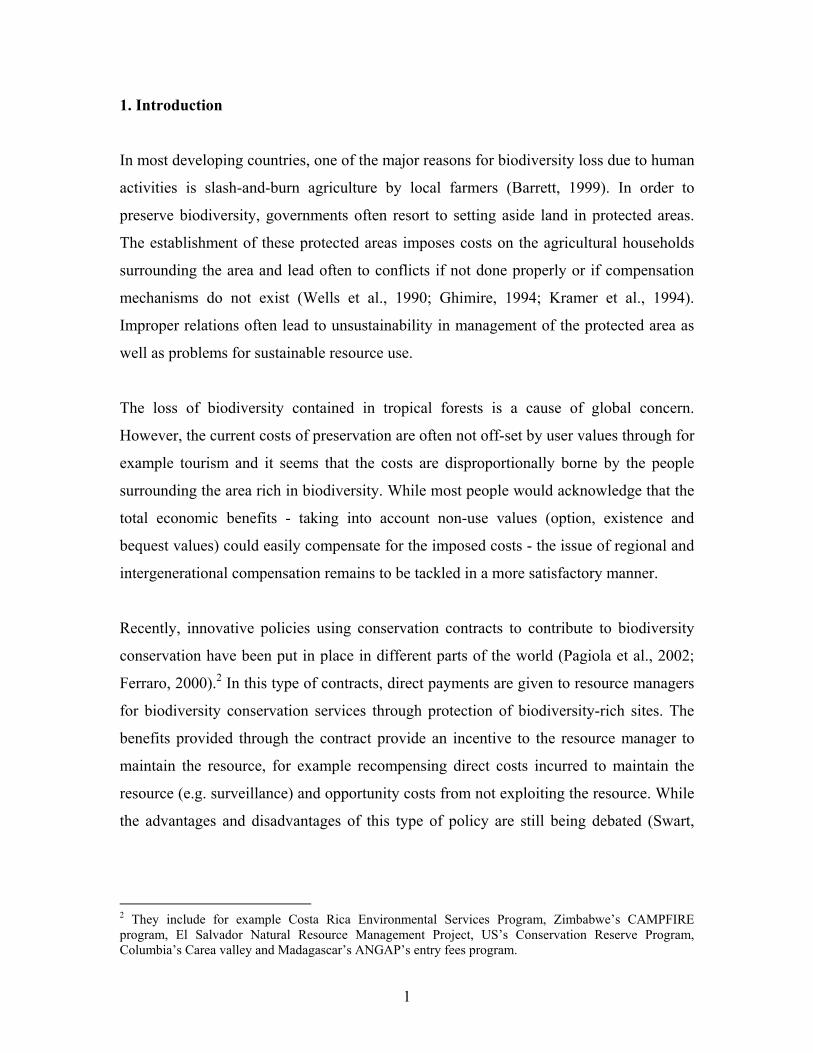
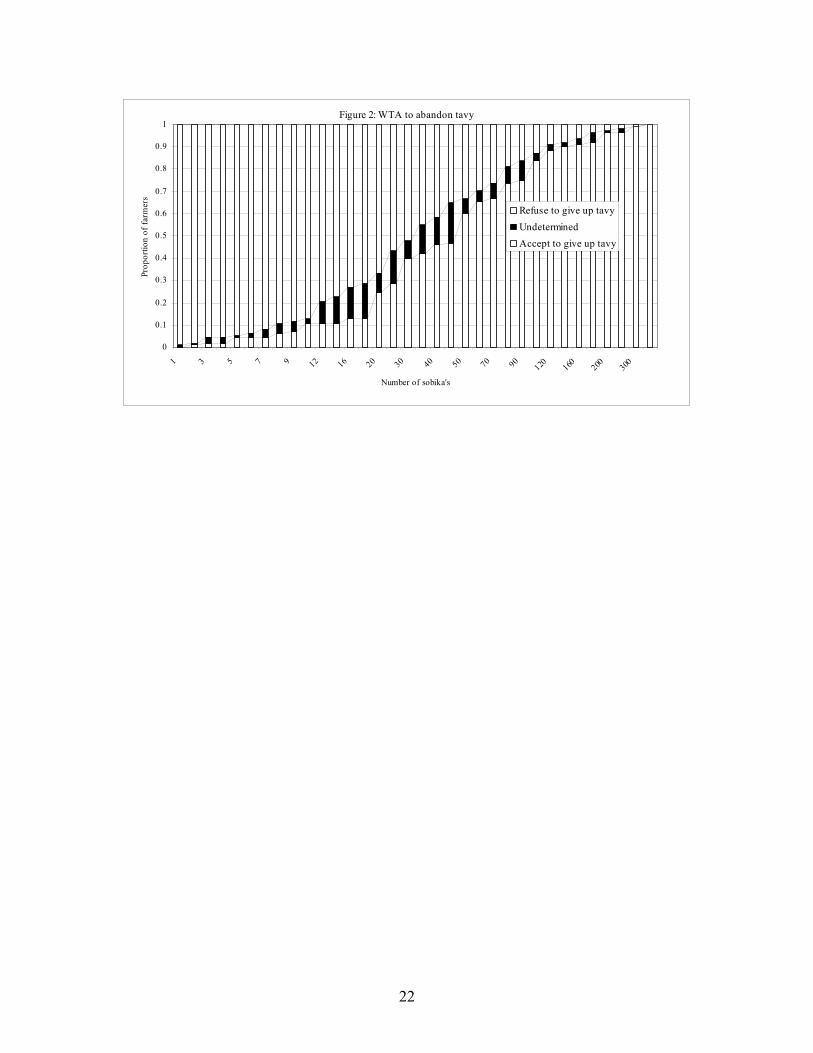
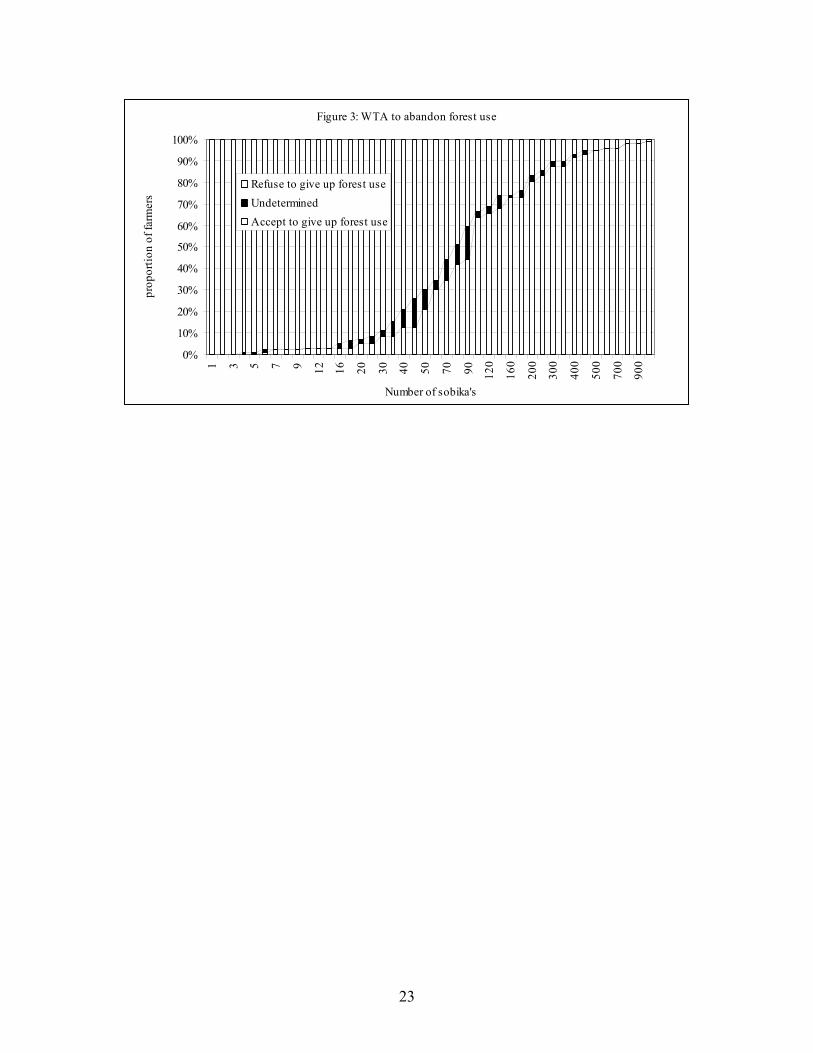
Figures 2 and 3 show the acceptance and refusal curve for tavy and forest use
respectively, as well as the range of bids where the respondents expressed uncertainty. As
expected, the number of farmers that were uncertain about accepting or refusing the offer
is largest in the middle of the graph. For some bids, the uncertainty domain contains up to
15% of the farmers. This high number indicates the importance to allow farmers to
convey information beyond the simple yes/no format as has been shown by other recent
studies (Blamey et al., 1999; Ready et al., 2001).
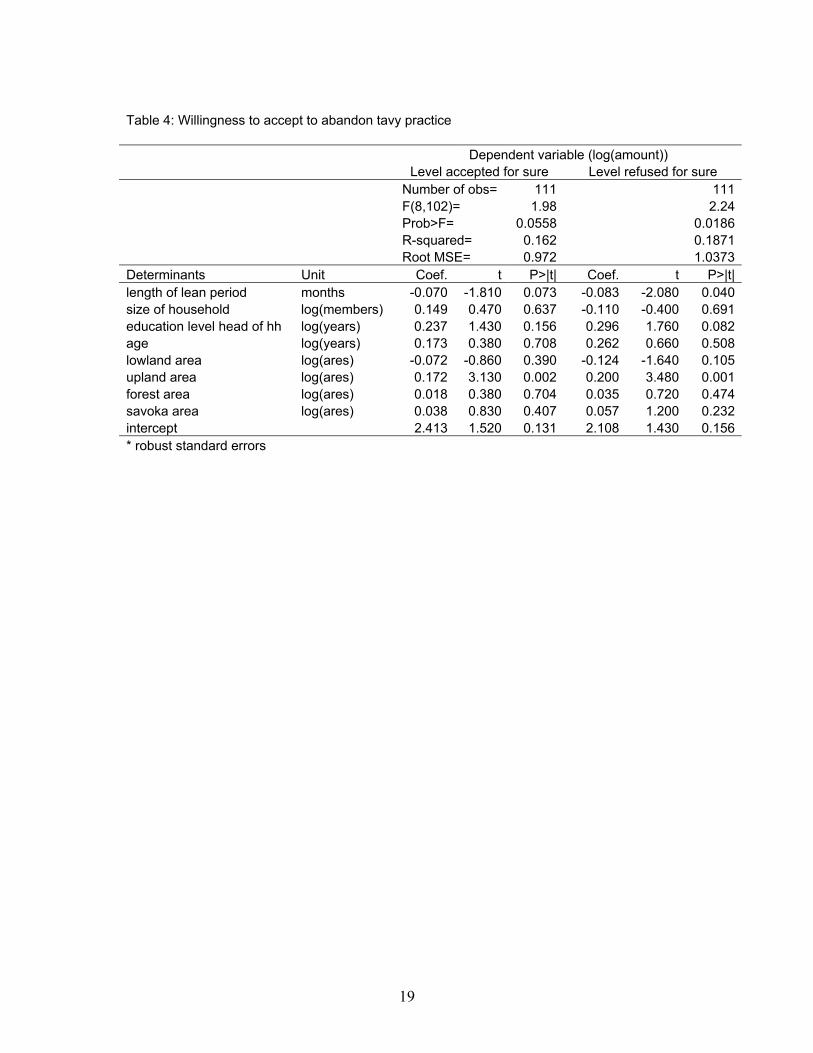
Next, regressions were run to gain insights in the determinants of the valuation numbers.
Four types of regressions were estimated. Dependent variables were compensation to
give up tavy and forest use. For each of these variables, the minimum amount that they
would be willing to accept for sure and the maximum amount that they would refuse for
sure as compensation were used as monetary measures. Explanatory variables were
household characteristics and land areas. It was assumed that a higher area in upland or in
forest would lead to a higher demand for compensation.
The results of this contingent valuation regression are reported in Tables 4 and 5. The
models have an explanatory power between 16% and 25% indicating that the elicited bids
are non-randomly distributed. Age is shown to increase the compensation level for forest
use. Older people might be less reluctant to accept the compensation as they usually have
laid the biggest claim on forest land and they feel that they should be compensated the
most. Moreover, older residents prefer to engage in tavy because it is less labor intensive
and less strenuous as for example lowland rice paddy works (Ferraro, 1994).
Education is also shown to increase the required compensation level, for forest as well as
tavy use. It might be that more educated households who have a higher reservation wage
12
like to put more effort in off-farm earnings possibilities and hence, prefer to do
agriculture in a more extensive manner.10 Hence, they would suffer more form the taking
away of the land than the less educated. Other variables turn out not to be significant such
as size of the household and gender of the head of household. While females seem to use
different forest products than men, they do suffer equally from the loss of the forest use.
A significant determinant of the compensation level is the length of the lean period, an
indicator of poverty in the area. This holds for forest as well as tavy use. Households that
experience a lean period that is one month longer, are willing to reduce required
compensation levels for tavy use by 8% and for forest use by 10%. Richer households
rely relatively more on tavy use than poorer households and will therefore ask more
compensation. However, while poorer households use relatively more forest products, the
lack of liquidity seems also to lead to their lower willingness to accept level.
Surprisingly, land area in possession variables are, overall, no major determinants of
compensation levels. Households that possess more lowland are willing to accept less for
compensation. It seems that these households are less dependent on tavy and forest for
their livelihood and might be able to better live without it. However, the coefficients are
not significant at conventional statistical levels. As expected, upland area is a significant
determinant of WTA for tavy use but its coefficient is significantly less than one. This
might be an indication that not all upland production is tavy production. Forest area in
possession of the household is almost significant at the 10% level in the compensation
level regression to abandon forest use. However, its coefficient is small, indicating that
forest benefits do not increase proportionally with size. The overall low or insignificant
coefficient might reflect the fact that forest products might not originate from private held
land but from open access or community access regulated forests.
10 Randrianarison (2003) shows, based on the national household survey of Madagascar of 2001, how the importance of off-farm income in rural areas in Madagascar increases significantly with education and income levels.
13
6. Conclusions
The establishment of protected areas seems a straightforward way to sustain endangered
forest resources rich in biodiversity. However, this is often not the case as shown by
numerous conflicts between surrounding population and protected area management.
Therefore it is useful to have insights in behavior of people that threaten the forests to
ensure sustainability and manage conflicts. Recently, direct conservation payments for
biodiversity have been put in place in different parts of the world. Insights in behavior of
the surrounding population might lead to appropriate compensation mechanisms and
therefore help to achieve sustainable management and resource use. This is studied in the
case of Madagascar.
The results of the analysis of primary data show that the estimated median benefits of
slash-and-burn agriculture (‘tavy’) and of forest use are 85$ and 177$ per household
respectively. While lowland and upland are equally important in surface, tavy products
makes up half of the income of the farmers in the sample indicating its relative
importance for cash income. Monetary income from forest products is twice as high as
income from rice products, indicating the high dependence on forest products for the
livelihood of the local population. Poorer households use relatively more forest products.
Regression results suggest that the imposed costs seem to differ non-randomly among
households. Poorer households are willing to accept less while older and more educated
households require more.
This research shows how valuation of natural resources can be done through the use of
contingent valuation questions in high self-subsistence developing country setting. This
type of questions leads to insights, could improve conservation efforts and could help in
the setting of appropriate compensation levels for conservation payments for biodiversity.
However, as the analysis focuses solely on the “victims” of the setting land aside
program, it does not deal with the financial sustainability issue. While the bequest or
existence value of the tropical forest seems extremely high, its domestic use value is still
low and it seems to be the case that the cost of setting aside land would be
14
disproportional borne by the local people. Given that it can be argued that the type of
biodiversity found at tropical forest in Madagascar is a public international good to be
protected for current and future generations, it seems that the international community
has to continue to be involved to ascertain the sustainability of protected areas.
References
Arrow, K., Solow, P., Portney, P. Leamer, E.E., Radner, R., Schuman, K., Report of the NOAA Panel on contingent valuation, NOAA, 1993 Barrett, C.B., Stochastic Food Prices and Slash-and-Burn Agriculture, Environment and Development Economics, vol. 4, no. 2, 1999, pp. 161-176 Barrett, C.B., Dorosh, P., Farmers’ welfare and changing food prices: Nonparametric evidence from rice in Madagascar, American Journal of Agricultural Economics, Vol. 78, 1996, pp. 656-669 Blamey, R.K., Bennett, J.W., Morrison, M.D., Yea-Saying in Contingent Valuation Studies, Land Economics, February 1999, 75(1), pp. 126-141 Brand, J., Minten, B., Randrianarisoa, C., Etude d’impact de la deforestation sur la riziculture irriguée, Cahier d’études et de recherches en économie et sciences sociales, No. 6, December 2002, FOFIFA, Antananarivo Durbin, J., The Potential of Conservation Contracts to Contribute to Biodiversity Conservation in Madagascar, 2001, mimeo Ferraro, P., Constructing markets for ecosystem services: limitations of development interventions and a role for conservation performance payments, presented at “Constituting the Commons: Crafting Sustainable Commons in the New Millenium”, the 8th Conference of the International Association for the Study of Common Property, Bloomington, Indiana, USA, June, 2000 Ferraro, P., Kiss, A., Response, Science, vol. 299, March 28th, 2003, pp. 1981-1982 Freudenberger, K., 1999, Flight to the forest: a study of community and household resource management in the commune of Ikongo, Madagascar, LDI, mimeo Ghimire, K.B., Parks and People: Livelihood Issues in National Parks Management in Thailand and Madagascar, Development and Change, 25(1), 1994, pp. 195-229 Jarosz, L., Defining and explaining tropical deforestation: shifting cultivation and population growth in Colonial Madagascar (1896-1940), Economic Geography, Vol. 69(4), 1993, pp. 366-379 Keck, A., Sharma, N.P., Feder, G., Population Growth, Shifting Cultivation, and Unsustainable Agricultural Development: A Case Study from Madagascar, World Bank Discussion Paper, Africa Technical Department Series, No. 234, World Bank, Washington DC Kerr, J. Watershed development, environmental services and poverty alleviation in India, World Development, 30(8), 2002, pp. 1387-1400
15
Kramer, R., Sharma, N., Shyamsundar, P., Munasinghe, M., Cost and Compensation Issues in Protecting Tropical Rainforests: Case Study in Madagascar, Environment Department Working Paper No. 62, World Bank, Washington DC, 1994 Larson, B.A., Changing the Economics of Environmental Degradation in Madagascar: Lessons from the National Environmental Action Plan Process, World Development, 1994, Vol. 22 (5), pp. 671-689 McNeely, J.A., Miller, K.R., Reid, W.V., Millenmeier, R.A., Weiner, T.B., Conserving the World’s Biological Diversity, IUCN-WRI-CI-WWF/US-Word Bank, 1990, 193 p. Pagiola, S., Bishop, J., Landell-Mills, N., Setting Forest Environmental Services: Market-based Mechanisms for Conservation and Development, 2002, Earthscan, London Ready, R.C., Navrud, S., Dubourg, W.R., How do respondents with uncertain willingness to pay answer contingent valuation questions, Land Economics, August 2001, vol. 77, no. 3, pp. 315-326 Randrianarisoa, C., Minten, B., Agricultural production, agricultural land and rural poverty in Madagascar, World Bank Technical Paper, Washington DC, forthcoming Randrianarison, L., Revenu extra-agricole et pauvreté, Paper presented during the conference “Agriculture et pauvreté à Madagascar”, FOFIFA/Cornell University, March, 2003, Antananarivo Shyamsundar, P., Kramer, R.A., Tropical Forest Protection: An Empirical Analysis of the Costs Borne by Local People, Journal of Environmental Economics and Management, Vol. 31, 1996, pp. 129-144 Swart, J.A.A., Will direct payments help biodiversity?, Science, vol. 299, March 28th, 2003, pp. 1981 Varian, H.R., Microeconomic Analysis, W.W. Norton & Co., New York, 1992 Wells, M., Brandon, K., Hannah., L., People and Parks: Linking Protected Area Management with Local People, World Bank, World Wildlife Fund and USAID, Washington DC, 1990 White, F., The Vegetation of Africa: A descriptive memoir, UNESCO, Paris, 1993 Whittington, D., Chapter 16: Environmental Issues, in Eds. Grosh, M., Glewwe, P., Designing Household Survey Questionnaires for Developing Countries: Lessons from Ten Years of LSMS Experience, World Bank, 1998

16
Table 1: Descriptive statistics of household variables variable Unit N mean median min max
size of household number of people 120 6.00 6 2 14
education level head of hh years 120 3.22 3 0 12gender man=1 120 0.92 1 0 1age years 120 42.47 40 18 81lowland ares 120 73.93 40 0 1500upland ares 120 73.52 50 0 1000savoka ares 120 59.49 40 0 500primary forest ares 120 55.83 0 0 600zebus number 120 0.91 0 0 9zebus de trait number 120 0.62 0 0 6income of rice 1000 Fmg 120 63.90 0 0 1296income tavy products 1000 Fmg 120 772.64 100 0 10000income non-tavy agricultural products 1000 Fmg 120 193.63 0 0 4500income livestock 1000 Fmg 120 48.25 0 0 4000income artisanat 1000 Fmg 120 2.17 0 0 100income forest products 1000 Fmg 120 114.50 0 0 6000income wage labor 1000 Fmg 120 99.84 0 0 1260other income 1000 Fmg 120 134.17 0 0 3200total rice production kg 120 910.83 710 80 4500rice production is enough yes=1 120 0.24 0 0 1
length of lean period number of months 120 3.72 3 0 12
potential access to credit 1000 Fmg 120 414.21 100 0 16000
17
Table 2: Descriptive statistics tavy practices variable Unit N mean median min maximportance tavy in rice production % 120 24.78 0 0 100reasons for area in tavy need food yes=1 120 0.58 1 0 1need for cash yes=1 120 0.18 0 0 1area available in the forest yes=1 120 0.09 0 0 1decision of the clan yes=1 120 0.12 0 0 1other reason yes=1 120 0.04 0 0 1 willingness to abandon tavy for compensation yes=1 120 0.93 1 0 1willingness to abandon forest use for compensation yes=1 114 0.85 1 0 1proportion of farmers that cultivate rice ratio 120 1.00 1 1 1cassava ratio 120 0.85 1 0 1mais ratio 120 0.08 0 0 1vanilla ratio 120 0.34 0 0 1coffee ratio 120 0.28 0 0 1cloves ratio 120 0.53 1 0 1ananas ratio 120 0.18 0 0 1litchis ratio 120 0.28 0 0 1 rice production per household kg 120 925.23 720 80 4500cassava production per household kg 120 1.58 0 0 120maize production per household kg 120 3.89 0 0 120vanilla production per household kg 120 5.57 0 0 70coffee production per household kg 120 6.46 0 0 210cloves production per household kg 120 22.49 0 0 300ananas production per household kg 120 18.25 0 0 500litchis production per household kg 120 51.33 0 0 840
18
Table 3: Willingness to accept compensation to abandon tavy and forest use Number of sobika $* Tavy Accept for sure Mean 64 118 Median 46 85Refuse for sure Mean 51 94 Median 32 59Forest use Accept for sure Mean 148 273 Median 96 177Refuse for sure Mean 132 244 Median 78 144* 1 sobika=12 kg of paddy rice, valued at 1.85$
19
Table 4: Willingness to accept to abandon tavy practice Dependent variable (log(amount)) Level accepted for sure Level refused for sure Number of obs= 111 111 F(8,102)= 1.98 2.24 Prob>F= 0.0558 0.0186 R-squared= 0.162 0.1871 Root MSE= 0.972 1.0373Determinants Unit Coef. t P>|t| Coef. t P>|t|length of lean period months -0.070 -1.810 0.073 -0.083 -2.080 0.040size of household log(members) 0.149 0.470 0.637 -0.110 -0.400 0.691education level head of hh log(years) 0.237 1.430 0.156 0.296 1.760 0.082age log(years) 0.173 0.380 0.708 0.262 0.660 0.508lowland area log(ares) -0.072 -0.860 0.390 -0.124 -1.640 0.105upland area log(ares) 0.172 3.130 0.002 0.200 3.480 0.001forest area log(ares) 0.018 0.380 0.704 0.035 0.720 0.474savoka area log(ares) 0.038 0.830 0.407 0.057 1.200 0.232intercept 2.413 1.520 0.131 2.108 1.430 0.156* robust standard errors
20
Table 5: Willingness to accept to abandon forest use Dependent variable (log(amount)) Level accepted for sure Level refused for sure Number of obs= 96 96 F(8,102)= 3.78 3.48 Prob>F= 0.0008 0.0016 R-squared= 0.2588 0.2515 Root MSE= 0.8875 0.9362Determinants Unit Coef. t P>|t| Coef. t P>|t|length of lean period months -0.101 -3.290 0.001 -0.102 -3.070 0.003size of household log(members) -0.178 -0.720 0.474 -0.168 -0.660 0.514education level head of hh log(years) 0.441 2.660 0.009 0.462 2.760 0.007age log(years) 0.822 2.090 0.039 0.895 2.210 0.030lowland area log(ares) -0.083 -1.110 0.270 -0.098 -1.250 0.215upland area log(ares) 0.076 1.160 0.250 0.099 1.470 0.145forest area log(ares) 0.062 1.650 0.102 0.040 0.920 0.358savoka area log(ares) -0.011 -0.240 0.808 -0.016 -0.310 0.758intercept 1.723 1.110 0.268 1.175 0.740 0.461* robust standard errors
21
Figure 1: Proportion of farmers refusing to give up tavy and forest use in exchange for fixed payments
0
0.1
0.2
0.3
0.4
0.5
0.6
0.7
0.8
0.9
1
1 3 5 7 9 12 16 20 30 40 50 70 90120 160 20
0300 400 500 700 900
bid level (sobika)
prop
ortio
n of
farm
ers
Refuse to give up tavy
Refuse to give up forest use
22
Figure 2: WTA to abandon tavy
0
0.1
0.2
0.3
0.4
0.5
0.6
0.7
0.8
0.9
1
1 3 5 7 9 12 16 20 30 40 50 70 90120 160 200 300
Number of sobika's
Prop
ortio
n of
farm
ers
Refuse to give up tavyUndeterminedAccept to give up tavy
23
Figure 3: WTA to abandon forest use
0%
10%
20%
30%
40%
50%
60%
70%
80%
90%
100%
1 3 5 7 9 12 16 20 30 40 50 70 90 120
160
200
300
400
500
700
900
Number of sobika's
prop
ortio
n of
farm
ers
Refuse to give up forest useUndeterminedAccept to give up forest use


![ACOs, GLOBAL PAYMENTS AND CAPITATION REIMBURSEMENT · PDF file1 Chapter 17 ACOs, GLOBAL PAYMENTS AND CAPITATION REIMBURSEMENT [Eliminating Fee-For-Service Physician Compensation] David](https://static.fdocuments.in/doc/165x107/5aa95fd37f8b9a72188ccbbd/acos-global-payments-and-capitation-reimbursement-chapter-17-acos-global-payments.jpg)