Compendium of Resource Partner Contributions - … · 4 TOTAL REVENUE BY TYPE OF FUNDING, 2017 The...
35
Compendium of Resource Partner Contributions 2017
Transcript of Compendium of Resource Partner Contributions - … · 4 TOTAL REVENUE BY TYPE OF FUNDING, 2017 The...

UNICEF COMPENDIUM OF RESOURCE PARTNER CONTRIBUTIONS 2017 i
Compendium of Resource Partner Contributions 2017

Cover Image: Leda makeshift settlement, Bangladesh; © UNICEF/UN0158149/Sujan
Caption: A Rohingya refugee girl carries an empty water pot near a water point at the Leda makeshift settlement for Rohingya refugees in Cox’s Bazar, Bangladesh, December 2017. In Bangladesh, UNICEF’s response to refugee children is providing them with psychosocial support in mobile child friendly spaces as well as protection, nutrition, health, water and sanitation support.

UNICEF COMPENDIUM OF RESOURCE PARTNER CONTRIBUTIONS 2017 1
CONTENTS
Note of thanks . . . . . . . . . . . . . . . . . . . . . . . . . . . . . . . . . . . . . . . . . . . .2
Executive summary . . . . . . . . . . . . . . . . . . . . . . . . . . . . . . . . . . . . . . . . .3
Total revenue by type of funding, 2017. . . . . . . . . . . . . . . . . . . . . . . . . . . . . . . .4
Reaching children in the greatest need with regular resources . . . . . . . . . . . . . . . . . . .5
Total revenue by type of resource partner, 2017 . . . . . . . . . . . . . . . . . . . . . . . . . . .6
Top 10 resource partners multi-year funding by revenue, 2017 . . . . . . . . . . . . . . . . . . .7
Top 20 public sector resource partners by contributions received, 2017 . . . . . . . . . . . . . .8
Top 20 private sector resource partners by contributions received, 2017 . . . . . . . . . . . . . .9
Regular resources by type of resource partner, 2017 . . . . . . . . . . . . . . . . . . . . . . . 10
Advancing transparency across UNICEF . . . . . . . . . . . . . . . . . . . . . . . . . . . . . . 11
Global Shared Services Centre drives efficiency and cost savings. . . . . . . . . . . . . . . . . 12
Value for money from UNICEF supply chain . . . . . . . . . . . . . . . . . . . . . . . . . . . . 13
Other resources (regular) by type of resource partner, 2017 . . . . . . . . . . . . . . . . . . . . 14
Other resources (emergency) by type of resource partner, 2017 . . . . . . . . . . . . . . . . . 15
Humanitarian funding, 2017 . . . . . . . . . . . . . . . . . . . . . . . . . . . . . . . . . . . . 17
Thematic contributions received, 2017 . . . . . . . . . . . . . . . . . . . . . . . . . . . . . . . 18
Partnerships with multi-laterals contribute to results for children . . . . . . . . . . . . . . . . . 19
Contributions received through inter-organizational arrangements, 2014-2017 . . . . . . . . . . 20
UN joint results for children . . . . . . . . . . . . . . . . . . . . . . . . . . . . . . . . . . . . 21
Total UNICEF revenue, 2016-2017 . . . . . . . . . . . . . . . . . . . . . . . . . . . . . . . . . 22
Funding gaps by strategic plan outcome area, 2014-2017 . . . . . . . . . . . . . . . . . . . . . 23
Global aid environment, 2017 . . . . . . . . . . . . . . . . . . . . . . . . . . . . . . . . . . . 24
Development assistance committee (DAC) member governments, total contributions received to UNICEF compared to ODA, ODA per capita and GNI per capita, 2017 . . . . . . . . 25
Development assistance committee (DAC) regular resources by contributions received to UNDP, UNICEF and UNFPA, 2017 . . . . . . . . . . . . . . . . . . . . . . . . . . . 26
Total UNICEF revenue by resource partner, 2017 . . . . . . . . . . . . . . . . . . . . . . . . . 27
Glossary . . . . . . . . . . . . . . . . . . . . . . . . . . . . . . . . . . . . . . . . . . . . . . 31
Abbreviations. . . . . . . . . . . . . . . . . . . . . . . . . . . . . . . . . . . . . . . . . . . . 32

2
Dear Partner,
In 2017, UNICEF continued to build on its strong track record of delivering results for children. Thanks to the investment, support and backing of our partners, millions of people received vital services provided through development programmes and humanitarian response supported by UNICEF.
Through our development programmes in 2017, UNICEF reached 45 million people with improved water supplies and 22 million with improved sanitation, the highest numbers ever achieved. The campaign to eradicate Guinea worm reached a new milestone with South Sudan reporting zero cases for the first time, and a total of just 30 people infected in Chad and Ethiopia. Additionally, through our education programmes globally, 12.5 million children accessed learning materials, about 250,000 classrooms were equipped with education supplies and nearly 48,000 school communities were trained in management, planning and/or inclusive education. In Madagascar, cash transfers helped over 21,000 out-of-school girls re-enter formal schooling, including almost 5,000 at the lower secondary education level.
UNICEF’s efforts to protect the rights of children were severely stretched by an unprecedented number of complex and large-scale humanitarian emergencies in Bangladesh, Democratic Republic of Congo, Iraq, Nigeria, South Sudan, Syria, and Yemen, among others. In partnership with the World Bank Group – International Development Association, UNICEF vaccinated 4.8 million children against polio, and delivered cash transfers to more than one million households, reaching nearly one-third of the population in Yemen. The UN joint response to the influx of 1.2 million Rohingya refugees including 720,000 children, from northern parts of Myanmar’s Rakhine State into Bangladesh, was an example of how the UN is delivering results together. UNICEF also provided 242,000 children and pregnant and lactating women with micronutrient supplementation, with the World Food Programme, UN Refugee Agency and the World Health Organization.
We also marked the end of the implementation of the Strategic Plan 2014-2017 and the ushering in of a new and ambitious plan for the next four years. Developed in consultation with our partners, the new Strategic Plan 2018-2021 is an opportunity to broaden our commitment to children. It charts the course towards the attainment of the 2030 Sustainable Development Goals (SDGs) and emphasizes bold and innovative cooperation with governments, civil society children, young people and the private sector. Furthermore, in the Common Chapter, the Strategic Plan highlights areas where UNICEF will work closely with other United Nations agencies, funds and programmes, to deliver tangible results for children in direct response to the Quadrennial Comprehensive Policy Review.
As UNICEF begins implementing this new Plan, we are strengthening our capacity to transition our emergency responses to long term resilience for vulnerable communities and deepening our cooperation with businesses locally and globally to respond innovatively to the needs of children. We are also exploring new areas of work. We will be scaling up our work with adolescence - the crucial second decade of life, by pursuing an ambitious agenda focused on ‘every young person being in school, learning, training or employment by 2030’.
All our work will be underpinned by our commitment to deliver results for children, efficiently, effectively, and transparently by maximizing cost effectiveness in our planning, implementing and reporting. For 2018 – 2021 we project $25 million in savings by processing financial and administrative transactions through the UNICEF Global Shared Services Centre. Additionally, by collaborating with other UN agencies on the ground to deliver local business solutions in information technology, procurement and cash transfers to implementing partners, UNICEF will save an estimated $4 million annually. Finally, through our evaluation function, we will build a strong evidence base that will inform our efforts to constantly improve our programmes.
The SDGs demand new and urgent action in reaching the hardest to reach children, leaving no child behind. Your partnership and commitment, over the next four years, as we aim to reach 5.1 million migrant and displaced children with protective services, ensure 120 million babies are born safely in health facilities and support 172 million vulnerable children with cash transfer programmes, remains critical. To achieve these and all other goals, we must meet the $22.8 billion resource target set in the Strategic Plan’s Integrated Results and Resources Framework. A strong investment in multi-year and flexible funds – including Regular Resources and softly earmarked Thematic Funding - is critical for reaching the most disadvantaged children in humanitarian and development settings.
We thank you all for being part of this essential journey to deliver results for every child.
NOTE OF THANKS
Carla Haddad Mardini, DirectorPublic PartnershipsNew York, May 2018
Gary Stahl, DirectorPrivate Fundraising and PartnershipsGeneva, May 2018

UNICEF COMPENDIUM OF RESOURCE PARTNER CONTRIBUTIONS 2017 3
EXECUTIVE SUMMARY
The Compendium of Resource Partner Contributions 2017 comprises information on revenue and contributions received from public and private sector resource partners to UNICEF1. Information presented in the Compendium demonstrates the results of extensive policy and programme partnerships between UNICEF and its resource partners. The Compendium is not an official UNICEF financial document, but it draws largely on financial data and is predominantly intended as a practical and illustrative report for resource partners.
UNICEF revised its accounting policy effective 2017 to recognize revenue in the year an agreement is signed, even for multi-year agreements. Total revenue to UNICEF increased from $5,191 million in 2016 to $6,577 million in 2017, representing a 27 per cent or $1,386 million increase2. Un-earmarked Regular Resources (RR) amounted to $1,424 million reflecting an 8 per cent or $107 million increase compared to $1,317 million in 2016. Public sector RR increased 1 per cent from $574 million to $580 million, while private sector RR increased 13 per cent from $622 million to $706 million. Regular Resources as a proportion of overall revenue fell from 25 per cent to 22 per cent. Earmarked Other Resources revenue increased by 33 per cent, to $5,153 million, of which $3,026 million or 59 per cent came in the form of Other Resources (regular) and $2,127 million or 41 per cent in the form of Other Resources (emergency).
Public sector revenue constituted a record 72 per cent or $4,729 million of total revenue. This was made up mostly by contributions from Government and Inter-organizational partners. The three largest public sector partners were the United States of America, the United Kingdom and the European Commission. Private sector revenue inclusive of global programme partnerships also stood at
a record high at $1,710 million3. The three largest private sector partners were the National Committees of United States of America, Japan and Republic of Korea. Other Revenue classified as RR, includes revenue from interest, procurement services and other sources, totalled $138 million or 2 per cent of overall revenue.
With the support of our partners, we made a remarkable difference to the situation of children worldwide, in 2017. As outlined in the Executive Board endorsed Strategic Plan 2018 – 2021, UNICEF will continue to strengthen public- and private-sector partnerships as a key strategy for delivering results for children, especially the most vulnerable.
Students looking at an inflatable globe, part of the educational supplies contained in a School-in-a-Box, at a new Transitional Learning Centre in the Uchiprang refugee camp, near Cox's Bazar, Bangladesh. Children learn English, Maths, Burmese, Science, Arts and Anthems in the learning centres. They also receive psychosocial counselling, and are taught hygiene and life skills. As part of the kit, they receive books, pens, colouring pencils, school bags and other educational materials.
© UNICEF/UN0141031/LeMoyne
1 All figures in this report have been rounded and are subject to audit.2 2016 revenue restated to reflect change in accounting policy for comparison with 2017.3 2017 includes $36 million contributions for specific management activities.
New Revenue Recognition Policy:
Revenue: The UNICEF policy for recognizing revenue from voluntary contributions was revised effective 2017. Under the previous policy, UNICEF recognized revenue based on payment plan due dates included in the resource partner agreements. Under the new policy, revenue is recognized in full, including for multi-year contributions, at the time the agreement is signed with the partner.
Contributions Received: Cash and contributions in kind received from resource partners within a calendar year.
Revenue can represent voluntary contributions intended to be used in programmatic activities over multiple years while contributions received relate to the financial year in question.
4
TOTAL REVENUE BY TYPE OF FUNDING, 2017
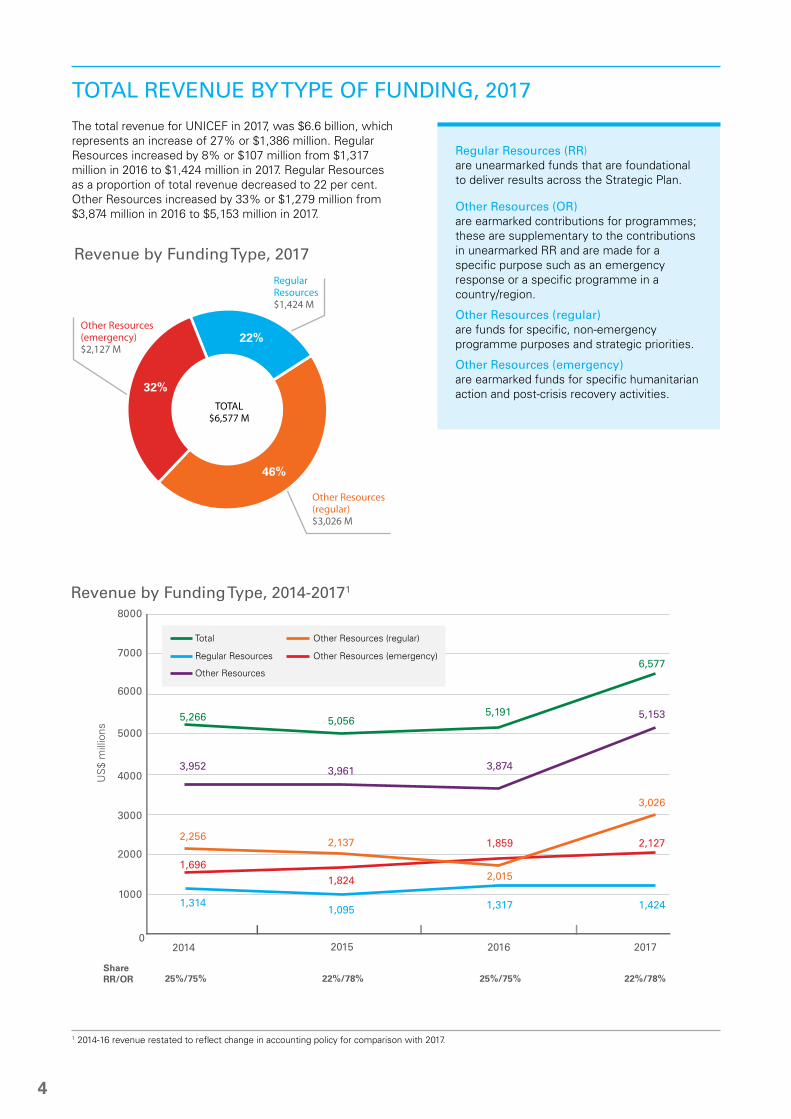
The total revenue for UNICEF in 2017, was $6.6 billion, which represents an increase of 27% or $1,386 million. Regular Resources increased by 8% or $107 million from $1,317 million in 2016 to $1,424 million in 2017. Regular Resources as a proportion of total revenue decreased to 22 per cent. Other Resources increased by 33% or $1,279 million from $3,874 million in 2016 to $5,153 million in 2017.
Regular Resources (RR) are unearmarked funds that are foundational to deliver results across the Strategic Plan.
Other Resources (OR) are earmarked contributions for programmes; these are supplementary to the contributions in unearmarked RR and are made for a specific purpose such as an emergency response or a specific programme in a country/region.
Other Resources (regular) are funds for specific, non-emergency programme purposes and strategic priorities.
Other Resources (emergency) are earmarked funds for specific humanitarian action and post-crisis recovery activities.
Regular Resources$1,424 M
Other Resources (regular)$3,026 M
Other Resources (emergency)$2,127 M
TOTAL$6,577 M
32%
22%
46%
Revenue by Funding Type, 2017
5,266
3,952
2,256
1,696
1,314
5,056
3,961
2,137
1,824
1,095
5,191
3,874
2,015
1,859
1,317
6,577
5,153
3,026
2,127
1,424
Public Sector
Private Sector
Other
2008 2009 2010 2011 2012 2013 2014 2015 2016 2017
US
$ m
illio
ns
3,455
3,679
3,327
2,6212,568
2,4402,251
2,2951,969
1,4451,4571,396
1,437
1,2441,0891,188
916987868
979489805555891081761000
2000
3000
40005000
60007000
8000
Cha
nge
in a
ccou
ntin
g po
licy
from
UN
SAS
to IP
SAS
may
not
allo
w m
eani
ngfu
l com
paris
ons
betw
een
2012
figu
res
and
prio
r yea
rs1 .
2008
Share RR/OR 32%/68% 26%/74% 26%/74% 25%/75% 22%/78%
2009 2010 2011 2012 2013 2014 2015 2016 2017
US
$ m
illio
ns
6,577
5,1915,056
5,2664,8532,568
3,7113,682
3,2563,390
5,153
3,0263,874
1,859
3,961
2,137
3,952
2,256
3,588
2,2561,0892,633
1,670
2,717
1,694
2,190
1,527
2,305
1,570
2,1272,015
1,8241,696
1,314 1,317
1,424
1,095
1,332
1,265
55963
1,0781,023
965663
1,066
735
1,085
0
1000
2000
3000
4000
5000
6000
7000
8000
Cha
nge
in a
ccou
ntin
g po
licy
from
UN
SAS
to IP
SAS
may
not
allo
w m
eani
ngfu
l com
paris
ons
betw
een
2012
figu
res
and
prio
r yea
rs1 .
Total
Regular Resources
Other Resources
Other Resources - Regular
Other Resources - Emergency
Share RR/OR 25%/75% 22%/78% 25%/75% 22%/78%
2014 2015 2016 2017
US
$ m
illio
ns
0
1000
2000
3000
4000
5000
6000
7000
8000
Total
Regular Resources
Other Resources
Other Resources (regular)
Other Resources (emergency)
Revenue by Funding Type, 2014-20171
1 2014-16 revenue restated to reflect change in accounting policy for comparison with 2017.

UNICEF COMPENDIUM OF RESOURCE PARTNER CONTRIBUTIONS 2017 5
REACHING CHILDREN IN THE GREATEST NEED WITH REGULAR RESOURCES
A strong investment in unrestricted Regular Resources by partners allowed UNICEF in 2017 to reach the children who were in the greatest need and at the greatest risk. Regular Resources were an indispensable part of UNICEF’s programming and humanitarian response, enabling us to elevate various interventions.
In Mali, the availability of Regular Resources (RR) was instrumental to strengthen the systems for delivery of key nutrition interventions. UNICEF and partners provided the first dose of Vitamin A supplementation to 4.7 million children and 4.6 million children with deworming medication, covering 99 per cent of the targeted group. Some 6,000 children with severe acute malnutrition (SAM) were treated. In addition, UNICEF supported a study of the integration of SAM screening into malaria campaigns, and found that it was an effective means of strengthening the ownership of SAM treatment by health systems and communities.
Using RR, UNICEF advocacy and technical assistance to the Government of India, resulted in the expansion of the government’s campaign to end open defaecation. In 2017 alone, the government-led Swachh Bharat Mission (a clean-up campaign of India’s urban and rural areas), reached 130 million people and 27.5 million new latrines were built across the country. UNICEF supported the government to reach vulnerable households through
various strategic partnerships with civil societies and local non-governmental organizations as well as through communication and media outreach. Furthermore, UNICEF promoted hygiene in schools in 14 states by empowering children to become agents of change for their communities.
In humanitarian crises, RR provide flexible and timely funding to deliver life-saving aid. As Yemen continued to experience one of the world’s largest and most complex humanitarian crisis, RR were critical to UNICEF’s efforts to deliver a range of lifesaving services. In our interventions for children under-5, over 4.8 million children were vaccinated against polio, 2.6 million children were screened for malnutrition and 4.7 million children were supplied with micronutrient supplementation. Through school rehabilitations, establishment of temporary learning spaces and provision of classroom furniture, UNICEF provided access to education for 1.3 million children. We reached more than 4.3 million people following the rehabilitation of water and sanitation systems in urban and rural areas and over 595,000 pregnant and lactating women received peri-natal health services.
These achievements were made possible by the flexible resources contributed by our resource partners allowing us to respond quickly, where the need was greatest.
(Left) Djeinabou Coulibaly, holding her 9-month-old baby Salimata Kone, talking to Bassan Koita (right), during a session to sensitize new mothers on the importance of antenatal and postnatal medical consultations, vaccinations and breastfeeding, in Mali, August 2017. Since 2014, stunting rates have halved in Yorosso district thanks to community-based awareness programmes by local authorities and role model mothers.
© UNICEF/UN0119053/Sokhin
6
TOTAL REVENUE BY TYPE OF RESOURCE PARTNER, 2017
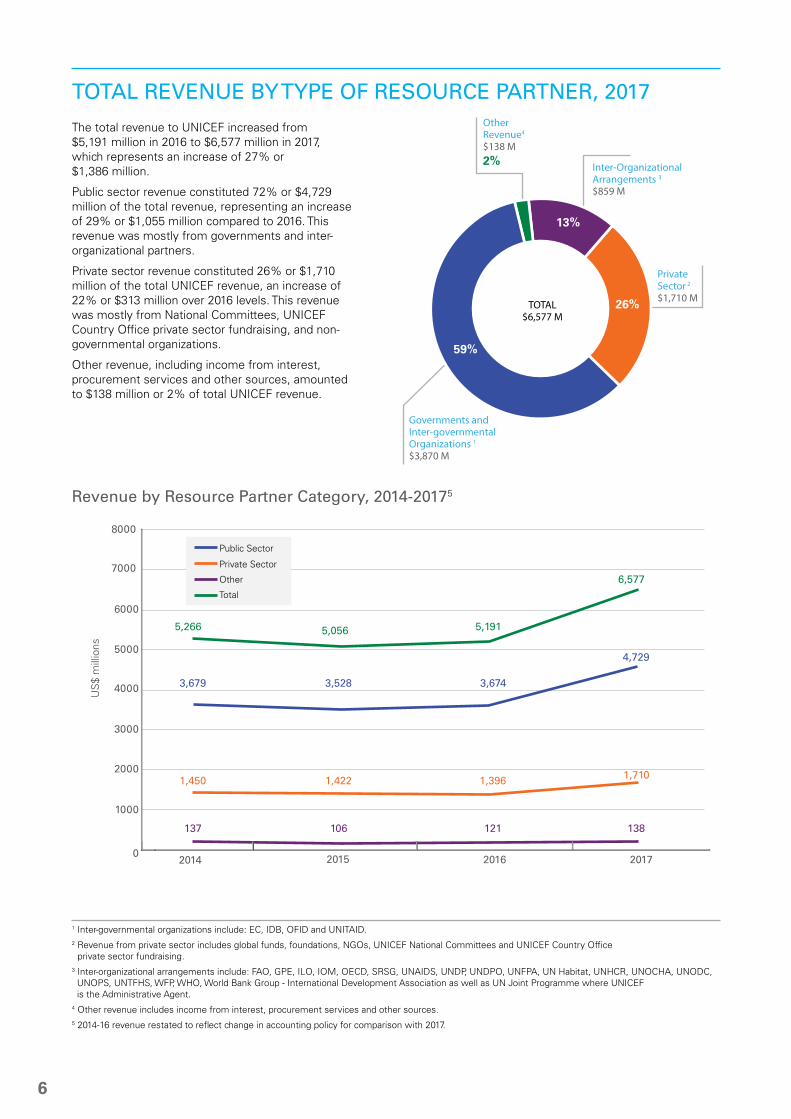
The total revenue to UNICEF increased from $5,191 million in 2016 to $6,577 million in 2017, which represents an increase of 27% or $1,386 million.
Public sector revenue constituted 72% or $4,729 million of the total revenue, representing an increase of 29% or $1,055 million compared to 2016. This revenue was mostly from governments and inter-organizational partners.
Private sector revenue constituted 26% or $1,710 million of the total UNICEF revenue, an increase of 22% or $313 million over 2016 levels. This revenue was mostly from National Committees, UNICEF Country Office private sector fundraising, and non-governmental organizations.
Other revenue, including income from interest, procurement services and other sources, amounted to $138 million or 2% of total UNICEF revenue.
Governments and Inter-governmental Organizations 1
$3,870 M
Inter-Organizational Arrangements 3
$859 M
Other Revenue4
$138 M
Private Sector 2 $1,710 M
2%
TOTAL$6,577 M
59%
13%
26%
1 Inter-governmental organizations include: EC, IDB, OFID and UNITAID.2 Revenue from private sector includes global funds, foundations, NGOs, UNICEF National Committees and UNICEF Country Office
private sector fundraising.3 Inter-organizational arrangements include: FAO, GPE, ILO, IOM, OECD, SRSG, UNAIDS, UNDP, UNDPO, UNFPA, UN Habitat, UNHCR, UNOCHA, UNODC, UNOPS, UNTFHS, WFP, WHO, World Bank Group - International Development Association as well as UN Joint Programme where UNICEF is the Administrative Agent.4 Other revenue includes income from interest, procurement services and other sources.5 2014-16 revenue restated to reflect change in accounting policy for comparison with 2017.
3,679
1,450
5,266
137
3,528
1,422
5,056
106
3,674
1,396
5,191
121
4,729
1,710
6,577
138
Public Sector
Private Sector
Other
Total
US
$ m
illio
ns
0
1000
2000
3000
4000
5000
6000
7000
8000
2014 2015 2016 2017
Revenue by Resource Partner Category, 2014-20175

UNICEF COMPENDIUM OF RESOURCE PARTNER CONTRIBUTIONS 2017 7
1 Multi-year agreements signed in 2017 (including Regular Resources and Other Resources) with a lifetime of two years or more.2 Weighted averages based on revenue of multi-year agreements.
Share of Multi-year Revenue of Top 10 Partners, 2017
Average Number of Years for Multi-year Agreements of Top 10 Partners, 2017
TOP 10 RESOURCE PARTNERS MULTI-YEAR FUNDING BY REVENUE, 20171
Multi-year revenue from the top 10 resource partners providing this type of funding was $1,211 million, representing 32% of their overall revenue to the organization. The average number of years for multi-year agreements from these partners was 3.0 years in 2017.
multi-year non multi-year
0%
20%
40%
60%
80%
100%
0.0
0.5
1.0
1.5
2.0
2.5
3.0
3.5
4.0
United States
of America European
Commission
United Kingdom
World BankGermany
NorwaySweden
Japan GaviCanada
95%
5%
76%
24%
58%
42%
36%
64%
54%
46%
87%
46%
78%
22%
84%
16%
64%
36%
34%
2.6
3.6 3.6
2.53.0 3.0
4.0
2.6
2.0
3.466%
Wei
gh
ted
ave
rag
e n
um
ber
of
year
s2
Eu
rop
ean
Co
mm
issi
on
Un
ited
K
ing
do
m
Wo
rld
Ban
k G
rou
p -
IDA
Ger
man
y
No
rway
Sw
eden
Jap
an
Gav
i
Can
ada
Un
ited
Sta
tes
of A
mer
ica
multi-year non multi-year
0%
20%
40%
60%
80%
100%
0
20
40
60
80
100
Un
ited
Sta
tes
of A
mer
ica
Wei
gh
ted
sh
are2
Eu
rop
ean
Co
mm
issi
on
Un
ited
K
ing
do
m
Wo
rld
Ban
k G
rou
p -
IDA
Ger
man
y
No
rway
Sw
eden
Jap
an
Gav
i
Can
ada
95%
5%
76%
24%
58%
42%
36%
64%
54%
46%
87%
13%
78%
22%
84%
16%
64%
36%
34%
66%

8
TOP 20 PUBLIC SECTOR RESOURCE PARTNERS BY CONTRIBUTIONS RECEIVED, 2017
The top 20 public sector resource partners provided $3,829 or 65% of the total contributions received by UNICEF. These partners provided 39% of total Regular Resources and 71% of total Other Resources.
The number of governments contributing to UNICEF in 2017 increased from 137 to 142, reflecting UNICEF’s effort to expand its partner base.
In 2017, the top five resource partners comprised the Governments of the United States of America, the United Kingdom and Germany as well as the European Commission and the World Bank Group – International Development Association. These five partners provided 67% of the total contributions received from the top 20 public sector partners.
Rank 2017
Rank 20161 Resource Partners
Regular Resources US$
RankOther Resources (regular) US$
RankOther Resources (emergency) US$
Rank Total US$
1 1 United States of America 132,500,000 1 164,169,984 4 518,608,623 1 815,278,607
2 3 The United Kingdom 53,691,275 3 202,973,845 3 264,241,103 2 520,906,223
3 2 European Commission 285,205,601 2 215,178,120 4 500,383,721 4 4 Germany 16,912,264 9 116,194,880 5 234,232,625 3 367,339,769 5 54 World Bank Group - IDA 4 351,393,769 1 351,393,769 6 5 Sweden 84,527,727 2 81,856,687 7 40,255,300 10 206,639,714 7 6 Norway 47,970,048 4 86,339,462 6 59,749,793 7 194,059,303 8 7 Japan 19,018,327 7 78,475,240 8 73,157,216 6 170,650,782 9 9 Canada 12,597,201 11 69,548,570 9 48,680,511 8 130,826,282
10 10Central Emergency Response Fund (UN)
108,902,994 5 108,902,994
11 8 Netherlands 20,148,462 6 58,157,224 11 24,673,336 11 102,979,023 12 17 Denmark 12,501,435 12 24,183,200 14 18,415,224 14 55,099,859
13 11Global Partnership for Education
52,286,959 12 52,286,959
14 12Country-Based Pooled Funds
48,298,725 9 48,298,725
15 15 Australia 15,981,735 10 3,779,584 21 20,193,444 13 39,954,762 16 14 Switzerland 23,944,579 5 4,665,064 18 10,943,474 16 39,553,118 17 16 Republic of Korea 3,900,000 17 27,807,672 13 6,466,667 18 38,174,339 18 22 France 3,609,342 18 5,804,168 16 21,748,296 12 31,161,806 19 20 Italy 5,312,869 15 11,488,284 15 10,975,532 15 27,776,684 20 18 Belgium 18,295,655 8 1,684,300 25 7,306,895 17 27,286,850
United States of America
The United Kingdom
European Commission
Germany
World Bank Group - IDA
Sweden
Norway
Japan
Canada
Central Emergency Response Fund (UN)
Netherlands
Denmark
Global Partnership for Education
Country-Based Pooled Funds
Australia
Switzerland
Republic of Korea
France
Italy
Belgium
US$ millions
0 200 400 600 80 100
Regular Resources
Other Resources (regular)
Other Resources (emergency)
0 200 300 500 700 900100 400 600 800
1 Ranking based on restated contributions received for 2016, to reflect change in accounting policy for comparison with 2017.

UNICEF COMPENDIUM OF RESOURCE PARTNER CONTRIBUTIONS 2017 9
Rank 2017
Rank 20161 Resource Partners
Regular Resources US$
RankOther Resources (regular) US$
RankOther Resources (emergency) US$
RankOther Contributions2
US$Total US$
1 1United States of America NC
32,630,704 9 260,598,332 1 44,259,215 1 2,330,000 339,818,251
2 2 Japan NC 111,292,625 1 9,104,752 15 12,800,033 4 133,197,409
3 3Republic of Korea NC
99,290,126 2 22,911,786 6 1,634,098 19 123,836,010
4 8 Gavi 4 120,296,318 8 2 120,296,318
5 4 Germany NC 44,198,400 6 15,526,106 2 35,226,650 7 94,951,156 6 6 Sweden NC 41,826,049 3 35,060,683 17 7,710,772 6 84,597,504 7 7 Spain NC 52,801,476 11 7,109,925 3 8,953,250 3 68,864,652 8 5 United Kingdom NC 14,089,993 5 35,039,130 14 18,369,624 8 67,498,748 9 9 France NC 43,805,980 7 11,091,383 16 5,738,383 5 60,635,746
10 10 Netherlands NC 41,112,687 8 8,014,420 36 9,006,731 15 58,133,837 11 11 Italy NC 35,353,950 10 1,833,824 7 2,921,106 39 40,108,881 12 12 The Global Fund 0 33,780,373 4 4,302,701 18 38,083,074 13 13 Argentina PSFR 14,106,881 36 13,014,866 5 142,787 25 8,807,417 36,071,950 14 16 Qatar PSFR 19 32,621,127 10 2,002,843 12 34,623,970 15 14 Mexico PSFR 800,014 14 24,032,144 24 829,938 11 2,074,795 27,736,892 16 18 Switzerland NC 5,605,364 12 13,612,086 28 3,409,679 10 22,627,128
17 -Education Cannot Wait Fund
13 22,325,571 23 28 22,325,571
18 15 Denmark NC 11,969,979 15 4,924,407 35 3,819,926 9 20,714,311 19 17 Finland NC 12,330,733 25 3,816,256 13 3,848,701 20 19,995,690 20 19 Hong Kong NC 12,167,145 49 5,027,963 9 393,402 34 17,588,509
TOP 20 PRIVATE SECTOR RESOURCE PARTNERS BY CONTRIBUTIONS RECEIVED, 2017
In 2017, 34 UNICEF National Committees throughout the world, each established as an independent legal non-governmental organization, and 48 UNICEF Country Offices were instrumental in mobilizing private sector resources for UNICEF’s work.
The top 20 private sector resource partners contributed $1,432 million or 24% of the total contributions received by
UNICEF. These partners provided 47% of total Regular Resources and 18% of total Other Resources.
In 2017, the top five partners in this category included the National Committees of United States of America, Japan, Republic of Korea and Germany, as well as Gavi, the Vaccine Alliance. These five partners contributed 57% of the total contributions received from the top 20 private sector partners.
¹ Ranking based on restated contributions received for 2016, to reflect change in accounting policy for comparison with 2017.2 Contributions for specific managements activities.
United States of America NC
Japan NC
Republic of Korea NC
Gavi
Germany NC
Sweden NC
Spain NC
United Kingdom NC
France NC
Netherlands NC
Italy NC
The Global Fund
Argentina PSFR
Qatar PSFR
Mexico PSFR
Switzerland NC
Education Cannot Wait Fund
Denmark NC
Finland NC
Hong Kong NC
US$ millions
0 50000000 100000000 150000000 200000000 250000000 300000000 350000000
0 50 100 150 200 250 300 350
Regular Resources
Other Resources (regular)
Other Resources (emergency)
Other contributions

10
REGULAR RESOURCES BY TYPE OF RESOURCE PARTNER, 2017
Unearmarked Regular Resource contributions are crucial for UNICEF to reach the most disadvantaged children and respond quickly to emergencies. Steady and predictable Regular Resources allow UNICEF to leverage and invest in innovative programmes and approaches.
Total Regular Resource revenue to UNICEF was $1,424 million in 2017 – an increase of 8% or $107 million from $1,317 million in 2016. Of this, $580 million or 41% was contributed by government partners, and $706 million or 49% was contributed by the private sector partners. The remaining $138 million or 10% included income from interest, procurement services and other sources.
The top 20 resource partners to Regular Resource contributed $952 million. Of these partners, 45% were government partners, while the remaining 55% were from the private sector.
In 2017, the top five partners to Regular Resource were the Governments of the United States of America, Sweden, and the United Kingdom; and the National Committees of Japan and the Republic of Korea. These five partners contributed almost 51% of the Regular Resource of the top 20 partners.
TOTAL$1,424 M
Other Revenue3
$138 M
Governments and Inter-governmental Organizations1
$580 M
Private Sector2
$706 M
49%41%
10%
From left to right Pavle Milovanovic, 4, Anja Marinkovic, 3, Ana Micic, 5, playing during a diversified program for kids from various backgrounds and with disabilities, in Serbia, July 2017.
© UNICEF/UN0202906/Pancic
1 Inter-governmental organizations include: EC, IDB, OFID and UNITAID.2 Revenue from private sector includes global funds, foundations, NGOs, UNICEF National Committees and UNICEF Country Office private sector fundraising.
It includes contributions for specific management activities.3 Other revenue includes income from interest, procurement services and other sources.
Rank Resource Partners Regular Resources US$
1 United States of America 132,500,000
2 Japan NC 111,292,625 3 Republic of Korea NC 99,290,126 4 Sweden 84,527,727 5 The United Kingdom 53,691,275 6 Spanish NC 52,801,476 7 Norway 47,970,048 8 Germany NC 44,198,400 9 France NC 43,805,980
10 Sweden NC 41,826,049 11 Netherlands NC 41,112,687 12 Italy NC 35,353,950 13 United States of America NC 34,960,704 14 Switzerland 23,944,579 15 Netherlands 20,148,462 16 Japan 19,018,327 17 Belgium 18,295,655 18 Germany 16,912,264 19 Australia 15,981,735 20 United Kingdom NC 14,089,993
Top 20 Partners to Regular Resource by Contributions Received, 2017
Regular Resources Revenue by Type of Partner, 2017

UNICEF COMPENDIUM OF RESOURCE PARTNER CONTRIBUTIONS 2017 11
ADVANCING TRANSPARENCY ACROSS UNICEF
Since becoming a signatory of the International Aid Transparency Initiative (IATI), UNICEF, which is ranked the third most transparent out of 46 major donor organizations worldwide, has pursued a series of measures to support its commitment to greater transparency and accountability. We have strategically combined innovative technology and stakeholder engagement over the years to build on the quality and depth of programme and financial data released to the public.
In 2017, UNICEF placed greater focus on improving internal data quality assurance mechanisms, consolidating the technical infrastructure for transparency and external reach, and collaborating with other UN entities.
Strengthening at global, regional and country-level use of IATI data: More and more data on development cooperation has become available in public domain through IATI. Aid data that is traditionally collected by Governments directly from development partners for use in Aid Management Systems (AIMS) is now published through IATI and readily accessible in public domain. In 2017, UNICEF partnered with the Governments of Madagascar and Senegal to pilot an IATI data use initiative, to import IATI data into national systems and provide a complete picture of the aid chain and automating processes.
This pilot demonstrated the value of IATI data in reducing the burden on governments, and UNICEF country offices for reporting and collecting data. This initiative responded
to UNICEF’s Grand Bargain commitment to ‘full utilization of the IATI data model for government reporting on humanitarian funding in at least two country offices by the end of 2017.’ The lessons learnt from the pilot are now being used by several donors to take the IATI-AIMS linkages to scale in other countries.
Widening IATI memberships across the UN: As a Member of IATI’s Governing Board representing multilateral agencies, UNICEF actively advocated for increased use of the IATI standard in reporting on development programmes. In 2017, UNICEF successfully led negotiations for reduced membership contributions of UN agencies translating in direct savings of $750,000 to the UN system. Additional advocacy resulted in widening of IATI membership beyond United Nations Development Group to include all UN Secretariat agencies.
UNICEF’s goal is to go beyond compliance to the IATI Common Standard and exceed global aid transparency standards in how we deliver better results for the most vulnerable children; a firm commitment outlined in the Strategic Plan 2018-2021. To achieve these goals, UNICEF will maximize on the progress made over the last four years to establish a culture of transparency across UNICEF and advocate the use of IATI for results monitoring and reporting against the Sustainable Development Goals within the UN System.
IATI: International Aid Transparency Initiative
2012Rating: “Poor”
Ranked 63rd out of72 donors surveyed
Poor
2013Rating: “Fair”
Ranked 21st out of 67 donors
Fair
2014Rating: “Good”
Ranked 14th out of 68 donors
2018Rating: TBD
Next AidTransparencyIndex Report willbe released inJune 2018
Good
2016Rating: “Very Good”
Ranked 3rd out of 46 donors
Very Good
UNICEF's progress on the Global Aid Transparency Index 2012-2018

12
GLOBAL SHARED SERVICES CENTRE DRIVES EFFICIENCY AND COST SAVINGS
Cost savings, freed up time for staff to support critical responses for children, reduced risk, improved quality and value-for-money were the key drivers for the establishment of UNICEF’s Global Shared Services Centre (GSSC) in Budapest, Hungary in 2015, and continue to define the Centre’s strategic priorities and shape improvement initiatives.
In 2017, its first full-year of operations, the Centre generated estimated savings of $25 million in transaction costs for UNICEF. Economies of scale due to consolidation of global processing of human resources, payroll, invoice, payments, master data transactions, and global customer care combined with lower operating costs in Budapest constituted the GSSC’s annual savings calculation.
Before the GSSC, over 40 per cent of UNICEF’s workforce performed operational transactions – significantly higher than the 15 per cent industry median. The establishment of the GSSC targeted time savings of over 760,000 hours, or 427 full-time staff equivalents, for offices, based on original transaction volume estimates. Time that was previously spent by staff on transactional heavy processes has now been redirected to support critical programmatic and humanitarian responses that directly impact the lives of children.
The Centre realized further savings of approximately $2.5 million in 2017 because of process simplifications and absorption of additional functions. This included centralization of medical clearances at the GSSC, expansion of e-banking for vendor and payroll payments and increased automation of information technology processes.
Its 300-specialized staff have also significantly improved overall quality, transaction time, throughput and customer service for UNICEF’s 13,000 staff and 395 offices worldwide, measured against agreed global service level targets. End-to-end visibility of global transaction processes also provides UNICEF with the opportunity to better identify risks, apply fraud prevention measures and follow-up on potential irregularities.
The Centre remains well-positioned to continue identifying improvement opportunities aimed at driving greater efficiency and cost savings across the organization and for strengthened coordination of business operations with other UN entities.
UNICEF staff conduct a rapid assessment of the situation of newly arrived displaced families and children in a shelter in Homs evacuated from besieged cities in northern Syria. The GSSC provides accelerated service response times for offices in emergency contexts and offices supporting emergency countries.
© UNICEF/UN060896/Al Tabbaa

UNICEF COMPENDIUM OF RESOURCE PARTNER CONTRIBUTIONS 2017 13
VALUE FOR MONEY FROM UNICEF SUPPLY CHAIN
In 2012, UNICEF set a target of $810 million worth of procurement savings/cost avoidance by 2017. By the end of the period, UNICEF had exceeded this target by 153 per cent.
Over the intervening six-year period, average annual savings (i.e. cost avoidance) were $341.8 million; amounting to a total of $2.051 billion.
Savings at this scale demonstrate that UNICEF has integrated value for money in its strategic efforts to influence markets. The savings secured have mostly benefited governments and other partners, freeing more money to buy more products for children.
To achieve these savings, UNICEF’s commitment to price transparency was extended from vaccines to other significant product groups such as cold chain equipment, injection equipment, long-lasting insecticidal bed nets (LLINs), and ready-to-use therapeutic food (RUTF).
Price transparency, publication of market updates, and regular global industry dialogues, reduced market asymmetries and enabled markets to function more efficiently, resulting in increased competition and lower prices.
UNICEF, in partnership with other actors, also utilized strategic procurement including use of special contracting and innovative financing to influence markets and unlock value. Strategic procurement activities in 2017 covered a wide range of supplies and services including amoxicillin, micronutrient powder, laboratory services, children’s winter clothes kits, and a range of vaccines including against pneumonia, measles, yellow fever, and meningitis.
UNICEF staff, Alban Nouvellon, WASH Specialist (left) and Djani Zadi, Supply Chain Specialist, (right) receive the first cargo of temporary school tents for children affected by the Hurricane Maria at the port of Roseau, capital of Dominica, September 2017.
© UNICEF/UN0127069/Moreno Gonzalez
Strategic tendering undertaken, 2012 – 2017
Cases
• Procurement of rotavirus and pentavalent vaccines utilized a range of special contracting and strategic tender modalities very effectively, to generate savings of $1.295 billion over the six years, 2012-2017. UNICEF and our partners (Gavi, Bill and Melinda Gates Foundation, World Health Organization) have influenced this market to the point that there is no tiered pricing employed to differentiate low and middle income countries.
• Procurement for LLINs yielded $63.3 million in savings over the six years thanks to the collaborative approach fostered among the major buyers (UNICEF, the Global Fund, United States Agency for International Development, and Department for International Development) to influence the market in unison. Products were standardized, with the range of sizes and specifications reduced from more than 40 to less than 10 products. UNICEF convened suppliers and partners in joint industry forums to discuss forecasts and synchronize the procurement timing to minimize supplier transaction costs.

14
OTHER RESOURCES (REGULAR) BY TYPE OF RESOURCE PARTNER, 2017
The total Other Resources (regular) revenue to UNICEF increased by 63% or $1,167 million from $1,859 million in 2016 to $3,026 million in 2017. Of this, 73% or $2,210 million was mobilized from the public sector and 27% or $816 million from the private sector.
The top 20 resource partners to Other Resources (regular) contributed $2,140 million. Of these top 20 partners, 75% were public sector partners while the remaining 25% were from the private sector.
In 2017, the top five partners to Other Resources (regular) were the World Bank Group - International Development Association, the European Commission, National Committee of United States of America, and the Governments of United Kingdom and United States of America. These five partners contributed 59% of the Other Resources (regular) contributions from the top 20 Other Resources (regular) partners.
Global Programme Partnerships (GPPs) and International Financial Institutions (IFIs) partner funding through Programme Country Governments For GPPs and IFIs, contributions are received directly and through agreements in collaboration with Programme Country Governments, that requests UNICEF to assist in the implementation of parts of their GPP/IFI funding. In the latter category, funds are received either when governments transfer GPP/IFI funding directly to UNICEF, or via tripartite agreements between UNICEF, the Government, and the GPP/IFI.
• Gavi: Total direct income to UNICEF Other Resources (regular) in 2017 was $120.3 million, plus $45.3 million via Programme Country Government agreements, totalling $165.6 million in Other Resources (regular).
• Global Fund: Total direct income to UNICEF Other Resources (regular) in 2017 was $33.8 million, plus $21.1 million via Programme Country Government agreements, totalling $54.9 million in Other Resources (regular).
• UNITAID: Total direct income to UNICEF Other Resources (regular) in 2017 was $0.8 million, plus $1.4 million via Programme Country Government agreements, totalling $2.2 million in Other Resources (regular).
• World Bank Group - International Development Association: Total direct income to UNICEF Other Resources (regular) in 2017 was $351.4 million, plus $26.7 million via Programme Country Government agreements, totalling $378.1 million in Other Resources (regular).
Rank Resource Partners Other Resources (regular) US$
1 World Bank Group - IDA 351,393,769
2 European Commission 285,205,601 3 United States of America NC 260,598,332 4 United Kingdom 202,973,845 5 United States of America 164,169,984 6 Gavi 120,296,318 7 Germany 116,194,880 8 Norway 86,339,462 9 Sweden 81,856,687
10 Japan 78,475,240 11 Canada 69,548,570 12 Netherlands 58,157,224 13 Global Partnership for Education 52,286,959 14 Sweden NC 35,060,683 15 United Kingdom NC 35,039,130 16 Global Fund 33,780,373 17 Qatar PSFR 32,621,127 18 Republic of Korea 27,807,672 19 Denmark 24,183,200 20 Mexico PSFR 24,032,144
TOTAL$3,026 M
Inter-Organizational Arrangements3
$681 M
Private Sector2
$816 M
Governments and Inter-governmental Organizations1
$1,529 M
51%
27%
22%
1 Inter-governmental organizations include: EC, IDB, OFID and UNITAID.2 Revenue from private sector includes global funds, foundations, NGOs, UNICEF National Committees and UNICEF Country Office private sector
fundraising.3 Inter-organizational arrangements include: FAO, GPE, ILO, IOM, OECD, SRSG, UNAIDS, UNDP, UNDPO, UNFPA, UN Habitat, UNHCR, UNOCHA, UNODC, UNOPS, UNTFHS, WFP, WHO, World Bank Group - International Development Association as well as UN Joint Programme where UNICEF is the Administrative Agent.
Top 20 Partners to Other Resources (regular) by Contributions Received, 2017Other Resources (regular) Revenue
by Type of Partner, 2017

UNICEF COMPENDIUM OF RESOURCE PARTNER CONTRIBUTIONS 2017 15
OTHER RESOURCES (EMERGENCY) BY TYPE OF RESOURCE PARTNER, 2017
The total Other Resources (emergency) revenue to UNICEF increased by 6% or $111 million from $2,015 million in 2016 to $2,127 million in 2017.
Of the total Other Resources (emergency) revenue, $1,939 million or 91% came from the public sector, while the remaining $188 million or 9% was provided by the private sector.
The top 20 resource partners to Other Resources (emergency) contributed $1,829 million. Of these top 20 partners, 94% were public sector partners while the remaining 6% were private sector partners.
In 2017, the top five partners to Other Resources (emergency) were the Governments of the United States of America, United Kingdom, Germany, as well as the European Commission and Central Emergency Response Fund (United Nations). These five partners contributed $1,341 million or 73% of the Other Resources (emergency) contributions of the top 20 Other Resources (emergency) partners.
TOTAL$2,127 M
Inter-Organizational Arrangements3
$178 M
Private Sector2
$188 M
Governments and Inter-governmental Organizations1
$1,761 M
83%8%
9%
1 Inter-governmental organizations include: EC, OFID and UNITAID.2 Revenue from private sector includes Global Programme Partnerships (GPPs), foundations, NGOs, UNICEF National Committees and UNICEF Country
Office private sector fundraising.3 Inter-organizational arrangements include: FAO, GPE, ILO, IOM, OECD, SRSG, UNAIDS, UNDP, UNDPO, UNFPA, UN Habitat, UNHCR, UNOCHA,
UNODC, UNOPS, UNTFHS, WFP, WHO, World Bank Group - International Development Association as well as UN Joint Programme where UNICEF is the Administrative Agent.
4 Country-Based Pooled Funds (CBPFs): CBPFs are multi-donor humanitarian financing instruments established by the Emergency Relief Coordinator (ERC). They are managed by OCHA at the country-level under the leadership of the Humanitarian Coordinator (HC). Donor contributions to each CBPF are un-earmarked and allocated by the HC through an in-country consultative process. As of 2016, CBPFs operate in 18 countries.
Rank Resource Partners Other Resources (emergency) US$
1 United States of America 518,608,623 2 The United Kingdom 264,241,103 3 Germany 234,232,625 4 European Commission 215,178,120
5Central Emergency Response Fund (United Nations)
108,902,994
6 Japan 73,157,216 7 Norway 59,749,793 8 Canada 48,680,511 9 Country-Based Pooled Funds4 48,298,725
10 United States of America NC 44,259,215 11 Sweden 40,255,300 12 Germany NC 35,226,650 13 Netherlands 24,673,336 14 France 21,748,296 15 Australia 20,193,444 16 Denmark 18,415,224 17 United Kingdom NC 18,369,624 18 Japan NC 12,800,033 19 Italy 10,975,532 20 Switzerland 10,943,474
Top 20 Partners to Other Resources (emergency) by Contributions Received, 2017
Other Resources (emergency) Revenue by Type of Partner, 2017

1Nigeria and Lake Chad Basin humanitarian requirements and funds received include all emergency interventions in the four affected countries.
HUMANITARIAN FUNDING, 2017
South Sudan: Nearly 320,000 school-aged children accessed education in emergencies (exceeding the target).
Funding received $129.8 mFunding shortfall $51.2 mFunding gap 28%
Central African Republic: Nearly 83,000 acutely vulnerable people received appropriate WASH assistance through the Rapid Response Mechanism following a shock (exceeding the target).
Funding received $16.7 mFunding shortfall $36.9 mFunding gap 69%
Syrian Arab Republic: Nearly 5.9 million people gained access to safe water through the repair, rehabilitation or augmentation of water and sanitation systems (exceeding the target).
Funding received $170.9 m Funding shortfall $183.8 m Funding gap 52%
Horn of Africa: Nearly 706,000 children aged 6-59 months suffering from severe acute malnutrition in Ethiopia, Kenya and Somalia received treatment (95 per cent of the target)
Funding received $199.0 mFunding shortfall $156.7 mFunding gap 44%
Syrian refugees: More than 1 million Syrian refugee children in Iraq, Jordan, Lebanon and Turkey were enrolled in formal education (exceeding the target)
Funding received $631.7 mFunding shortfall $416.8 mFunding gap 40%
Refugee and migrant crisis in Europe: Nearly 18,000 at-risk children were identified through screening by outreach teams and child protection support centres in Greece, Italy, Serbia, the former Yugoslav Republic of Macedonia and Turkey (exceeding the target).
Funding received $14.7 mFunding shortfall $28.8 mFunding gap 66%
Caribbean hurricanes: Nearly 39,000 people gained access to
safe water in the immediate aftermath of the emergency (exceeding the target).
Funding received $9.0 mFunding shortfall $11.9 m
Funding gap 57%
Iraq: Nearly 850,000 children accessed formal or non-formal basic education (exceeding the target).
Funding received $105.3 mFunding shortfall $56.1mFunding gap 35%
Bangladesh: Nearly 900,000 affected people reached with cholera vaccination (99 per cent of target).
Funding received $30.9 m Funding shortfall $45.2 m Funding gap 59%
Yemen: More than 2.3 million children aged 6 to 59 months were screened for acute malnutrition and over 226,500 children suffering from severe acute malnutrition received treatment (70 per cent of the target).
Funding received $136.8 mFunding shortfall $202.2 mFunding gap 60%
Democratic Republic of the Congo: More than 271,000 people received unconditional cash grants (74 per cent of the target).
Funding received $71.0 mFunding shortfall $94.1 mFunding gap 57%
Nigeria and the Lake Chad basin1: More than 3.9 million children affected by the ongoing crisis in north-east Nigeria, Cameroon, Chad and the Niger received measles vaccination (exceeding the target).
Funding received $121.7 mFunding shortfall $143.7 mFunding gap 54%
Mali: More than 120,000 children
aged 6–59 months suffering from severe acute malnutrition received treatment
(exceeding the target).
Funding received $7.1 mFunding shortfall $28.2 m
Funding gap 80%
Haiti: 87% of all cholera cases were
identified and responded to within 48 hours (exceeding the target)
Funding received $21.0 mFunding shortfall $21.4 m
Funding gap 50%.
This map is stylized and not to scale. It does not reflect a position by UNICEF on the legal status of any country or area or the delimitation of any frontiers. The dotted line represents approximate-ly the Line of Control agreed upon by India and Pakistan. The final status of Jammu and Kashmir has not yet been agreed upon by the Parties. The final boundary between the Republic of the Sudan and the Republic of South Sudan has not yet been determined.
An unprecedented number of complex and large-scale emergencies severely stretched UNICEF’s efforts to protect the rights of children in among others Bangladesh, Democratic Republic of Congo, Iraq, Nigeria, South Sudan, Syria, and Yemen. Additionally, renewed violence in Myanmar led to a massive arrival of Rohingya refugees to Bangladesh, many of whom were children, in August 2017.
By the end of 2017, UNICEF humanitarian appeals amounted to $3.79 billion to assist 136 million people, including 60 million children. While the total amount of funding from partners in 2017 was similar to the previous year, given the extraordinary number of affected children, resources fell short. More than half of the total funds available went to Syrian refugees living in neighbouring host countries, South Sudan and Yemen.
On the other hand, only 2 per cent of the total funds available covered nine emergencies: Angola, Burundian refugees, the Caribbean hurricanes, the Democratic People’s Republic of Korea, Djibouti, Eritrea, Libya, Mali and Nepal. Needs often went unmet for large-scale protracted crises such as in the Democratic Republic of the Congo, for which only 43 per cent of the funding requested was secured.
Of the total humanitarian revenue, $1,939 million or 91% came from the public sector, while the remaining $188 million or 9% was provided by the private sector.
On the map, you will find examples of results UNICEF and partners achieved in some of the major humanitarian responses and the corresponding funding received and shortfalls for 2017.
UNICEF COMPENDIUM OF RESOURCE PARTNER CONTRIBUTIONS 2017 1716

18
THEMATIC CONTRIBUTIONS RECEIVED, 2017
Thematic funds are soft-earmarked pooled funds categorized as Other Resources that directly support the achievement of key results aligned with the Strategic Plan. These funds allow for long-term planning, sustainability and savings in transaction costs for both UNICEF and its Resource Partners.
In 2017, overall thematic funding for the seven Strategic Plan outcome areas and Gender was $199 million, and thematic humanitarian was $164 million. This represents an increase in thematic funding of 16% versus 2016. For the second time, partners contributed thematic funds for Gender programming. Thematic funding accounted for
8% of total earmarked Other Resources funding, which is at the same level as in 2016.
The top 10 resource partners to thematic funding contributed $289 million or 80% of the total thematic contributions to UNICEF. These partners provided 87% of total thematic funding for the Strategic Plan outcome areas including Gender, and 70% of humanitarian thematic funding.
The top three partners comprised the Governments of Norway and Sweden, and the National Committee of Germany. These three partners contributed 50% of thematic funding from the top 10 partners.
Humanitarian$164 M 45%
Social Inclusion$5 M1%
Child Protection$27 M8%
Education$87 M24%
Nutrition$17 M5%
Gender$1 M0%
HIV and AIDS
$13 M4%
Water, Sanitation
and Hygiene
$33 M9%
Health$16 M4%
TOTAL$363M
Total
Thematic Other Resources (regular)
Thematic Other Resources (emergency)
Nor
way
Swed
en
Uni
ted
Stat
es
of A
mer
ica
NC
Repu
blic
of
Kore
a N
C
Uni
ted
King
dom
NC
Japa
n N
C
Ger
man
y N
C
Net
herla
nds
Den
mar
k
Spai
n N
C
71.2
8.111.8
16.021.0
24.929.832.132.4
42.1
US
$ m
illio
ns
0
10
20
30
40
50
60
70
80
71.2
0.814.3
4.83.7
14.0
1.6
42.1
7.311.7
1.616.2
21.120.9
8.918.1
30.8
0.1
Thematic Other Resources (regular)
Thematic Other Resources (emergency)
Non-thematic
$3,798 M $3,857 M $3,938 M $4,677 M
0
20
40
60
80
100
0
20
40
60
80
100
120
91% 90% 92% 92%
4% 5% 4% 4%6% 5% 4% 4%
2014 2015 2016 2017
Thematic Contributionsby Sector, 2017
Other Resources Contributions Received 2014-2017: Thematic vs Non-thematic1
Top 10 Resource Partners to Thematic Funding by Contributions Received, 2017
1 2014-16 contributions received restated to reflect change in accounting policy for comparison with 2017.

UNICEF COMPENDIUM OF RESOURCE PARTNER CONTRIBUTIONS 2017 19
PARTNERSHIPS WITH MULTI-LATERALS CONTRIBUTE TO RESULTS FOR CHILDREN
Policies and strategies of Global Programme Partnerships (GPPs) and International Financial Institutions (IFIs) informed and shaped partnership opportunities and resources in support of programme countries, especially those affected by fragility, violence and conflict.
In 2017, UNICEF steered new breakthrough strategic partnerships for children, including in countries affected by fragility, violence and conflict. Two Strategic Partnership Frameworks were signed with the WBG - International Development Association and Islamic Development Bank, providing opportunities for systemic engagement at the global, regional and country levels under a global umbrella.
Leveraging GPP opportunitiesUNICEF continued close engagement with the Secretariats and Boards of GPPs in 2017, including Gavi, the Vaccine Alliance, the Global Partnership for Education (GPE) and the Global Fund. Focus remains on support to programme countries in accessing and implementing GPP funding through support at global, regional and country level, including direct engagement of UNICEF country offices in local partner coordination mechanisms. Funds managed by UNICEF from Gavi, the Global Fund and GPE – including via programme countries –were $165.6 million, $54.9 million and $52.3 million respectively in 2017 in support of more than 50 countries.
Innovative FinancingTo catalyze resources to deliver on the sustainable development goals commitments, innovative financing approaches play an increasingly important role in development finance. UNICEF’s Vaccine Independence Initiative (VII) counts among its first successfully implemented innovative financing initiatives. Through VII, UNICEF gives countries access to short-term bridge funding so that they can purchase vaccines while waiting for the release of national budget funds. The financing helps countries secure a sustainable supply of life-saving vaccines and other important health commodities. In 2017, VII’s funding more than doubled from $15 million to $35 million mainly thanks to a $15 million financial guarantee from the Bill & Melinda Gates Foundation. Another example is UNICEF’s Public Finance for Children (PF4C) Framework, which contributes to the realization of children’s rights by supporting the best possible use of countries’ public budgets. Going forward, UNICEF will continue to explore public-private partnerships across the humanitarian-development nexus to develop products, financial innovations and technologies in the design and delivery of key services. These partnerships would include for example blended finance in water sanitation and hygiene (WASH) that combine private sector know-how and capital investments, with public sector guarantees and concessional finance, to effectively and efficiently deliver social infrastructure financing facilitated by UNICEF’s presence on the ground.
Case Study - UNICEF, World Bank Group Supporting Vulnerable Families with Cash TransferTo build resilience and protect human capital in an active conflict, the WBG - International Development Association and UNICEF launched, the Emergency Cash Transfer Programme in Yemen in 2017. Jointly we delivered cash transfers to over 1.3 million families, totalling almost 9 million Yemenis (approximately 30 per cent of the population) in the first cycle.
This project supports vulnerable families and individuals across all Yemen with unconditional cash assistance in response to the socio-economic crisis. The WBG - International Development Association and UNICEF’s longer term objective in Yemen is to revive and strengthen national social protection mechanisms such as the social welfare fund, so that they can provide cash assistance to those in need, in a sustainable manner.
Case Study – UNICEF supports 62 countries under the Gavi Alliance Partners’ Engagement FrameworkUNICEF collaborated as an active partner of the Gavi Alliance under the Gavi Partners’ Engagement Framework to improve equitable coverage, which in 2017 supported 62 priority countries. UNICEF provided support in strategic areas critical to reach every woman and every child with life-saving vaccines: supply chain, data, demand and sustainability. Highlights include the roll-out of the cold chain equipment platform that has enabled countries, such as Haiti, to move towards a fully solarized cold chain system thus harnessing renewable energy. Furthermore, UNICEF is working with the Gavi Alliance in several countries to address immunization inequities that are especially high in urban slums which require targeted strategies and solutions.
Mothers and children lining up during the second round of the community-based Polio immunization campaign, targeting more than 5 million children, particularly from 9 months to five years old in Myanmar, April 2017. © UNICEF/UN059882/Thame
20
2014 2015 2016 2017
100
200
300
400
500
600
700
800
211173
170
171
US
$ m
illio
ns 492
430
359
696
281 257
190
525
Total Other Resources (emergency)Other Resources (regular)
2014 2015 2016 2017
100000
200000
300000
400000
500000
600000
700000
800000
160178
285
167
US
$ m
illio
ns 356
350
498
346
196 172
213
179
Total Other Resources - EmergencyOther Resources - Regular
CONTRIBUTIONS RECEIVED THROUGH INTER-ORGANIZATIONAL ARRANGEMENTS, 2014-20171,2
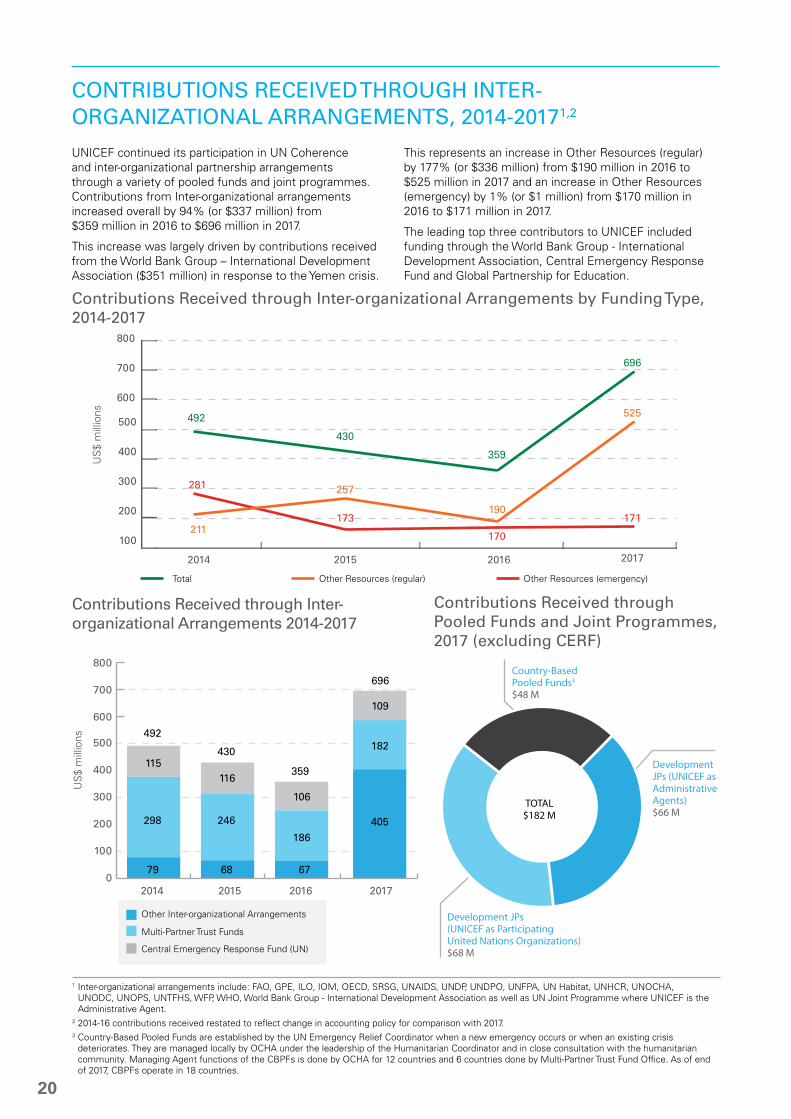
UNICEF continued its participation in UN Coherence and inter-organizational partnership arrangements through a variety of pooled funds and joint programmes. Contributions from Inter-organizational arrangements increased overall by 94% (or $337 million) from $359 million in 2016 to $696 million in 2017.
This increase was largely driven by contributions received from the World Bank Group – International Development Association ($351 million) in response to the Yemen crisis.
This represents an increase in Other Resources (regular) by 177% (or $336 million) from $190 million in 2016 to $525 million in 2017 and an increase in Other Resources (emergency) by 1% (or $1 million) from $170 million in 2016 to $171 million in 2017.
The leading top three contributors to UNICEF included funding through the World Bank Group - International Development Association, Central Emergency Response Fund and Global Partnership for Education.
Contributions Received through Inter-organizational Arrangements by Funding Type, 2014-2017
0
100
200
300
400
500
600
700
800
2014 2015 2016 2017
492
115
298
79
116
246
68
106
186
67
109
182
405
430
359
696
Other Inter-organizational Arrangements
Multi-Partner Trust Funds
Central Emergency Response Fund (UN)
US
$ m
illio
ns
0
100
200
300
400
500
600
700
800
2010 2011 2012 2013 2014 2015 2016
US
$ m
illio
ns
Contributions Received through Inter- organizational Arrangements 2014-2017
Contributions Received throughPooled Funds and Joint Programmes, 2017 (excluding CERF)
Development JPs (UNICEF as Participating United Nations Organizations) $68 M
Development JPs (UNICEF as Administrative Agents) $66 M
Country-Based Pooled Funds3 $48 M
TOTAL$182 M
1 Inter-organizational arrangements include: FAO, GPE, ILO, IOM, OECD, SRSG, UNAIDS, UNDP, UNDPO, UNFPA, UN Habitat, UNHCR, UNOCHA, UNODC, UNOPS, UNTFHS, WFP, WHO, World Bank Group - International Development Association as well as UN Joint Programme where UNICEF is the Administrative Agent.
2 2014-16 contributions received restated to reflect change in accounting policy for comparison with 2017.3 Country-Based Pooled Funds are established by the UN Emergency Relief Coordinator when a new emergency occurs or when an existing crisis
deteriorates. They are managed locally by OCHA under the leadership of the Humanitarian Coordinator and in close consultation with the humanitarian community. Managing Agent functions of the CBPFs is done by OCHA for 12 countries and 6 countries done by Multi-Partner Trust Fund Office. As of end of 2017, CBPFs operate in 18 countries.

UNICEF COMPENDIUM OF RESOURCE PARTNER CONTRIBUTIONS 2017 21
UN JOINT RESULTS FOR CHILDREN
Achieving the goals set out in the 2030 Agenda and the yearly $5 trillion resource investment requires improved financing mechanisms, innovative approaches, pooling of resources and enhanced UN partnerships. The interdisciplinary nature of the Sustainable Development Goals also calls for an integrated multi-sectorial and multi-partner approach to support national development plans. Building on these, UNICEF Strategic Plan 2018-2021 has now incorporated UN partnerships and strengthening coherence as one of the critical change strategies to deliver results with targets to measure the participation of UNICEF in Joint Programmes/Pooled Funds:
In 2017, overall contributions to UNICEF from pooled funds and joint programmes were $182 million, a 39% decrease, compared to $298 million in 2014.
Pooled funds at the global level:Central Emergency Response Fund (CERF): Since its establishment, CERF has supported UNICEF’s humanitarian operations in almost 100 countries with millions of children receiving critical lifesaving, and protecting programmes. By the end of 2017, this support surpassed $1.2 billion with aid delivered in complex and protracted crises which remain unheard, unseen, and underfunded. The funding was also critical for supporting response in acute emergencies. In 2017, UNICEF received $108.9 million in CERF grants, 26 countries received support through the rapid response window, while 13 countries received support through the under-funded window. UNICEF fully supports the Secretary General’s call to increase the CERF to $1 billion. A larger and more robust CERF is critical to providing more life-saving assistance for millions of children and their families.
Pooled funds at the country level:Health Development Fund: The Health Development Fund (HDF) is a pooled fund arrangement established to strengthen the health system in Zimbabwe aligned with the country’s national health strategy and United Nations Development Assistance Framework priorities. It covers the period 2016-2020; targets women, children, adolescents and sets a target of reducing both maternal and under-five mortality rates by 50%. In 2017, 1,520 new village health workers were trained to provide a comprehensive package of basic
preventive, promotive and curative health, nutrition, Water, Sanitation and Hygiene and HIV and AIDS services including in cross-cutting issues such as gender, psychosocial support, communication for development and disability. Nearly, 41,000 pregnant women (with 45,000 targeted by year end) were referred from the community to health facilities for antenatal care booking before 14 weeks by September 2017. UNICEF, UNAIDS and UNFPA, are supporting the finalization of the Community Systems Strengthening Framework. It builds a foundation for the development of a broader community health worker strategy in Zimbabwe. The fund has attracted several donors including Department for International Development (DFID), European Union, Global Affairs Canada and Irish Aid.
Emergency Cash Transfers:The World Food Programme (WFP) and UNICEF supported the Government of Dominica in providing Emergency Cash Transfers (ECT) to 25,000 people most affected by Hurricane Maria. The ECT programme was built on the existing Public Assistance Programme run by the Ministry of Social Services, Family and Gender Affairs. For three months 8,300 families received a payment of between S$90 and US$239 per month depending on the number of children in the household to meet their basic needs, including food, clothes, hygiene items, and school supplies for children. Implementation was made possible thanks to the contributions of DFID, the US Agency for International Development (USAID), Canada, CERF, the Swedish International Development Agency and MasterCard.
Country-based Pooled Funds (CBPF):Since the 2005 Humanitarian Reform agenda, UNICEF has been a top recipient of CBPFs, having received over $610 million in grant allocations during the period 2007 - 2017. In 2017, UNICEF received 21 per cent of all CBPFs allocations. The funding has supported UNICEF’s humanitarian operations in 12 countries, with millions of children and their communities reached. A total of $48.3 million was allocated for critical UNICEF programmes in Afghanistan, the Central African Republic, Ethiopia, Iraq, Nigeria, Pakistan, Somalia, South Sudan, State of Palestine, Sudan, Syria, and Yemen.
The Joint Fund for Agenda 2030 is a key instrument within the UN Reform and a catalytic grant for UN country teams to unblock key policy bottlenecks inhibiting the advancement of 2030 Agenda and unlocking SDG financing in support of SDG implementation by governments. Approximately $91.5 million has been committed has been committed by Governments of Ireland, European Union, Germany, Luxembourg, Spain, Swiss Development Cooperation, Sweden, and US.

22
TOTAL UNICEF REVENUE, 2016-2017
US $ millions
20161 2017 Change in $M Change in %
1.Governments and Inter-governmental Organizations2 3,316 3,870 553 17%
a) Regular Resources 574 580 6 1%
b) Other Resources 2,743 3,290 547 20%
i. Regular 1,053 1,529 476 45%
ii. Emergency 1,690 1,761 71 4%
2. National Committees, Non-Governmental, and other Private Sector Sources3 1,396 1,710 314 22%
a) Regular Resources4 622 706 84 13%
b) Other Resources 774 1,004 230 30%
i. Regular 614 816 202 33%
ii. Emergency 160 188 28 17%
3. Inter-organizational Arrangements5 357 859 502 141%
a) Regular Resources
b) Other Resources 357 859 502 141%
i. Regular 192 681 489 255%
ii. Emergency 165 178 13 8%
SUB-TOTAL REVENUE 5,070 6,439 1,369 27%
4. Other revenue (Regular Resources)6 121 138 17 14%
GRAND TOTAL REVENUE 5,191 6,577 1,386 27%
¹ 2016 revenue restated to reflect change in accounting policy for comparison with 2017.2 Inter-governmental organizations include: EC, IDB, OFID and UNITAID.3 Revenue from private sector includes global funds, foundations, NGOs, UNICEF National Committees and UNICEF Country Office private
sector fundraising.4 2017 actual includes $36 million contributions for specific management activities.5 Inter-organizational arrangements include: FAO, GPE, ILO, IOM, OECD, SRSG, UNAIDS, UNDP, UNDPO, UNFPA, UN Habitat, UNHCR, UNOCHA,
UNODC, UNOPS, UNTFHS, WFP, WHO, World Bank Group - International Development Association as well as UN Joint Programme where UNICEF is the Administrative Agent.
6 Other revenue includes income from interest, procurement services and other sources.

UNICEF COMPENDIUM OF RESOURCE PARTNER CONTRIBUTIONS 2017 23
FUNDING GAPS BY STRATEGIC PLAN OUTCOME AREA
For the 2014-2017 quadrennium, five of the seven Strategic Plan outcome areas recorded a positive fulfilment against original planned amounts largely due to an increase in Other Resources (emergency). Emergency appeals through the Humanitarian Action for Children (HAC) were however only funded approximately 50% over the same
quadrennium. The HIV and AIDS and Social Inclusion outcome areas recorded funding gaps against plan of 53% and 27%, respectively. Regular Resources were under-funded against planned amounts for four of the seven outcome areas, including Health; HIV and AIDS; Water, Sanitation and Hygiene; and Education.
RR funding gaps impact results
¹ Expenses as proxy for funding.
Mali case studyIn Mali, the availability of Regular Resources was instrumental to close the critical humanitarian funding shortfall of $28.2 million to address severe and acute malnutrition for children under-5.
In 2017, although the funding targets to cover the procurement of ready-to-use therapeutic food for the treatment of severely malnourished children in Mali were met, an important funding gap remained for nutrition prevention activities, with only $1.2 million of the planned $7.6 million budget.
This affected implementation of activities such as
• the prevention and treatment of micronutrient deficiencies. For example, less than 40% of children under-5 in Mali received the required doses of vitamin A supplementation in 2017.
• the promotion of infant and young child feeding practices especially in regions of the North and central affected by the security crisis. The percentage of infants less than 6 months exclusively breastfed remained very low in 2017, with a national average of 37% and rates as low as 9.5% and 22% in Gao and Timbuktu respectively – two regions directly affected by the security crisis.
Yemen case studyMore could have been done had 2017 regular resource targets been met in Yemen. For example, UNICEF, could have:
• printed one million birth certificates for children who had not previously been registered. Without such registration, many children struggle to access basic services.
• better supported the development of Standard Operating Procedures to establish referral pathways for child protection case managers and other service providers. This would ensure children are identified and receive the appropriate treatment for a range of protection issues.
Outcome
Planned 2014-2017 (US$ millions) Expenses 2014-2017 (US$ millions)1 Funding Fulfiment vs. Planned 2014-17 (%)
Regular Resources
Other Resources (regular)
Other Resources
(emergency) Total
ResourcesRegular
ResourcesOther
Resources (regular)
Other Resources
(emergency) Total
ResourcesRegular
ResourcesOther
Resources (regular)
Other Resources
(emergency) Total
Resources
Health 1,023 2,331 1,429 4,783 929 1,135 3,207 5,271 -9.2% -51.3% 124.3% 10.2%
HIV and AIDS
183 416 255 854 146 21 233 400 -19.9% -95.1% -8.5% -53.1%
WASH 548 1,248 766 2,562 460 1,833 1,270 3,563 -16.0% 46.8% 65.9% 39.1%Nutrition 365 832 511 1,708 460 1,086 831 2,377 25.9% 30.5% 62.8% 39.1%
Education 730 1,665 1,021 3,416 611 1,465 2,048 4,125 -16.3% -12.0% 100.6% 20.7%Child Protection
438 999 612 2,049 637 896 921 2,453 45.3% -10.3% 50.4% 19.7%
Social Inclusion
365 832 511 1,708 503 327 423 1,253 37.8% -60.8% -17.1% -26.7%
Totals 3,652 8,323 5,105 17,080 3,746 6,762 8,934 19,442 2.6% -18.8% 75.0% 13.8%
Strategic Plan Integrated Results and Resources Framework by Outcome Area, 2014-2017 – Planned Amounts, Expenses and Funding Gaps (US$ millions)

24
GLOBAL AID ENVIRONMENT, 20171
In 2017, net Official Development Aid (ODA) by members of the Organization for Economic Cooperation and Development (OECD) Development Assistance Committee (DAC), was $146.6 billion, representing a slight fall of 0.6% in real terms versus 2016. As a share of gross national income, ODA also fell marginally from 0.32% to 0.31%. The fall reflects the decline of the refugee crisis. Excluding in-donor refugee costs, ODA increased by 1.1% in real terms
compared to 2016, and has doubled since 2000. The data estimates for bilateral ODA to Africa was about $29 billion, with aid to sub-Saharan Africa around $25 billion, reflecting an increase of about 3% in both. Preliminary estimates show that net bilateral ODA flows from DAC countries to the group of least developed countries increased by 4% in real terms to about $26 billion.
¹ OECD (2018), "Detailed aid statistics: Official and private flows", OECD International Development Statistics (database), http://dx.doi.org/10.1787/data-00072-en (accessed on 12 April 2018).
Uni
ted
Stat
esG
erm
any
Uni
ted
King
dom
Japa
nFr
ance
Ital
ySw
eden
Net
herla
nds
Can
ada
Nor
way
Switz
erla
ndAu
stra
liaSp
ain
Den
mar
kKo
rea
Bel
gium
Aus
tria
Finl
and
Irela
ndPo
land
New
Zea
land
Luxe
mbo
urg
Portu
gal
Gre
ece
Cze
ch R
epub
licH
unga
rySl
ovak
Rep
ublic
Slov
enia
Icel
and
Tota
l DAC
35.3
2.4 2.2 2.2 1.2 1.1 1.1 0.8 0.7 0.4 0.4 0.4 0.3 0.3 0.1 0.1 0.1 0.1
11.411.5
17.9
US
$ bi
llion
s
Total
Thematic ORR
Thematic ORE
Norway
Sweden
United States
of America
NC
Republic of K
orea NC
United Kingdom NC
Japan NC
Germany N
C
Netherlands
Denmark
Spain NC
71.2
8.111.8
1621.0
24.929.832.132.4
42.1
US
$ bi
llion
s
0
5
10
15
20
25
30
35
40
0
5
10
15
20
25
30
35
24.7
3.1 3.0
146.6
5.7 5.5 5.0 4.3 4.1
Swed
enLu
xem
bour
gN
orw
ayD
enm
ark
Uni
ted
King
dom
Ger
man
yN
ethe
rland
sSw
itzer
land
Bel
gium
Fran
ceFi
nlan
dA
ustr
iaIre
land
Ital
yIc
elan
dC
anad
aN
ew Z
eala
ndJa
pan
Aus
tral
iaSp
ain
Uni
ted
Stat
esPo
rtug
alSl
oven
iaG
reec
eKo
rea
Cze
ch R
epub
licPo
land
Slov
ak R
epub
licH
unga
ryTo
tal D
ACAv
erag
eco
untr
y ef
fort
As
% o
f G
NI
0.0
0.2
0.4
0.6
0.8
1.0
1.2
Total
Thematic ORR
Thematic ORE
71.2
42.1
US
$ bi
llion
s
0.0
0.2
0.4
0.6
0.8
1.0
1.2
1.0 1.0 1.0
0.7 0.70.7
0.6
0.5 0.5 0.4 0.4
0.3 0.3 0.3 0.30.3 0.2 0.2 0.2
0.2 0.2 0.20.2 0.2
0.3
0.4
0.1 0.1 0.1 0.1 0.1
Net ODA in 2017 - as a percentage of GNI
Net ODA in 2017 - amounts

UNICEF COMPENDIUM OF RESOURCE PARTNER CONTRIBUTIONS 2017 25
39.229.4
25.417.7
13.39.58.9
7.35.85.6
4.54.03.93.63.2
2.42.11.91.61.41.10.70.60.50.30.30.20.20.1
78,57855,126
79,31070,667
58,50448,578
38,71479,207
46,74145,549
56,11144,945
42,96360,368
30,88239,130
52,476
27,39340,655
33,28747,126
20,38822,619
19,73913,572
17,43817,690
13,964
40,333
NorwaySwedenIceland
Luxembourg
NetherlandsDenmark
United Kingdom
FinlandSwitzerland
IrelandGermany
BelgiumUnited States
Canada
AustraliaJapan
New Zealand
Republic of Korea
SpainFrance
AustriaItaly
SloveniaPortugal
Hungary
PolandCzech Republic
GreeceSlovakia
US$ millions01020 0 20000 40000 60000 80000
0 5 10 15 20 25 30 35 40
3040
DEVELOPMENT ASSISTANCE COMMITTEE (DAC) MEMBER GOVERNMENTS, TOTAL CONTRIBUTIONS RECEIVED TO UNICEF COMPARED TO ODA, ODA PER CAPITA AND GNI PER CAPITA, 20171
This table ranks resource partner countries total contribution to UNICEF per capita. Total UNICEF contributions include Government and National Committee sources for any given country. In 2017, Norway maintained the first position with a
$39.2 per capita contribution, with Sweden in second position with a $29.4 per capita contribution, followed by Iceland that moved up with a $25.4 per capita contribution.
Govt US$
NatComUS$
TotalUS$
Total ODAUS$ millions
ODA per capitaUS$
GNI per capitaUS$
ODA as %of GNI
Resource Partner countries 2017 2017 2017 20172 2017 20173 20172
Norway 36.61 2.61 39.23 4,123 778 78,578 0.99Sweden 20.87 8.55 29.42 5,512 557 55,126 1.01Iceland 10.03 15.38 25.42 69 230 79,310 0.29Luxembourg 11.85 5.83 17.68 424 707 70,667 1.00Denmark 9.67 3.63 13.30 2,401 421 58,504 0.72Netherlands 6.06 3.42 9.48 4,955 291 48,578 0.60
United Kingdom 7.87 1.02 8.89 17,940 271 38,714 0.70Switzerland 4.65 2.66 7.32 3,097 364 79,207 0.46Finland 2.21 3.64 5.85 1,054 192 46,741 0.41Germany 4.47 1.16 5.63 24,681 301 45,549 0.66Ireland 3.36 1.17 4.54 808 168 56,111 0.30Canada 3.57 0.39 3.96 4,277 117 44,945 0.26Belgium 2.39 1.53 3.92 2,204 193 42,963 0.45United States 2.51 1.05 3.56 35,261 109 60,368 0.18Republic of Korea 0.75 2.43 3.18 2,205 43 30,882 0.14Japan 1.34 1.04 2.38 11,475 90 39,130 0.23Australia 1.63 0.51 2.14 2,957 121 52,476 0.23New Zealand 1.20 0.69 1.89 436 93 40,333 0.23Spain 0.11 1.48 1.59 2,415 52 27,393 0.19France 0.48 0.93 1.41 11,363 175 40,655 0.43Italy 0.47 0.68 1.14 5,734 97 33,287 0.29Austria 0.34 0.36 0.70 1,230 141 47,126 0.30Portugal 0.02 0.57 0.59 378 37 20,388 0.18Slovenia 0.03 0.46 0.49 76 36 22,619 0.16Hungary 0.30 0.04 0.34 149 15 13,964 0.11Czech Republic 0.02 0.26 0.29 272 26 19,739 0.13Poland 0.04 0.17 0.21 674 18 13,572 0.13Greece 0.00 0.16 0.16 317 28 17,690 0.16Slovakia 0.06 0.05 0.11 113 21 17,438 0.12Average Total 2.68 1.17 3.85 146,600 139 43,503 0.32
Source: OECD/DAC online - Total ODA & GNI from DAC countries
Contributions Per Capita to UNICEF, 2017 Gross National Income Per Capita, 2017
¹ The population figures are taken from the UNFPA State of the World Report 2017.2 OECD (2018), "Detailed aid statistics: Official and private flows", OECD International Development Statistics (database), http://dx.doi.org/10.1787/data-00072-en (accessed on 12 April 2018).3 Weighted average GNI per capita 2017.
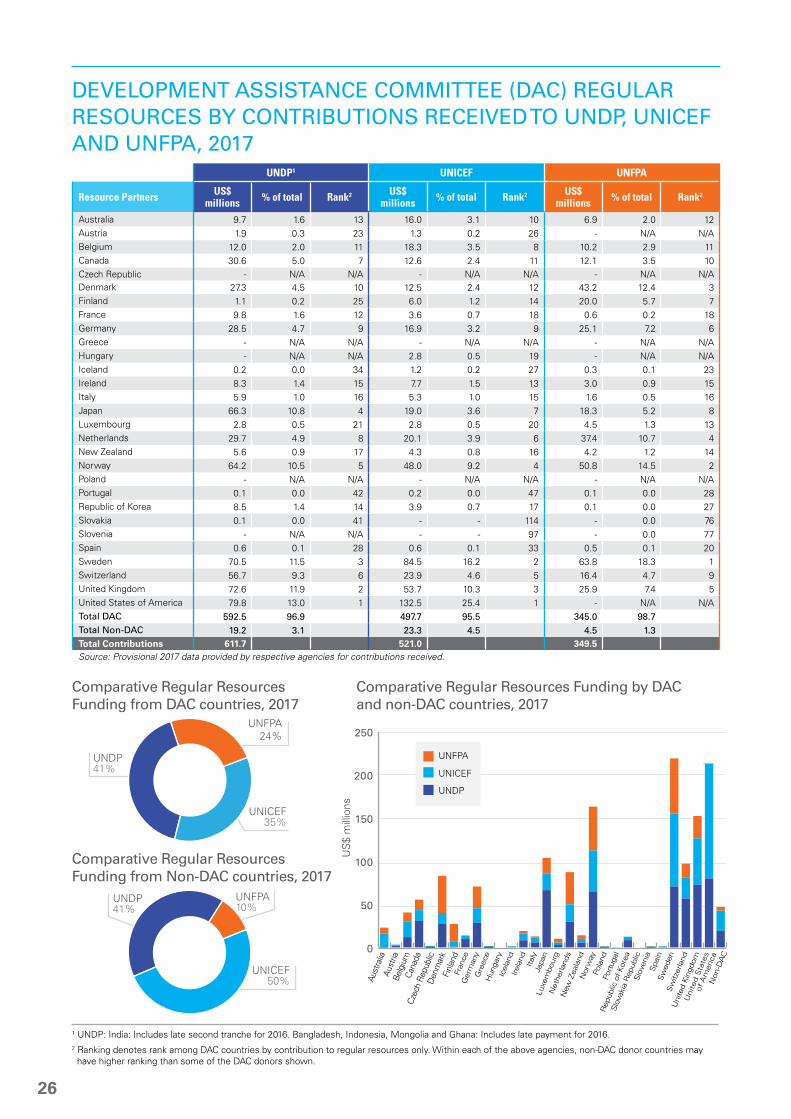
26
DEVELOPMENT ASSISTANCE COMMITTEE (DAC) REGULAR RESOURCES BY CONTRIBUTIONS RECEIVED TO UNDP, UNICEF AND UNFPA, 2017
UNDP1 UNICEF UNFPA
Resource Partners US$ millions % of total Rank2 US$
millions % of total Rank2 US$ millions % of total Rank2
Australia 9.7 1.6 13 16.0 3.1 10 6.9 2.0 12Austria 1.9 0.3 23 1.3 0.2 26 - N/A N/ABelgium 12.0 2.0 11 18.3 3.5 8 10.2 2.9 11Canada 30.6 5.0 7 12.6 2.4 11 12.1 3.5 10Czech Republic - N/A N/A - N/A N/A - N/A N/ADenmark 27.3 4.5 10 12.5 2.4 12 43.2 12.4 3Finland 1.1 0.2 25 6.0 1.2 14 20.0 5.7 7France 9.8 1.6 12 3.6 0.7 18 0.6 0.2 18Germany 28.5 4.7 9 16.9 3.2 9 25.1 7.2 6Greece - N/A N/A - N/A N/A - N/A N/AHungary - N/A N/A 2.8 0.5 19 - N/A N/AIceland 0.2 0.0 34 1.2 0.2 27 0.3 0.1 23Ireland 8.3 1.4 15 7.7 1.5 13 3.0 0.9 15Italy 5.9 1.0 16 5.3 1.0 15 1.6 0.5 16Japan 66.3 10.8 4 19.0 3.6 7 18.3 5.2 8Luxembourg 2.8 0.5 21 2.8 0.5 20 4.5 1.3 13Netherlands 29.7 4.9 8 20.1 3.9 6 37.4 10.7 4New Zealand 5.6 0.9 17 4.3 0.8 16 4.2 1.2 14Norway 64.2 10.5 5 48.0 9.2 4 50.8 14.5 2Poland - N/A N/A - N/A N/A - N/A N/APortugal 0.1 0.0 42 0.2 0.0 47 0.1 0.0 28Republic of Korea 8.5 1.4 14 3.9 0.7 17 0.1 0.0 27Slovakia 0.1 0.0 41 - - 114 - 0.0 76Slovenia - N/A N/A - - 97 - 0.0 77Spain 0.6 0.1 28 0.6 0.1 33 0.5 0.1 20Sweden 70.5 11.5 3 84.5 16.2 2 63.8 18.3 1Switzerland 56.7 9.3 6 23.9 4.6 5 16.4 4.7 9United Kingdom 72.6 11.9 2 53.7 10.3 3 25.9 7.4 5United States of America 79.8 13.0 1 132.5 25.4 1 - N/A N/ATotal DAC 592.5 96.9 497.7 95.5 345.0 98.7Total Non-DAC 19.2 3.1 23.3 4.5 4.5 1.3Total Contributions 611.7 521.0 349.5Source: Provisional 2017 data provided by respective agencies for contributions received.
¹ UNDP: India: Includes late second tranche for 2016. Bangladesh, Indonesia, Mongolia and Ghana: Includes late payment for 2016.2 Ranking denotes rank among DAC countries by contribution to regular resources only. Within each of the above agencies, non-DAC donor countries may have higher ranking than some of the DAC donors shown.
UNDP41%
UNICEF35%
UNFPA24%
UNDP41%
UNICEF50%
UNFPA10%
0
50
100
150
200
250
Aust
ralia
Aust
riaBe
lgiu
mCa
nada
Czec
h Re
publ
icD
enm
ark
Finl
and
Fran
ceG
erm
any
Gre
ece
Icel
and
Hun
gary
Irel
and
Ital
yJa
pan
Luxe
mbo
urg
Net
herla
nds
New
Zea
land
Nor
way
Pola
ndPo
rtug
al
Rep
ublic
of Kor
ea
Slo
vaki
a R
epub
licSlo
veni
aSpa
inSw
eden
Switz
erla
ndU
nite
d Kin
gdom
Uni
ted
Sta
tes
of A
mer
ica
Non
-DA
C
UNFPA
UNICEF
UNDP
US
$ m
illio
ns
Comparative Regular Resources Funding from DAC countries, 2017
Comparative Regular Resources Funding by DAC and non-DAC countries, 2017
Comparative Regular Resources Funding from Non-DAC countries, 2017

UNICEF COMPENDIUM OF RESOURCE PARTNER CONTRIBUTIONS 2017 27
TOTAL UNICEF REVENUE BY RESOURCE PARTNER, 2017
Resource PartnerRegular Resources Other Resources Other
Contirbutions1 TotalPublic sector Private sector Public sector Private sector Private Sector
Afghanistan 67,853 - 5,924,171 - - 5,992,024
Andorra 27,852 256,485 25,682 306,131 - 616,150
Angola 220,000 - 2,449,305 - - 2,669,305 Argentina 130,000 14,106,881 - 13,157,653 8,807,417 36,201,950
Armenia 116,590 - - - - 116,590 Australia 48,717,511 5,622,391 21,391,710 6,406,017 - 82,137,629
Austria 1,264,346 3,342,568 1,559,973 838,772 - 7,005,659 Bangladesh 50,610 - - - - 50,610
Barbados 195,575 - - - - 195,575 Belarus - - - 62,251 - 62,251
Belgium 71,871,949 9,858,031 12,019,524 6,419,865 - 100,169,368 Belize - - 500,167 - - 500,167 Benin 24,124 - - - - 24,124
Bhutan 28,553 - - - - 28,553 Bolivia (Plurinational
State of ) 40,000 - 225,000 74,457 - 339,457
Bosnia and Herzegovina - - 29,621 - - 29,621 Botswana - - 100,000 - - 100,000
Brazil 1,618,600 1,347,440 975,776 8,237,369 3,149,695 15,328,881 Bulgaria 57,500 143,943 228,289 899,472 241,330 1,570,534
Burkina Faso - - 245,863 - - 245,863 Burundi - - 117,491 - - 117,491
Cabo Verde 350,000 - - - - 350,000 Cameroon - - 21,213,113 - - 21,213,113
Canada 12,597,201 6,255,434 121,707,031 10,145,014 - 150,704,679 Central African Republic 73,237 - 6,040,817 - - 6,114,054
Chad 54,160 - 6,374,361 - - 6,428,521 Chile 77,000 1,633,994 - 1,232,787 1,547,012 4,490,794 China 1,650,469 727,857 3,073,551 10,380,412 1,388,517 17,220,806
Colombia - 1,535,145 258,598 2,910,400 1,741,190 6,445,334 Comoros 70,000 - - - - 70,000
Congo 748,450 - 1,332,589 - - 2,081,039 Costa Rica 18,476 - - 22,332 - 40,809
Côte d'Ivoire 12,600 - 34,753,166 - - 34,765,766 Croatia 52,387 461,281 - 2,062,783 1,150,688 3,727,138
Czech Republic - 2,499,678 228,854 831,725 - 3,560,257 Democratic People's
Republic of Korea 130,070 - - - - 130,070
Democratic Republic of the Congo
318,000 - 5,030,067 - - 5,348,067
Denmark 9,657,566 12,778,090 37,016,193 10,133,593 - 69,585,443 Dominican Republic 88,000 - - 221,328 - 309,328
Ecuador - 607,954 - 4,187,160 1,041,477 5,836,591 El Salvador - - - 22,547 - 22,547
Equatorial Guinea 108,612 - - - - 108,612 Estonia 336,961 - 1,127,013 - - 1,463,974
Ethiopia 292,662 - 2,552,597 - - 2,845,259 Finland 5,971,770 13,521,705 13,712,265 8,864,780 - 42,070,519 France 3,609,342 48,983,142 27,718,563 17,581,578 - 97,892,624 Gabon 89,452 - - - - 89,452
Gambia - - 2,060,229 - - 2,060,229 Georgia 155,000 - 25,000 - - 180,000
Germany 16,912,264 44,745,280 483,484,505 51,360,047 - 596,502,095 Ghana 148,512 - - - - 148,512
Greece - 1,863,328 - 332,808 - 2,196,136 Guinea 350,000 - 21,399,479 - - 21,749,479
Guinea-Bissau 621,000 - - - - 621,000 Hong Kong, China - 14,088,794 - 6,178,560 - 20,267,354
Hungary 2,796,153 358,086 - 168,646 - 3,322,884 Iceland 1,288,561 3,832,314 3,518,756 560,905 - 9,200,537
India 1,787,351 - 3,629,242 1,709,102 2,900,000 10,025,695 Indonesia 163,965 869,356 687,379 4,046,187 2,320,513 8,087,400

28
Resource PartnerRegular Resources Other Resources Other
Contirbutions1 TotalPublic sector Private sector Public sector Private sector Private Sector
Iran (Islamic Republic of)
26,408 6,658 - - - 33,066
Iraq 48,785 - - - - 48,785 Ireland 7,684,098 3,445,978 7,623,025 4,312,018 - 23,065,120
Israel - - - 51,792 - 51,792 Italy 5,312,869 35,961,088 40,575,113 4,402,869 - 86,251,939
Japan 19,018,327 111,381,634 142,003,728 21,048,514 - 293,452,203 Jordan 2,000,000 - - - - 2,000,000
Kazakhstan 176,970 - 185,000 - - 361,970 Kenya 150,000 - 10,194,175 161,058 - 10,505,232
Kuwait 200,000 - 5,050,000 3,249,388 - 8,499,388 Kyrgyzstan 50,000 - - - - 50,000
Lao People's Democratic Republic
10,700 - - - - 10,700
Lesotho 120,000 - 250,000 66,740 - 436,740 Liberia - - 2,071,274 - - 2,071,274
Liechtenstein 25,100 - 97,561 - - 122,661 Lithuania 178 - 41,057 76,406 - 117,641
Luxembourg 2,771,967 1,058,620 7,388,953 2,196,055 - 13,415,594 Madagascar - - 938,122 157,106 - 1,095,227
Malawi - - 2,981,841 - - 2,981,841 Malaysia 362,735 6,680,839 100,000 4,158,902 2,191,787 13,494,264
Mali 108,500 - - - - 108,500 Malta - - 17,773 - - 17,773
Mauritania 20,610 - 125,223 - - 145,833 Mexico 214,000 800,014 15,419 4,862,083 2,074,795 7,966,310
Monaco 26,853 - 321,711 - - 348,563 Mongolia 125,400 - - - - 125,400
Montenegro 18,912 - - - - 18,912 Morocco 101,107 - - - - 101,107 Myanmar 87,756 - - - - 87,756
Namibia 120,000 - - - - 120,000 Netherlands 273,985 40,706,494 62,819,811 17,021,150 - 120,821,440
New Zealand 253,757 1,200,770 517,635 2,703,785 - 4,675,947 Nicaragua 42,500 - - 782 - 43,282
Nigeria 2,067,455 - 15,882,944 31,746 - 17,982,145 Norway 47,970,048 9,570,687 156,022,475 5,134,214 - 218,697,423
Oman - - 900,000 - - 900,000 Pakistan 54,783 - 5,684,242 - - 5,739,024 Panama 715,000 - 300,000 2,271 - 1,017,271
Paraguay - - - 740,705 - 740,705 Peru - 253,476 - 986,938 481,021 1,721,435
Philippines 48,941 813,011 - 3,263,758 1,355,019 5,480,728 Poland - 5,068,220 1,617,287 2,594,423 - 9,279,930
Portugal 226,635 4,973,296 11,848 1,569,864 - 6,781,643 Qatar - - - 34,623,970 - 34,623,970
Republic of Korea 3,900,000 91,794,726 53,545,377 17,681,147 - 166,921,250 Republic of Moldova 60,000 - - 115,000 - 175,000
Romania 125,000 15,675 - 975,181 - 1,115,855 Russian Federation 1,000,000 - 1,400,000 15,537 - 2,415,537
Sao Tome and Principe 19,500 - - - - 19,500 Saudi Arabia 1,108,768 663 50,000 6,244,823 - 7,404,254
Senegal 60,954 - - - - 60,954 Serbia 51,000 24,661 - 430,118 186,185 691,965
Sierra Leone 384,000 - 2,610,767 - - 2,994,767 Singapore 50,000 - - 10,754 - 60,754
Slovakia 11,614 75,469 289,132 221,756 - 597,971 Slovenia 30,517 886,652 33,452 244,207 - 1,194,830
Solomon Islands - - 625,000 - - 625,000 Somalia 435,700 - - - - 435,700
South Africa - - - 923,215 474,166 1,397,380 South Sudan 190,894 - 16,250,000 - - 16,440,894
Spain 583,515 55,120,034 4,441,268 17,554,545 - 77,699,362 Sri Lanka 35,500 - - 2,319 - 37,819
Sudan 121,400 591 - - - 121,991

UNICEF COMPENDIUM OF RESOURCE PARTNER CONTRIBUTIONS 2017 29
Resource PartnerRegular Resources Other Resources Other
Contirbutions1 TotalPublic sector Private sector Public sector Private sector Private Sector
Sweden 84,527,727 42,663,598 114,519,741 42,882,695 - 284,593,760 Switzerland 23,015,855 4,647,553 14,672,479 20,011,331 - 62,347,218
Tajikistan 32,400 - (0) - - 32,400 Thailand 510,725 3,022,143 - 11,138,151 1,616,313 16,287,332
Timor-Leste 100,000 - - - - 100,000 Togo 26,000 - 5,751,217 - - 5,777,217
Trinidad Tobago 15,000 - - - - 15,000 Tunisia 17,778 - - - - 17,778 Turkey 242,715 1,814,305 1,000,000 968,098 - 4,025,118
Turkmenistan 125,246 - - - - 125,246 Uganda 469,000 - - 1,041,148 - 1,510,148 Ukraine - - - 473,001 - 473,001
United Arab Emirates 100,000 25,403 2,744,626 14,386,885 - 17,256,914 United Kingdom 53,691,275 21,174,887 484,895,706 53,865,291 - 613,627,160
United Republic of Tanzania
22,000 - 5,268,203 - - 5,290,203
United States of America
132,500,000 33,574,227 695,280,371 304,312,495 2,330,000 1,167,997,093
Uruguay 72,450 1,612,678 - 1,331,569 1,375,509 4,392,205 Uzbekistan 310,000 - - (0) - 310,000
Venezuela (Bolivarian Republic of)
- - - 177,928 37,169 215,097
Vietnam 34,254 - - - - 34,254 Zambia 257,520 - - - - 257,520
Zimbabwe - - 8,355,924 - - 8,355,924 Other 29,945 599,569 - 350,936 - 980,450
Revenue Adjustments 233,672 37,125 (353,178) (9,515,371) (30,206) (9,627,958)
Total Countries 579,896,586 668,449,921 2,717,852,238 768,613,974 36,379,597 4,771,192,316
Inter-governmental Organizations
European Commission 568,643,280 568,643,280
Islamic Development Bank
7,287,634 7,287,634
UNITAID 776,617 776,617
Revenue Adjustments (4,735,495) (4,735,495)
Total Inter-governmental Organizations
- - 571,972,035 - - 571,972,035
Non-governmental Organizations
Alliance Cote d'Ivoire 89,407 89,407
Clinton Health Access Initiative
1,424,446 1,424,446
Education Cannot Wait Fund
22,325,571 22,325,571
End Violence Fund 1,583,574 1,583,574
Nutrition International 11,774,219 11,774,219
Partners in Health 171,000 171,000
The Alexander Bodini Foundation
60,000 60,000
Gavi, The Vaccine Alliance
154,863,111 154,863,111
Global Fund 42,943,127 42,943,127
Other 1,070,039 893,815 1,963,854
Revenue Adjustments (856,326) (856,326)
Total Non-governmental Organizations
1,070,039 235,271,945 236,341,984

30
Resource PartnerRegular Resources Other Resources Other
Contirbutions1 TotalPublic sector Private sector Public sector Private sector Private Sector
Inter-Organizational Arrangements
Food and Agriculture Organization of the
United Nations (FAO) 5,201,277 5,201,277
Global Partnership for Education
46,884,058 46,884,058
International Labour Organization (ILO)
261,725 261,725
International Organization for Migration (IOM)
78,081 78,081
Organization for Economic Co-operation
and Development (OECD)
21,259 21,259
Special Representative of the Secretary-General
(SRSG) on Violence against Children
40,000 40,000
United Nations Office on Drugs and Crime
(UNODC) 865,483 865,483
United Nations Entity for Gender Equality and
the Empowerment of Women (UN Women)
378,499 378,499
Joint United Nations Programme on HIV/
AIDS (UNAIDS) 3,000,000 3,000,000
United Nations Development
Programme (UNDP) 55,712,861 55,712,861
United Nations Population Fund
(UNFPA) 8,826,928 8,826,928
United Nations High Commissioner for
Refugees (UNHCR) 1,335,570 1,335,570
United Nations Development Group
joint programmes 65,938,902 65,938,902
United Nations Office for the Coordination of
Humanitarian Affairs (UNOCHA)
143,228,953 143,228,953
United Nations Office for Project Services
(UNOPS) 7,904,993 7,904,993
United Nations Trust Fund for Human
Security (UNTFHS) 318,702 318,702
World Food Programme (WFP)
1,351,875 1,351,875
World Health Organization (WHO)
459,783 459,783
World Bank Group – International Development
Association
521,661,662 521,661,662
Revenue Adjustments (4,282,572) (4,282,572)
Total Inter-Organizational Arrangements
859,188,039 859,188,039
Total Other Revenue 138,049,228
Grand Total 579,896,586 669,519,960 4,149,012,312 1,003,885,919 36,379,597 6,576,743,603
¹ Contributions for specific managements activities.

UNICEF COMPENDIUM OF RESOURCE PARTNER CONTRIBUTIONS 2017 31
GLOSSARY
Central Emergency Response Fund (United Nations) An emergency fund administered by the United Nations Office for the Coordination of Humanitarian Affairs (UNOCHA), from which UN agencies can receive advances for financing emergency operations.
Country-Based Pooled Funds (CBPFs) Multi-donor humanitarian financing instruments established by the Emergency Relief Coordinator (ERC). They are managed by OCHA at the country-level under the leadership of the Humanitarian Coordinator (HC). Donor contributions to each CBPF are un-earmarked and allocated by the HC through an in-country consultative process.
Inter-organizational Arrangements Arrangements that include, among others, contributions received through UNAIDS, UNDG, UNDP, UNFPA, UNOCHA, UNTFHS, WHO, and the World Bank Group - International Development Association (WBG-IDA). Funding from these sources is mostly directed to humanitarian responses and includes, among other, income from various pooled funding mechanisms, such as grants from the UNOCHA managed CERF (see above) and multi-partner trust fund contributions.
Other Resources Earmarked contributions for programmes; these are supplementary to the contributions in un-earmarked Regular Resources and are made for a specific purpose such as an emergency response or a specific programme in a country or region (can be emergency o see below).
Other Resources (emergency) ORE are funds specifically provided by Resource Partners for UNICEF’s humanitarian action and post crisis recovery activities. In addition to UNICEF’s traditional resource partners, important sources of funding for ORE are the inter-organisational arrangements including the CERF and the MDTFs. Funding for ORE is raised through the UNICEF Humanitarian Action for Children (HAC), Flash Appeals, the UN consolidated Humanitarian Needs Overview (HNO), and the UN Strategic Response Plan (SRP).
Other Resources (regular) Funds for specific, non-emergency programme purposes, and strategic priorities. ORR allow UNICEF to implement the specific projects at global, regional, and country levels in support of the approved country programmes. The ORR that UNICEF uses most strategically are those that are flexible both in their purpose and in their duration.
Private Sector Funding received from a grouping of Resource Partners that includes UNICEF’s National Committees, UNICEF Country Office private sector fundraising (PSFR), NGOs, GPPs, foundations, corporations, and individuals.
Public Sector Funding received from a grouping of Resource Partners that includes governments, inter-governmental bodies, and inter-organisational arrangements.
Rapid Response Mechanism The Rapid Response Mechanism is an operational, programmatic and partnership model designed to enhance UNICEF’s capacity to respond in a timely, coordinated and predictable manner to the needs of populations made vulnerable by displacement, disease and/or natural disasters in humanitarian/ emergency settings.
Regular Resources (RR) Un-earmarked funds that are foundational to delivering results across the Strategic Plan. They mainly include, revenue from the voluntary annual contributions of governments and un-earmarked funds contributed by National Committees, which mobilize resources through fundraising appeals and ongoing relationships with individuals, civil society groups, companies, and foundations.
Strategic Plan (SP) A plan of action for UNICEF to take place from 2018-2021 that outlines the organisational priorities, the 5 goal areas, - Every child survives and thrives, Every child learns, Every child is protected from violence and exploitation, Every child lines in a safe and clean environment, Every child has an equitable chance in life, are central to driving progress towards the achievement of the 2030 Sustainable Development Goals
Thematic Funding Thematic Funding contributions are pooled funds designed to support the achievement of outcomes or results in the Strategic Plan 2018-2021 through flexible multi-year funding window and achieve UNICEF's mandate to advocate for the protection of children’s rights, to help meet their basic needs and to expand their opportunities to reach their full potential.
UNICEF National Committee (NC) Registered non-profit structures, mostly categorized as non-governmental entities established according to national laws. Committees play a key role in mobilizing resources for UNICEF’s work. In 2016, there were 34 UNICEF NCs throughout the industrialized world.

32
ABBREVIATIONS
CBPFs Country-Based Pooled Funds
CERF Central Emergency Response Fund
DAC Development Assistance Committee
EC European Commission
FAO Food and Agriculture Organisation of the United Nations
Gavi Not an abbreviation, the full name is Gavi, The Vaccine Alliance
GNI Gross National Income
GPE Global Partnership for Education
IATI International Aid Transparency Initiative
IDB Inter-American Development Bank
ILO International Labour Organization
IOM International Organisation for Migration
NC National Committee for UNICEF
NGO Non-Governmental Organisation
OCHA see UNOCHA
ODA Official Development Assistance
OECD Organisation for Economic Co-operation and Development
OFID OPEC Fund for International Development
PSFR UNICEF Country Office Private Sector Fundraising
RR Regular Resources
SAM Severe Acute Malnutrition
SDGs Sustainable Development Goals
SRSG Special Representative of the Secretary-General
UNDAF United Nations Development Assistance Framework
UN United Nations
UNAIDS Not an abbreviation or acronym, UNAIDS is the Joint United Nations Programme on HIV/AIDS
UN Habitat The United Nations Human Settlements Programme
UNDP United Nations Development Programme
UNDPO United Nations Department of Peacekeeping Operations
UNFPA United Nations Population Fund
UNHCR United Nations High Commissioner for Refugees
UNICEF United Nations Children’s Fund
UNITAID Not an abbreviation or acronym, UNITAID is an organisation hosted by WHO that uses innovative financing to increase funding for greater access to treatments and diagnostics for HIV/AIDS, malaria and tuberculosis in low-income countries, approximately half of UNITAID’s
UNOCHA United Nations Office for the Coordination of Humanitarian Affairs
UNODC United Nations Office on Drugs and Crime
UNOPS United Nations Office for Project Services
UNPRPD United Nations Partnership to Promote the Rights of Persons with Disabilities
UNSCO United Nations Special Coordinator
UNTFHS United Nations Trust Fund for Human Security
UN Women Not an abbreviation or acronym, UN Women is the United Nations Entity for Gender Equality and the Empowerment of Women
WASH Water, Sanitation and Hygiene
WBG World Bank Group - International Development Association (WBG-IDA)
WFP World Food Programme
WHO World Health Organisation


The Compendium of Resource Partner Contributions 2017 has been printed on 100 per cent PCW recycled paper.
Public Partnerships Division PPD3 United Nations Plaza
New York, NY 10017, USA
www.unicef.org/publicpartnerships
© United Nations Children’s FundMay 2017