OCC Reports Second Quarter Trading Revenue of $6.6 Billion
35
O Comptroller of the Currency Administrator of National Banks Washington, DC 20219 OCC’s Quarterly Report on Bank Trading and Derivatives Activities Second Quarter 2010 Executive Summary • The notional value of derivatives held by U.S. commercial banks increased $6.9 trillion in the second quarter, or 3.2%, to $223.4 trillion. • U.S. commercial banks reported trading revenues of $6.6 billion in the second quarter, 28% higher than $5.2 billion in the second quarter of 2009. • Credit exposure from derivatives increased in the second quarter, after five consecutive quarterly declines. Net current credit exposure increased 11%, or $38 billion, to $397 billion. • Derivative contracts remain concentrated in interest rate products, which comprise 84% of total derivative notional values. The notional value of credit derivative contracts, at $13.9 trillion, represents 6% of total notionals. Credit derivatives declined by 3.4% during the quarter. The OCC’s quarterly report on trading revenues and bank derivatives activities is based on Call Report information provided by all insured U.S. commercial banks and trust companies, reports filed by U.S. financial holding companies, and other published data. A total of 1,064 insured U.S. commercial banks reported derivatives activities at the end of the second quarter, an increase of 14 banks from the prior quarter. Derivatives activity in the U.S. banking system continues to be dominated by a small group of large financial institutions. Five large commercial banks represent 96% of the total banking industry notional amounts and 85% of industry net current credit exposure. While market or product concentrations are normally a concern for bank supervisors, there are three important mitigating factors with respect to derivatives activities. First, because this report focuses on U.S. commercial banking companies, there are a number of other providers of derivatives products whose activity is not reflected in the data in this report. Second, because the highly specialized business of structuring, trading, and managing derivatives transactions requires sophisticated tools and expertise, derivatives activity is concentrated in those banking companies that have the resources needed to be able to operate this business in a safe and sound manner. Third, the OCC and other supervisors have examiners on-site at the largest banks to continuously evaluate the credit, market, operation, reputation, and compliance risks of derivatives activities. In addition to the OCC’s on-site supervisory activities, the OCC continues to work with other financial supervisors and major market participants to address infrastructure issues in OTC derivatives, including development of objectives and milestones for stronger trade processing and improved market transparency across all OTC derivatives categories.
Transcript of OCC Reports Second Quarter Trading Revenue of $6.6 Billion
O
Comptroller of the Currency Administrator of National Banks
Washington, DC 20219
OCC’s Quarterly Report on Bank Trading and Derivatives Activities
Second Quarter 2010 Executive Summary
• The notional value of derivatives held by U.S. commercial banks increased $6.9 trillion in the second quarter, or 3.2%, to $223.4 trillion.
• U.S. commercial banks reported trading revenues of $6.6 billion in the second quarter, 28% higher than $5.2 billion in the second quarter of 2009.
• Credit exposure from derivatives increased in the second quarter, after five consecutive quarterly declines. Net current credit exposure increased 11%, or $38 billion, to $397 billion.
• Derivative contracts remain concentrated in interest rate products, which comprise 84% of total derivative notional values. The notional value of credit derivative contracts, at $13.9 trillion, represents 6% of total notionals. Credit derivatives declined by 3.4% during the quarter.
The OCC’s quarterly report on trading revenues and bank derivatives activities is based on Call Report information provided by all insured U.S. commercial banks and trust companies, reports filed by U.S. financial holding companies, and other published data. A total of 1,064 insured U.S. commercial banks reported derivatives activities at the end of the second quarter, an increase of 14 banks from the prior quarter. Derivatives activity in the U.S. banking system continues to be dominated by a small group of large financial institutions. Five large commercial banks represent 96% of the total banking industry notional amounts and 85% of industry net current credit exposure. While market or product concentrations are normally a concern for bank supervisors, there are three important mitigating factors with respect to derivatives activities. First, because this report focuses on U.S. commercial banking companies, there are a number of other providers of derivatives products whose activity is not reflected in the data in this report. Second, because the highly specialized business of structuring, trading, and managing derivatives transactions requires sophisticated tools and expertise, derivatives activity is concentrated in those banking companies that have the resources needed to be able to operate this business in a safe and sound manner. Third, the OCC and other supervisors have examiners on-site at the largest banks to continuously evaluate the credit, market, operation, reputation, and compliance risks of derivatives activities. In addition to the OCC’s on-site supervisory activities, the OCC continues to work with other financial supervisors and major market participants to address infrastructure issues in OTC derivatives, including development of objectives and milestones for stronger trade processing and improved market transparency across all OTC derivatives categories.
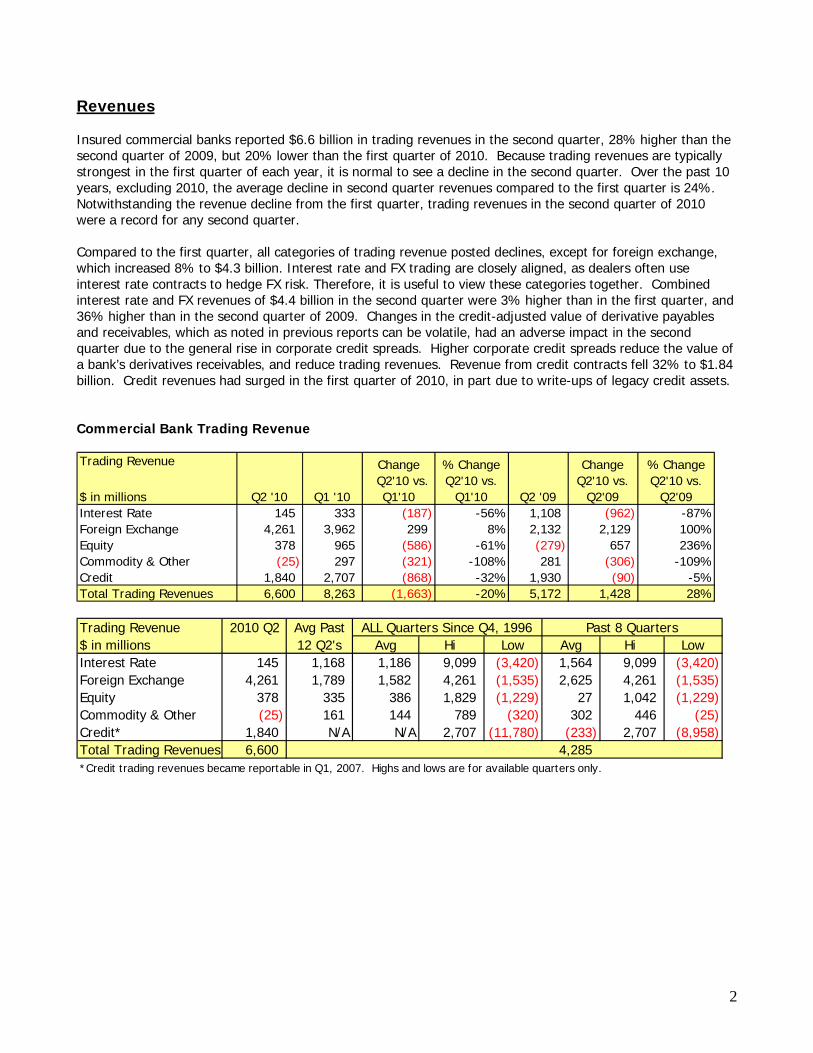
Revenues Insured commercial banks reported $6.6 billion in trading revenues in the second quarter, 28% higher than the second quarter of 2009, but 20% lower than the first quarter of 2010. Because trading revenues are typically strongest in the first quarter of each year, it is normal to see a decline in the second quarter. Over the past 10 years, excluding 2010, the average decline in second quarter revenues compared to the first quarter is 24%. Notwithstanding the revenue decline from the first quarter, trading revenues in the second quarter of 2010 were a record for any second quarter. Compared to the first quarter, all categories of trading revenue posted declines, except for foreign exchange, which increased 8% to $4.3 billion. Interest rate and FX trading are closely aligned, as dealers often use interest rate contracts to hedge FX risk. Therefore, it is useful to view these categories together. Combined interest rate and FX revenues of $4.4 billion in the second quarter were 3% higher than in the first quarter, and 36% higher than in the second quarter of 2009. Changes in the credit-adjusted value of derivative payables and receivables, which as noted in previous reports can be volatile, had an adverse impact in the second quarter due to the general rise in corporate credit spreads. Higher corporate credit spreads reduce the value of a bank’s derivatives receivables, and reduce trading revenues. Revenue from credit contracts fell 32% to $1.84 billion. Credit revenues had surged in the first quarter of 2010, in part due to write-ups of legacy credit assets. Commercial Bank Trading Revenue Trading Revenue
$ in millions Q2 '10 Q1 '10Interest Rate 145 333 (187) (962)
(586) (279)(25) (321) (306)
(868) (90)(1,663)
-56% 1,108 -87%Foreign Exchange 4,261 3,962 299 8% 2,132 2,129 100%Equity 378 965 -61% 657 236%Commodity & Other 297 -108% 281 -109%Credit 1,840 2,707 -32% 1,930 -5%Total Trading Revenues 6,600 8,263 -20% 5,172 1,428 28%
Q2 '09
Change Q2'10 vs.
Q2'09
% Change Q2'10 vs.
Q2'09
% Change Q2'10 vs.
Q1'10
Change Q2'10 vs.
Q1'10
2010 Q2Avg Hi Low Avg Hi Low
Interest Rate 145 1,168 1,186 9,099
2
(3,420) (3,420)(1,535) (1,535)(1,229) (1,229)
(25) (320) (25)(11,780) (233) (8,958)
1,564 9,099Foreign Exchange 4,261 1,789 1,582 4,261 2,625 4,261Equity 378 335 386 1,829 27 1,042Commodity & Other 161 144 789 302 446Credit* 1,840 N/A N/A 2,707 2,707Total Trading Revenues 6,600 4,285*Credit trading revenues became reportable in Q1, 2007. Highs and lows are for available quarters only.
Past 8 QuartersALL Quarters Since Q4, 1996Trading Revenue $ in millions
Avg Past 12 Q2's

$145
$4,261
$378
$(25)
$1,840
$6,600
$333
$3,962
$965
$297
$2,707
$8,263
$(1,000)
$-
$1,000
$2,000
$3,000
$4,000
$5,000
$6,000
$7,000
$8,000
$9,000
Interest Rate Foreign Exchange
Equity Commodity & Other
Credit Total
($ m
illio
ns)
2Q10 versus 1Q10 Bank Trading Revenues
2010 Q2 2010 Q1
Data Source: Call Reports. Note: Beginning 1Q07, credit exposures are broken out as a separate category.
Holding Company Trading Revenues1 To get a more complete picture of trading revenues in the banking system, it is useful to review consolidated holding company trading performance. As illustrated below, consolidated holding company trading revenues of $13.7 billion in the second quarter of 2010 were 29% lower than in the second quarter of 2009, and 50% lower than in the first quarter of 2010 (a record quarter for holding company trading revenues). While FX trading revenues increased in the second quarter from the first quarter, all other sectors showed material declines, especially credit. Credit revenues had surged in the first quarter as banking companies wrote up the value of legacy credit assets, many of which are held outside the bank, leading to the record Q1 consolidated company trading results. Holding Co. Trading Revenue
$ in millions Q2 '10 Q1 '10Interest Rate (22) (2,505) (8,390)
(3,151) (4,405)(1,497) (2,089)(7,176)
(13,756) (5,676)
2,483 -101% 8,367 -100%Foreign Exchange 6,504 5,932 572 10% 2,200 4,304 196%Equity 1,525 4,676 -67% 5,930 -74%Commodity & Other 528 2,025 -74% 2,617 -80%Credit 5,198 12,374 -58% 295 4,903 1663%Total HC Trading Revenues 13,733 27,489 -50% 19,409 -29%
% Change Q2'10 vs.
Q2'09
Change Q2'10 vs.
Q1'10
% Change Q2'10 vs.
Q1'10 Q2 '09
Change Q2'10 vs.
Q2'09
Prior to the financial crisis, bank trading revenues typically ranged from 60-80% of consolidated holding company trading revenues. Since the financial crisis, and the adoption of bank charters by the former investment banks, the percentage of bank trading revenues to consolidated company revenues has fallen into a range of 30-50%. This decline reflects the significant amount of the trading activity by the former investment banks that, while included in holding company results, remains outside the insured commercial bank. More
3
1 The OCC’s Quarterly Report on Bank Trading and Derivatives Activities focuses on the activity and performance of insured commercial banks. Discussion of consolidated bank holding company activity and performance is limited to the next three paragraphs, as well as the data in Table 2.
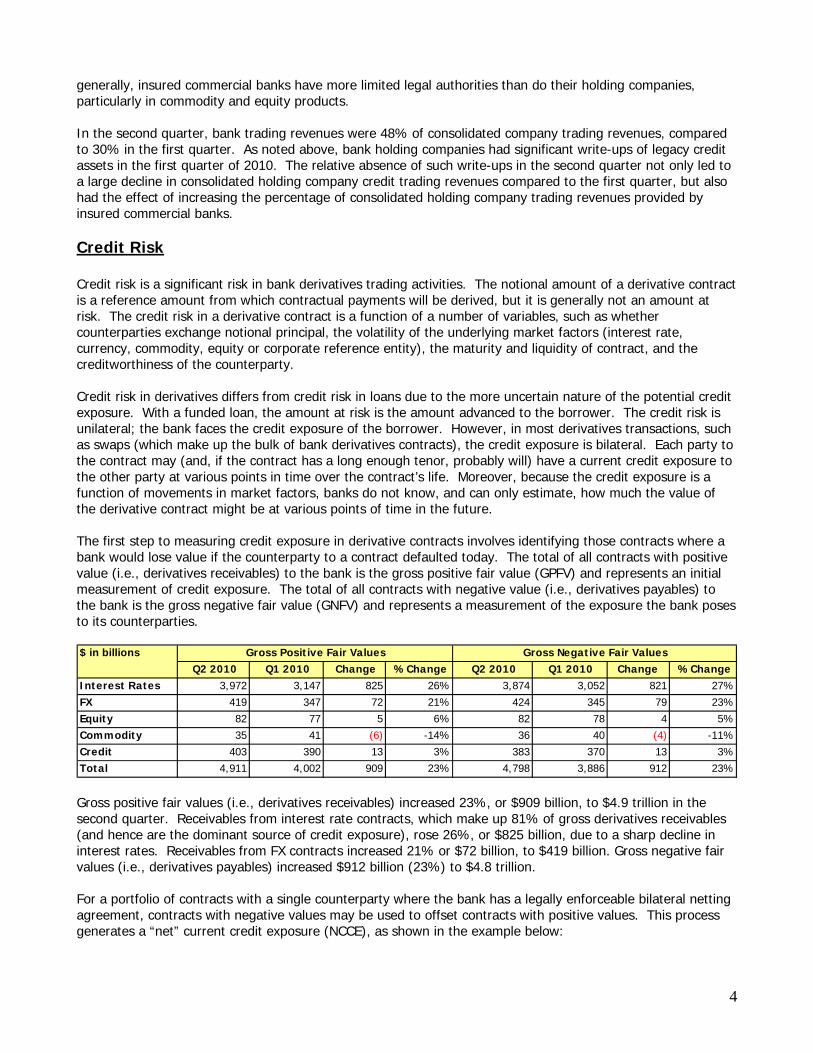
generally, insured commercial banks have more limited legal authorities than do their holding companies, particularly in commodity and equity products. In the second quarter, bank trading revenues were 48% of consolidated company trading revenues, compared to 30% in the first quarter. As noted above, bank holding companies had significant write-ups of legacy credit assets in the first quarter of 2010. The relative absence of such write-ups in the second quarter not only led to a large decline in consolidated holding company credit trading revenues compared to the first quarter, but also had the effect of increasing the percentage of consolidated holding company trading revenues provided by insured commercial banks. Credit Risk Credit risk is a significant risk in bank derivatives trading activities. The notional amount of a derivative contract is a reference amount from which contractual payments will be derived, but it is generally not an amount at risk. The credit risk in a derivative contract is a function of a number of variables, such as whether counterparties exchange notional principal, the volatility of the underlying market factors (interest rate, currency, commodity, equity or corporate reference entity), the maturity and liquidity of contract, and the creditworthiness of the counterparty. Credit risk in derivatives differs from credit risk in loans due to the more uncertain nature of the potential credit exposure. With a funded loan, the amount at risk is the amount advanced to the borrower. The credit risk is unilateral; the bank faces the credit exposure of the borrower. However, in most derivatives transactions, such as swaps (which make up the bulk of bank derivatives contracts), the credit exposure is bilateral. Each party to the contract may (and, if the contract has a long enough tenor, probably will) have a current credit exposure to the other party at various points in time over the contract’s life. Moreover, because the credit exposure is a function of movements in market factors, banks do not know, and can only estimate, how much the value of the derivative contract might be at various points of time in the future. The first step to measuring credit exposure in derivative contracts involves identifying those contracts where a bank would lose value if the counterparty to a contract defaulted today. The total of all contracts with positive value (i.e., derivatives receivables) to the bank is the gross positive fair value (GPFV) and represents an initial measurement of credit exposure. The total of all contracts with negative value (i.e., derivatives payables) to the bank is the gross negative fair value (GNFV) and represents a measurement of the exposure the bank poses to its counterparties. $ in billions
Q2 2010 Q1 2010 Change %Change Q2 2010 Q1 2010 Change %Change Interest Rates 3,972 3,147 825 26% 3,874 3,052 821 27%
FX 419 347 72 21% 424 345 79 23%Equity 82 77 5 6% 82 78 4 5%Commodity 35 41 (6) (4)-14% 36 40 -11%Credit 403 390 13 3% 383 370 13 3%Total 4,911 4,002 909 23% 4,798 3,886 912 23%
Gross Positive Fair Values Gross Negative Fair Values
Gross positive fair values (i.e., derivatives receivables) increased 23%, or $909 billion, to $4.9 trillion in the second quarter. Receivables from interest rate contracts, which make up 81% of gross derivatives receivables (and hence are the dominant source of credit exposure), rose 26%, or $825 billion, due to a sharp decline in interest rates. Receivables from FX contracts increased 21% or $72 billion, to $419 billion. Gross negative fair values (i.e., derivatives payables) increased $912 billion (23%) to $4.8 trillion. For a portfolio of contracts with a single counterparty where the bank has a legally enforceable bilateral netting agreement, contracts with negative values may be used to offset contracts with positive values. This process generates a “net” current credit exposure (NCCE), as shown in the example below:
4

Counterparty A Portfolio
# of Contracts
Value of Contracts
Credit Measure/Metric
Contracts With Positive Value
6 $500 Gross Positive Fair Value
Contracts With Negative Value
4 $350 Gross Negative Fair Value
Total Contracts 10 $150 Net Current Credit Exposure (NCCE) to Counterparty A
A bank’s net current credit exposure across all counterparties will therefore be the sum of the gross positive fair values for counterparties without legally certain bilateral netting arrangements (this may be due to the use of non-standardized documentation or jurisdiction considerations) and the bilaterally netted current credit exposure for counterparties with legal certainty regarding the enforceability of netting agreements. Net current credit exposure is the primary metric used by the OCC to evaluate credit risk in bank derivatives activities. NCCE for U.S. commercial banks increased 11% ($38 billion) to $397 billion in the second quarter, as the $909 billion increase in gross receivables (GPFV) exceeded the $871 billion increase in netting benefits. The increase in NCCE during the second quarter was the first increase since NCCE peaked at $800 billion at the end of 2008. A very sharp increase in netting benefit percentage, from 91% to a record 91.9%, prevented an even greater increase in NCCE. The netting benefit percentage reflects the amount of GPFV eliminated by having legally enforceable netting agreements. $ in billions Q210 Q110 Change %Gross Positive Fair Value (GPFV) 4,911 4,002 909 23%Netting Benefits 4,515 3,644 871 24%Netted Current Credit Exposure (NCCE) 397 359 38 11%Potential Future Exposure (PFE) 733 775 (41)
(4)
-0.8%
(81)(6)
-5%Total Credit Exposure (TCE) 1,130 1,133 0%Netting Benefit % 91.9% 91.0% 0.9% N/A10 Year Interest Swap Rate 3.02% 3.83% -21%Dollar Index Spot 86.0 81.1 4.9 6%Credit Derivative Index - North America Inv Grade 119.5 87.7 31.7 36%Credit Derivative Index - High Volatility 178.3 145.0 33.3 23%Russell 3000 Index Fund (RAY) 607.9 688.7 -12%Dow Jones-UBS Commodity Index (DJUBS) 125.7 132.2 -5%
Note: Numbers may not add due to rounding.
The second step in evaluating credit risk involves an estimation of how much the value of a given derivative contract might change in the bank’s favor over the remaining life of the contract; this is referred to as the “potential future exposure” (PFE). PFE declined 5% in the second quarter to $733 billion. The total credit exposure (PFE plus the net current credit exposure) was flat in the second quarter at $1.1 trillion as the decrease in PFE offset the increase in NCCE. The distribution of NCCE in the banking system is nearly entirely in banks/securities firms (55%) and corporations (39%). Exposure to hedge funds, sovereign governments and monoline financial firms is very small (7% in total). However, the sheer size of counterparty exposures results in the potential for major losses in these sectors. For example, notwithstanding the 1% share of NCCE to monolines, banks suffered material losses on these exposures during the credit crisis. Net Current Credit ExposureBy Counterparty Type as a % of Total NCCE Banks & Securities
FirmsMonoline
Financial FirmsHedge Funds
Sovereign Governments
Corp and All Other Counterparties
Total
Total Commercial Banks 55% 1% 2% 4% 39% 100% Top 5 Commercial Banks 58% 1% 1% 4% 36% 100%
5
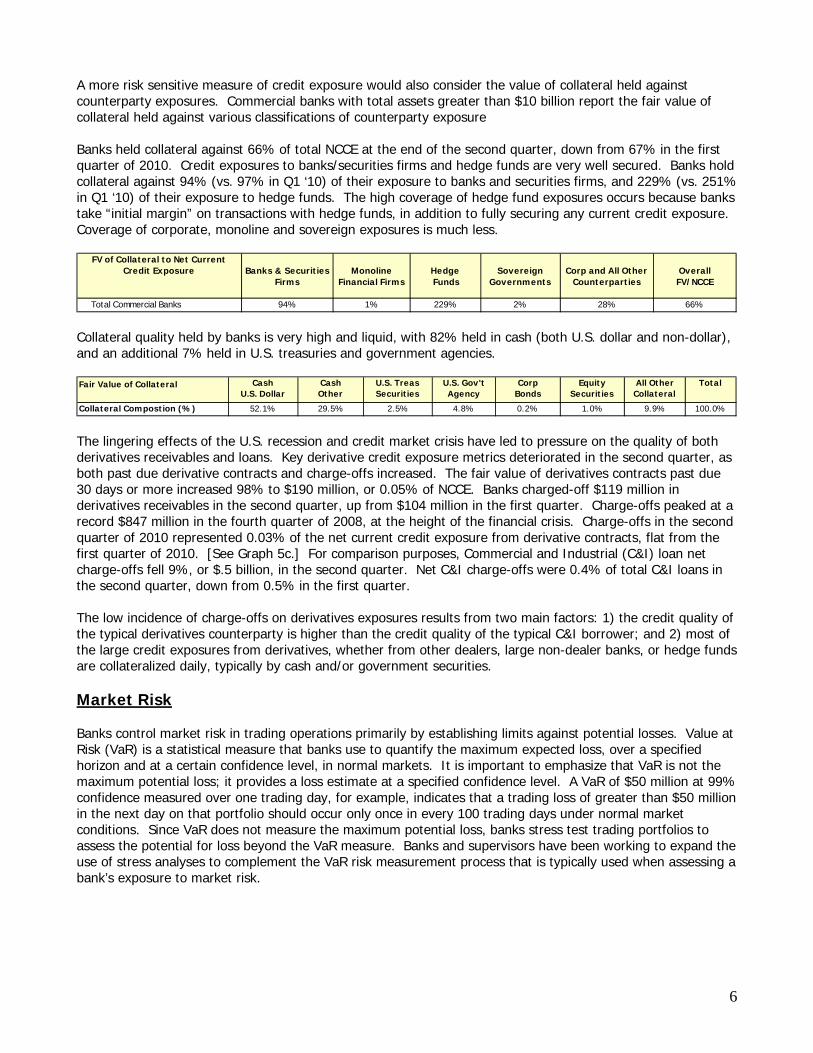
A more risk sensitive measure of credit exposure would also consider the value of collateral held against counterparty exposures. Commercial banks with total assets greater than $10 billion report the fair value of collateral held against various classifications of counterparty exposure Banks held collateral against 66% of total NCCE at the end of the second quarter, down from 67% in the first quarter of 2010. Credit exposures to banks/securities firms and hedge funds are very well secured. Banks hold collateral against 94% (vs. 97% in Q1 ‘10) of their exposure to banks and securities firms, and 229% (vs. 251% in Q1 ‘10) of their exposure to hedge funds. The high coverage of hedge fund exposures occurs because banks take “initial margin” on transactions with hedge funds, in addition to fully securing any current credit exposure. Coverage of corporate, monoline and sovereign exposures is much less.
FV of Collateral to Net Current Credit Exposure Banks & Securities
FirmsMonoline
Financial FirmsHedge Funds
Sovereign Governments
Corp and All Other Counterparties
OverallFV/NCCE
Total Commercial Banks 94% 1% 229% 2% 28% 66% Collateral quality held by banks is very high and liquid, with 82% held in cash (both U.S. dollar and non-dollar), and an additional 7% held in U.S. treasuries and government agencies. Fair Value of Collateral Cash
U.S. DollarCashOther
U.S. TreasSecurities
U.S. Gov't Agency
CorpBonds
EquitySecurities
All OtherCollateral
Total
Collateral Compostion (%) 52.1% 29.5% 2.5% 4.8% 0.2% 1.0% 9.9% 100.0% The lingering effects of the U.S. recession and credit market crisis have led to pressure on the quality of both derivatives receivables and loans. Key derivative credit exposure metrics deteriorated in the second quarter, as both past due derivative contracts and charge-offs increased. The fair value of derivatives contracts past due 30 days or more increased 98% to $190 million, or 0.05% of NCCE. Banks charged-off $119 million in derivatives receivables in the second quarter, up from $104 million in the first quarter. Charge-offs peaked at a record $847 million in the fourth quarter of 2008, at the height of the financial crisis. Charge-offs in the second quarter of 2010 represented 0.03% of the net current credit exposure from derivative contracts, flat from the first quarter of 2010. [See Graph 5c.] For comparison purposes, Commercial and Industrial (C&I) loan net charge-offs fell 9%, or $.5 billion, in the second quarter. Net C&I charge-offs were 0.4% of total C&I loans in the second quarter, down from 0.5% in the first quarter. The low incidence of charge-offs on derivatives exposures results from two main factors: 1) the credit quality of the typical derivatives counterparty is higher than the credit quality of the typical C&I borrower; and 2) most of the large credit exposures from derivatives, whether from other dealers, large non-dealer banks, or hedge funds are collateralized daily, typically by cash and/or government securities. Market Risk Banks control market risk in trading operations primarily by establishing limits against potential losses. Value at Risk (VaR) is a statistical measure that banks use to quantify the maximum expected loss, over a specified horizon and at a certain confidence level, in normal markets. It is important to emphasize that VaR is not the maximum potential loss; it provides a loss estimate at a specified confidence level. A VaR of $50 million at 99% confidence measured over one trading day, for example, indicates that a trading loss of greater than $50 million in the next day on that portfolio should occur only once in every 100 trading days under normal market conditions. Since VaR does not measure the maximum potential loss, banks stress test trading portfolios to assess the potential for loss beyond the VaR measure. Banks and supervisors have been working to expand the use of stress analyses to complement the VaR risk measurement process that is typically used when assessing a bank’s exposure to market risk.
6

$ in millions JPMorgan & Co. Citigroup Inc. Bank of America Corp.
Goldman Sachs Morgan Stanley
Average VaR Q2'10 $72 $188 $189 $136 $139Change in Avg VaR Q2 vs Q1 $0 ($12) ($87) ($25) ($4)
($1,606)06-30-10 Equity Capital $171,120 $154,806 $233,174 $73,819 $51,0132009 Net Income $11,728 $6,276 $13,385 $1,346Avg VaR Q2'10 / Equity 0.04% 0.1% 0.1% 0.2% 0.3%Avg VaR Q2'10 / 2009 Net Income 0.6% -11.7% 3.0% 1.0% 10.3% Data Source: 10K & 10Q SEC Reports.
The large trading banks disclose average VaR data in published financial reports. To provide perspective on the market risk of trading activities, it is useful to compare the VaR numbers over time and to equity capital and net income. As shown in the table above, market risks reported by the three largest trading banks, as measured by VaR, are small as a percentage of their capital. Because of mergers, and VaR measurement systems incorporating higher volatility price changes throughout the credit crisis (compared to the very low volatility environment prior to the crisis), bank VaR measures had generally increased throughout the credit crisis. Recently, however, as more normal market conditions emerged and volatility declined, bank VaR measures have trended lower. To test the effectiveness of VaR measurement systems, trading institutions track the number of times that daily losses exceed VaR estimates. Under the Market Risk Rule that establishes regulatory capital requirements for U.S. commercial banks with significant trading activities, a bank’s capital requirement for market risk is based on its VaR measured at a 99% confidence level and assuming a 10-day holding period. Banks back-test their VaR measure by comparing the actual daily profit or loss to the VaR measure. The results of the back-test determine the size of the multiplier applied to the VaR measure in the risk-based capital calculation. The multiplier adds a safety factor to the capital requirements. An “exception” occurs when a dealer has a daily loss in excess of its VaR measure. Some banks disclose the number of such “exceptions” in their published financial reports. Because of the unusually high market volatility and large write-downs in CDOs during the financial crisis, as well as poor market liquidity, a number of banks experienced back-test exceptions and therefore an increase in their capital multiplier. Credit Derivatives Credit derivatives declined 3.4% in the second quarter to $13.9 trillion. Credit derivatives outstanding have declined 15% since peaking at $16.4 trillion in the first quarter of 2008; they declined 12% in 2009. From year-end 2003 to 2008, credit derivative contracts grew at a 100% compounded annual growth rate. Industry efforts to eliminate offsetting trades (“trade compression”), as well as reduced demand for structured products, has led to a decline in credit derivative notionals. Tables 11 and 12 provide detail on individual bank holdings of credit derivatives by product and maturity, as well as the credit quality of the underlying reference entities. As shown in the first chart below, credit default swaps are the dominant product at 97% of all credit derivatives notionals. [See charts below, Tables 11 and 12, and Graph 10.]
7

CREDIT DEFAULT SWAPS97.14%
TOTAL RETURN SWAPS0.70%
CREDIT OPTIONS
0.76%
OTHER CREDIT DERIVS1.41%
2010 Q2 Credit Derivatives Composition by Product Type
Investment Grade: < 1 yr7%
Investment Grade: 1-5 yr46%
Investment Grade: > 5 yrs13%
Sub-Investment Grade: < 1 yr
4%
Sub-Investment Grade: 1-5 yr
23%
Sub Investment Grade: > 5 yrs
7%
2010 Q2Credit Derivatives Composition by Maturity &
Quality of Underlying Reference Entity
Data Source: Call Reports. Note: Beginning 1Q07, credit exposures are broken out as a separate category.
Contracts referencing investment grade entities with maturities from 1-5 years represent the largest segment of the market at 46% of all credit derivatives notionals, up from 43% in the first quarter of 2010. Contracts of all tenors that reference investment grade entities are 66% of the market, flat from the first quarter. [See chart on right above.] The notional amount for the 33 U.S. commercial banks that sold credit protection (i.e., assumed credit risk) was $6.8 trillion, down $0.2 trillion (3%) from the first quarter. The notional amount for the 33 banks that purchased credit protection (i.e., hedged credit risk) was $7.1 trillion, a decrease of $0.3 trillion (4%). [See Tables 1, 3, 11 and 12 and Graphs 2, 3 and 4.] Notionals Changes in notional volumes are generally reasonable reflections of business activity, and therefore can provide insight into potential revenue and operational issues. However, the notional amount of derivatives contracts does not provide a useful measure of either market or credit risks. The notional amount of derivatives contracts held by U.S. commercial banks in the second quarter increased by $6.9 trillion to $223.4 trillion. Derivative notionals are 10% higher than a year ago. The five banks with the most derivatives activity hold 96% of all derivatives, while the largest 25 banks account for nearly 100% of all contracts. [See Tables 3, 5 and Graph 4.]
8
Interest Rate Contracts
84.4%
Foreign Exchange Contracts
8.2%
Equity Contracts
0.7%
Commodity/Other0.5%
Credit Derivatives
6.2%
Percentage Total Notionals by Type - Q2 '10
Interest Rate Contracts
84.1%
Foreign Exchange Contracts
8.1%
Equity Contracts
0.7%
Commodity/Other0.4%
Credit Derivatives
6.6%
Percentage Total Notionals by Type - Q1 '10
Data Source: Call Reports. Note: Beginning 1Q07, credit exposures are broken out as a separate category.
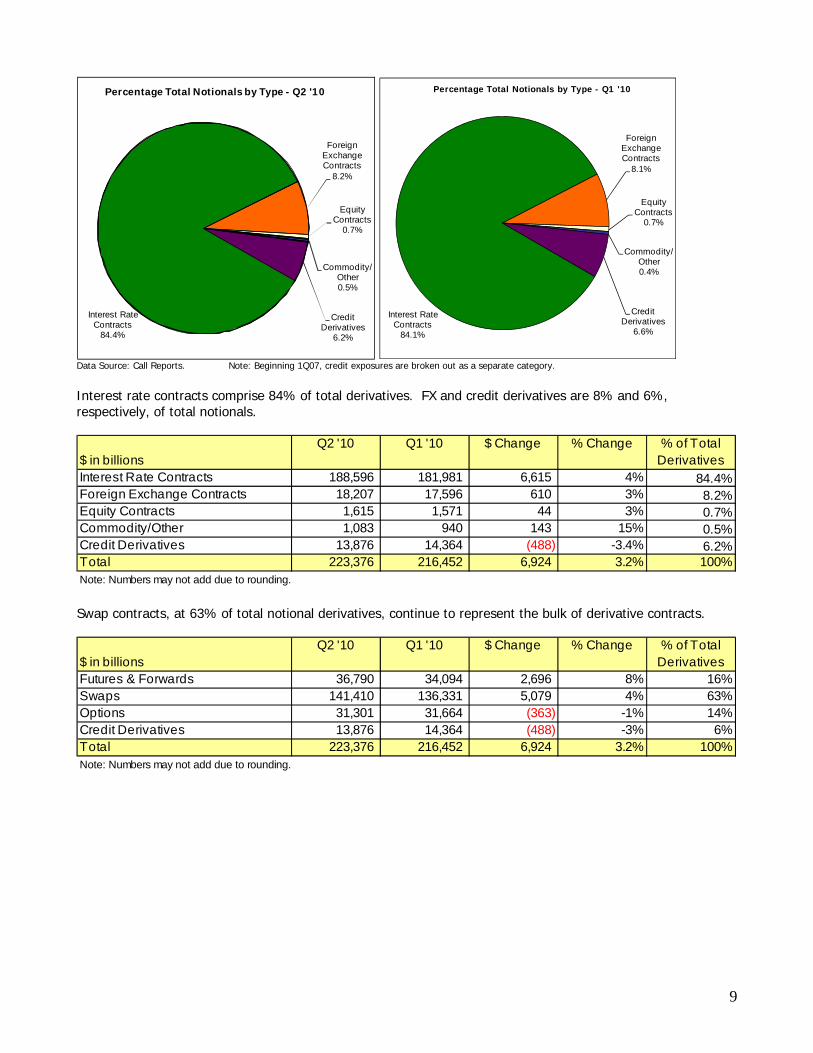
Interest rate contracts comprise 84% of total derivatives. FX and credit derivatives are 8% and 6%, respectively, of total notionals.
$ in billionsQ2 '10 Q1 '10 $ Change % Change % of Total
DerivativesInterest Rate Contracts 188,596 181,981 6,615 4% 84.4%Foreign Exchange Contracts 18,207 17,596 610 3% 8.2%Equity Contracts 1,615 1,571 44 3% 0.7%Commodity/Other 1,083 940 143 15% 0.5%Credit Derivatives 13,876 14,364 (488) -3.4% 6.2%Total 223,376 216,452 6,924 3.2% 100%Note: Numbers may not add due to rounding. Swap contracts, at 63% of total notional derivatives, continue to represent the bulk of derivative contracts.
$ in billionsQ2 '10 Q1 '10 $ Change % Change % of Total
DerivativesFutures & Forwards 36,790 34,094 2,696 8% 16%Swaps 141,410 136,331 5,079 4% 63%Options 31,301 31,664 (363)
(488)-1% 14%
Credit Derivatives 13,876 14,364 -3% 6%Total 223,376 216,452 6,924 3.2% 100%Note: Numbers may not add due to rounding.
9

10
GLOSSARY OF TERMS Bilateral Netting: A legally enforceable arrangement between a bank and a counterparty that creates a single legal obligation covering all included individual contracts. This means that a bank’s receivable or payable, in the event of the default or insolvency of one of the parties, would be the net sum of all positive and negative fair values of contracts included in the bilateral netting arrangement. Credit Derivative: A financial contract that allows a party to take, or reduce, credit exposure (generally on a bond, loan or index). Our derivatives survey includes over-the-counter (OTC) credit derivatives, such as credit default swaps, total return swaps, and credit spread options. Derivative: A financial contract whose value is derived from the performance of underlying market factors, such as interest rates, currency exchange rates, commodity, credit, and equity prices. Derivative transactions include a wide assortment of financial contracts including structured debt obligations and deposits, swaps, futures, options, caps, floors, collars, forwards and various combinations thereof. Gross Negative Fair Value: The sum total of the fair values of contracts where the bank owes money to its counterparties, without taking into account netting. This represents the maximum losses the bank’s counterparties would incur if the bank defaults and there is no netting of contracts, and no bank collateral was held by the counterparties. Gross negative fair values associated with credit derivatives are included. Gross Positive Fair Value: The sum total of the fair values of contracts where the bank is owed money by its counterparties, without taking into account netting. This represents the maximum losses a bank could incur if all its counterparties default and there is no netting of contracts, and the bank holds no counterparty collateral. Gross positive fair values associated with credit derivatives are included. Net Current Credit Exposure (NCCE): For a portfolio of derivative contracts, NCCE is the gross positive fair value of contracts less the dollar amount of netting benefits. On any individual contract, current credit exposure (CCE) is the fair value of the contract if positive, and zero when the fair value is negative or zero. NCCE is also the net amount owed to banks if all contracts were immediately liquidated. Notional Amount: The nominal or face amount that is used to calculate payments made on swaps and other risk management products. This amount generally does not change hands and is thus referred to as notional. Over-the-Counter Derivative Contracts: Privately negotiated derivative contracts that are transacted off organized exchanges. Potential Future Exposure (PFE): An estimate of what the current credit exposure (CCE) could be over time, based upon a supervisory formula in the agencies’ risk-based capital rules. PFE is generally determined by multiplying the notional amount of the contract by a credit conversion factor that is based upon the underlying market factor (e.g., interest rates, commodity prices, equity prices, etc.) and the contract’s remaining maturity. However, the risk-based capital rules permit banks to adjust the formulaic PFE measure by the “net to gross ratio,” which proxies the risk-reduction benefits attributable to a valid bilateral netting contract. PFE data in this report uses the amounts upon which banks hold risk-based capital. Total Credit Exposure (TCE): The sum total of net current credit exposure (NCCE) and potential future exposure (PFE). Total Risk-Based Capital: The sum of tier 1 plus tier 2 capital. Tier 1 capital consists of common shareholders’ equity, perpetual preferred shareholders’ equity with noncumulative dividends, retained earnings, and minority interests in the equity accounts of consolidated subsidiaries. Tier 2 capital consists of subordinated debt, intermediate-term preferred stock, cumulative and long-term preferred stock, and a portion of a bank’s allowance for loan and lease losses.
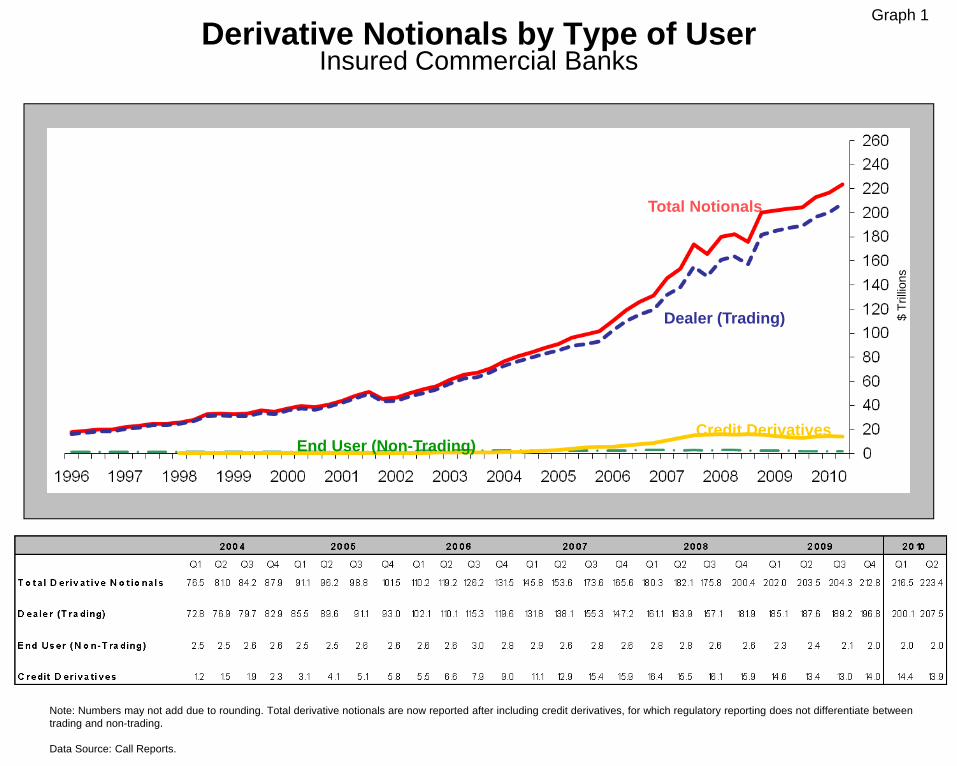
Derivative Notionals by Type of UserInsured Commercial Banks
Note: Numbers may not add due to rounding. Total derivative notionals are now reported after including credit derivatives, for which regulatory reporting does not differentiate between trading and non-trading.
Data Source: Call Reports.
$ Tr
illion
s
Graph 1
Total Notionals
Dealer (Trading)
Credit DerivativesEnd User (Non-Trading)

Derivative Contracts by ProductAll Commercial Banks
Year-ends 2001 – 2009, Quarterly 2010
*In billions of dollars, notional amount of total: futures, exchange traded options, over the counter options, forwards, and swaps.
Note: Numbers may not add due to rounding.
Data Source: Call Reports
$ Bi
llions
Graph 2

Derivative Contracts by TypeAll Commercial Banks
Year-ends 2001 – 2009, Quarterly 2010
*In billions of dollars, notional amount of total: futures, exchange traded options, over the counter options, forwards, and swaps.
As of Q206 equities and commodities types are shown as separate categories. They were previously shown as “Other Derivs.”
Note: Numbers may not add due to rounding. Data Source: Call Reports
Graph 3

Five Banks Dominate in DerivativesAll Commercial Banks, Second Quarter 2010
*In billions of dollars, notional amount of total: futures, exchange traded options, over the counter options, forwards, and swaps.
In 2Q10, HSBC replaced Wells Fargo as one of the top five commercial banks in derivatives. See Table 1.
Data Source: Call Reports
Graph 4
Concentration of Derivative Contracts ($ Billions)*

In 2Q10, HSBC replaced Wells Fargo Bank NA as one of the top 5.
Percentage of Total Credit Exposure to Risk Based Capital Top 5 Commercial Banks by Derivative Holdings
2008 Q1 - 2010 Q2
In 2Q10, HSBC replaced Wells Fargo as one of the top five commercial banks in derivatives. See Table 1.
Beginning in the 2Q09, the methodology to calculate the Credit Risk Exposure to Capital ratio for the Top 5 category was adjusted to a summing methodology.
Data Source: Call Reports
In 4Q08, Goldman Sachs Bank USA replaced Wachovia Bank as one of the top 5.
% % %
% %
Graph 5A
Total Credit Exposure to Risk Based Capital (%)

Netting Benefit: Amount of Gross Exposure Eliminated Through Bilateral Netting
All Commercial Banks with Derivatives1998 Q1 – 2010 Q2
Netting Benefit
% N
ettin
g B
enef
it
Graph 5B
*Note: The netting benefit is defined as: $ amount of netting benefits/gross positive fair value.
Data Source: Call Reports
Netting Benefit (%)*

Quarterly (Charge-Offs)/Recoveries from DerivativesCommercial Banks with Derivatives
1998 Q1 – 2010 Q2
Note: The figures are for each quarter alone, not year-to-date.
Data Source: Call Reports.
% N
ette
d C
urre
nt C
redi
t Exp
osur
e (li
ne)
Graph 5C
Charge-offs in $ m
illions (bars)
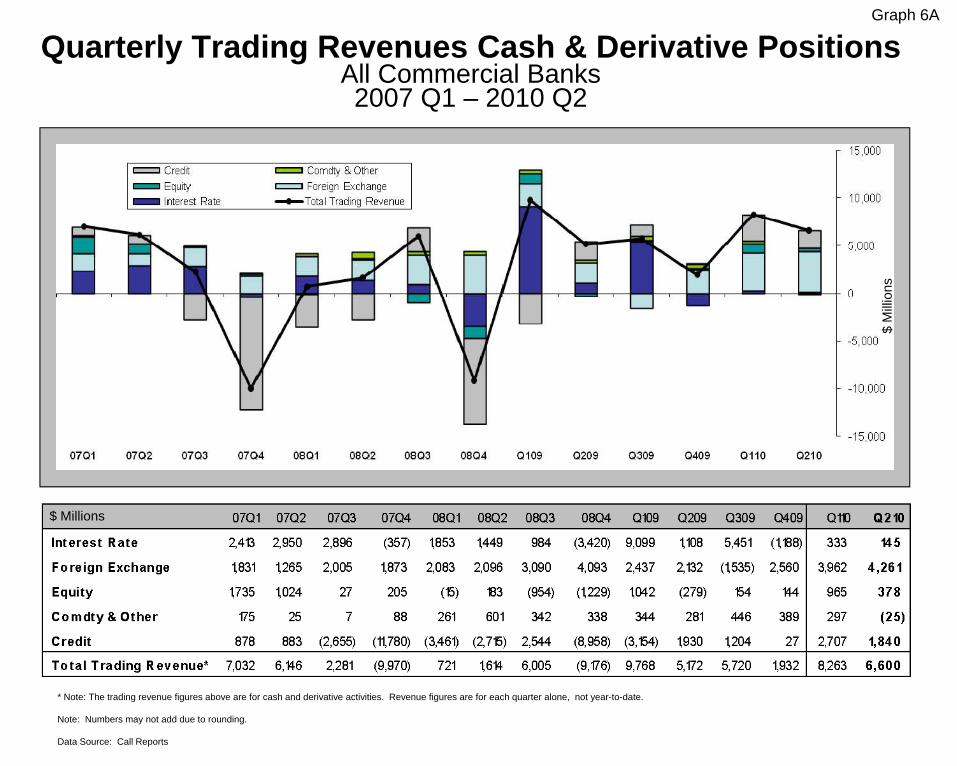
Quarterly Trading Revenues Cash & Derivative PositionsAll Commercial Banks2007 Q1 – 2010 Q2
* Note: The trading revenue figures above are for cash and derivative activities. Revenue figures are for each quarter alone, not year-to-date.
Note: Numbers may not add due to rounding.
Data Source: Call Reports
Graph 6A
$ Millions
$ M
illio
ns

In 4Q08, Goldman Sachs Bank USA replaced Wachovia Bank as one of the top 5.
Quarterly Trading Revenue as a Percentage of Gross RevenueCash & Derivative Positions
Top 5 Commercial Banks by Derivative Holdings2008 Q1 - 2010 Q2
*Note that the trading revenue figures above are for cash and derivative activities. Revenue figures are quarterly, not year-to-date numbers.
In 2Q10, HSBC replaced Wells Fargo as one of the top five commercial banks in derivatives. See Table 1.
Gross Revenue equals interst income plus non-interest income.
Data Source: Call Reports
Graph 6B
Trading Revenue toGross Revenue (%)*
% % %
% %

Notional Amounts of Interest Rate and Foreign Exchange Contracts by Maturity
All Commercial BanksYear-ends 2001 – 2009, Quarterly 2010
•Note: Figures above exclude foreign exchange contracts with an original maturity of 14 days or less, futures contracts, written options, basis swaps, and any other contracts not subject to risk-based capital requirements.
•Data Source: Call Reports
Graph 7
$ Bi
llions
$ Bi
llions
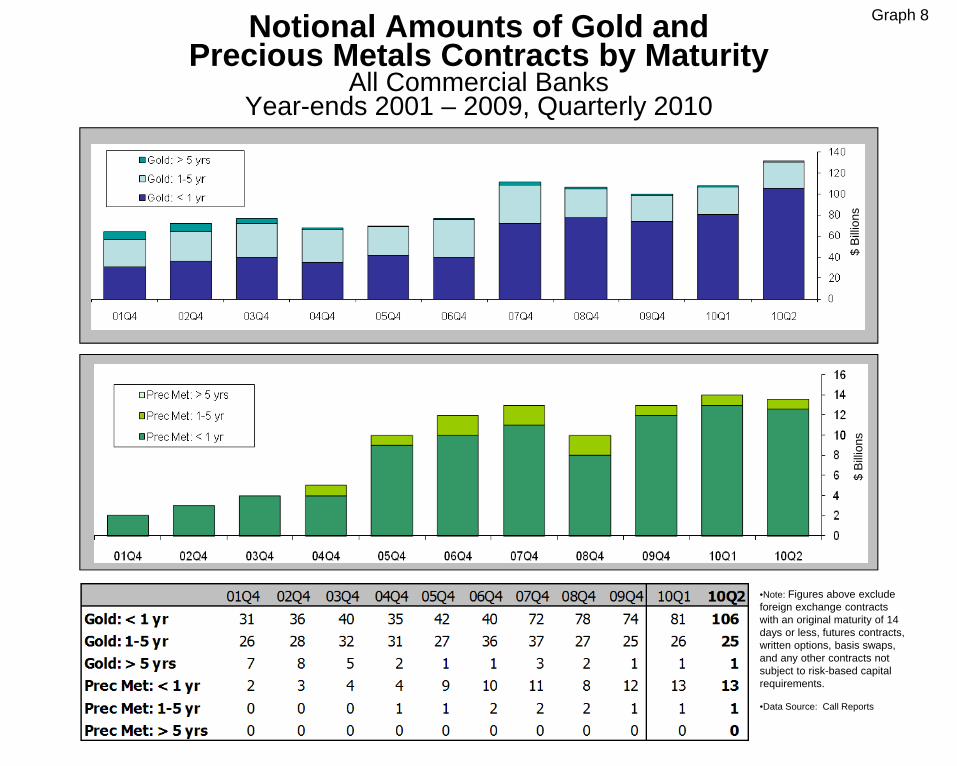
Notional Amounts of Gold and Precious Metals Contracts by Maturity
All Commercial BanksYear-ends 2001 – 2009, Quarterly 2010
•Note: Figures above exclude foreign exchange contracts with an original maturity of 14 days or less, futures contracts, written options, basis swaps, and any other contracts not subject to risk-based capital requirements.
•Data Source: Call Reports
Graph 8
$ Bi
llions
$ Bi
llions
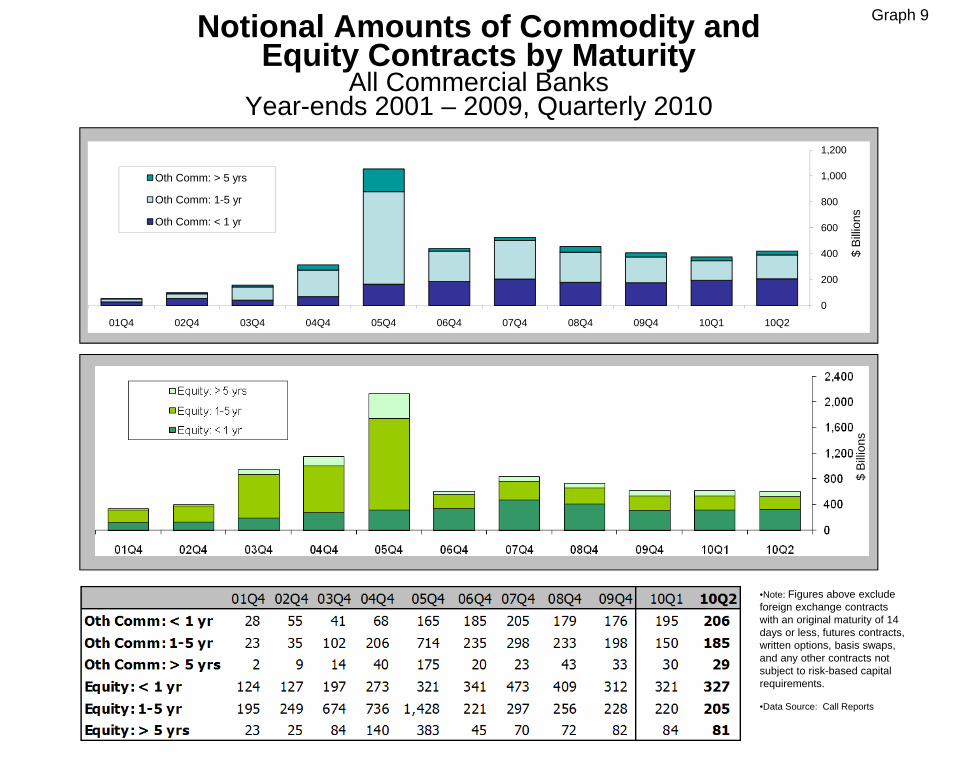
Notional Amounts of Commodity and Equity Contracts by Maturity
All Commercial BanksYear-ends 2001 – 2009, Quarterly 2010
0
200
400
600
800
1,000
1,200
01Q4 02Q4 03Q4 04Q4 05Q4 06Q4 07Q4 08Q4 09Q4 10Q1 10Q2
Oth Comm: > 5 yrs
Oth Comm: 1-5 yr
Oth Comm: < 1 yr
•Note: Figures above exclude foreign exchange contracts with an original maturity of 14 days or less, futures contracts, written options, basis swaps, and any other contracts not subject to risk-based capital requirements.
•Data Source: Call Reports
Graph 9
$ Bi
llions
$ Bi
llions
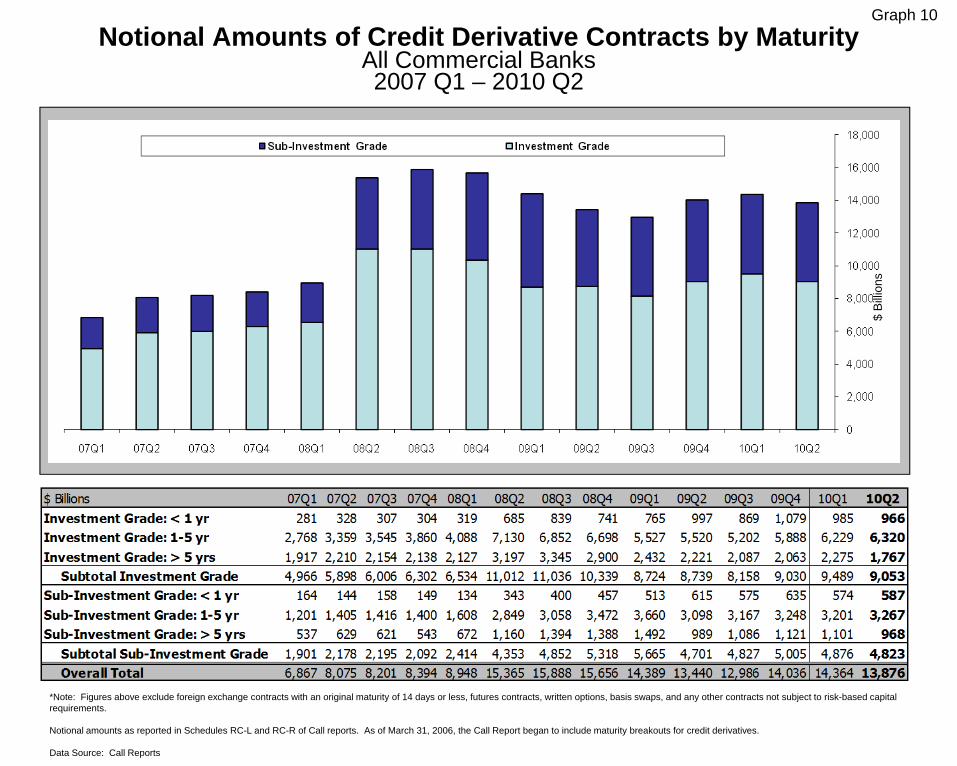
Notional Amounts of Credit Derivative Contracts by MaturityAll Commercial Banks2007 Q1 – 2010 Q2
*Note: Figures above exclude foreign exchange contracts with an original maturity of 14 days or less, futures contracts, written options, basis swaps, and any other contracts not subject to risk-based capital requirements.
Notional amounts as reported in Schedules RC-L and RC-R of Call reports. As of March 31, 2006, the Call Report began to include maturity breakouts for credit derivatives.
Data Source: Call Reports
Graph 10
$ Bi
llions

TABLE 1
TOTALTOTAL TOTAL TOTAL TOTAL TOTAL CREDIT
TOTAL TOTAL FUTURES OPTIONS FORWARDS SWAPS OPTIONS DERIVATIVES SPOTRANK BANK NAME STATE ASSETS DERIVATIVES (EXCH TR) (EXCH TR) (OTC) (OTC) (OTC) (OTC) FX1 JPMORGAN CHASE BANK NA OH $1,568,093 $75,253,921 $1,140,057 $2,035,041 $11,463,845 $46,155,167 $9,103,900 $5,355,911 $775,3182 BANK OF AMERICA NA NC 1,518,958 48,520,359 2,658,930 646,151 7,074,273 29,979,395 3,467,566 4,694,042 382,1653 CITIBANK NATIONAL ASSN NV 1,157,877 45,990,989 594,050 929,232 6,386,281 29,066,747 6,617,479 2,397,200 710,0964 GOLDMAN SACHS BANK USA NY 95,515 42,087,305 653,815 250,927 3,269,654 30,885,605 6,527,632 499,672 3,5835 HSBC BANK USA NATIONAL ASSN VA 183,595 3,682,856 68,870 301,857 696,613 1,715,911 139,761 759,843 56,9846 WELLS FARGO BANK NA SD 1,073,280 3,612,256 129,556 11,455 977,594 1,939,669 427,685 126,297 19,2707 BANK OF NEW YORK MELLON NY 175,994 1,457,905 25,581 88,219 467,255 504,207 371,867 776 42,4358 STATE STREET BANK&TRUST CO MA 157,474 749,151 20,281 0 634,492 13,783 80,441 155 28,9319 PNC BANK NATIONAL ASSN DE 251,075 372,107 62,953 84,600 10,308 179,184 31,055 4,007 1,36910 SUNTRUST BANK GA 160,509 282,826 41,451 17,375 15,655 170,268 36,344 1,734 49911 NORTHERN TRUST CO IL 66,624 203,290 0 0 197,117 5,920 126 127 12,07812 REGIONS BANK AL 131,011 133,058 1,314 2,000 3,986 122,128 3,057 572 6113 U S BANK NATIONAL ASSN OH 278,465 95,311 1,642 4,500 35,506 43,587 7,897 2,180 1,01114 KEYBANK NATIONAL ASSN OH 90,663 90,524 4,067 1,100 8,983 62,265 10,469 3,640 2,40915 FIFTH THIRD BANK OH 110,026 71,292 122 2,987 7,837 38,703 20,654 988 71716 BRANCH BANKING&TRUST CO NC 149,199 65,569 5,025 0 15,804 35,661 9,078 0 4517 TD BANK NATIONAL ASSN DE 152,617 56,568 0 0 4,138 47,547 4,694 188 1418 RBS CITIZENS NATIONAL ASSN RI 112,312 47,471 0 0 5,638 38,060 2,738 1,034 4919 MORGAN STANLEY BANK NA UT 65,746 43,519 0 0 0 23,589 0 19,930 020 UNION BANK NATIONAL ASSN CA 83,842 38,994 1,802 0 2,764 26,287 8,141 0 480
NOTIONAL AMOUNT OF DERIVATIVE CONTRACTSTOP 25 COMMERCIAL BANKS AND TRUST COMPANIES IN DERIVATIVES
JUNE 30, 2010, $ MILLIONS
20 UNION BANK NATIONAL ASSN CA 83,842 38,994 1,802 0 2,764 26,287 8,141 0 48021 TD BANK USA NATIONAL ASSN ME 11,021 37,911 0 0 11,397 26,514 0 0 022 ALLY BANK UT 61,693 33,730 0 0 13,935 8,728 11,067 0 023 DEUTSCHE BANK TR CO AMERICAS NY 42,306 28,967 0 0 287 24,036 196 4,448 024 HUNTINGTON NATIONAL BANK OH 51,212 26,311 0 0 2,119 20,753 2,604 834 025 BANK OF OKLAHOMA NA OK 16,621 25,374 537 1,000 15,635 4,267 3,936 0 2
TOP 25 COMMERCIAL BANKS & TCs WITH DERIVATIVES $7,765,727 $223,007,561 $5,410,053 $4,376,444 $31,321,115 $141,137,982 $26,888,389 $13,873,578 $2,037,516OTHER COMMERCIAL BANKS & TCs WITH DERIVATIVES 2,703,882 368,673 14,443 520 44,456 271,658 35,172 2,425 1,070TOTAL COMMERCIAL BANKS & TCs WITH DERIVATIVES 10,469,610 223,376,234 5,424,496 4,376,964 31,365,571 141,409,639 26,923,561 13,876,003 2,038,587
Note: Before the first quarter of 1995 total derivatives included spot foreign exchange. Beginning in the first quarter, 1995, spot foreign exchange was reported separately.Note: Numbers may not add due to rounding.Data source: Call Reports, schedule RC-L
Note: Credit derivatives have been included in the sum of total derivatives. Credit derivatives have been included as an "over the counter" category, although the Call Report does not differentiate by market currently.

TABLE 2
CREDITTOTAL TOTAL FUTURES OPTIONS FORWARDS SWAPS OPTIONS DERIVATIVES SPOT
RANK HOLDING COMPANY STATE ASSETS DERIVATIVES (EXCH TR) (EXCH TR) (OTC) (OTC) (OTC) (OTC) FX1 JPMORGAN CHASE & CO. NY 2,014,019 75,563,510 1,311,384 2,104,151 11,760,508 46,001,677 9,033,357 5,352,433 766,7722 BANK OF AMERICA CORPORATION NC 2,366,087 71,659,303 3,490,446 1,809,271 11,637,978 44,358,876 5,473,911 4,888,822 310,8243 GOLDMAN SACHS GROUP, INC., THE NY 883,529 48,135,817 1,151,364 1,964,809 4,525,220 27,783,377 8,271,455 4,439,592 224,3254 CITIGROUP INC. NY 1,937,656 45,414,409 737,425 2,455,136 6,608,718 26,379,719 6,761,608 2,471,803 667,6405 MORGAN STANLEY NY 809,456 40,573,169 129,537 867,384 6,467,550 24,986,775 3,601,417 4,520,506 230,6786 WELLS FARGO & COMPANY CA 1,225,862 3,692,884 138,566 16,024 1,020,359 1,974,874 421,128 121,933 19,2707 HSBC NORTH AMERICA HOLDINGS INC. NY 333,998 3,651,672 83,547 312,907 696,490 1,658,918 140,173 759,638 56,8218 BANK OF NEW YORK MELLON CORPORATION, THE NY 235,944 1,442,136 25,581 88,219 466,919 488,774 371,867 776 42,4339 TAUNUS CORPORATION NY 348,586 1,042,271 89,810 208,366 454,172 191,824 17,450 80,649 79710 STATE STREET CORPORATION MA 160,664 748,675 20,284 0 634,512 13,283 80,441 155 28,93111 BARCLAYS GROUP US INC. DE 356,186 654,012 0 234,928 389,327 22,848 6,143 766 212 ALLY FINANCIAL INC. MI 176,814 390,312 8,858 122 47,520 268,745 64,918 149 013 PNC FINANCIAL SERVICES GROUP, INC., THE PA 261,769 365,234 63,280 84,601 10,518 171,854 30,974 4,007 1,36914 SUNTRUST BANKS, INC. GA 170,668 285,187 41,451 17,375 15,655 170,268 38,704 1,734 49915 METLIFE, INC. NY 573,907 212,759 16,398 0 34,362 65,898 88,646 7,456 016 NORTHERN TRUST CORPORATION IL 80,049 203,891 0 0 197,117 6,520 127 127 12,07817 REGIONS FINANCIAL CORPORATION AL 135,393 143,422 1,314 2,000 3,986 131,716 3,834 572 6118 U.S. BANCORP MN 283,243 98,418 1,642 4,500 35,506 46,691 7,896 2,183 1,01119 TD BANK US HOLDING COMPANY ME 159,058 94,478 0 0 15,534 74,062 4,694 188 1420 KEYCORP OH 94,287 94,141 4,178 1,100 8,983 64,387 11,853 3,640 2,40921 FIFTH THIRD BANCORP OH 112,025 75,397 122 2,987 7,837 42,808 20,654 988 71722 BB&T CORPORATION NC 155 083 64 263 5 028 0 15 804 34 712 8 718 0 45
NOTIONAL AMOUNT OF DERIVATIVE CONTRACTSTOP 25 HOLDING COMPANIES IN DERIVATIVES
JUNE 30, 2010, $ MILLIONS
22 BB&T CORPORATION NC 155,083 64,263 5,028 0 15,804 34,712 8,718 0 4523 CITIZENS FINANCIAL GROUP, INC. RI 140,019 56,190 0 0 5,638 46,215 3,102 1,235 4924 CAPITAL ONE FINANCIAL CORPORATION VA 197,489 49,557 265 0 2,054 47,219 19 0 925 UNIONBANCAL CORPORATION CA 84,310 38,994 1,802 0 2,764 26,287 8,141 0 480
TOP 25 HOLDING COMPANIES WITH DERIVATIVES 13,296,102 294,750,102 7,322,282 10,173,879 45,065,031 175,058,326 34,471,232 22,659,351 2,367,234
Note: Currently, the Y-9 report does not differentiate credit derivatives by contract type. Credit derivatives have been included in the sum of total derivatives.Note: Prior to the first quarter of 2005, total derivatives included spot foreign exchange. Beginning in that quarter, spot foreign exchange has been reported separately.Note: Numbers may not add due to rounding.Data source: Consolidated Financial Statements for Bank Holding Companies, FR Y- 9, schedule HC-L
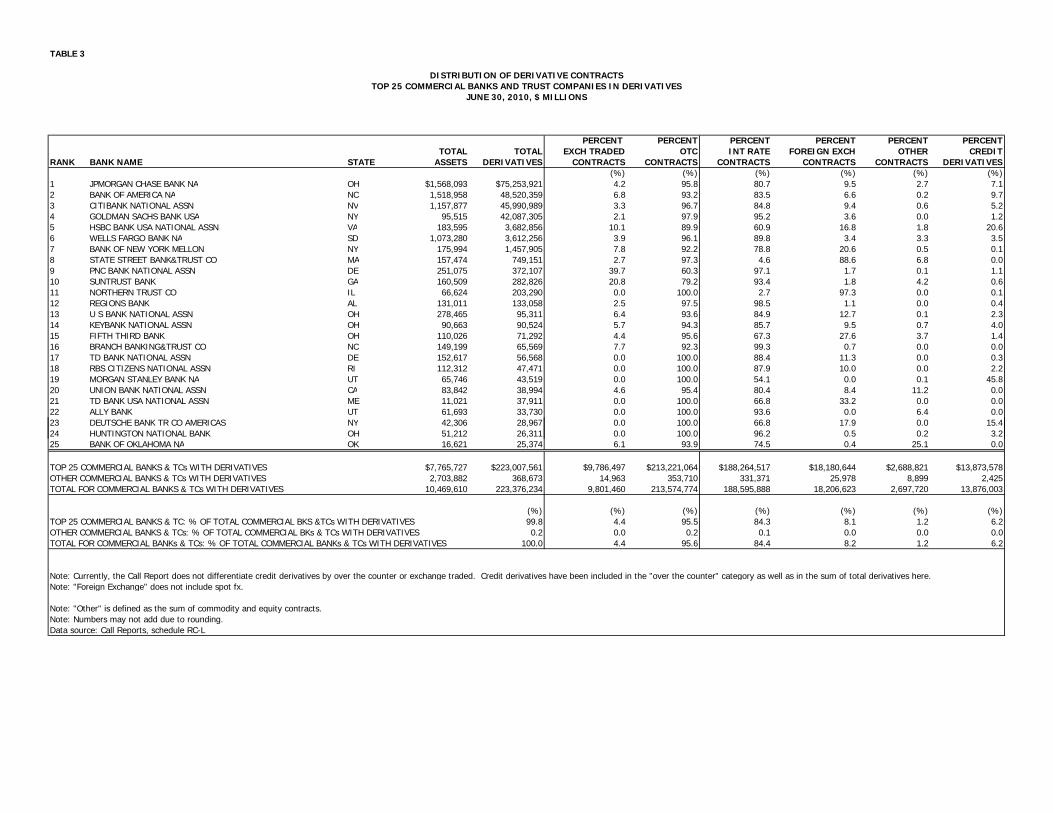
TABLE 3
PERCENT PERCENT PERCENT PERCENT PERCENT PERCENTTOTAL TOTAL EXCH TRADED OTC INT RATE FOREIGN EXCH OTHER CREDIT
RANK BANK NAME STATE ASSETS DERIVATIVES CONTRACTS CONTRACTS CONTRACTS CONTRACTS CONTRACTS DERIVATIVES(%) (%) (%) (%) (%) (%)
1 JPMORGAN CHASE BANK NA OH $1,568,093 $75,253,921 4.2 95.8 80.7 9.5 2.7 7.12 BANK OF AMERICA NA NC 1,518,958 48,520,359 6.8 93.2 83.5 6.6 0.2 9.73 CITIBANK NATIONAL ASSN NV 1,157,877 45,990,989 3.3 96.7 84.8 9.4 0.6 5.24 GOLDMAN SACHS BANK USA NY 95,515 42,087,305 2.1 97.9 95.2 3.6 0.0 1.25 HSBC BANK USA NATIONAL ASSN VA 183,595 3,682,856 10.1 89.9 60.9 16.8 1.8 20.66 WELLS FARGO BANK NA SD 1,073,280 3,612,256 3.9 96.1 89.8 3.4 3.3 3.57 BANK OF NEW YORK MELLON NY 175,994 1,457,905 7.8 92.2 78.8 20.6 0.5 0.18 STATE STREET BANK&TRUST CO MA 157,474 749,151 2.7 97.3 4.6 88.6 6.8 0.09 PNC BANK NATIONAL ASSN DE 251,075 372,107 39.7 60.3 97.1 1.7 0.1 1.110 SUNTRUST BANK GA 160,509 282,826 20.8 79.2 93.4 1.8 4.2 0.611 NORTHERN TRUST CO IL 66,624 203,290 0.0 100.0 2.7 97.3 0.0 0.112 REGIONS BANK AL 131,011 133,058 2.5 97.5 98.5 1.1 0.0 0.413 U S BANK NATIONAL ASSN OH 278,465 95,311 6.4 93.6 84.9 12.7 0.1 2.314 KEYBANK NATIONAL ASSN OH 90,663 90,524 5.7 94.3 85.7 9.5 0.7 4.015 FIFTH THIRD BANK OH 110,026 71,292 4.4 95.6 67.3 27.6 3.7 1.416 BRANCH BANKING&TRUST CO NC 149,199 65,569 7.7 92.3 99.3 0.7 0.0 0.017 TD BANK NATIONAL ASSN DE 152,617 56,568 0.0 100.0 88.4 11.3 0.0 0.318 RBS CITIZENS NATIONAL ASSN RI 112,312 47,471 0.0 100.0 87.9 10.0 0.0 2.219 MORGAN STANLEY BANK NA UT 65,746 43,519 0.0 100.0 54.1 0.0 0.1 45.820 UNION BANK NATIONAL ASSN CA 83,842 38,994 4.6 95.4 80.4 8.4 11.2 0.021 TD BANK USA NATIONAL ASSN ME 11,021 37,911 0.0 100.0 66.8 33.2 0.0 0.022 ALLY BANK UT 61,693 33,730 0.0 100.0 93.6 0.0 6.4 0.023 DEUTSCHE BANK TR CO AMERICAS NY 42,306 28,967 0.0 100.0 66.8 17.9 0.0 15.4
DISTRIBUTION OF DERIVATIVE CONTRACTSTOP 25 COMMERCIAL BANKS AND TRUST COMPANIES IN DERIVATIVES
JUNE 30, 2010, $ MILLIONS
24 HUNTINGTON NATIONAL BANK OH 51,212 26,311 0.0 100.0 96.2 0.5 0.2 3.225 BANK OF OKLAHOMA NA OK 16,621 25,374 6.1 93.9 74.5 0.4 25.1 0.0
TOP 25 COMMERCIAL BANKS & TCs WITH DERIVATIVES $7,765,727 $223,007,561 $9,786,497 $213,221,064 $188,264,517 $18,180,644 $2,688,821 $13,873,578OTHER COMMERCIAL BANKS & TCs WITH DERIVATIVES 2,703,882 368,673 14,963 353,710 331,371 25,978 8,899 2,425TOTAL FOR COMMERCIAL BANKS & TCs WITH DERIVATIVES 10,469,610 223,376,234 9,801,460 213,574,774 188,595,888 18,206,623 2,697,720 13,876,003
(%) (%) (%) (%) (%) (%) (%)TOP 25 COMMERCIAL BANKS & TC: % OF TOTAL COMMERCIAL BKS &TCs WITH DERIVATIVES 99.8 4.4 95.5 84.3 8.1 1.2 6.2OTHER COMMERCIAL BANKS & TCs: % OF TOTAL COMMERCIAL BKs & TCs WITH DERIVATIVES 0.2 0.0 0.2 0.1 0.0 0.0 0.0TOTAL FOR COMMERCIAL BANKs & TCs: % OF TOTAL COMMERCIAL BANKs & TCs WITH DERIVATIVES 100.0 4.4 95.6 84.4 8.2 1.2 6.2
Note: "Foreign Exchange" does not include spot fx.
Note: "Other" is defined as the sum of commodity and equity contracts.Note: Numbers may not add due to rounding.Data source: Call Reports, schedule RC-L
Note: Currently, the Call Report does not differentiate credit derivatives by over the counter or exchange traded. Credit derivatives have been included in the "over the counter" category as well as in the sum of total derivatives here.

TABLE 4
BILATERALLY TOTAL CREDIT (%)TOTAL NETTED CURRENT POTENTIAL EXPOSURE TOTAL CREDIT
TOTAL TOTAL RISK-BASED CREDIT FUTURE FROM ALL EXPOSURERANK BANK NAME STATE ASSETS DERIVATIVES CAPITAL EXPOSURE EXPOSURE CONTRACTS TO CAPITAL1 JPMORGAN CHASE BANK NA OH $1,568,093 $75,253,921 $135,654 $153,235 $195,847 $349,082 2572 BANK OF AMERICA NA NC 1,518,958 48,520,359 150,324 60,457 183,345 243,802 1623 CITIBANK NATIONAL ASSN NV 1,157,877 45,990,989 114,570 62,493 133,760 196,253 1714 GOLDMAN SACHS BANK USA NY 95,515 42,087,305 23,147 30,846 128,881 159,727 6905 HSBC BANK USA NATIONAL ASSN VA 183,595 3,682,856 19,982 9,374 27,172 36,546 1836 WELLS FARGO BANK NA SD 1,073,280 3,612,256 119,114 31,525 42,002 73,527 627 BANK OF NEW YORK MELLON NY 175,994 1,457,905 14,330 6,156 4,714 10,870 768 STATE STREET BANK&TRUST CO MA 157,474 749,151 11,851 5,619 5,869 11,488 979 PNC BANK NATIONAL ASSN DE 251,075 372,107 32,703 4,636 685 5,321 1610 SUNTRUST BANK GA 160,509 282,826 16,985 3,029 1,103 4,131 2411 NORTHERN TRUST CO IL 66,624 203,290 6,214 3,855 2,093 5,948 9612 REGIONS BANK AL 131,011 133,058 14,100 1,246 299 1,545 1113 U S BANK NATIONAL ASSN OH 278,465 95,311 26,735 1,573 9 1,582 614 KEYBANK NATIONAL ASSN OH 90,663 90,524 11,752 1,421 148 1,569 1315 FIFTH THIRD BANK OH 110,026 71,292 15,616 1,737 522 2,260 1416 BRANCH BANKING&TRUST CO NC 149,199 65,569 16,697 1,356 345 1,702 1017 TD BANK NATIONAL ASSN DE 152,617 56,568 11,761 1,630 595 2,224 1918 RBS CITIZENS NATIONAL ASSN RI 112,312 47,471 10,125 1,120 342 1,462 1419 MORGAN STANLEY BANK NA UT 65,746 43,519 9,256 116 47 163 2
CREDIT EQUIVALENT EXPOSURESTOP 25 COMMERCIAL BANKS AND TRUST COMPANIES IN DERIVATIVES
JUNE 30, 2010, $ MILLIONS
, , ,20 UNION BANK NATIONAL ASSN CA 83,842 38,994 8,504 850 598 1,448 1721 TD BANK USA NATIONAL ASSN ME 11,021 37,911 1,258 747 502 1,249 9922 ALLY BANK UT 61,693 33,730 8,680 155 248 403 523 DEUTSCHE BANK TR CO AMERICAS NY 42,306 28,967 8,684 1,997 766 2,763 3224 HUNTINGTON NATIONAL BANK OH 51,212 26,311 5,169 488 112 600 1225 BANK OF OKLAHOMA NA OK 16,621 25,374 1,643 285 405 690 42
TOP 25 COMMERCIAL BANKS & TCs WITH DERIVATIVES $7,765,727 $223,007,561 $794,853 $385,948 $730,409 $1,116,357 140OTHER COMMERCIAL BANKS & TCs WITH DERIVATIVES 2,703,882 368,673 289,137 10,562 2,751 13,313 5TOTAL AMOUNT FOR COMMERCIAL BANKS & TCs WITH DERIVATIVES 10,469,610 223,376,234 1,083,990 396,509 733,160 1,129,670 104
Commercial banks also hold on-balance sheet assets in volumes that are multiples of bank capital. For example:
EXPOSURES FROM OTHER ASSETS EXPOSURE TO RISKALL COMMERCIAL BANKS BASED CAPITAL 1-4 FAMILY MORTGAGES 169% C&I LOANS 89% SECURITIES NOT IN TRADING ACCOUNT 179%
Note: Total credit exposure is defined as the credit equivalent amount from derivative contracts (RC-R line 54), which is the sum of netted current credit exposure and PFE.Note: The total credit exposure to capital ratio is calculated using risk based capital (tier one plus tier two capital). Note: Currently, the Call Report does not differentiate credit derivatives by contract type. Credit derivatives have been included in the sum of total derivatives here.Note: Numbers may not add due to rounding.Note: Beginning in 2Q09, the methodology to calculate the Credit Risk Exposure to Capital ratio for the aggregated categories (Top 25, Other and Overall Total) was adjustedto a summing methodology.Data source: Call Reports, Schedule RC-R.

TABLE 5
TOTAL % TOTAL %HELD FOR HELD FOR NOT FOR NOT FOR
TOTAL TOTAL TRADING TRADING TRADING TRADINGRANK BANK NAME STATE ASSETS DERIVATIVES & MTM & MTM MTM MTM1 JPMORGAN CHASE BANK NA OH $1,568,093 $69,898,010 $69,772,950 99.8 $125,060 0.22 BANK OF AMERICA NA NC 1,518,958 43,826,316 43,717,740 99.8 108,577 0.23 CITIBANK NATIONAL ASSN NV 1,157,877 43,593,789 43,349,491 99.4 244,298 0.64 GOLDMAN SACHS BANK USA NY 95,515 41,587,633 41,579,893 100.0 7,740 0.05 HSBC BANK USA NATIONAL ASSN VA 183,595 2,923,012 2,906,052 99.4 16,961 0.6
TOP 5 COMMERCIAL BANKS & TCs WITH DERIVATIVES $4,524,038 $201,828,761 $201,326,125 99.8 $502,635 0.2OTHER COMMERCIAL BANKS & TCs WITH DERIVATIVES 5,945,572 7,671,470 6,199,019 80.8 1,472,451 19.2TOTAL AMOUNT FOR COMMERCIAL BANKS & TCs WITH DERIVATIVES 10,469,610 209,500,231 207,525,145 99.1 1,975,086 0.9
Note: Currently, the Call Report does not differentiate between traded and not-traded credit derivatives. Credit derivatives have been excluded from the sum of total derivatives here.Note: Numbers may not add due to rounding.Note: Beginning in 2Q10, HSBC replaced Wells Fargo as one of the top five commerical banks in derivatives. See Table 1.Data source: Call Reports, schedule RC-L
NOTIONAL AMOUNTS OF DERIVATIVE CONTRACTS HELD FOR TRADINGTOP 5 COMMERCIAL BANKS AND TRUST COMPANIES IN DERIVATIVES
JUNE 30, 2010, $ MILLIONS
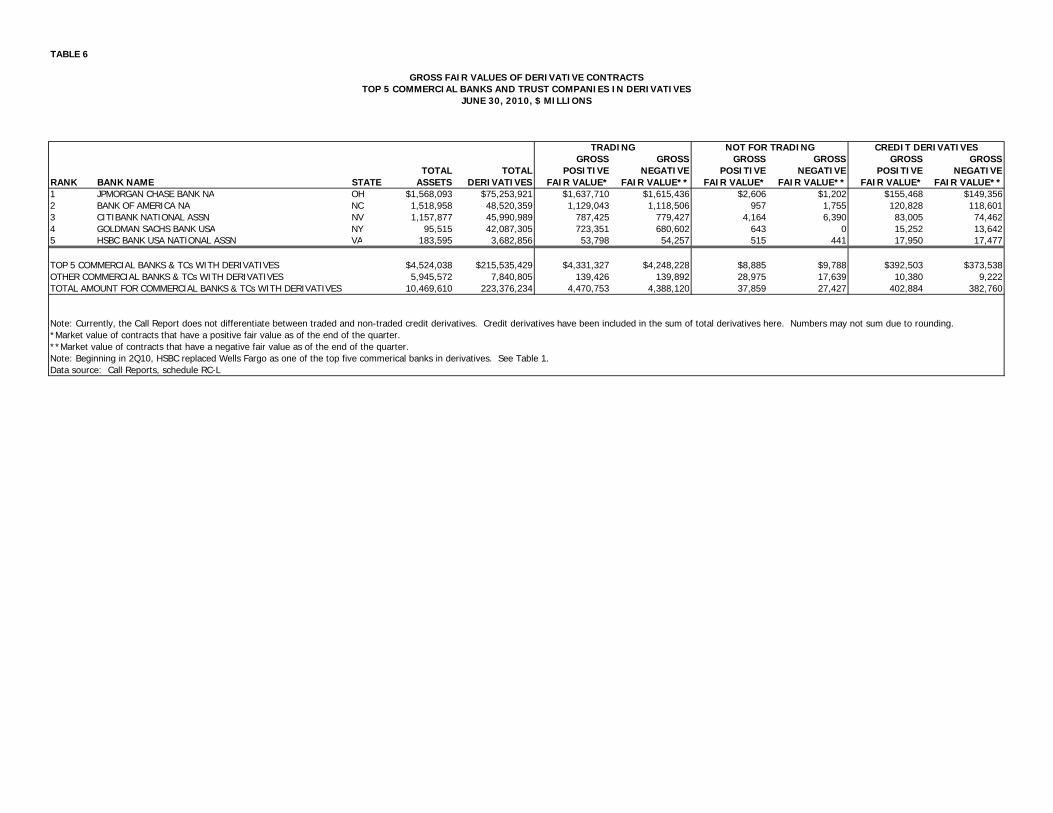
TABLE 6
GROSS GROSS GROSS GROSS GROSS GROSSTOTAL TOTAL POSITIVE NEGATIVE POSITIVE NEGATIVE POSITIVE NEGATIVE
RANK BANK NAME STATE ASSETS DERIVATIVES FAIR VALUE* FAIR VALUE** FAIR VALUE* FAIR VALUE** FAIR VALUE* FAIR VALUE**1 JPMORGAN CHASE BANK NA OH $1,568,093 $75,253,921 $1,637,710 $1,615,436 $2,606 $1,202 $155,468 $149,3562 BANK OF AMERICA NA NC 1,518,958 48,520,359 1,129,043 1,118,506 957 1,755 120,828 118,6013 CITIBANK NATIONAL ASSN NV 1,157,877 45,990,989 787,425 779,427 4,164 6,390 83,005 74,4624 GOLDMAN SACHS BANK USA NY 95,515 42,087,305 723,351 680,602 643 0 15,252 13,6425 HSBC BANK USA NATIONAL ASSN VA 183,595 3,682,856 53,798 54,257 515 441 17,950 17,477
TOP 5 COMMERCIAL BANKS & TCs WITH DERIVATIVES $4,524,038 $215,535,429 $4,331,327 $4,248,228 $8,885 $9,788 $392,503 $373,538OTHER COMMERCIAL BANKS & TCs WITH DERIVATIVES 5,945,572 7,840,805 139,426 139,892 28,975 17,639 10,380 9,222TOTAL AMOUNT FOR COMMERCIAL BANKS & TCs WITH DERIVATIVES 10,469,610 223,376,234 4,470,753 4,388,120 37,859 27,427 402,884 382,760
Note: Currently, the Call Report does not differentiate between traded and non-traded credit derivatives. Credit derivatives have been included in the sum of total derivatives here. Numbers may not sum due to rounding.*Market value of contracts that have a positive fair value as of the end of the quarter.**Market value of contracts that have a negative fair value as of the end of the quarter.Note: Beginning in 2Q10, HSBC replaced Wells Fargo as one of the top five commerical banks in derivatives. See Table 1.Data source: Call Reports, schedule RC-L
TRADING CREDIT DERIVATIVES
GROSS FAIR VALUES OF DERIVATIVE CONTRACTSTOP 5 COMMERCIAL BANKS AND TRUST COMPANIES IN DERIVATIVES
JUNE 30, 2010, $ MILLIONS
NOT FOR TRADING

TABLE 7
TOTAL TRADING TRADING REV TRADING REV TRADING REV TRADING REV TRADING REVREV FROM CASH & FROM FROM FROM FROM FROM
TOTAL TOTAL OFF BAL SHEET INT RATE FOREIGN EXCH EQUITY COMMOD & OTH CREDITRANK BANK NAME STATE ASSETS DERIVATIVES POSITIONS POSITIONS POSITIONS POSITIONS POSITIONS POSITIONS1 JPMORGAN CHASE BANK NA OH $1,568,093 $75,253,921 $2,344 $802 $420 $328 ($91) $8852 BANK OF AMERICA NA NC 1,518,958 48,520,359 732 320 227 95 (36) 1273 CITIBANK NATIONAL ASSN NV 1,157,877 45,990,989 2,215 1,222 500 (115) 44 5644 GOLDMAN SACHS BANK USA NY 95,515 42,087,305 618 (1,877) 2,217 0 0 2785 HSBC BANK USA NATIONAL ASSN VA 183,595 3,682,856 280 (61) 158 83 33 66
TOP 5 COMMERCIAL BANKS & TCs WITH DERIVATIVES $4,524,038 $215,535,429 $6,189 $407 $3,522 $391 ($50) $1,920OTHER COMMERCIAL BANKS & TCs WITH DERIVATIVES 5,945,572 7,840,805 411 (261) 739 (13) 26 (80)TOTAL AMOUNT FOR COMMERCIAL BANKS & TCs WITH DERIVATIVES 10,469,610 223,376,234 6,600 145 4,261 378 (25) 1,840
Note: Trading revenue is defined here as "trading revenue from cash instruments and off balance sheet derivative instruments."Note: Numbers may not sum due to rounding.Note: Beginning in 2Q10, HSBC replaced Wells Fargo as one of the top five commerical banks in derivatives. See Table 1.Data source: Call Reports, schedule RI
Note: Effective in the first quarter of 2007, trading revenues from credit exposures are reported separately, along with the four other types of exposures. The total derivatives column includes credit exposures.
TRADING REVENUES FROM CASH INSTRUMENTS AND DERIVATIVESTOP 5 COMMERCIAL BANKS AND TRUST COMPANIES IN DERIVATIVES
NOTE: REVENUE FIGURES ARE FOR THE QUARTER (NOT YEAR-TO-DATE)JUNE 30, 2010, $ MILLIONS
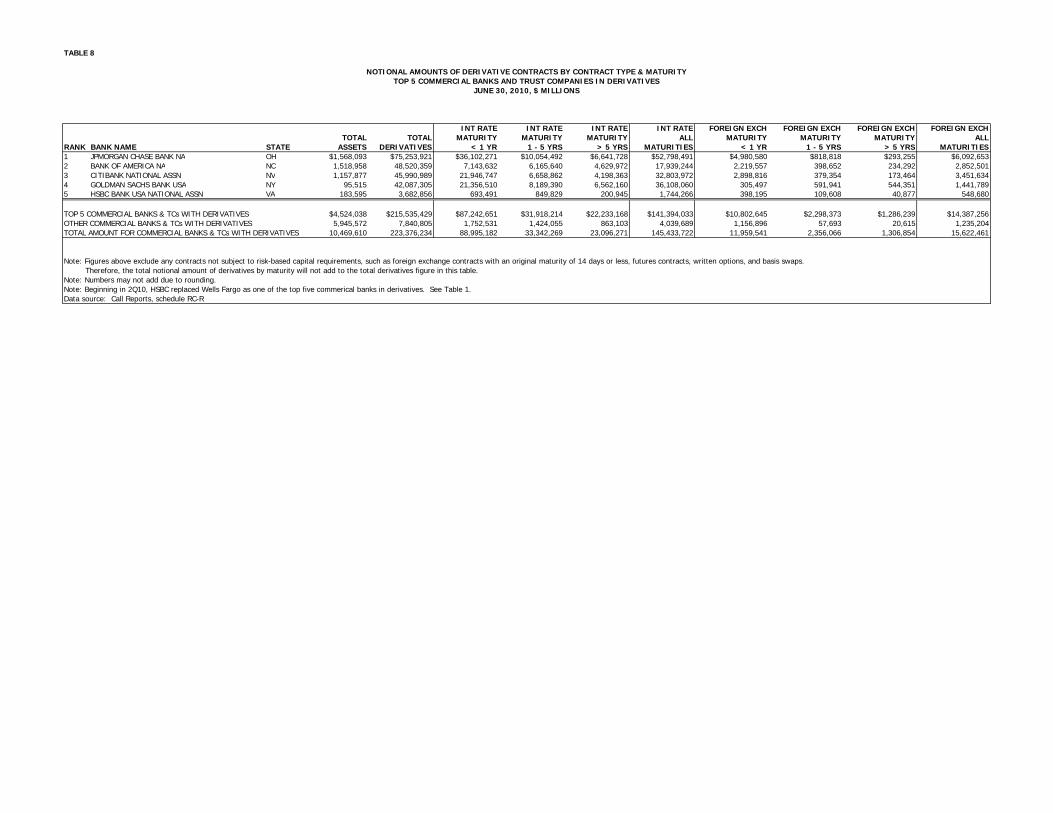
TABLE 8
INT RATE INT RATE INT RATE INT RATE FOREIGN EXCH FOREIGN EXCH FOREIGN EXCH FOREIGN EXCHTOTAL TOTAL MATURITY MATURITY MATURITY ALL MATURITY MATURITY MATURITY ALL
RANK BANK NAME STATE ASSETS DERIVATIVES < 1 YR 1 - 5 YRS > 5 YRS MATURITIES < 1 YR 1 - 5 YRS > 5 YRS MATURITIES1 JPMORGAN CHASE BANK NA OH $1,568,093 $75,253,921 $36,102,271 $10,054,492 $6,641,728 $52,798,491 $4,980,580 $818,818 $293,255 $6,092,6532 BANK OF AMERICA NA NC 1,518,958 48,520,359 7,143,632 6,165,640 4,629,972 17,939,244 2,219,557 398,652 234,292 2,852,5013 CITIBANK NATIONAL ASSN NV 1,157,877 45,990,989 21,946,747 6,658,862 4,198,363 32,803,972 2,898,816 379,354 173,464 3,451,6344 GOLDMAN SACHS BANK USA NY 95,515 42,087,305 21,356,510 8,189,390 6,562,160 36,108,060 305,497 591,941 544,351 1,441,7895 HSBC BANK USA NATIONAL ASSN VA 183,595 3,682,856 693,491 849,829 200,945 1,744,266 398,195 109,608 40,877 548,680
TOP 5 COMMERCIAL BANKS & TCs WITH DERIVATIVES $4,524,038 $215,535,429 $87,242,651 $31,918,214 $22,233,168 $141,394,033 $10,802,645 $2,298,373 $1,286,239 $14,387,256OTHER COMMERCIAL BANKS & TCs WITH DERIVATIVES 5,945,572 7,840,805 1,752,531 1,424,055 863,103 4,039,689 1,156,896 57,693 20,615 1,235,204TOTAL AMOUNT FOR COMMERCIAL BANKS & TCs WITH DERIVATIVES 10,469,610 223,376,234 88,995,182 33,342,269 23,096,271 145,433,722 11,959,541 2,356,066 1,306,854 15,622,461
Note: Figures above exclude any contracts not subject to risk-based capital requirements, such as foreign exchange contracts with an original maturity of 14 days or less, futures contracts, written options, and basis swaps. Therefore, the total notional amount of derivatives by maturity will not add to the total derivatives figure in this table.Note: Numbers may not add due to rounding.Note: Beginning in 2Q10, HSBC replaced Wells Fargo as one of the top five commerical banks in derivatives. See Table 1.Data source: Call Reports, schedule RC-R
NOTIONAL AMOUNTS OF DERIVATIVE CONTRACTS BY CONTRACT TYPE & MATURITYTOP 5 COMMERCIAL BANKS AND TRUST COMPANIES IN DERIVATIVES
JUNE 30, 2010, $ MILLIONS
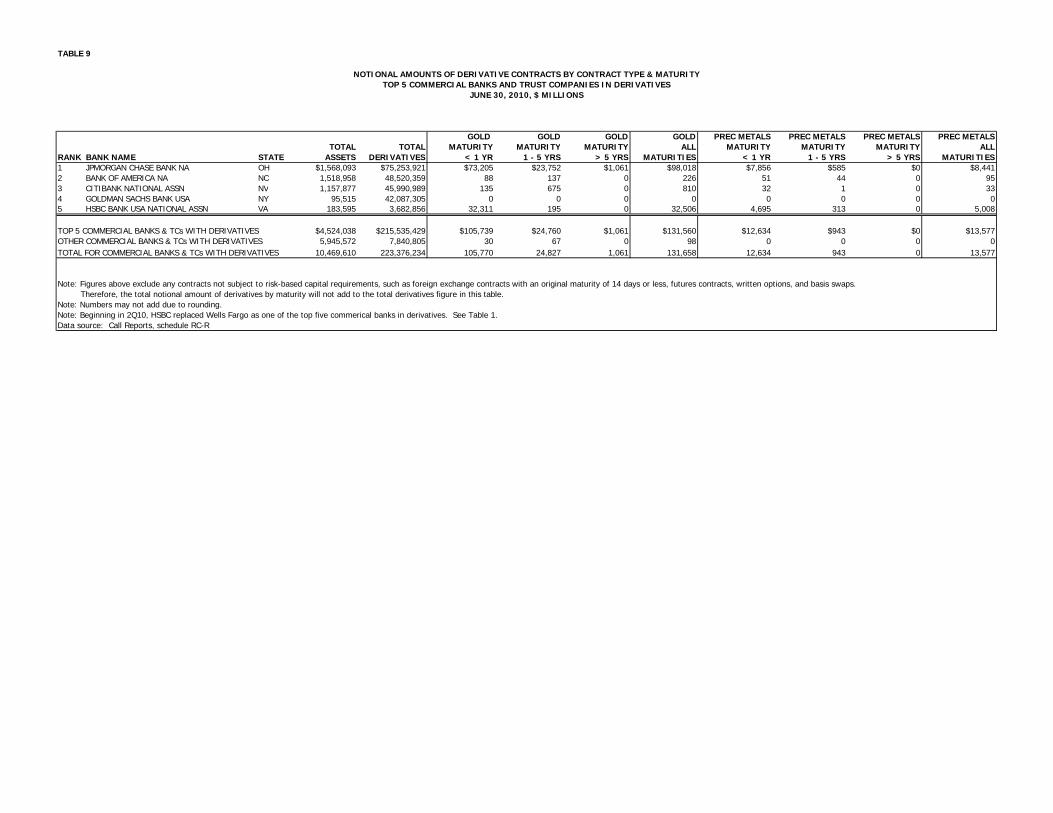
TABLE 9
GOLD GOLD GOLD GOLD PREC METALS PREC METALS PREC METALS PREC METALSTOTAL TOTAL MATURITY MATURITY MATURITY ALL MATURITY MATURITY MATURITY ALL
RANK BANK NAME STATE ASSETS DERIVATIVES < 1 YR 1 - 5 YRS > 5 YRS MATURITIES < 1 YR 1 - 5 YRS > 5 YRS MATURITIES1 JPMORGAN CHASE BANK NA OH $1,568,093 $75,253,921 $73,205 $23,752 $1,061 $98,018 $7,856 $585 $0 $8,4412 BANK OF AMERICA NA NC 1,518,958 48,520,359 88 137 0 226 51 44 0 953 CITIBANK NATIONAL ASSN NV 1,157,877 45,990,989 135 675 0 810 32 1 0 334 GOLDMAN SACHS BANK USA NY 95,515 42,087,305 0 0 0 0 0 0 0 05 HSBC BANK USA NATIONAL ASSN VA 183,595 3,682,856 32,311 195 0 32,506 4,695 313 0 5,008
TOP 5 COMMERCIAL BANKS & TCs WITH DERIVATIVES $4,524,038 $215,535,429 $105,739 $24,760 $1,061 $131,560 $12,634 $943 $0 $13,577OTHER COMMERCIAL BANKS & TCs WITH DERIVATIVES 5,945,572 7,840,805 30 67 0 98 0 0 0 0TOTAL FOR COMMERCIAL BANKS & TCs WITH DERIVATIVES 10,469,610 223,376,234 105,770 24,827 1,061 131,658 12,634 943 0 13,577
Note: Figures above exclude any contracts not subject to risk-based capital requirements, such as foreign exchange contracts with an original maturity of 14 days or less, futures contracts, written options, and basis swaps. Therefore, the total notional amount of derivatives by maturity will not add to the total derivatives figure in this table.Note: Numbers may not add due to rounding.Note: Beginning in 2Q10, HSBC replaced Wells Fargo as one of the top five commerical banks in derivatives. See Table 1.Data source: Call Reports, schedule RC-R
NOTIONAL AMOUNTS OF DERIVATIVE CONTRACTS BY CONTRACT TYPE & MATURITYTOP 5 COMMERCIAL BANKS AND TRUST COMPANIES IN DERIVATIVES
JUNE 30, 2010, $ MILLIONS

TABLE 10
OTHER COMM OTHER COMM OTHER COMM OTHER COMM EQUITY EQUITY EQUITY EQUITYTOTAL TOTAL MATURITY MATURITY MATURITY ALL MATURITY MATURITY MATURITY ALL
RANK BANK NAME STATE ASSETS DERIVATIVES < 1 YR 1 - 5 YRS > 5 YRS MATURITIES < 1 YR 1 - 5 YRS > 5 YRS MATURITIES1 JPMORGAN CHASE BANK NA OH $1,568,093 $75,253,921 $139,484 $156,896 $26,914 $323,294 $228,870 $121,919 $41,583 $392,3722 BANK OF AMERICA NA NC 1,518,958 48,520,359 687 318 0 1,005 15,355 23,556 16,071 54,9823 CITIBANK NATIONAL ASSN NV 1,157,877 45,990,989 44,559 5,790 606 50,955 64,367 34,833 14,522 113,7224 GOLDMAN SACHS BANK USA NY 95,515 42,087,305 7,439 3,501 0 10,940 77 9 215 3015 HSBC BANK USA NATIONAL ASSN VA 183,595 3,682,856 334 81 0 414 4,163 6,868 3,329 14,360
TOP 5 COMMERCIAL BANKS & TCs WITH DERIVATIVES $4,524,038 $215,535,429 $192,503 $166,585 $27,520 $386,608 $312,832 $187,184 $75,720 $575,736OTHER COMMERCIAL BANKS & TCs WITH DERIVATIVES 5,945,572 7,840,805 13,296 17,964 1,878 33,138 13,908 18,052 4,865 36,826TOTAL FOR COMMERCIAL BANKS & TCs WITH DERIVATIVES 10,469,610 223,376,234 205,799 184,550 29,398 419,747 326,740 205,236 80,586 612,562
Note: Figures above exclude any contracts not subject to risk-based capital requirements, such as foreign exchange contracts with an original maturity of 14 days or less, futures contracts, written options, and basis swaps. Therefore, the total notional amount of derivatives by maturity will not add to the total derivatives figure in this table.Note: Numbers may not add due to rounding.Note: Beginning in 2Q10, HSBC replaced Wells Fargo as one of the top five commerical banks in derivatives. See Table 1.Data source: Call Reports, schedule RC-R
JUNE 30, 2010, $ MILLIONS
NOTIONAL AMOUNTS OF DERIVATIVE CONTRACTS BY CONTRACT TYPE & MATURITYTOP 5 COMMERCIAL BANKS AND TRUST COMPANIES IN DERIVATIVES
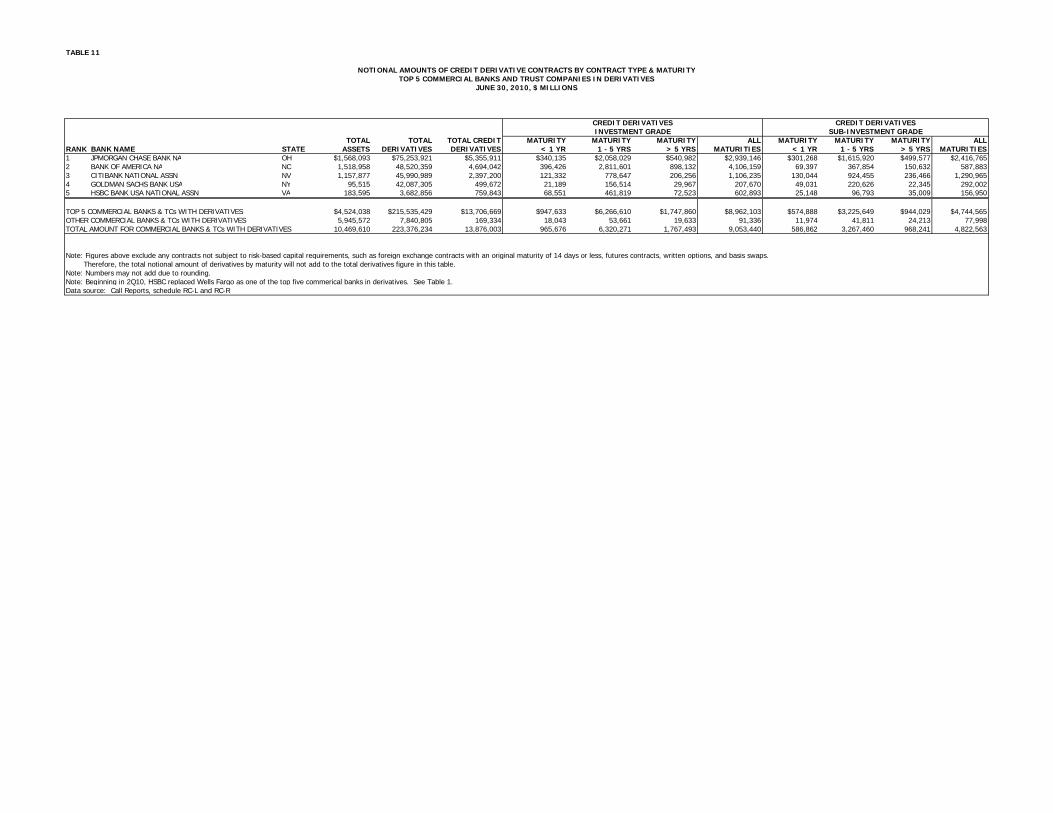
TABLE 11
TOTAL TOTAL TOTAL CREDIT MATURITY MATURITY MATURITY ALL MATURITY MATURITY MATURITY ALLRANK BANK NAME STATE ASSETS DERIVATIVES DERIVATIVES < 1 YR 1 - 5 YRS > 5 YRS MATURITIES < 1 YR 1 - 5 YRS > 5 YRS MATURITIES1 JPMORGAN CHASE BANK NA OH $1,568,093 $75,253,921 $5,355,911 $340,135 $2,058,029 $540,982 $2,939,146 $301,268 $1,615,920 $499,577 $2,416,7652 BANK OF AMERICA NA NC 1,518,958 48,520,359 4,694,042 396,426 2,811,601 898,132 4,106,159 69,397 367,854 150,632 587,8833 CITIBANK NATIONAL ASSN NV 1,157,877 45,990,989 2,397,200 121,332 778,647 206,256 1,106,235 130,044 924,455 236,466 1,290,9654 GOLDMAN SACHS BANK USA NY 95,515 42,087,305 499,672 21,189 156,514 29,967 207,670 49,031 220,626 22,345 292,0025 HSBC BANK USA NATIONAL ASSN VA 183,595 3,682,856 759,843 68,551 461,819 72,523 602,893 25,148 96,793 35,009 156,950
TOP 5 COMMERCIAL BANKS & TCs WITH DERIVATIVES $4,524,038 $215,535,429 $13,706,669 $947,633 $6,266,610 $1,747,860 $8,962,103 $574,888 $3,225,649 $944,029 $4,744,565OTHER COMMERCIAL BANKS & TCs WITH DERIVATIVES 5,945,572 7,840,805 169,334 18,043 53,661 19,633 91,336 11,974 41,811 24,213 77,998TOTAL AMOUNT FOR COMMERCIAL BANKS & TCs WITH DERIVATIVES 10,469,610 223,376,234 13,876,003 965,676 6,320,271 1,767,493 9,053,440 586,862 3,267,460 968,241 4,822,563
Note: Figures above exclude any contracts not subject to risk-based capital requirements, such as foreign exchange contracts with an original maturity of 14 days or less, futures contracts, written options, and basis swaps. Therefore, the total notional amount of derivatives by maturity will not add to the total derivatives figure in this table.Note: Numbers may not add due to rounding.Note: Beginning in 2Q10, HSBC replaced Wells Fargo as one of the top five commerical banks in derivatives. See Table 1.Data source: Call Reports, schedule RC-L and RC-R
SUB-INVESTMENT GRADEINVESTMENT GRADECREDIT DERIVATIVES
NOTIONAL AMOUNTS OF CREDIT DERIVATIVE CONTRACTS BY CONTRACT TYPE & MATURITYTOP 5 COMMERCIAL BANKS AND TRUST COMPANIES IN DERIVATIVES
CREDIT DERIVATIVES
JUNE 30, 2010, $ MILLIONS

TABLE 12
TOTAL CREDIT TOTAL OTHER CREDIT TOTAL OTHERTOTAL TOTAL CREDIT DEFAULT RETURN CREDIT CREDIT DEFAULT RETURN CREDIT CREDIT
RANK BANK NAME STATE ASSETS DERIVATIVES DERVATIVES BOUGHT SOLD SWAPS SWAPS OPTIONS DERIVATIVES SWAPS SWAPS OPTIONS DERIVATIVES1 JPMORGAN CHASE BANK NA OH $1,568,093 $69,898,010 $5,355,911 $2,699,004 $2,656,907 $2,632,094 $16,534 $31,820 $18,556 $2,622,841 $1,186 $32,069 $8112 BANK OF AMERICA NA NC 1,518,958 43,826,316 4,694,042 2,336,738 2,357,304 2,324,992 1,586 10,160 0 2,342,950 5,052 9,302 03 CITIBANK NATIONAL ASSN NV 1,157,877 43,593,789 2,397,200 1,246,443 1,150,757 1,219,929 26,462 52 0 1,146,270 4,437 50 04 GOLDMAN SACHS BANK USA NY 95,515 41,587,633 499,672 299,342 200,330 210,684 4,560 16,950 67,148 189,988 4,452 5,883 75 HSBC BANK USA NATIONAL ASSN VA 183,595 2,923,012 759,843 377,842 382,002 364,318 13,274 250 0 368,696 13,306 0 06 WELLS FARGO BANK NA SD 1,073,280 3,485,959 126,297 63,645 62,652 63,058 587 0 0 62,492 160 0 07 BANK OF NEW YORK MELLON NY 175,994 1,457,129 776 774 2 774 0 0 0 2 0 0 08 STATE STREET BANK&TRUST CO MA 157,474 748,996 155 155 0 155 0 0 0 0 0 0 09 PNC BANK NATIONAL ASSN DE 251,075 368,100 4,007 1,995 2,012 750 0 0 1,245 417 0 0 1,59510 SUNTRUST BANK GA 160,509 281,093 1,734 988 745 393 594 0 1 142 594 0 911 NORTHERN TRUST CO IL 66,624 203,163 127 127 0 127 0 0 0 0 0 0 012 REGIONS BANK AL 131,011 132,485 572 81 492 0 0 0 81 0 0 0 49213 U S BANK NATIONAL ASSN OH 278,465 93,131 2,180 861 1,319 116 0 0 745 0 0 0 1,31914 KEYBANK NATIONAL ASSN OH 90,663 86,884 3,640 2,022 1,617 2,022 0 0 0 1,492 125 0 015 FIFTH THIRD BANK OH 110,026 70,304 988 164 824 0 0 0 164 0 0 0 82416 BRANCH BANKING&TRUST CO NC 149,199 65,569 0 0 0 0 0 0 0 0 0 0 017 TD BANK NATIONAL ASSN DE 152,617 56,380 188 113 75 113 1 0 0 75 0 0 018 RBS CITIZENS NATIONAL ASSN RI 112,312 46,437 1,034 0 1,034 0 0 0 0 0 0 0 1,03419 MORGAN STANLEY BANK NA UT 65,746 23,589 19,930 19,930 0 19,582 0 0 348 0 0 0 020 UNION BANK NATIONAL ASSN CA 83,842 38,994 0 0 0 0 0 0 0 0 0 0 021 TD BANK USA NATIONAL ASSN ME 11,021 37,911 0 0 0 0 0 0 0 0 0 0 022 ALLY BANK UT 61,693 33,730 0 0 0 0 0 0 0 0 0 0 023 DEUTSCHE BANK TR CO AMERICAS NY 42,306 24,519 4,448 4,380 68 68 4,312 0 0 68 0 0 024 HUNTINGTON NATIONAL BANK OH 51,212 25,476 834 113 721 0 0 0 113 0 0 0 72125 BANK OF OKLAHOMA NA OK 16,621 25,374 0 0 0 0 0 0 0 0 0 0 0
TOP 25 COMMERCIAL BANKS & TCs WITH DERIVATIVES $7,765,727 $209,133,983 $13,873,578 $7,054,717 $6,818,862 $6,839,175 $67,910 $59,232 $88,400 $6,735,433 $29,312 $47,304 $6,812OTHER COMMERCIAL BANKS & TCs WITH DERIVATIVES 2,703,882 366,248 2,425 1,650 775 6 59 0 1,585 105 0 0 670TOTAL AMOUNT FOR COMMERCIAL BANKS & TCs WITH DERIVATIVES 10,469,610 209,500,231 13,876,003 7,056,367 6,819,637 6,839,181 67,969 59,232 89,985 6,735,538 29,312 47,304 7,483
(%) (%) (%) (%) (%) (%) (%) (%) (%) (%) (%)TOP 25 COMMERCIAL BANKS & TC % OF TOTAL COMMERCIAL BANKS &TC WITH DERIVATIVES 100 0 50 8 49 1 49 3 0 5 0 4 0 6 48 5 0 2 0 3 0 0
DISTRIBUTION OF CREDIT DERIVATIVE CONTRACTSTOP 25 COMMERCIAL BANKS AND TRUST COMPANIES IN DERIVATIVES
DERIVATIVESBOUGHT SOLDTOTAL CREDIT
JUNE 30, 2010, $ MILLIONS
TOP 25 COMMERCIAL BANKS & TC: % OF TOTAL COMMERCIAL BANKS &TCs WITH DERIVATIVES 100.0 50.8 49.1 49.3 0.5 0.4 0.6 48.5 0.2 0.3 0.0OTHER COMMERCIAL BANKS & TCs: % OF TOTAL COMMERCIAL BANKs & TCs WITH DERIVATIVES 0.0 0.0 0.0 0.0 0.0 0.0 0.0 0.0 0.0 0.0 0.0TOTAL AMOUNT FOR COMMERCIAL BANKs & TCs: % OF TOTAL COMMERCIAL BANKs & TCs WITH DERIVATIVES 100.0 50.9 49.1 49.3 0.5 0.4 0.6 48.5 0.2 0.3 0.1
Note: Credit derivatives have been excluded from the sum of total derivatives here.Note: Numbers may not add due to rounding.Data source: Call Reports, schedule RC-L