Comparison of Viking Lander Descent Data and MOLA Topography Reveals Kilometer-Scale Offset in Mars...
3
Icarus 159, 259–261 (2002) doi:10.1006/icar.2002.6914 NOTE Comparison of Viking Lander Descent Data and MOLA Topography Reveals Kilometer-Scale Offset in Mars Atmosphere Profiles Paul Withers and R. D. Lorenz Lunar and Planetary Laboratory, University of Arizona, Tucson, Arizona 85721 E-mail: [email protected] and G. A. Neumann Earth, Atmospheric, and Planetary Sciences Department, Massachusetts Institute of Technology, Cambridge, Massachusetts 02139 Received February 4, 2002; revised March 25, 2002 Each Viking Lander measured a topographic profile during entry. Comparing to MOLA, we find a vertical offset of 1–2 km in the Vik- ing trajectory. Hence, Viking atmospheric densities and pressures at a given altitude are 10–20% too large. c 2002 Elsevier Science (USA) Key Words: atmospheres, structure; Mars, atmosphere. Comparison of the martian topographic profile measured by Viking Lander 1 beneath its atmospheric entry trajectory to high-resolution topographic data gen- erated by the Mars Orbiter Laser Altimeter (MOLA) instrument on the Mars Global Surveyor (MGS) spacecraft reveals a vertical offset of over 1 km in the Viking profile. The Viking profile, generated from accelerometer and radar altimeter measurements during descent through the martian atmosphere, is a major constraint on derived vertical profiles of atmospheric density, pressure, and temperature. These atmospheric profiles have been at the heart of the Mars Reference Atmosphere for two decades. The error in the topographic profile causes previously published values of atmospheric density and pressure at a given altitude to be too large by a systematic and correctable offset of 10–20%. During its descent through the martian atmosphere, Viking Lander 1 expe- rienced aerodynamic deceleration. Regular measurements of this deceleration were used with an initial entry state and knowledge of the martian gravitational field to reconstruct the spacecraft’s trajectory to landing. They were then com- bined with knowledge of the spacecraft’s aerodynamic characteristics to deduce profiles of atmospheric density, pressure, and temperature. Additional data sets, including radar altimeter measurements of altitude above the spatially varying martian topography, were used to constrain the reconstructed trajectory and atmospheric profiles (Seiff and Kirk 1977a). A by-product of this analysis is a profile of planetary radius relative to the landing site as a function of distance from the landing site, where distance is measured beneath the spacecraft trajectory (Seiff 1993, Seiff and Kirk 1977b). The Viking 1 profile was published by Seiff (1993, his Figure 13). Using the spacecraft trajectory, archived at the National Space Science Data Center as dataset PSPA-00269, and the landing site coordinates (22.272 ± 0.002 ◦ N, 47.94 ± 0.2 ◦ W (Viking-era areocentric coordinates)), we converted distance be- neath the trajectory into areocentric latitude and longitude (Mayo et al. 1977). West areocentric longitudes, when subtracted from 360 ◦ give east areocen- tric longitudes. 0.2 ◦ was then subtracted from the Viking-era east longitudes to convert them into MGS-era (1991 IAU) east longitudes used by MOLA (Smith et al. 1998, 1999). We used these latitudes and longitudes in the MOLA 1/16 degree resolution planetary radius dataset to obtain corresponding MOLA values for planetary radius relative to the landing site as a function of distance from the Viking 1 landing site. Figure 1 shows the Viking 1 profile, as scanned and manually digitized, and the corresponding MOLA profile (Seiff 1993). No vertical offset has been ap- plied. Many features in one profile can be seen at the same distance along the other profile. This suggests that the radar altimeter was working well during atmospheric entry. A vertical offset is present between the two profiles. The Viking 1 profile is 2.3 km too high at a distance of 640 km from the landing site. The spacecraft is at approximately 130 km altitude at this time. This offset decreases, approximately linearly, to 0.8 km at a distance of 140 km from the landing site. The spacecraft is at approximately 30 km altitude at this time. This offset in the Viking topographic profile must also be present in the altitude scale for the atmospheric profiles. Figure 2 shows a shaded relief map of the MOLA 1/16-degree resolution planetary radius dataset. Topographic features along the ground track can be matched to features on the profiles in Fig. 1. Smoothed contour intervals are also shown in Fig. 2. No region 6 km above the Viking 1 landing site is closer than about 1000 km to the landing site, significantly further away than the 600 km or so inferred from Seiff’s figure. This provides a quick and simple way of discovering the offset in the Viking topographic profile. The direction of the offset can be calculated in the following manner. When the Viking Lander radar altimeter measures that it is 120 km above the terrain below, the original trajectory reconstruction, primarily from the accelerometer data, locates the spacecraft at 126 km above, and some 600 km horizontally from, the landing site. This puts the underlying terrain at this point along the ground track at 6 km above the landing site, as shown in Fig. 1. The radar altimeter value of 120 km is correct but, due to uncertainties in the trajectory reconstruction, the trajectory reconstruction value of 126 km is not correct. Since accurate MOLA data show that the underlying terrain is only 4 km above the landing site, the spacecraft is only 124 km above the landing site. This is 2 km below the original trajectory reconstruction. The original density profile has a value of about 10 −8 kg m −3 at 126 km altitude. This density value is actually valid at 124 km altitude, 2 km below where it was originally located. Consequently, the density value reassigned to 126 km altitude is lower than it was originally. Altitudes as a function of density are too large and densities as a function of altitude are also too large. The same altitude scale is used for the pressure and temperature profiles, so the same corrections apply. The close correspondence between the small-scale structures in the Viking and MOLA profiles in Fig. 1 suggests that the errors in latitude and longitude 259 0019-1035/02 $35.00 c 2002 Elsevier Science (USA) All rights reserved.
-
Upload
paul-withers -
Category
Documents
-
view
213 -
download
0
Transcript of Comparison of Viking Lander Descent Data and MOLA Topography Reveals Kilometer-Scale Offset in Mars...

Icarus 159, 259–261 (2002)doi:10.1006/icar.2002.6914
NOTE
Comparison of Viking Lander Descent Data and MOLA TopographyReveals Kilometer-Scale Offset in Mars Atmosphere Profiles
Paul Withers and R. D. Lorenz
Lunar and Planetary Laboratory, University of Arizona, Tucson, Arizona 85721E-mail: [email protected]
and
G. A. Neumann
Earth, Atmospheric, and Planetary Sciences Department, Massachusetts Institute of Technology, Cambridge, Massachusetts 02139
Received February 4, 2002; revised March 25, 2002
Each Viking Lander measured a topographic profile during entry.Comparing to MOLA, we find a vertical offset of 1–2 km in the Vik-ing trajectory. Hence, Viking atmospheric densities and pressuresat a given altitude are 10–20% too large. c© 2002 Elsevier Science (USA)
Key Words: atmospheres, structure; Mars, atmosphere.
Comparison of the martian topographic profile measured by Viking Lander 1
(Smith et al. 1998, 1999). We used these latitudes and longitudes in the
9
beneath its atmospheric entry trajectory to high-resolution topographic data gen-erated by the Mars Orbiter Laser Altimeter (MOLA) instrument on the MarsGlobal Surveyor (MGS) spacecraft reveals a vertical offset of over 1 km inthe Viking profile. The Viking profile, generated from accelerometer and radaraltimeter measurements during descent through the martian atmosphere, is amajor constraint on derived vertical profiles of atmospheric density, pressure,and temperature. These atmospheric profiles have been at the heart of the MarsReference Atmosphere for two decades. The error in the topographic profilecauses previously published values of atmospheric density and pressure at agiven altitude to be too large by a systematic and correctable offset of 10–20%.
During its descent through the martian atmosphere, Viking Lander 1 expe-rienced aerodynamic deceleration. Regular measurements of this decelerationwere used with an initial entry state and knowledge of the martian gravitationalfield to reconstruct the spacecraft’s trajectory to landing. They were then com-bined with knowledge of the spacecraft’s aerodynamic characteristics to deduceprofiles of atmospheric density, pressure, and temperature. Additional data sets,including radar altimeter measurements of altitude above the spatially varyingmartian topography, were used to constrain the reconstructed trajectory andatmospheric profiles (Seiff and Kirk 1977a).
A by-product of this analysis is a profile of planetary radius relative to thelanding site as a function of distance from the landing site, where distance ismeasured beneath the spacecraft trajectory (Seiff 1993, Seiff and Kirk 1977b).The Viking 1 profile was published by Seiff (1993, his Figure 13). Usingthe spacecraft trajectory, archived at the National Space Science Data Centeras dataset PSPA-00269, and the landing site coordinates (22.272 ± 0.002◦ N,47.94 ± 0.2◦ W (Viking-era areocentric coordinates)), we converted distance be-neath the trajectory into areocentric latitude and longitude (Mayo et al. 1977).West areocentric longitudes, when subtracted from 360◦ give east areocen-tric longitudes. 0.2◦ was then subtracted from the Viking-era east longitudesto convert them into MGS-era (1991 IAU) east longitudes used by MOLA
25
MOLA 1/16 degree resolution planetary radius dataset to obtain correspondingMOLA values for planetary radius relative to the landing site as a function ofdistance from the Viking 1 landing site.
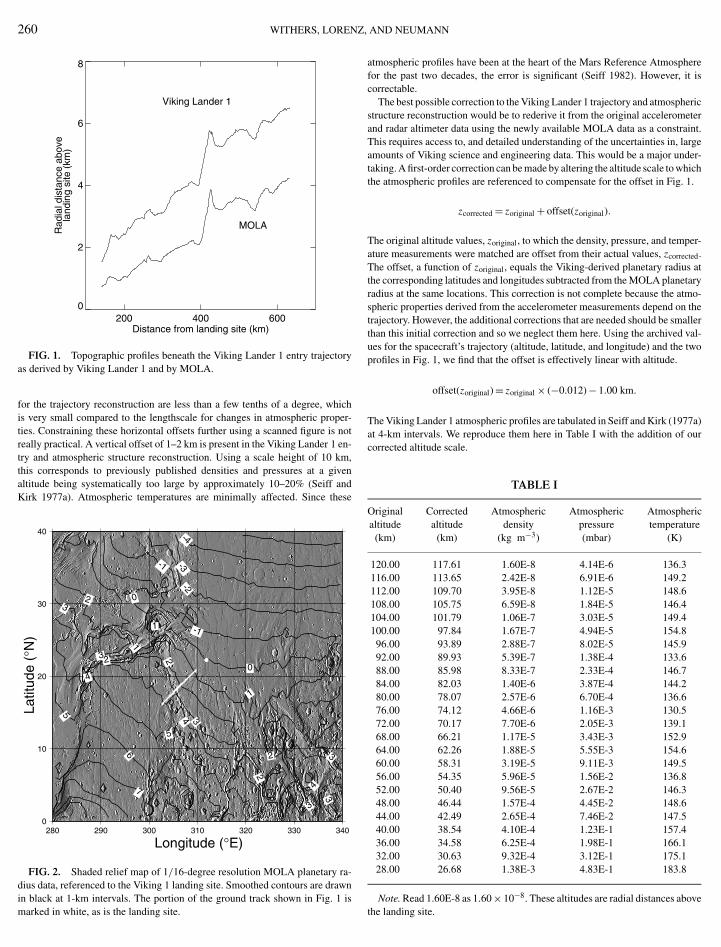
Figure 1 shows the Viking 1 profile, as scanned and manually digitized, andthe corresponding MOLA profile (Seiff 1993). No vertical offset has been ap-plied. Many features in one profile can be seen at the same distance along theother profile. This suggests that the radar altimeter was working well duringatmospheric entry. A vertical offset is present between the two profiles. TheViking 1 profile is 2.3 km too high at a distance of 640 km from the landingsite. The spacecraft is at approximately 130 km altitude at this time. This offsetdecreases, approximately linearly, to 0.8 km at a distance of 140 km from thelanding site. The spacecraft is at approximately 30 km altitude at this time. Thisoffset in the Viking topographic profile must also be present in the altitude scalefor the atmospheric profiles. Figure 2 shows a shaded relief map of the MOLA1/16-degree resolution planetary radius dataset. Topographic features along theground track can be matched to features on the profiles in Fig. 1. Smoothedcontour intervals are also shown in Fig. 2. No region 6 km above the Viking 1landing site is closer than about 1000 km to the landing site, significantly furtheraway than the 600 km or so inferred from Seiff’s figure. This provides a quickand simple way of discovering the offset in the Viking topographic profile.
The direction of the offset can be calculated in the following manner. Whenthe Viking Lander radar altimeter measures that it is 120 km above the terrainbelow, the original trajectory reconstruction, primarily from the accelerometerdata, locates the spacecraft at 126 km above, and some 600 km horizontally from,the landing site. This puts the underlying terrain at this point along the groundtrack at 6 km above the landing site, as shown in Fig. 1. The radar altimeter valueof 120 km is correct but, due to uncertainties in the trajectory reconstruction,the trajectory reconstruction value of 126 km is not correct. Since accurateMOLA data show that the underlying terrain is only 4 km above the landingsite, the spacecraft is only 124 km above the landing site. This is 2 km belowthe original trajectory reconstruction. The original density profile has a valueof about 10−8 kg m−3 at 126 km altitude. This density value is actually validat 124 km altitude, 2 km below where it was originally located. Consequently,the density value reassigned to 126 km altitude is lower than it was originally.Altitudes as a function of density are too large and densities as a function ofaltitude are also too large. The same altitude scale is used for the pressure andtemperature profiles, so the same corrections apply.
The close correspondence between the small-scale structures in the Vikingand MOLA profiles in Fig. 1 suggests that the errors in latitude and longitude
0019-1035/02 $35.00c© 2002 Elsevier Science (USA)
All rights reserved.
260 WITHERS, LORENZ
200 400 600Distance from landing site (km)
0
2
4
6
8R
adia
l dis
tanc
e ab
ove
land
ing
site
(km
)
Viking Lander 1
MOLA
FIG. 1. Topographic profiles beneath the Viking Lander 1 entry trajectoryas derived by Viking Lander 1 and by MOLA.
for the trajectory reconstruction are less than a few tenths of a degree, whichis very small compared to the lengthscale for changes in atmospheric proper-ties. Constraining these horizontal offsets further using a scanned figure is notreally practical. A vertical offset of 1–2 km is present in the Viking Lander 1 en-try and atmospheric structure reconstruction. Using a scale height of 10 km,this corresponds to previously published densities and pressures at a givenaltitude being systematically too large by approximately 10–20% (Seiff andKirk 1977a). Atmospheric temperatures are minimally affected. Since these
0
10
20
30
40
Latit
ude
(°N
)
280 290 300 310 320 330 340
Longitude (°E)
-4-3
-2
-1
-1
0
0
1
1
1
2
2
2
2
2
3
3
3
3
3
3
4
4
4
5
5
6
7
FIG. 2. Shaded relief map of 1/16-degree resolution MOLA planetary ra-dius data, referenced to the Viking 1 landing site. Smoothed contours are drawn
in black at 1-km intervals. The portion of the ground track shown in Fig. 1 ismarked in white, as is the landing site., AND NEUMANN
atmospheric profiles have been at the heart of the Mars Reference Atmospherefor the past two decades, the error is significant (Seiff 1982). However, it iscorrectable.
The best possible correction to the Viking Lander 1 trajectory and atmosphericstructure reconstruction would be to rederive it from the original accelerometerand radar altimeter data using the newly available MOLA data as a constraint.This requires access to, and detailed understanding of the uncertainties in, largeamounts of Viking science and engineering data. This would be a major under-taking. A first-order correction can be made by altering the altitude scale to whichthe atmospheric profiles are referenced to compensate for the offset in Fig. 1.
zcorrected = zoriginal + offset(zoriginal).
The original altitude values, zoriginal, to which the density, pressure, and temper-ature measurements were matched are offset from their actual values, zcorrected.The offset, a function of zoriginal, equals the Viking-derived planetary radius atthe corresponding latitudes and longitudes subtracted from the MOLA planetaryradius at the same locations. This correction is not complete because the atmo-spheric properties derived from the accelerometer measurements depend on thetrajectory. However, the additional corrections that are needed should be smallerthan this initial correction and so we neglect them here. Using the archived val-ues for the spacecraft’s trajectory (altitude, latitude, and longitude) and the twoprofiles in Fig. 1, we find that the offset is effectively linear with altitude.
offset(zoriginal) = zoriginal × (−0.012) − 1.00 km.
The Viking Lander 1 atmospheric profiles are tabulated in Seiff and Kirk (1977a)at 4-km intervals. We reproduce them here in Table I with the addition of ourcorrected altitude scale.
TABLE I
Original Corrected Atmospheric Atmospheric Atmosphericaltitude altitude density pressure temperature
(km) (km) (kg m−3) (mbar) (K)
120.00 117.61 1.60E-8 4.14E-6 136.3116.00 113.65 2.42E-8 6.91E-6 149.2112.00 109.70 3.95E-8 1.12E-5 148.6108.00 105.75 6.59E-8 1.84E-5 146.4104.00 101.79 1.06E-7 3.03E-5 149.4100.00 97.84 1.67E-7 4.94E-5 154.8
96.00 93.89 2.88E-7 8.02E-5 145.992.00 89.93 5.39E-7 1.38E-4 133.688.00 85.98 8.33E-7 2.33E-4 146.784.00 82.03 1.40E-6 3.87E-4 144.280.00 78.07 2.57E-6 6.70E-4 136.676.00 74.12 4.66E-6 1.16E-3 130.572.00 70.17 7.70E-6 2.05E-3 139.168.00 66.21 1.17E-5 3.43E-3 152.964.00 62.26 1.88E-5 5.55E-3 154.660.00 58.31 3.19E-5 9.11E-3 149.556.00 54.35 5.96E-5 1.56E-2 136.852.00 50.40 9.56E-5 2.67E-2 146.348.00 46.44 1.57E-4 4.45E-2 148.644.00 42.49 2.65E-4 7.46E-2 147.540.00 38.54 4.10E-4 1.23E-1 157.436.00 34.58 6.25E-4 1.98E-1 166.132.00 30.63 9.32E-4 3.12E-1 175.128.00 26.68 1.38E-3 4.83E-1 183.8
Note. Read 1.60E-8 as 1.60 × 10⁻⁸. These altitudes are radial distances abovethe landing site.

T
NOA kilometer-scale offset in the altitude of the Viking Lander 1 reconstructedentry trajectory has been identified by comparison between MOLA topographyand data from the Viking Lander 1 radar altimeter. This causes the results foratmospheric density and pressure at a given altitude that were derived fromthe Viking Lander 1 entry to be 10–20% too large. This is a significant sourceof error for the Mars Reference Atmosphere. This error can now, in principle,be corrected using MOLA topographic data, and we have made a first-ordercorrection to the atmospheric profiles. There is also the possibility of evaluatingthe performance of the Viking radar altimeter, which has interesting engineeringimplications.
ACKNOWLEDGMENTS
We thank Dave Smith, Maria Zuber, the MOLA Science Team, John Wilson,and two reviewers.
REFERENCES
Mayo, A. P., W. T. Blackshear, R. H. Tolson, W. H. Michael Jr., G. M. Kelly,J. P. Brenkle, and T. A. Komarek 1977. Lander locations, Mars physical
E 261
ephemeris, and Solar System parameters: Determination from Viking landertracking data. J. Geophys. Res. 82, 4297–4303.
Seiff, A. 1982. Post-Viking models for the structure of the summer atmosphereof Mars. Adv. Space Res. 2, 3–17.
Seiff, A. 1993. Mars atmospheric winds indicated by motion of the Vikinglanders during parachute descent. J. Geophys. Res. 98, 7461–7474.
Seiff, A., and D. B. Kirk 1977a. Structure of the atmosphere of Mars in summerat mid-latitudes. J. Geophys. Res. 82, 4363–4378.
Seiff, A., and D. B. Kirk 1977b. Viking Lander Altimeter update. In Min-utes of the Second Meeting of the Viking Mars Physical Properties WorkingGroup (assembled by J. W. Meredith), pp. 26–30. Jet Propulsion Laboratory,Pasadena.
Smith, D. E., M. T. Zuber, H. V. Frey, J. B. Garvin, J. W. Head, D. O.Muhleman, G. H. Pettengill, R. J. Phillips, S. C. Solomon, H. J. Zwally,W. B. Banerdt, and T. C. Duxbury 1998. Topography of the northernhemisphere of Mars from the Mars Orbiter Laser Altimeter. Science 279,1686–1690.
Smith, D. E., G. A. Neumann, P. Ford, R. E. Arvidson, E. A. Guinness, and S.Slavney 1999. Mars Global Surveyor laser altimeter initial experiment gridded
data record, NASA Planetary Data System, MGS-M-MOLA-5-IEGDR-L3-V1.0.