Comparison of Seismic Reflection and Ground...
13
Archaeological Prospection Archaeol. Prospect. 9, 9 – 21 (2002) Published online 6 February 2002 in Wiley InterScience (www.interscience.wiley.com). DOI: 10.1002/arp.177 Comparison of Seismic Reflection and Ground-penetrating Radar Imaging at the Controlled Archaeological Test Site, Champaign, Illinois J. A. HILDEBRAND, 1 * S. M. WIGGINS, 1 P. C. HENKART 1 AND L. B. CONYERS 2 1 Scripps Institution of Oceanography, University of California San Diego, La Jolla, CA 92093-0205, USA 2 Department of Anthropology, Denver University, Denver, CO, USA ABSTRACT Shallow seismic reflection and ground-penetrating radar images were collected at a replicated burial mound in the Controlled Archaeological Test Site (CATS) in Champaign, Illinois. The CATS mound contains a pig burial within a wood-lined crypt at a depth of 1.6–2.4 m. Seismic reflection data were collected from two different energy sources: a small (0.5 kg) hammer for an impulsive source, and a vibrator for a frequency swept source. Seismic data were collected at densely spaced points (5 cm) along a line of 48 geophone receivers. These data were stacked in a common mid-point gather, band-pass filtered, and processed with frequency–wavenumber migration. The seismic image produced by the hammer source was dominated by bodywaves at 120 Hz, whereas the vibrator source image was dominated by surface waves at 70 Hz. Both seismic sources revealed clear reflections from the burial crypt, and placed the top of the crypt at the correct depth with a seismic velocity of 120 m s 1 . The bottom of the crypt was poorly defined by the seismic data owing to multiple reflections within the crypt. The vibrator source also revealed a high- frequency (360 Hz) reflector at 2.7 m depth within the mound, perhaps due to a resonant cavity within the pig’s body. Single channel ground-penetrating radar data were processed with the same approach, including band-pass filtering and migration. The radar data reveal clear reflections from the burial crypt. Extremely fast radar velocities (260 mm ns 1 ) are required in the upper portion of the burial mound to place the top of the crypt at its correct depth. The bottom of the crypt was well defined by ground-penetrating radar, and was located accurately with respect to the top of the crypt with a moderate radar velocity (170 mm ns 1 ). The application of both seismic reflection and ground-penetrating radar to the same site may be beneficial for improved understanding of their abilities for shallow subsurface imaging. Copyright 2002 John Wiley & Sons, Ltd. Key words: seismic reflection; ground-penetrating radar; burial mound Introduction Reflection imaging methods hold great promise for investigating buried cultural resources (Steeples and Miller, 1990; Conyers and * Correspondence to: J. A. Hildebrand, Scripps Institution of Oceanography, University of California San Diego, CA 92093- 0205, USA. E-mail: [email protected] Goodman, 1997). Reflection imaging can provide information on the depth of buried objects and structures as well as their position within a site. A comparison is presented between two geophysical prospecting methods based on reflection imaging in shallow soil: seismic reflection imaging (SRI) and ground-penetrating radar (GPR). Seismic reflection and GPR imaging methods are similar in that both are based Copyright 2002 John Wiley & Sons, Ltd. Received 24 November 1999 Accepted 10 October 2001
Transcript of Comparison of Seismic Reflection and Ground...
Archaeological ProspectionArchaeol. Prospect. 9, 9–21 (2002)Published online 6 February 2002 in Wiley InterScience (www.interscience.wiley.com). DOI: 10.1002/arp.177
Comparison of Seismic Reflection andGround-penetrating Radar Imaging atthe Controlled Archaeological TestSite, Champaign, Illinois
J. A. HILDEBRAND,1* S. M. WIGGINS,1 P. C. HENKART1 ANDL. B. CONYERS2
1 Scripps Institution of Oceanography, University of California San Diego, La Jolla, CA92093-0205, USA2 Department of Anthropology, Denver University, Denver, CO, USA
ABSTRACT Shallow seismic reflection and ground-penetrating radar images were collected at a replicatedburial mound in the Controlled Archaeological Test Site (CATS) in Champaign, Illinois. The CATSmound contains a pig burial within a wood-lined crypt at a depth of 1.6–2.4 m. Seismic reflectiondata were collected from two different energy sources: a small (0.5 kg) hammer for an impulsivesource, and a vibrator for a frequency swept source. Seismic data were collected at denselyspaced points (5 cm) along a line of 48 geophone receivers. These data were stacked in a commonmid-point gather, band-pass filtered, and processed with frequency–wavenumber migration. Theseismic image produced by the hammer source was dominated by bodywaves at 120 Hz, whereasthe vibrator source image was dominated by surface waves at 70 Hz. Both seismic sourcesrevealed clear reflections from the burial crypt, and placed the top of the crypt at the correctdepth with a seismic velocity of 120 m s�1. The bottom of the crypt was poorly defined by theseismic data owing to multiple reflections within the crypt. The vibrator source also revealed a high-frequency (360 Hz) reflector at 2.7 m depth within the mound, perhaps due to a resonant cavitywithin the pig’s body. Single channel ground-penetrating radar data were processed with the sameapproach, including band-pass filtering and migration. The radar data reveal clear reflections fromthe burial crypt. Extremely fast radar velocities (260 mm ns�1) are required in the upper portion ofthe burial mound to place the top of the crypt at its correct depth. The bottom of the crypt waswell defined by ground-penetrating radar, and was located accurately with respect to the top ofthe crypt with a moderate radar velocity (170 mm ns�1). The application of both seismic reflectionand ground-penetrating radar to the same site may be beneficial for improved understanding oftheir abilities for shallow subsurface imaging. Copyright 2002 John Wiley & Sons, Ltd.
Key words: seismic reflection; ground-penetrating radar; burial mound
Introduction
Reflection imaging methods hold great promisefor investigating buried cultural resources(Steeples and Miller, 1990; Conyers and
* Correspondence to: J. A. Hildebrand, Scripps Institution ofOceanography, University of California San Diego, CA 92093-0205, USA. E-mail: [email protected]
Goodman, 1997). Reflection imaging can provideinformation on the depth of buried objectsand structures as well as their position withina site. A comparison is presented betweentwo geophysical prospecting methods basedon reflection imaging in shallow soil: seismicreflection imaging (SRI) and ground-penetratingradar (GPR). Seismic reflection and GPR imagingmethods are similar in that both are based
Copyright 2002 John Wiley & Sons, Ltd. Received 24 November 1999Accepted 10 October 2001

10 J. A. Hildebrand et al.
upon wave propagation through the soil, andupon wave reflection from buried objects orstructures. They are different in the type of wavesused for imaging—seismic or radar—making fordifferences in the efficiency of wave coupling,propagation and reflection.
Application of SRI and GPR at the samesite will improve our understanding of thesemethods for imaging buried objects or structures.In this paper, we apply SRI and GPR at theControlled Archaeological Test Site (CATS) inChampaign, Illinois, where a range of buriedobjects and features have been constructed tosimulate prehistoric cultural resources typical ofthe central USA (Isaacson et al., 1999). We imageda simulated burial mound, incorporating a pigwithin a wood-lined crypt at a depth of 1.6–2.4 m.Both the SRI and the GPR systems detected clearreflections from the burial crypt. By applyingseismic and radar techniques together at a settingwith known buried objects and structures, weprovide an evaluation of the relative imagingcharacteristics of these two approaches.
Background
Geophysical reflection imaging uses the sameexperimental geometry, whether seismic or radarwaves are used as the energy source. In bothcases, the sources and receivers are located at theground surface. An energy pulse is transmittedinto the ground, and is returned to the surfaceas a series of reflections from discontinuities atdepth. The reflected energy is received at oneor more locations along the ground surface, atnear normal incidence angles. Data are collectedas reflected energy versus time, and convertedto depth using knowledge of the propagationvelocity within the soil. To construct imagesof the subsurface reflectors, the sources andreceivers are moved along the ground surface.The resolving power for reflection imaging islimited by the wavelength of the energy source,which is controlled by the wave frequency andpropagation velocity. Attenuation and scatteringincrease for short wavelength energy, placingpractical limits on the highest frequencies thatmay be used, and therefore, on the overallimaging resolution.
Ground-penetrating radar uses radio fre-quency electromagnetic waves as an energysource, which are sensitive to the dielectric prop-erties of the soil and reflective objects withinit. The principal factors effecting soil dielectricproperties are clay composition, compaction andwater content. Increased water content results inlowered wave velocity (Topp et al., 1980). Thepresence of electrically conductive clay or alka-line soils results in high GPR energy attenuation,and limits the depth of its penetration into theground (Olhoeft, 1986). The GPR resolving poweris also limited by the wavelength of the electro-magnetic energy; operating in the 100–1000 MHzfrequency range, typical radar velocities in soilare 150 mm ns�1. The corresponding radar wave-lengths for soil imaging are 0.15–1.5 m, whichdetermines the resolution of detectable features.These wavelengths may attenuate at 2–30 dB permetre in soils, depending upon their compositionand water content (Olhoeft, 1986).
One advantage of GPR over SRI is thatradio frequency electromagnetic waves are easilycoupled to the soil by placing the antenna at ornear the ground surface. The antenna systemsused for GPR can be moderately sized, allowingthem to be easily transported for rapid datacollection. Under good field conditions, GPR iscapable of mapping up to 5000 m2 areas on a0.5 m grid spacing during one day in the field.These gridded GPR data can be processed intodepth slices, mapping the radar reflectivity ofburied surfaces (Goodman et al., 1995).
Imaging with acoustic or seismic waves has aproven capability when used for medical diagno-sis, undersea mapping and oil exploration (Claer-bout, 1985). Only relatively recently has seismicreflection or acoustic imaging been applied tosoils at depths of 10 m or less (Steeples, 1998;Baker et al., 1999; Frazier et al., 2000). Conven-tional seismic and acoustic techniques must bemodified to account for the properties of shallowsoils.
A key parameter for SRI is that severalpropagation modes may be present: longitudinal(P-waves), shear (S-waves) and surface waves.P-waves have particle motion in the directionof propagation; S-waves have particle motiontransverse to the propagation direction; andsurface waves are trapped at the ground surface
Copyright 2002 John Wiley & Sons, Ltd. Archaeol. Prospect. 9, 9–21 (2002)

Seismic Reflection and Radar Imaging Comparison 11
with retrograde-elliptical particle motion. Eachof these modes will have a distinct propagationvelocity in soil, although in general the P-wavevelocity will be more than twice that of the S-waveor surface wave velocity.
Seismic waves used for reflection imaging aresensitive to the elastic properties within thesoil. The principal factors effecting soil seismicvelocity are its composition (e.g. grain size),water content, and the confining pressure (Stoll,1989). Typical values for P-wave velocity inthe upper few metres of soil are 180–250 m s�1
(Steeples, 1998; Baker et al., 1999). At frequenciesof 100–1000 Hz, associated seismic wavelengthsare 0.2–2 m. These wavelengths set the resolutionthat may be attained by seismic imaging systems.Likewise, these wavelengths may attenuate at1–10 dB m�1 depending on soil composition andwater content.
The radar or seismic reflectivity of a buriedobject or structure is an important considerationfor how well it may be imaged. Reflectivity isset by the impedance contrast between the objectand the surrounding media, in this case soil.Reflection coefficients, the ratio of reflected toincident wave amplitude, may be large for cer-tain objects; for instance, a buried cavity would beessentially perfectly reflective for seismic waves.Impedance variations associated with soil com-position or water content also may reflect radaror seismic energy. For example, the reflections atthe boundary between two soil layers of slightlydifferent composition may be of the order of afew per cent. Combining efficient propagationthrough the soil with a highly reflective objectwill produce a reflection from a buried objector soil layer that has a detectable return at theground surface. Total losses between transmittedand reflected signals of 50 dB or more are typ-ical for the signals seen by a reflection imagingsystem.
A shallow seismic reflection imaging system
The primary problem for adapting SRI to shal-low depths within soils is twofold: (i) the needto produce high frequency seismic energy, and(ii) the need to effectively couple the seismic
source and receivers to the soil. In the typi-cal settings for SRI—oil exploration, oceanog-raphy and medical imaging—sensors are eas-ily coupled to the media, and the mediaallows for efficient propagation. Shallow soilpresents greater difficulties for coupling, andit is a complex media for seismic propaga-tion.
We designed an SRI system suitable for imag-ing at shallow depths in soils. The system useda series of closely spaced geophones, deployedin a line along the surface of the ground, andnear these geophones, a series of seismic sourcesor shots. A digital seismograph allowed largedynamic range signal recordings. To enhance thegeophone-to-ground coupling, we watered eachgeophone, just prior to each shot. With successiveshots the geophone array was translated along theline to maintain a constant geometry between theshot and the receiver positions. To enhance seis-mic source coupling to the ground, we inserteda short pipe into the ground at each shot point.Two different energy sources were directed at thepipe: an impulsive source was created by strikingthe pipe with a 0.5 kg hammer, and a controlledvibrator source was created by attachment of acommercial shake table to the pipe. The signalgenerated by each method was repeated multipletimes at each shot point and stacked within theseismograph.
There may be several advantages to usinga controlled vibrator source for high-resolutionshallow seismic imaging. The controlled vibra-tor source allowed a variety of waveforms tobe generated; in particular, we used swept fre-quency waveforms, which increased logarith-mically in frequency with increasing time. Thevibrator source allowed efficient generation ofhigh-frequency seismic energy. The frequencycontent of typical impulsive seismic sources,such as weight drops and sledgehammer orshotgun sources, may be limited in the highfrequencies needed for high-resolution shallowimaging. Further, there may be problems in gain-ing permission to use such sources in urbanareas, or sensitive site areas. Unlike impulsivesources, the frequency content and the sourcestrength can be defined independently for thevibrator source. The vibrator signal also canbe adapted to specific site conditions, such as
Copyright 2002 John Wiley & Sons, Ltd. Archaeol. Prospect. 9, 9–21 (2002)
12 J. A. Hildebrand et al.
the quality of source coupling. For a givensource strength, because the energy density fora vibrator source is less than for an impulsivesource, vibrator sources are non-destructive, donot produce non-linear excitation of the soil, andare less likely to overdrive the seismic receiv-ing system. The signal detection for a vibra-tor source can be done as a cross-correlationbetween transmitted and received signal. Thisallows for significant signal strength gain (prod-uct of the signal time and bandwidth), whichprovides better protection against ambient sitenoise.
The key system elements of the controlledvibrator source are a signal generator—set totransmit a frequency swept signal—a poweramplifier and the portable vibrator. The entiresystem is powered using conventional 12 Vcar batteries and a dc-to-ac power inverter.The portable vibrator generates force usingan electromagnet system; there is a magneticarmature within a system of coils. When currentis passed through the coils the armature cangenerate up to 23 kg of peak force with amaximum stroke of 1.3 cm peak-to-peak. Thevibrator weighs 39 kg and has dimensions of25 ð 25 ð 30 cm, allowing it to be field portable.The vibrator is capable of generating any kindof frequency swept signal (linear, log, etc.) in thefrequency range 2 to 10 000 Hz. To couple thevibrator to the ground we first drive a 1 inchpipe into the soil, and then screw the vibrator onto the pipe by a tapered coupling. An externalsuspension, consisting of a beryllium–coppercross-spring keeps the armature in the centre ofits driving range when the vibrator is attachedto the pipe. In practice the usable frequencyrange is 20 to 3000 Hz, limited on the lowend by the mass of the vibrator (motion ofthe vibrator dominates) and at the high endby attenuation and resonance of the springand support structure. A signal generator isprogrammed for the appropriate frequency bandand type of sweep (e.g. log). The signal generatordrives a power amplifier with a 250 W output,which then drives the vibrator. To monitorvibrator motion an accelerometer was mountedon the pipe, just below its coupling with thevibrator, and the accelerometer output wasrecorded as a channel on the digital seismograph.
The controlled archaeological testsite
As a venue for testing these approaches forshallow seismic imaging we chose the ControlledArchaeological Test Site (CATS), a simulatedarchaeological site in Champaign, Illinois (Isaac-son et al., 1999). The CATS facility replicatesfeatures present in some North American archae-ological sites under a controlled environment.This site is located on a level plot of silty clay andsilt-loam soils, in a former agricultural field. Thesoil profile has an A horizon measuring about36 cm in thickness, and a B horizon of about84 cm thickness. Preliminary surveys and siterecords indicate no previous prehistoric or his-toric disturbance, other than farming. Featuresconstructed at the CATS facility include: mon-umental and domestic architecture; pig and dogburials in mounds, under house floors, and in iso-lated pits; and hearths, roasting pits and artefactclusters.
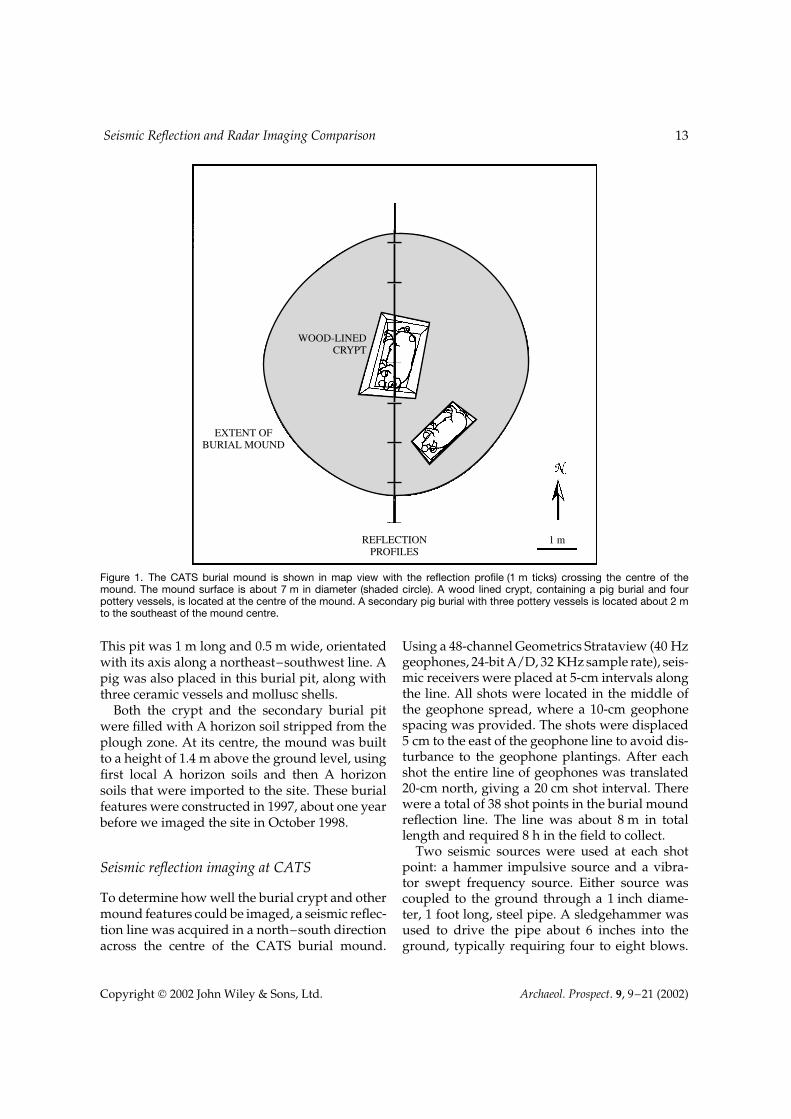
We chose to image a circular mound featurein the central portion of the CATS site thatsimulates mortuary features found in Midwestarchaeological sites (Figure 1). Previous studieshave demonstrated that reflection imaging is anefficient means for investigating burial mounds(Goodman and Nishimura, 1993). The CATSburial mound surface is about 7 m in diameterand 1.4 m in height. To construct the mound,the soil within the plough zone was strippedto a depth of 0.2 m over a circular area 7 m indiameter. In the middle of the stripped area,a pit was excavated, extending to a depth of0.7 m beneath the plough zone level. The pitdimensions were rectangular, measuring 1.8 min the north–south direction and 1.2 m in theeast–west direction. To form a burial crypt, thesides of the pit were lined with wooden logs andan extended pig was placed in it, along with fourceramic vessels and freshwater mollusc shells. Pigburials are a good simulation for human burials(France et al., 1992). The wooden logs lining thesides of the burial crypt were sycamore tree limbs,measuring up to 10 cm in diameter and piled upto 25 cm above the plough zone base level.
A secondary burial pit was excavated about 2 mto the southeast of the mound centre, extendingto a depth of 0.16 m beneath the plough zone.
Copyright 2002 John Wiley & Sons, Ltd. Archaeol. Prospect. 9, 9–21 (2002)
Seismic Reflection and Radar Imaging Comparison 13
EXTENT OFBURIAL MOUND
REFLECTIONPROFILES
1 m
WOOD-LINEDCRYPT
Figure 1. The CATS burial mound is shown in map view with the reflection profile (1 m ticks) crossing the centre of themound. The mound surface is about 7 m in diameter (shaded circle). A wood lined crypt, containing a pig burial and fourpottery vessels, is located at the centre of the mound. A secondary pig burial with three pottery vessels is located about 2 mto the southeast of the mound centre.
This pit was 1 m long and 0.5 m wide, orientatedwith its axis along a northeast–southwest line. Apig was also placed in this burial pit, along withthree ceramic vessels and mollusc shells.
Both the crypt and the secondary burial pitwere filled with A horizon soil stripped from theplough zone. At its centre, the mound was builtto a height of 1.4 m above the ground level, usingfirst local A horizon soils and then A horizonsoils that were imported to the site. These burialfeatures were constructed in 1997, about one yearbefore we imaged the site in October 1998.
Seismic reflection imaging at CATS
To determine how well the burial crypt and othermound features could be imaged, a seismic reflec-tion line was acquired in a north–south directionacross the centre of the CATS burial mound.
Using a 48-channel Geometrics Strataview (40 Hzgeophones, 24-bit A/D, 32 KHz sample rate), seis-mic receivers were placed at 5-cm intervals alongthe line. All shots were located in the middle ofthe geophone spread, where a 10-cm geophonespacing was provided. The shots were displaced5 cm to the east of the geophone line to avoid dis-turbance to the geophone plantings. After eachshot the entire line of geophones was translated20-cm north, giving a 20 cm shot interval. Therewere a total of 38 shot points in the burial moundreflection line. The line was about 8 m in totallength and required 8 h in the field to collect.
Two seismic sources were used at each shotpoint: a hammer impulsive source and a vibra-tor swept frequency source. Either source wascoupled to the ground through a 1 inch diame-ter, 1 foot long, steel pipe. A sledgehammer wasused to drive the pipe about 6 inches into theground, typically requiring four to eight blows.
Copyright 2002 John Wiley & Sons, Ltd. Archaeol. Prospect. 9, 9–21 (2002)
14 J. A. Hildebrand et al.
A 0.5 kg hammer was then struck on the topof the pipe for 15 blows, and these data werestacked by the Strataview and saved as a 0.250 srecord. The vibrator source was then screwed onto the top of the pipe and a logarithmically fre-quency swept signal (1–1000 Hz) of 1 s durationwas transmitted for 15 repetitions, stacked bythe Strataview and recorded as a 1.250 s record.By using a vibrator signal with a frequency thatincreased logarithmically with time, an extremelybroadband energy spectrum was produced, with-out placing excessive emphasis on the highestfrequencies. Within this frequency sweep, timeis divided equally between frequency bands at1–10 Hz, 10–100 Hz and 100–1000 Hz. In prac-tice, the vibrating source is inefficient at the lowestfrequencies (1–10 Hz), but including these fre-quencies allows a smooth beginning to the signal.
The data were checked for their quality duringand after the field acquisition. Data were pro-cessed on a computer workstation using the SIO-SEIS software package (http://sioseis.ucsd.edu).Field records were converted into a single SEG-Y file for each source type. Shot gathers wereexamined for data quality, for example, badcable connections between the geophone and therecording unit, and for the presence of reflectionevents. Vibrator data were cross-correlated usingthe closest geophone to the shot point (about 7 cmseparation) as the reference trace.
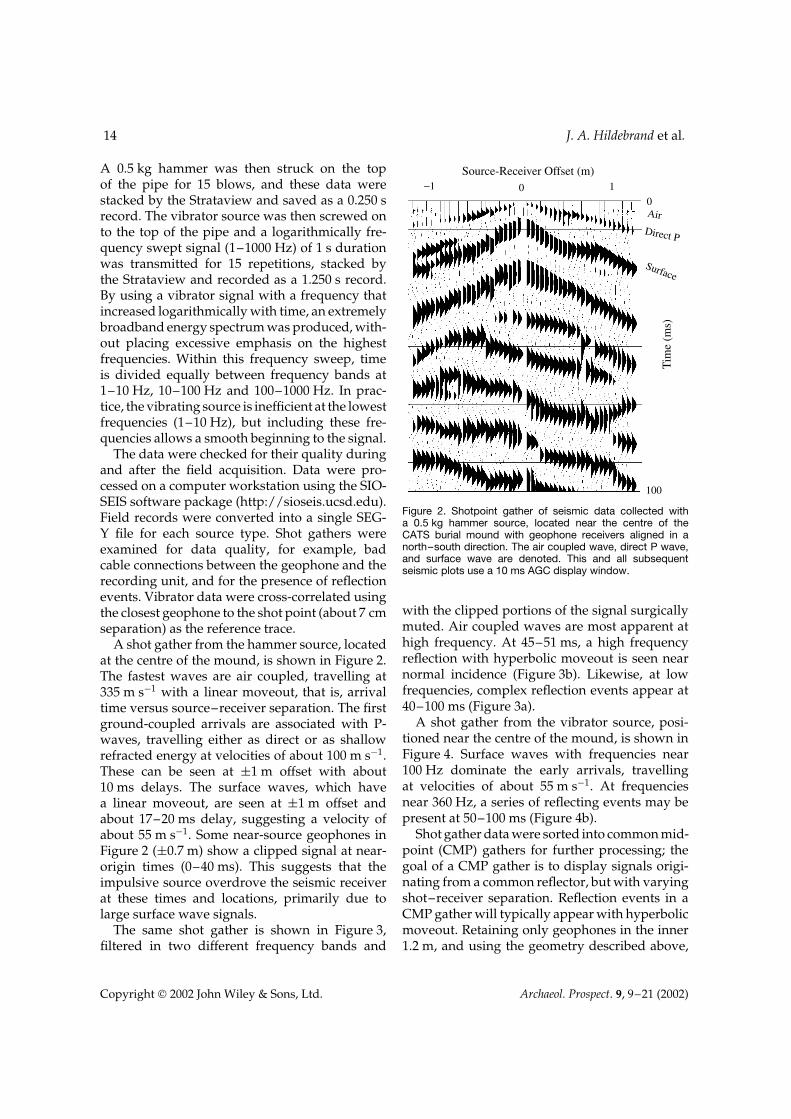
A shot gather from the hammer source, locatedat the centre of the mound, is shown in Figure 2.The fastest waves are air coupled, travelling at335 m s�1 with a linear moveout, that is, arrivaltime versus source–receiver separation. The firstground-coupled arrivals are associated with P-waves, travelling either as direct or as shallowrefracted energy at velocities of about 100 m s�1.These can be seen at š1 m offset with about10 ms delays. The surface waves, which havea linear moveout, are seen at š1 m offset andabout 17–20 ms delay, suggesting a velocity ofabout 55 m s�1. Some near-source geophones inFigure 2 (š0.7 m) show a clipped signal at near-origin times (0–40 ms). This suggests that theimpulsive source overdrove the seismic receiverat these times and locations, primarily due tolarge surface wave signals.
The same shot gather is shown in Figure 3,filtered in two different frequency bands and
Source-Receiver Offset (m)−1 0 1
0
100
Tim
e (m
s)
Air
Direct P
Surface
Figure 2. Shotpoint gather of seismic data collected witha 0.5 kg hammer source, located near the centre of theCATS burial mound with geophone receivers aligned in anorth–south direction. The air coupled wave, direct P wave,and surface wave are denoted. This and all subsequentseismic plots use a 10 ms AGC display window.
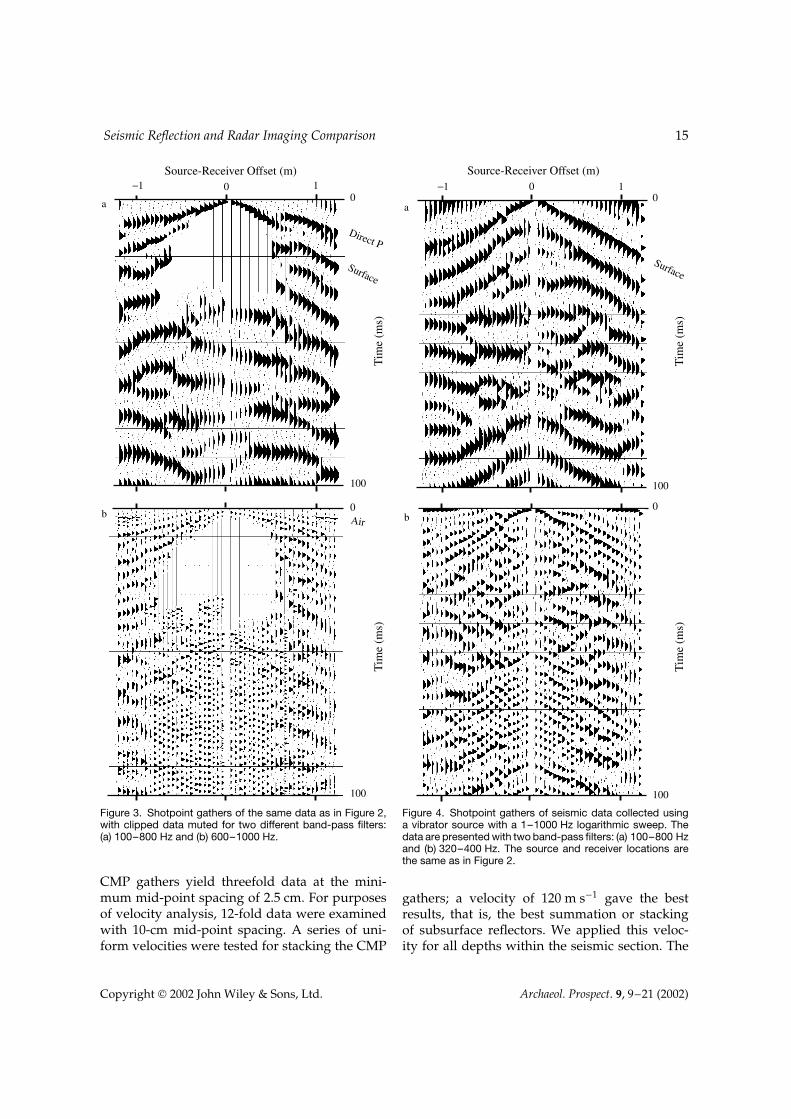
with the clipped portions of the signal surgicallymuted. Air coupled waves are most apparent athigh frequency. At 45–51 ms, a high frequencyreflection with hyperbolic moveout is seen nearnormal incidence (Figure 3b). Likewise, at lowfrequencies, complex reflection events appear at40–100 ms (Figure 3a).
A shot gather from the vibrator source, posi-tioned near the centre of the mound, is shown inFigure 4. Surface waves with frequencies near100 Hz dominate the early arrivals, travellingat velocities of about 55 m s�1. At frequenciesnear 360 Hz, a series of reflecting events may bepresent at 50–100 ms (Figure 4b).
Shot gather data were sorted into common mid-point (CMP) gathers for further processing; thegoal of a CMP gather is to display signals origi-nating from a common reflector, but with varyingshot–receiver separation. Reflection events in aCMP gather will typically appear with hyperbolicmoveout. Retaining only geophones in the inner1.2 m, and using the geometry described above,
Copyright 2002 John Wiley & Sons, Ltd. Archaeol. Prospect. 9, 9–21 (2002)
Seismic Reflection and Radar Imaging Comparison 15
Source-Receiver Offset (m)−1 0 1
Tim
e (m
s)
0
100
Direct P
Surface
a
Tim
e (m
s)
Air0
100
b
Figure 3. Shotpoint gathers of the same data as in Figure 2,with clipped data muted for two different band-pass filters:(a) 100–800 Hz and (b) 600–1000 Hz.
CMP gathers yield threefold data at the mini-mum mid-point spacing of 2.5 cm. For purposesof velocity analysis, 12-fold data were examinedwith 10-cm mid-point spacing. A series of uni-form velocities were tested for stacking the CMP
Source-Receiver Offset (m)−1 0 1
Tim
e (m
s)
0
100
Surface
a
Tim
e (m
s)
0
100
b
Figure 4. Shotpoint gathers of seismic data collected usinga vibrator source with a 1–1000 Hz logarithmic sweep. Thedata are presented with two band-pass filters: (a) 100–800 Hzand (b) 320–400 Hz. The source and receiver locations arethe same as in Figure 2.
gathers; a velocity of 120 m s�1 gave the bestresults, that is, the best summation or stackingof subsurface reflectors. We applied this veloc-ity for all depths within the seismic section. The
Copyright 2002 John Wiley & Sons, Ltd. Archaeol. Prospect. 9, 9–21 (2002)
16 J. A. Hildebrand et al.
mound topography was applied as a static shiftto the seismic data and a 10-ms automatic gaincontrol (AGC) window was used for display.Geophone channels were muted where their datawere noisy or clipped from the large amplitudeof the impulsive source.
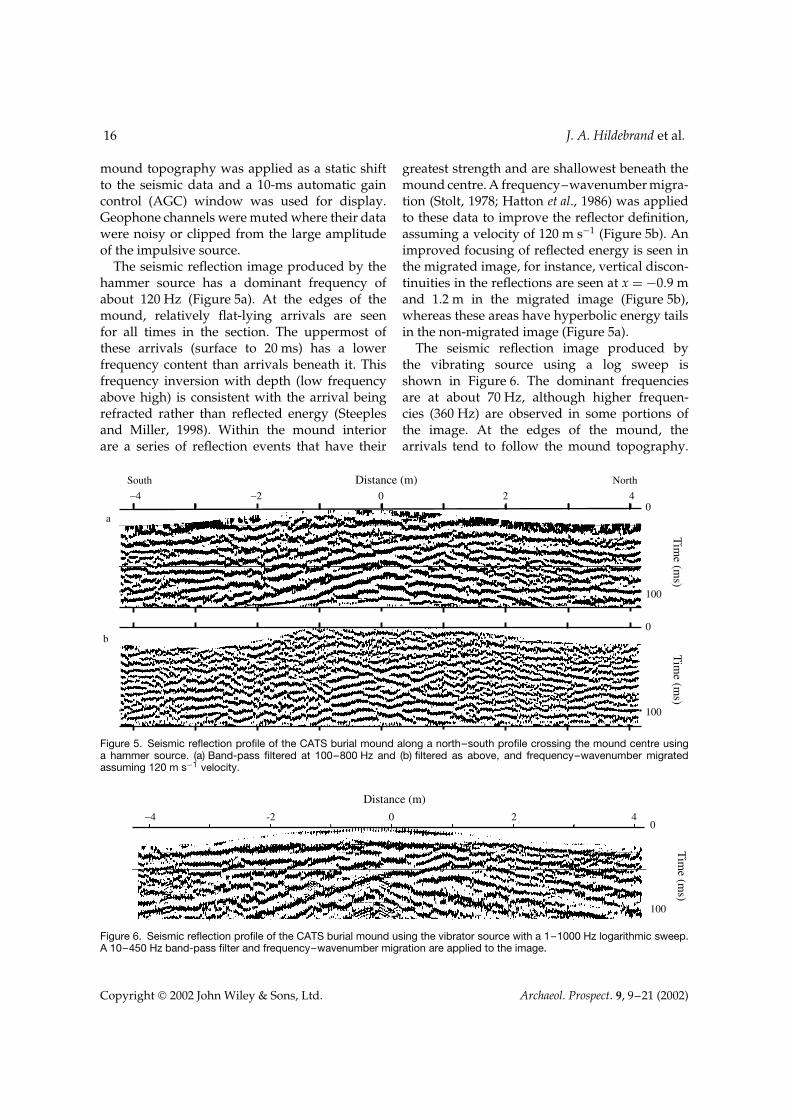
The seismic reflection image produced by thehammer source has a dominant frequency ofabout 120 Hz (Figure 5a). At the edges of themound, relatively flat-lying arrivals are seenfor all times in the section. The uppermost ofthese arrivals (surface to 20 ms) has a lowerfrequency content than arrivals beneath it. Thisfrequency inversion with depth (low frequencyabove high) is consistent with the arrival beingrefracted rather than reflected energy (Steeplesand Miller, 1998). Within the mound interiorare a series of reflection events that have their
greatest strength and are shallowest beneath themound centre. A frequency–wavenumber migra-tion (Stolt, 1978; Hatton et al., 1986) was appliedto these data to improve the reflector definition,assuming a velocity of 120 m s�1 (Figure 5b). Animproved focusing of reflected energy is seen inthe migrated image, for instance, vertical discon-tinuities in the reflections are seen at x D �0.9 mand 1.2 m in the migrated image (Figure 5b),whereas these areas have hyperbolic energy tailsin the non-migrated image (Figure 5a).
The seismic reflection image produced bythe vibrating source using a log sweep isshown in Figure 6. The dominant frequenciesare at about 70 Hz, although higher frequen-cies (360 Hz) are observed in some portions ofthe image. At the edges of the mound, thearrivals tend to follow the mound topography.
Distance (m)0 42−2−4
0
100
0
100
Tim
e (ms)
Tim
e (ms)
NorthSouth
a
b
Figure 5. Seismic reflection profile of the CATS burial mound along a north–south profile crossing the mound centre usinga hammer source. (a) Band-pass filtered at 100–800 Hz and (b) filtered as above, and frequency–wavenumber migratedassuming 120 m s�1 velocity.
Distance (m)
0-2−4 2 40
100
Tim
e (ms)
Figure 6. Seismic reflection profile of the CATS burial mound using the vibrator source with a 1–1000 Hz logarithmic sweep.A 10–450 Hz band-pass filter and frequency–wavenumber migration are applied to the image.
Copyright 2002 John Wiley & Sons, Ltd. Archaeol. Prospect. 9, 9–21 (2002)

Seismic Reflection and Radar Imaging Comparison 17
In the mound interior, the arrivals have a moretriangular shape, dipping more steeply thanthe mound topography, with an apex beneaththe mound summit. The dominance of low-frequency energy, and arrivals with significantlateral energy tails, despite having applied migra-tion, suggests that surface waves may be a dom-inant mode of propagation for the log sweepvibrating source.
Ground-penetrating radar imaging at CATS
A Subsurface Interface Radar (SIR) System-10manufactured by Geophysical Survey SystemsInc. (GSSI) was used to image the CATS site.The radar antennae have centre frequencies at500 MHz (GSSI Model 3102A), with a pulse widthof 2 ns. Both the transmitting and the receivingantennae are mounted in a single plastic case withdimensions 18 ð 39 ð 42 cm and weight 7 kg. Acable connects the SIR-10 to the antenna. To set theradar gain, the antennae were positioned abovea prominent deep reflector, and the instrumentwas allowed to determine an automatic gaincurve, using eight gain points over a 30-ns
time window. Once determined, the gain curvewas held fixed, and used throughout the entiresurvey.
The GPR data were collected on a 0.5 m linespacing over the entire CATS site. The SIR-10 unitwas positioned at a fixed station as the antennawas pulled directly on the ground surface along50 m traverses of the site in a north–southdirection. Data were collected at walking speed,with fiducial position marks recorded every 1 malong track. Fibreglass measuring tapes wereused to mark the tracks; the antenna was pulledadjacent to the tape, with no interference to theradar records. The recording time was 30 ns, andthe number of samples per trace was 512. Radarpulses were transmitted at 62 scans s�1, and fourpulses were stacked for each trace recorded. Theresulting record has a trace about every 4 cmalong each transect.
In this study, we will focus on the GPRdata collected along a single north–south tran-sect crossing the centre of the CATS burialmound. (Three-dimensional processing of theentire CATS GPR data set will be the subjectof subsequent research.) To the north–south GPR
Distance (m)South North
0-2−4 2 40
20
a
b
c
Tim
e (n
s)
0
20 Tim
e (n
s)
0
20
Tim
e (n
s)
Figure 7. Ground-penetrating radar profile of the CATS burial mound along a north–south line crossing the mound centre(same location as Figure 5 and 6). Data are displayed using a 4 ns AGC window: (a) unfiltered, (b) band-pass filtered for500–1000 MHz and (c) filtered as above, and migrated assuming a 170 mm ns�1 velocity.
Copyright 2002 John Wiley & Sons, Ltd. Archaeol. Prospect. 9, 9–21 (2002)
18 J. A. Hildebrand et al.
profile, we applied the mound topography as astatic time shift, assuming a 170 mm ns�1 radarpropagation velocity. Figure 7 shows the GPRprofile of the burial mound as unfiltered data (a),and as filtered with a band-pass of 500–1000 MHz(b). The unfiltered image (Figure 7a) has a dom-inant frequency near 200 MHz, at the low fre-quency end of the 500 MHz centre frequencyantennae. The filtered image (Figure 7b) has bet-ter definition of features within the burial mound.These images have arrivals that predominantlyfollow the mound topography throughout the30 ns data record, suggestive of a ‘ringy’ sourcesignature. However, the arrivals are disturbedduring the time window of 10–20 ns, particu-larly beneath the mound summit, southern flank,and along its northern edge. Some of these dis-turbed arrivals appear to be distinct reflectorswith hyperbolic shape, for instance, at 0.5 mrange and 12 ns time in Figure 7b. Figure 7cshows the filtered GPR data after applying afrequency–wavenumber migration (Stolt, 1978;Hatton et al., 1986) to improve the reflector def-inition, using a velocity of 170 mm ns�1. Thehyperbolic reflectors seen in Figure 7b are trans-formed by migration to be more localized, andin some portions of the image distinct lateral
breaks in the reflecting horizons appear, such asat a range of 1.4 m in Figure 7c. The advantagesof migrating even single-channel GPR data havebeen discussed previously by Fisher et al. (1992).
Discussion
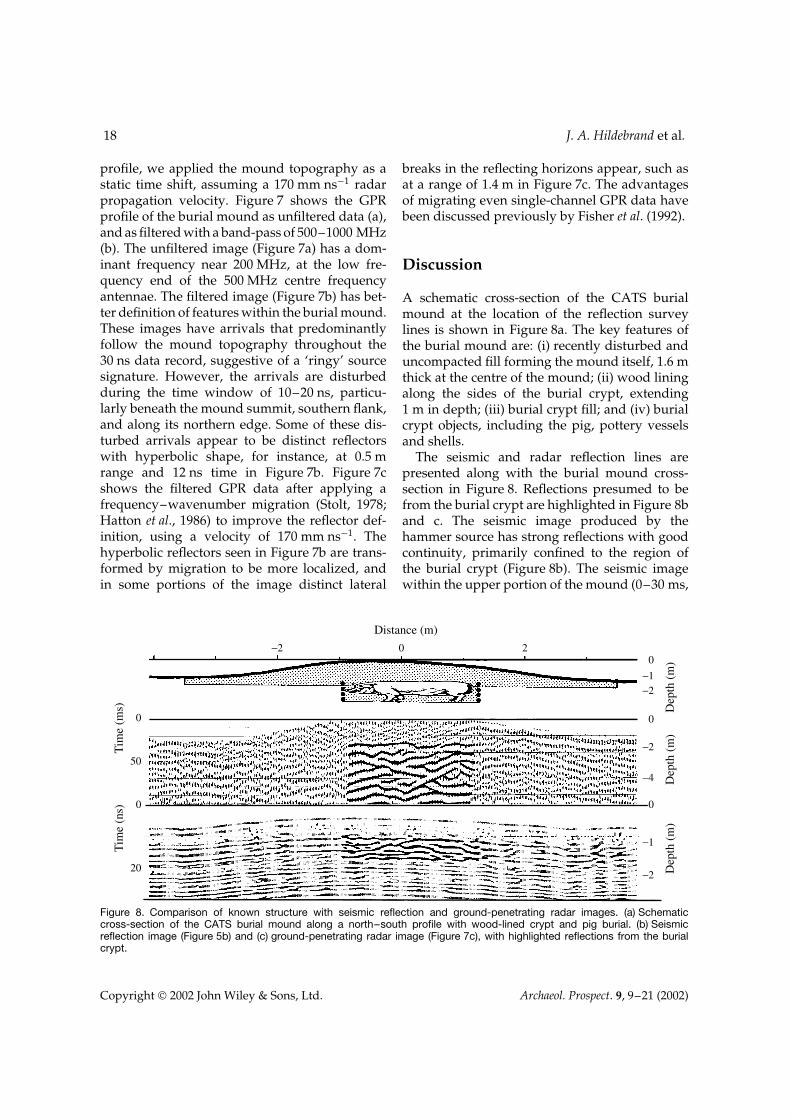
A schematic cross-section of the CATS burialmound at the location of the reflection surveylines is shown in Figure 8a. The key features ofthe burial mound are: (i) recently disturbed anduncompacted fill forming the mound itself, 1.6 mthick at the centre of the mound; (ii) wood liningalong the sides of the burial crypt, extending1 m in depth; (iii) burial crypt fill; and (iv) burialcrypt objects, including the pig, pottery vesselsand shells.
The seismic and radar reflection lines arepresented along with the burial mound cross-section in Figure 8. Reflections presumed to befrom the burial crypt are highlighted in Figure 8band c. The seismic image produced by thehammer source has strong reflections with goodcontinuity, primarily confined to the region ofthe burial crypt (Figure 8b). The seismic imagewithin the upper portion of the mound (0–30 ms,
Distance (m)
0−2 20
−1−2
Dep
th (
m)
0
−2
−4
0
0
50
20−2
−1
Dep
th (
m)
Dep
th (
m)
Tim
e (n
s)T
ime
(ms)
0
Figure 8. Comparison of known structure with seismic reflection and ground-penetrating radar images. (a) Schematiccross-section of the CATS burial mound along a north–south profile with wood-lined crypt and pig burial. (b) Seismicreflection image (Figure 5b) and (c) ground-penetrating radar image (Figure 7c), with highlighted reflections from the burialcrypt.
Copyright 2002 John Wiley & Sons, Ltd. Archaeol. Prospect. 9, 9–21 (2002)

Seismic Reflection and Radar Imaging Comparison 19
0–1.8 m) is suggestive of the poorly consolidatedand disturbed zone that makes up the mound fill.A series of reflection events in the mound interiorcorresponds to the location and approximatedepth of the central burial crypt. The upperportions of these crypt reflections (30–50 ms,1.8–3.0 m) are upwardly concave with theircentres of concavity in the middle of the crypt.Below the series of concave reflections, strongreflections continue, but they are complex withboth flat-lying and dipping events superimposed.It is likely that these events are a result of multiplereflections within the crypt, generated from boththe sides and the floor. These complex reflectionscontinue to the full extent of the seismic data(120 ms, 7.2 m), well beyond the bottom of thecrypt. A clearly defined lateral break in all thesereflections occurs at both sides of the crypt (rangesof �0.9 m and C1.1 m in Figure 8b). Within themound outside of the crypt region, reflectionevents are seen, either flat-lying, or dipping awayfrom the edges of the crypt, but they have lesseramplitude and continuity than reflections fromwithin the crypt region (Figures 8b and 5b).
The GPR image (Figure 8c) has a similar char-acter to the seismic reflection image (Figure 8b).In the upper portion of the GPR image (0–10ns, 0–0.85 m) the data are lineated at the southend of the mound, but reflections are indistinct inthe central and northern portions of the mound.This may be due to the disturbed nature of themound fill, however, comparison of the non-migrated and migrated radar data (Figures 7band c) suggests some ‘over-migration’ artefacts inthe uppermost portion of the image. Beneath theupper zone are a series of reflection events in themound interior spanning 10–20 ns (0.85–1.7 m).These events correspond well to the lateral loca-tion of the central crypt, but they are too shal-low by 0.75 m or more. This apparent deptherror suggests that our nominal radar velocityof 170 mm ns�1 may be too slow in the upperportions of the mound. However, the velocityrequired for a correct depth to the top of the cryptis extremely fast (260 mm ns�1), approaching themaximum allowed speed of light in vacuum(300 mm ns�1). In contrast the GPR crypt reflec-tions occupy only the time interval 10–20 ns,correctly giving a depth extent of about 0.85 m.
This suggest that 170 mm ns�1 is a correct veloc-ity within the lower compacted portions of themound, consistent with the velocity derived fromthe migration analysis. A steep velocity decreasewith depth, owing to compaction and water sat-uration, may explain these data. As observed forthe seismic crypt reflections beneath the flat orconcave upper radar reflections, there are dippingreflectors suggestive of multiple events betweenthe crypt sides and bottom. Lateral reflectorbreaks occur at both sides of the crypt. Outsideof the central crypt region there are suggestionsof reflection events at �2 m range; this could bean off-line return from the secondary pig burial(Figure 1). Reflection events are also seen at thenorthern edge (3 m range) of the mound from anunexplained origin.
The seismic reflection image produced by thevibrating source (Figure 6) is predominantly com-posed of low-frequency flat-topped triangulararrivals, located beneath the mound summit.These reflections seem to originate from thesides of the burial crypt, perhaps due to surfacewaves. At higher frequency (360 Hz), however,a well-confined hyperbolic reflection begins atabout 45 ms (2.7 m), with its apex located 30 cmsouth of the mound summit (Figure 6). This is theapproximate location and depth of the pig’s chest(Figure 8a). A gas-filled cavity or void within thepig could create a strong energy scatterer, whichmay be the origin of the 360 Hz reflector. A spheri-cal cavity would resonate when one-quarter of theseismic wavelength matched the cavity radius.For 360 Hz waves travelling in air (335 m s�1),the cavity radius would be 23 cm, a plausible sizefor the residual chest cavity of the pig. A similarhyperbolic reflection is seen 1.3 m south of themound summit at about 65 ms (Figure 6), per-haps corresponding to the secondary pig burial(Figure 1).
Conclusions
The SRI and GPR images from the CATS burialmound show both similarities and differencesin their ability to image subsurface structure.The two imaging techniques applied at this sitehave energy wavelengths that are comparable towithin about a factor of three (GPR at 500 MHz
Copyright 2002 John Wiley & Sons, Ltd. Archaeol. Prospect. 9, 9–21 (2002)

20 J. A. Hildebrand et al.
and 170 mm ns�1 is 0.34 m wavelength, and SRIat 120 Hz and 120 m s�1 is 1 m wavelength). Thecentral burial crypt is imaged by both techniquesas a flat-lying or concave reflector at the top ofthe crypt, and as dipping reflectors for greatertimes, probably related to multiple reflectionsfrom the crypt sides and floor. The seismicimage provides a good match for the knowndepth to the top of the crypt; the radar imagerequires an extremely fast near-surface velocity(260 mm ns�1), perhaps the result of high porosityin the upper unconsolidated mound fill, withdecreasing velocity below. The depth extent ofthe crypt is best represented by the radar image,which has a series of clear reflectors coveringthe correct depth range; in the seismic image,reflected energy continues far below the expecteddepth of the crypt, suggesting multiple reflectionswithin the crypt structure. Complex reflectionsfrom the crypt may explain the lack of identifiablereflections from the pig and associated funerarygoods.
Reflection imaging techniques have greatpotential to benefit archaeological field researchby allowing, non-destructive prospection, withdetailed information on depth as well as lateralextent of buried objects and structures. Applica-tion of both seismic and radar imaging to thesame site has revealed both similarities and dif-ferences in their imaging abilities. The applicationof these techniques to a site with known features,such as the Controlled Archaeological Test Site,allows ground truth of reflection imaging systemperformance. The application of multiple reflec-tion methods may allow better understanding ofburied archaeological features by providing anindependent means for verifying depth, basedon the site velocity structure, and by providingmultiple images based on common proceduresfor data filtering, migration and display.
Acknowledgements
We thank Jon Isaacson, Michael Hargrave, JamesZeidler, Eric Hollinger and other members of theUnited States Army Construction EngineeringResearch Laboratory staff for providing accessto the CATS site. Allan Sauter provided fieldassistance with the seismic data collection, andJeff Lucius provided assistance with the radar
data collection. This project was funded by theNational Centre for Preservation Technology andTraining Grant MT 2210-7-NC-018 under theproject management of Mark Gilberg.
References
Baker GS, Schmeissner C, Steeples DW, Plumb RG.1999. Seismic reflections from depths of lessthan two metres. Geophysical Research Letters 26:279–282.
Conyers LB, Goodman D. 1997. Ground-PenetratingRadar: an Introduction for Archaeologists. AltaMiraPress: Walnut Creek, CA.
Claerbout JF. 1985. Imaging the Earth’s Interior.Blackwell Scientific Publications: Oxford.
Fisher E, McMechan GA, Annan AP, Cosway SW.1992. Examples of reverse-time migration ofsingle-channel, ground-penetrating radar profiles.Geophysics 57: 577–586.
France DL, Griffen TJ, Swanburg JG, Lindemann JW,Davenport GC, Trammell V, Armbrust CT, Kon-dratieff B, Nelson A, Costellano K, Hopkins D. 1992.A multidisciplinary approach to the detection ofclandestine graves. Journal of Forensic Science 37:1445–1458.
Frazier CH, Cadalli N, Munson DC , O’Brien WD .2000. Acoustic imaging of objects in soil. Journalof the Acoustic Society of America 108: 147–156.
Goodman D, Nishimura Y. 1993 A ground-radarview of Japanese burial mounds. Antiquity 67:349–354.
Goodman D, Nishimura Y, Rogers JD. 1995. GPR timeslices in archaeological prospection. ArchaeologicalProspection 2: 85–89.
Isaacson J, Hollinger RE, Gundrum D, Baird J. 1999.A Controlled Archaeological Test Site Facility inIllinois: training and research in archeogeophysics.Journal of Field Archaeology 26: 227–236.
Hatton L, Worthington MH, Makin J. 1986. SeismicData Processing Theory and Practice. BlackwellScientific Publications: Oxford.
Olhoeft GR. 1986. Electrical Properties from 10�3
to 109 Hz—physics and chemistry. In Pro-ceedings of the Second International Sympo-sium on the Physics and Chemistry of PorousMedia, Bananvar JR, Koplik J, Winkler KW (eds).Held at Schlumberger–Doll Research in Ridge-field, Connecticut on 15–17 October 1986.American Institute of Physics: New York;281–298.
Steeples DW. 1998. Shallow seismic reflectionsection—introduction. Geophysics 63: 1210–1212.
Steeples DW, Miller RD. 1990. Seismic reflectionmethods applied to engineering, environmental,and groundwater problems. In Geotechnical andEnvironmental Geophysics, Vol. I, Ward SH (ed.).Society for Exploration Geophysics: Tulsa; 1–30.
Copyright 2002 John Wiley & Sons, Ltd. Archaeol. Prospect. 9, 9–21 (2002)

Seismic Reflection and Radar Imaging Comparison 21
Steeples DW, Miller RD. 1998. Avoiding pitfalls inshallow seismic reflection surveys. Geophysics 63:1213–1224.
Stoll RD. 1989. Sediment Acoustics. Lecture Notesin Earth Sciences, Bhattacharji S, Friedman GM,Neugebauer HJ, Seilacher A (eds). Springer-Verlag:Berlin.
Stolt RH. 1978. Migration by Fourier transform.Geophysics 43: 23–48.
Topp GC, Davis JL, Annan AP. 1980. Electromagneticdetermination of soil water content: measurementsin coaxial transmission lines. Water Resources Research16: 574–582.
Copyright 2002 John Wiley & Sons, Ltd. Archaeol. Prospect. 9, 9–21 (2002)