Comparison of INSTI vs PI FLAMINGO GS-236-0103 ACTG A5257 WAVES.
13
Comparison of INSTI vs PI FLAMINGO GS-236-0103 ACTG A5257 WAVES
-
Upload
jasmin-short -
Category
Documents
-
view
219 -
download
0
Transcript of Comparison of INSTI vs PI FLAMINGO GS-236-0103 ACTG A5257 WAVES.

Comparison of INSTI vs PI
FLAMINGO GS-236-0103 ACTG A5257 WAVES

DeJesus E. Lancet 2012;379:2429-38
Design
Objective– Non inferiority of EVG/c/FTC/TDF at W48: % HIV RNA < 50 c/mL by intention
to treat, snapshot analysis (lower margin of the 2-sided 95% CI for the difference = -12%, 95% power)
EVG/c/FTC/TDF 150/150/200/300 mg QDATV/r + TDF/FTC placebo
ATV/r 300/100 mg + TDF/FTC QD
EVG/c/FTC/TDF placebo
Randomisation*1 : 1
Double-blind
Randomisation*1 : 1
Double-blind
> 18 yearsARV-naïve
HIV RNA > 5,000 c/mLAny CD4 cell counteGFR> 70 mL/min
> 18 yearsARV-naïve
HIV RNA > 5,000 c/mLAny CD4 cell counteGFR> 70 mL/min
*Randomisation was stratified by HIV RNA (< or > 100,000 c/mL) at screening
Study GS-236-0103: EVG/c/FTC/TDF QD vs ATV/r + FTC/TDF QD
N = 355
N = 353
W48W48 W192W192
GS-236-0103

EVG/c/FTC/TDFN = 353
ATV/r + FTC/TDFN = 355
Mean age, years 38 39
Female 8% 11%
HIV RNA (log10c/mL), mean 4.8±0.61 4.8±0.62
HIV RNA > 100,000 c/mL 42% 40%
CD4 cell count (/mm3), median 351 366
CD4 < 200 per mm3 15% 11%
Hepatitis B / hepatitis C coinfection 1% / 5% 2% / 3%
Discontinuation by W48 9.3% 11.3%
For lack of efficacy N = 4 N = 1
For adverse event N = 13 N = 18
Lost to follow-up N = 7 N = 7
Non-compliance N = 5 N = 5
Discontinuation by W96 14% 15%
Baseline characteristics and patient disposition
DeJesus E. Lancet 2012;379:2429-38 ; Rockstroh JK, JAIDS 2013;62:483-6GS-236-0103
Study GS-236-0103: EVG/c/FTC/TDF QD vs ATV/r + FTC/TDF QD

Response to treatment at week 48
DeJesus E. Lancet 2012;379:2429-38
GS-236-0103
Mean CD4/mm3 increase at W48 :+ 207 (EVG/c/FTC/TDF) vs+ 211 (ATV/r + FTC/TDF)
Viral suppression was high in both treatment arms, for varioussubgroups including patientswith HIV RNA > 100 000 c/mLat baseline
25
50
100
75
89.5 86.8
Adjusted difference(95% CI)=
3.0 % (- 1.9; 7.8)
97.5 97.7
Adjusted difference(95% CI)=
= -0.1 % (- 2.6; 2.4)
ITT, snapshot Per protocol
EVG/c/FTC/TDFATV/r + FTC/TDF
HIV RNA < 50 c/mLPrimaryanalysis
%
0
Study GS-236-0103: EVG/c/FTC/TDF QD vs ATV/r + FTC/TDF QD

DeJesus E. Lancet 2012;379:2429-38 GS-236-0103
ARN VIH < 50 c/ml
Study GS-236-0103: EVG/c/FTC/TDF QD vs ATV/r + FTC/TDF QD
20
60
80
Weeks
0
40
100
0 2 4 8 12 16 24 32 40 4828 36 4020
EVG/c/FTC/TDFATV/r + FTC/TDF
353 353 353 353 353 353 353 353 353
355 355 355 355 355 355 355 355 355
EVCG/c/FTC/TDF
ATV/r + FTC/TDF
Number of patients
%
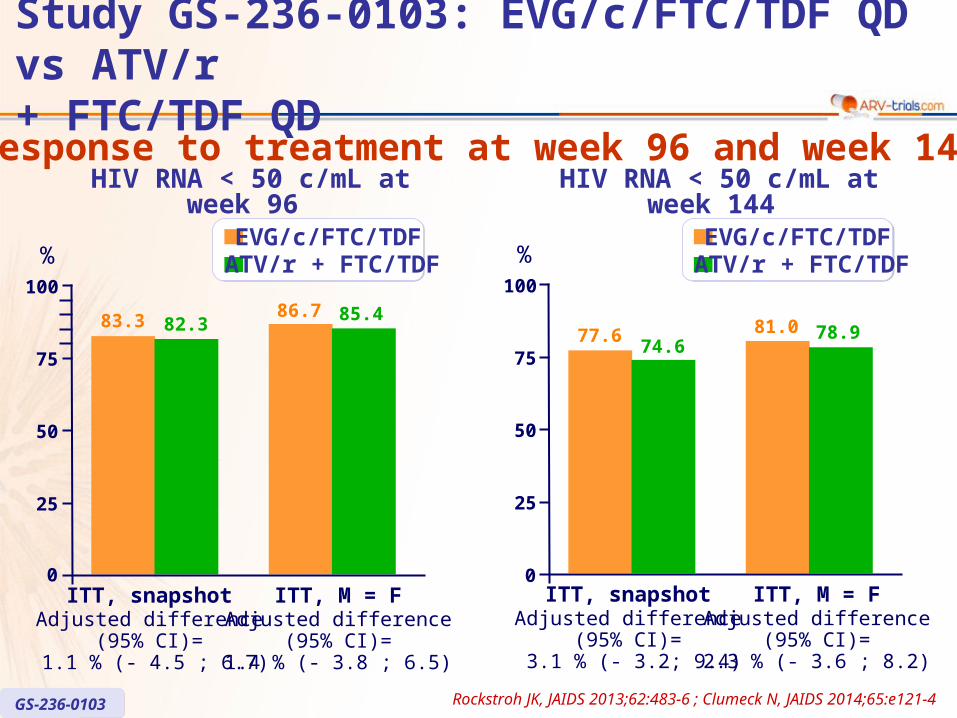
Response to treatment at week 96 and week 144
Rockstroh JK, JAIDS 2013;62:483-6 ; Clumeck N, JAIDS 2014;65:e121-4GS-236-0103
25
50
100
75
83.3 82.3
%
Adjusted difference(95% CI)=
1.1 % (- 4.5 ; 6.7)
86.7 85.4
Adjusted difference(95% CI)=
1.4 % (- 3.8 ; 6.5)
ITT, snapshot ITT, M = F
EVG/c/FTC/TDFATV/r + FTC/TDF
HIV RNA < 50 c/mL at week 96
0
25
50
100
7577.6
74.6
%
Adjusted difference(95% CI)=
3.1 % (- 3.2; 9.4)
Adjusted difference(95% CI)=
2.3 % (- 3.6 ; 8.2)
ITT, snapshot ITT, M = F
81.0 78.9
HIV RNA < 50 c/mL at week 144
EVG/c/FTC/TDFATV/r + FTC/TDF
0
Study GS-236-0103: EVG/c/FTC/TDF QD vs ATV/r + FTC/TDF QD

Response to treatment at week 144
EVG/c/FTC/TDF ATV/r + FTC/TDF
Virologic failure 7.9 % 7.3 %
Mean CD4/mm3 increase + 280 + 293
No treatment difference in virologic success for various subgroups, including patients with HIV RNA > 100,000 c/mL at baseline, except for adherence > 95 % (favoring EVG/c/FTC/TDF)
EVG/c/FTC/TDF ATV/r + FTC/TDF
W48 W96 W144 W48 W96 W144
Lumbar spine - 2.63 % - 1.96 % - 1.43%* - 3.33 % - 3.54 % -3.68%*
Hip - 3.06 % - 3.16 % - 2.83% - 3.88 % - 4.19 % -3.77%
* p = 0.018
DeJesus E. Lancet 2012;379:2429-38 ; Rockstroh JK, JAIDS 2013;62:483-6 ; Clumeck N, JAIDS 2014;65:e121-4 GS-236-0103
Mean decrease in bone mineral density
Secondary outcomes
Study GS-236-0103: EVG/c/FTC/TDF QD vs ATV/r + FTC/TDF QD

Virologic failure definition– Suboptimal virologic response : 2 consecutive visits with HIV RNA ≥ 50 c/mL
and <1 log10 c/mL below baseline at or after week 8– Virologic rebound (2 consecutive visits with HIV RNA either ≥ 400 c/mL after achieving
HIV RNA < 50 c/mL, or >1 log10 c/mL increase from nadir) – HIV RNA ≥ 400 c/mL at their last visit (at or after week 8)
Criteria for resistance testing– Virological failure or HIV RNA > 400 c/mL at study discontinuation
(at or after W8 and taking study drug)
EVG/c/FTC/TDFN = 353
ATV/r + FTC/TDFN = 355
Analysed for the development of resistance 12 (3.4%) 8 (2.3%)
Emergent primary integrase mutations 4*, ** -
Emergent reverse transcriptase resistance 4 0
M184V
K65R
4
1
-
-
Emergent primary protease mutation - 0
* Q148R, N = 2, N155H, N = 1, T66I + E92Q + N155H, N = 1 ; ** 1 had also M184V + K65R and 2 M184V
DeJesus E. Lancet 2012;379:2429-38
GS-236-0103
Resistance data at week 48
Study GS-236-0103: EVG/c/FTC/TDF QD vs ATV/r + FTC/TDF QD

EVG/c/FTC/TDFN = 353
ATV/r + FTC/TDFN = 355
TotalD0-W48
W48-W96
W96-W144
TotalD0-W48
W48-W96
W96-W144
Emergent resistance, n 8 5* 1 2** 2 0 0 2
INSTI resistance 6 4 1 1 -
E92Q 2 1 1 0
N155H 2 2 0 0
Q148R 2 2 0 0
T66I 1 1 0 0
T97A 1 0 0 1
NRTI resistance 7 4 1 2 2 0 0 2
M184V/I 7 4 1 2 2
K65R 1 1 0 0 0
Protease mutation - 0
Resistance data at week 144
Rockstroh JK, JAIDS 2013 62:483-6 ; Clumeck N, JAIDS 2014;65:e121-4
* INSTI + NRTI resistance, N = 3, ** INSTI + NRTI resistance, N = 1
GS-236-0103
Study GS-236-0103: EVG/c/FTC/TDF QD vs ATV/r + FTC/TDF QD

EVG/c/FTC/TDF ATV/r + FTC/TDFTotal at week 48 13 (3.7%) 18 (5.1%)
Ocular icterus/Jaundice 0 / 0 4 / 2
Gastro-intestinal disorder 4 5
General disorder 3 2
Drug hypersensitivity 1 0
Infection 1 2
Overdose 0 1
Aminotransferase increased 2 0
Creatinine increased 1 0
Nephropathy toxic 0 1
Limb discomfort or rhabdomyloysis 2 0
Neoplasm 1 1
Neuropsychiatric disorder 4 3
Rash, drug eruption 2 4
Other 3 0
Total at week 96 15 (4.2%) 21 (5.9%)
Total at week 144 21 (5.9%) 30 (8.5%)
DeJesus E. Lancet 2012;379:2429-38 ; Rockstroh JK, JAIDS 2013;62:483-6 ; Clumeck N, JAIDS 2014;65:e121-4 GS-236-0103
Treatment-emergent adverse events leading to premature discontinuation of study drugs
Study GS-236-0103: EVG/c/FTC/TDF QD vs ATV/r + FTC/TDF QD
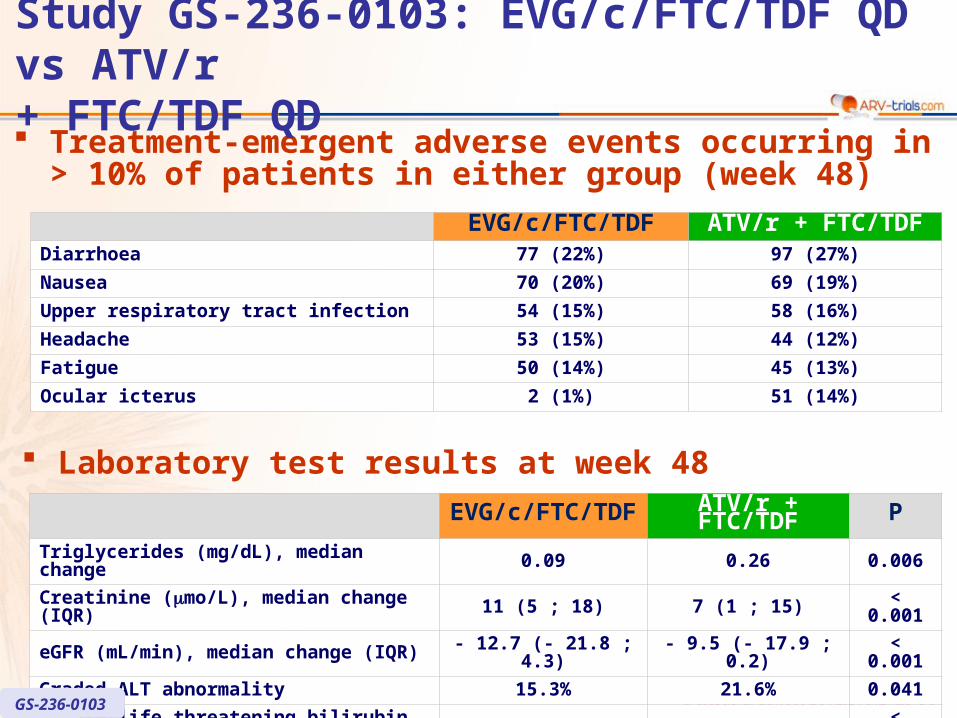
EVG/c/FTC/TDF ATV/r + FTC/TDFDiarrhoea 77 (22%) 97 (27%)
Nausea 70 (20%) 69 (19%)
Upper respiratory tract infection 54 (15%) 58 (16%)
Headache 53 (15%) 44 (12%)
Fatigue 50 (14%) 45 (13%)
Ocular icterus 2 (1%) 51 (14%)
Treatment-emergent adverse events occurring in > 10% of patients in either group (week 48)
DeJesus E. Lancet 2012;379:2429-38
EVG/c/FTC/TDF ATV/r + FTC/TDF PTriglycerides (mg/dL), median change 0.09 0.26 0.006
Creatinine (mo/L), median change (IQR) 11 (5 ; 18) 7 (1 ; 15) < 0.001
eGFR (mL/min), median change (IQR) - 12.7 (- 21.8 ; 4.3) - 9.5 (- 17.9 ; 0.2) < 0.001
Graded ALT abnormality 15.3% 21.6% 0.041
Severe/life threatening bilirubin abnormality 0.6% 58.2% < 0.001
Laboratory test results at week 48
GS-236-0103
Study GS-236-0103: EVG/c/FTC/TDF QD vs ATV/r + FTC/TDF QD
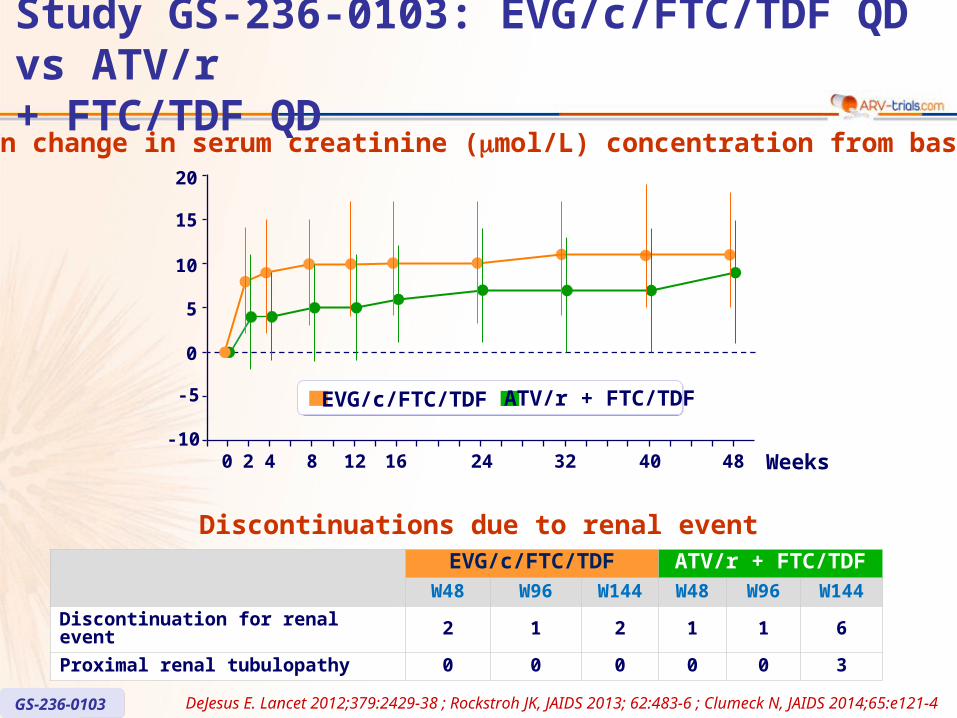
Discontinuations due to renal eventEVG/c/FTC/TDF ATV/r + FTC/TDF
W48 W96 W144 W48 W96 W144
Discontinuation for renal event 2 1 2 1 1 6
Proximal renal tubulopathy 0 0 0 0 0 3
DeJesus E. Lancet 2012;379:2429-38 ; Rockstroh JK, JAIDS 2013; 62:483-6 ; Clumeck N, JAIDS 2014;65:e121-4 GS-236-0103
Median change in serum creatinine (mol/L) concentration from baseline
EVG/c/FTC/TDF ATV/r + FTC/TDF-5
5
20
10
Weeks-10
0
15
0 2 4 8 12 16 24 32 40 48
Study GS-236-0103: EVG/c/FTC/TDF QD vs ATV/r + FTC/TDF QD
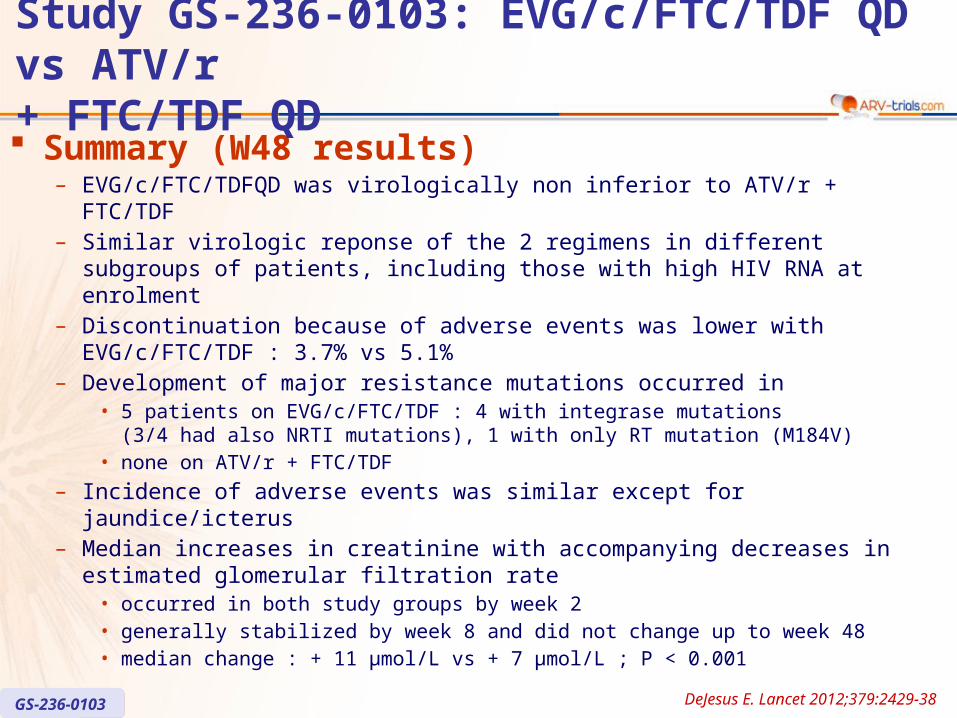
Summary (W48 results)– EVG/c/FTC/TDFQD was virologically non inferior to ATV/r + FTC/TDF– Similar virologic reponse of the 2 regimens in different subgroups of patients,
including those with high HIV RNA at enrolment– Discontinuation because of adverse events was lower with EVG/c/FTC/TDF :
3.7% vs 5.1%– Development of major resistance mutations occurred in
• 5 patients on EVG/c/FTC/TDF : 4 with integrase mutations (3/4 had also NRTI mutations), 1 with only RT mutation (M184V)
• none on ATV/r + FTC/TDF
– Incidence of adverse events was similar except for jaundice/icterus– Median increases in creatinine with accompanying decreases in estimated
glomerular filtration rate • occurred in both study groups by week 2• generally stabilized by week 8 and did not change up to week 48 • median change : + 11 μmol/L vs + 7 μmol/L ; P < 0.001
DeJesus E. Lancet 2012;379:2429-38
GS-236-0103
Study GS-236-0103: EVG/c/FTC/TDF QD vs ATV/r + FTC/TDF QD