Comparison of Hardness, FRF, Compressibility, and Ultra ... Hardness, FRF... · Pass/Light Truck...
25
1 Copyright © Akebono Brake Corporation. All Rights Reserved. Scott Severnak, Jill Thomas, Andrew Visser Comparison of Hardness, FRF, Compressibility, and Ultra-sonic Modulus Measurements 2017 SAE Presentation 17BC-0074 Akebono Brake Corporation Friction Material Design
Transcript of Comparison of Hardness, FRF, Compressibility, and Ultra ... Hardness, FRF... · Pass/Light Truck...

1Copyright © Akebono Brake Corporation. All Rights Reserved.
Scott Severnak, Jill Thomas, Andrew Visser
Comparison of Hardness, FRF, Compressibility, and Ultra-sonic
Modulus Measurements2017 SAE Presentation 17BC-0074
Akebono Brake CorporationFriction Material Design

2Copyright © Akebono Brake Corporation. All Rights Reserved.
Friction Quality MeasurementsPass/Light Truck Brake Pad Quality
•There are diverse opinions within the brake community for determining ongoing production quality of a finished brake pad
•This presentation compares several industry methods
•There are two underlying common characteristics assessed across all manufacturers
– Dimensions» Overall thickness, abutment height/length, friction/plate flatness,
parallelism, and topography/shape– Friction Modulus
» All use some type of measurement in attempt to assess raw materials and processing consistency for modulus

3Copyright © Akebono Brake Corporation. All Rights Reserved.
Friction Quality MeasurementsMatrix of Main Quality Measurement Types
Compressibility FRF RockwellHardness
Direct Modulus(Ultrasound) Dimensions Comment
Primary Characatersic Desired Modulus Modulus Modulus Modulus Dimensions --
What is it measuring
Approximation of friction modulus and dimensional
effects
Primarily plate modulus &
secondary friction modulus
Friction surface approximation of friction modulus
Approximation of friction modulus
Friction flatness, plate flatness,
parallelism, abutments, etc.
--
Independent instrinsic quality/engineering measurement
of friction materialsNo No Yes Yes Yes
Can one compare quality independent of shape, friction formulation, chamfers/slots etc.?
In Process Correlation No No Poor/Moderate Excellent --Can I determine how a part was processed by correlating to previous process measurements?
Reference SAEJ2468
SAEJ2598
SAEJ2654
SAE Paper2010-01-1701 -- --
Equipment Used for this presentation
Link
1620-H
Zonicbook
618E
Instron Wilson/Rockwell
Series 600
Industrial Measurement
Systems
iETEK
-- --

4Copyright © Akebono Brake Corporation. All Rights Reserved.
Friction Quality MeasurementsCompressibility
• Pad compressibility is made up of two primary components
– Friction Modulus» Reciprocal of compressibility without dimensional
influence is an approximate measurement of Young’s modulus.
– Dimensions» Any friction flatness, plate flatness, parallelism, and
topography beyond being “zero” typically contribute to compressibility (i.e. will be part of the deflection in the compressibility). Typical friction flatness, plate flatness, parallelism specifications are in the 100-200 µm (0.10 mm – 0.20 mm) range.

5Copyright © Akebono Brake Corporation. All Rights Reserved.
Friction Quality MeasurementsFRF, Hardness, Ultrasound
FRF is made up of two main components but in general is attempting to detect changes in friction modulus
– Pressure Plate (primary)• Material Properties (Modulus)• Plate thickness
– Friction Material (secondary)• Material Properties (Modulus)• Geometric Properties (slots, chamfers, variation within geometric
properties)Rockwell hardness
– Uses a small scale surface approximation of modulus which is then extrapolated to characterize the entire pad
Ultrasound – Yields approximation of modulus based on the fundamental relationship
between the ultrasonic velocity and the material elastic constants

6Copyright © Akebono Brake Corporation. All Rights Reserved.
Friction Quality MeasurementsAssessing Friction Modulus
Compressibility FRF Rockwell Hardness Ultrasound
Acquiring Friction
Modulus
Requires machining pads close to ‘zero’ for dimensions
or using small coupon size pieces. Commonly referred to as "Specific" Compressibility
Need to account for other geometric variables (pressure
plate thickness, friction thickness, slot depth, chamfer
size, etc.)
Only rough relationship can be established to modulus Direct measurement
Challenges
Lead time to make parts
Still will have dimensional contributions
Sensitivity to changes to friction modulus lower than
other factors (plate thickness, dimensions)
Have to know relationship to modulus and can be highly
influenced if part is scorched
Hardness measurement on a single pad is highly variable
Newer technology
BenefitsYields combined measurement that gives insites into modulus and fluid displacement
Relatively quick measurement
Can correlate to previous measurements taken in the
process (post hot press, post cure, post grind)
Can correlate to previous measurements taken in the
process (post hot press, post cure, post grind)
ReferenceSAE Presenation BC201-3
SAE Paper 2008-01-2572---- ----- SAE Paper 2010-01-1701

7Copyright © Akebono Brake Corporation. All Rights Reserved.
Friction Quality MeasurementsRepeatability/Environmental/Pressure Plate Sensitivity
• N=10 different pad shapes all current OE production• N=9 NAO’s, N=1 Semi-Met• N=6 Akebono, N=4 non Akebono• Measurements:
• Compressibility SAE J2468 T3/100 bar [microns]• FRF SAE J2598 [Hz] (1st bending mode)• Rockwell Hardness SAE J2654 [HRR or HRS]• Ultrasound Modulus [MPa] (note density = 1.00, reference SAE Paper– 2010-01-1701)
• Run 1 - Pads were dried out 2 hours @ 110OC then measured• Run 2 - Pads subjected to 25OC @ 80% RH for 24 hours then measured• Run 3 - Pads were dried out again 2 hours @ 110OC then measured• Run 4 - 0.40 mm ground off pressure plate, dried 2 hours @ 110OC then
measured (simulation of typical min to max plate thickness tolerance and pressure plate flatness almost zero)

8Copyright © Akebono Brake Corporation. All Rights Reserved.
3000250020001500
3000
2500
2000
1500
1 - FRF Initial Dry
3 -
FRF
Dry
AkebonoNon Akebono
Friction
FRF - Run 3 vs. Run 1
140120100806040
140
120
100
80
60
40
1 - Comp. Initial Dry
3 -
Com
p. D
ry
AkebonoNon Akebono
Friction
Compressibility - Run 3 vs. Run 1
18001600140012001000800
1800
1600
1400
1200
1000
800
1 - Modulus Initial Dry
3 -
Mod
ulus
Dry
AkebonoNon Akebono
Friction
Modulus - Run 3 vs. Run 1
1009080706050
100
90
80
70
60
50
1 - Hardness Initial Dry
3 -
Har
dnes
s D
ry
AkebonoNon Akebono
Friction
Hardness - Run 3 vs. Run 1
R²=0.99
R²=0.99
R²=1.00
R²=0.81
Friction Quality MeasurementsRepeatability - Run 3 vs. Run 1
• Run 1 - Pads were dried out 2 hours @ 110OC then measured• Run 3 - Pads were dried out again 2 hours @ 110OC then measured
Note: X &Y scales are
same on each respective plot

9Copyright © Akebono Brake Corporation. All Rights Reserved.
Friction Quality MeasurementsAbsolute % Change - Repeatability
ModulusHardnessFRFCompressibility
25
20
15
10
5
0
% A
bsol
ute
Chan
ge
1.795390.297067
4.11681
1.79527
% Absolute Change - Repeatability

10Copyright © Akebono Brake Corporation. All Rights Reserved.
Friction Quality MeasurementsEnvironmental Sensitivity - Run 2 vs. Run 1• Run 1 - Pads were dried out 2 hours @ 110OC then measured• Run 2 - Pads subjected to 25OC @ 80% RH for 24 hours then measured
Note: X &Y scales are same on each respective plot
3000250020001500
3000
2500
2000
1500
1 - FRF Initial Dry
2 -
FRF
1st H
umid
AkebonoNon Akebono
Friction
FRF - Post Humidity Soak vs. Run 1
1009080706050
100
90
80
70
60
50
1 - Hardness Initial Dry
2 -
Har
dnes
s 1s
t Hum
id
AkebonoNon Akebono
Friction
Hardness - Post Humidity Soak vs. Run 1
18001600140012001000800
1800
1600
1400
1200
1000
800
1 - Modulus Initial Dry
2 -
Mod
ulus
1st
Hum
id
AkebonoNon Akebono
Friction
Modulus - Post Humidity Soak vs. Run 1
140120100806040
140
120
100
80
60
40
1 - Comp. Initial Dry
2 -
Com
p. 1
st H
umid
AkebonoNon Akebono
Friction
Compressibility - Post Humidity Soak vs. Run 1
R²=0.98
R²=0.98
R²=1.00
R²=0.78

11Copyright © Akebono Brake Corporation. All Rights Reserved.
Friction Quality MeasurementsAbsolute % Change - Humidity
Modulus - HumidityHardness - HumidityFRF - HumidityComp. - Humidity
25
20
15
10
5
0
% A
bsol
ute
Chan
ge
3.11794
0.752171
5.69179
2.01584
% Absolute Change - Humidity
12Copyright © Akebono Brake Corporation. All Rights Reserved.
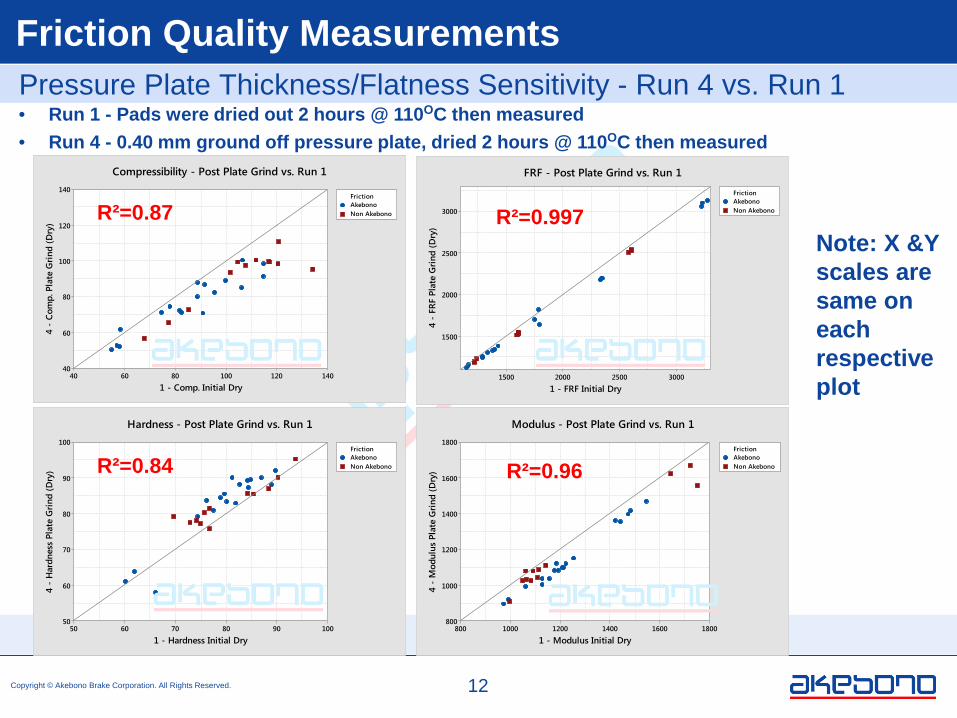
Friction Quality MeasurementsPressure Plate Thickness/Flatness Sensitivity - Run 4 vs. Run 1
3000250020001500
3000
2500
2000
1500
1 - FRF Initial Dry
4 -
FRF
Plat
e G
ri nd
(Dry
)
AkebonoNon Akebono
Friction
FRF - Post Plate Grind vs. Run 1
• Run 1 - Pads were dried out 2 hours @ 110OC then measured• Run 4 - 0.40 mm ground off pressure plate, dried 2 hours @ 110OC then measured
140120100806040
140
120
100
80
60
40
1 - Comp. Initial Dry
4 -
Com
p. P
late
Grin
d (D
ry)
AkebonoNon Akebono
Friction
Compressibility - Post Plate Grind vs. Run 1
18001600140012001000800
1800
1600
1400
1200
1000
800
1 - Modulus Initial Dry
4 -
Mod
ulus
Pla
te G
rind
(Dry
)
AkebonoNon Akebono
Friction
Modulus - Post Plate Grind vs. Run 1
1009080706050
100
90
80
70
60
50
1 - Hardness Initial Dry
4 -
Har
dnes
s Pl
ate
Grin
d (D
ry)
AkebonoNon Akebono
Friction
Hardness - Post Plate Grind vs. Run 1
R²=0.87
R²=0.96
R²=0.997
R²=0.84
Note: X &Y scales are same on each respective plot

13Copyright © Akebono Brake Corporation. All Rights Reserved.
Friction Quality MeasurementsAbsolute % Change – Pressure Plate Thickness Sensitivity
Modulus - PlateHardness - PlateFRF - PlateComp. - Plate
25
20
15
10
5
0
% A
bsol
ute
Chan
ge
9.8989
3.550884.88762 5.20253
% Absolute Change - Plate

14Copyright © Akebono Brake Corporation. All Rights Reserved.
Friction Quality MeasurementsWith “Use” Sensitivity
• N=4 vehicle platforms• All NAO materials• Various typical OE dynamometer development tests conducted
(Performance, FMVSS, Noise, Wear, Thermal Abuse etc.)• Measurements of Compressibility, FRF, Hardness, Modulus conducted pre
and post test • Compressibility SAE J2468 T3/100 bar [microns]• FRF SAE J2598 [Hz] (1st bending mode)• Rockwell Hardness SAE J2654 [HRR or HRS]• Ultrasound Modulus [MPa] (note actual density used, reference SAE
Paper 2010-01-1701)
•Can one assess a field returned part for it’s initial quality metric?

15Copyright © Akebono Brake Corporation. All Rights Reserved.
Friction Quality MeasurementsPost Dynamometer Test vs. Initial Measurements
320030002800260024002200200018001600
3200
3000
2800
2600
2400
2200
2000
1800
1600
Pre FRF
Post
FRF
ABCD
Platform.
FRF - Post Test vs. Pre Test
140120100806040
140
120
100
80
60
40
Pre Comp
Post
Com
p
ABCD
Platform.
Compressibility - Post Test vs. Pre Test
1007550250
100
75
50
25
0
Pre Hardness
Post
Har
dnes
s
ABCD
Platform.
Hardness - Post Test vs. Pre Test
40003500300025002000
4000
3500
3000
2500
2000
Pre Modulus
Post
Mod
ulus
ABCD
Platform.
Modulus - Post Test vs. Pre Test
R²=0.56 R²=0.99
R²=0.00 R²=0.80
Note: X &Y scales are same on each respective plot

16Copyright © Akebono Brake Corporation. All Rights Reserved.
Friction Quality MeasurementsAbsolute % Change – Post Dynamometer vs Initial
ModulusHardnessFRFCompressibility
100
90
80
70
60
50
40
30
20
10
0
% A
bsol
ute
Chan
ge
13.5202
2.26982
16.0978
5.80811
% Absolute Change vs. Measurement Type

17Copyright © Akebono Brake Corporation. All Rights Reserved.
Friction Quality MeasurementsDetecting Small Changes Raw Material Properties
•Study was conducted to assess measurement types ability to discriminate between small changes in raw material physical properties• Passenger car NAO• A baseline mix and derivatives were made by replacing 1 raw material at a
time• The replacement raw material only differed by a small change in physical
properties
• Measurements conducted on finished pad assemblies• Compressibility T3/100 bar [microns]• FRF [Hz] (1st bending mode)• Rockwell Hardness [HRR or HRS]• Ultrasound Modulus [MPa] (note actual density used, reference SAE
Paper 2010-01-1701)
•

18Copyright © Akebono Brake Corporation. All Rights Reserved.
Friction Quality MeasurementsDetecting Small Changes Raw Material Properties
7 - Ino
rganic
Fiber
6 - Abra
sive
5 - Fil
ler
4 - In
organ
ic Fib
er
3 - Fil
ler
2 - Ino
rganic
Fiber
1 - Base
line
180
170
160
150
140
130
Raw Material
Com
pres
sibi
lity
[um
]
152.33149.335
156.78157.035154.984153.14
159.97
Interval Plot of Compressibility [um]95% CI for the Mean
Individual standard deviations are used to calculate the intervals.
Statistically different mean
(95% Confidence)

19Copyright © Akebono Brake Corporation. All Rights Reserved.
Friction Quality MeasurementsDetecting Small Changes Raw Material Properties
7 - In
organic
Fiber
6 - Abras
ive
5 - Fil
ler
4 - In
organ
ic Fib
er
3 - Fil
ler
2 - In
organ
ic Fib
er
1 - Ba
seline
2940
2920
2900
2880
2860
2840
Raw Material
FRF
[Hz]
2871.46
2887.662877.192880.512877.612878.692876.53
Interval Plot of FRF [Hz]95% CI for the Mean
Individual standard deviations are used to calculate the intervals.
No statistical difference in means

20Copyright © Akebono Brake Corporation. All Rights Reserved.
Friction Quality MeasurementsDetecting Small Changes Raw Material Properties
7 - In
organ
ic Fib
er
6 - Abra
sive
5 - Fi l
ler
4 - In
organ
ic Fib
er
3 - Fil
ler
2 - In
organic
Fiber
1 - Ba
seline
90
85
80
75
70
Raw Material
Fini
shed
Har
dnes
s [H
RR]
82.154882.612581.662581.587580.9
82.437581.25
Interval Plot of Finished Hardness [HRR]95% CI for the Mean
Individual standard deviations are used to calculate the intervals.
No statistical difference in means

21Copyright © Akebono Brake Corporation. All Rights Reserved.
Friction Quality MeasurementsDetecting Small Changes Raw Material Properties
7 - In
organic
Fiber
6 - Abras
ive
5 - Fil
ler
4 - In
organ
ic Fib
er
3 - Fil
ler
2 - In
organ
ic Fib
er
1 - Ba
seline
2400
2200
2000
Raw Material
Fini
shed
Mod
ulus
[MPa
]
2190.592203.532154.282149.022160.42
2202.68
2131.54
Interval Plot of Finished Modulus [MPa]95% CI for the Mean
Individual standard deviations are used to calculate the intervals.
Statistically different mean
(95% Confidence)

22Copyright © Akebono Brake Corporation. All Rights Reserved.
Friction Quality MeasurementsDetecting Small Changes Raw Material Properties
290028752850 858075 240022002000174
162
150
2900
2875
2850
85
80
75
Compressibility [um]
FRF [Hz]
Finished Hardness [HRR]
Finished Modulus [MPa]
Correlation Between Measurements
R²=0.25
R²=0.56
R²=0.06
R²=0.09
R²=0.13 R²=0.09

23Copyright © Akebono Brake Corporation. All Rights Reserved.
Friction Quality MeasurementsSummary Matrix
• Compressibility FRF RockwellHardness
Direct Modulus(Ultrasound)
Repeatability 1.80% 0.30% 4.11% 1.80%
Sensitivity to Humidity 3.11% 0.75% 5.69% 2.02%
Sensitivity to Plate Tolerance/Plate Flatness 9.90% 3.55% 4.89% 5.20%
Changes "with use" 13.52% 2.27% 16.10% 5.81%
Sensitivity to friction modulus Excellent w/o dimensional component Poor Poor Excellent
Independent instrinsic quality/engineering measurement
No(shape dependent)
No(shape dependent) Yes Yes
In Process Correlation No No Poor/Moderate Excellent
• Direct modulus measurements on finished brake pad needs a formal testing procedure
• Direct modulus on finished brake pads should be considered as a primary assessment of friction quality along with dimensional measurements

24Copyright © Akebono Brake Corporation. All Rights Reserved.
Friction Quality MeasurementsAcknowledgments
- Friction Team at Akebono Engineering Center- Friction Team at Akebono Brake Glasgow

25Copyright © Akebono Brake Corporation. All Rights Reserved.
Friction Quality MeasurementsEnd
Thank you
– Scott Severnak– Akebono Brake Corporation– 34385 West Twelve Mile Road, Farmington
Hills MI. 48390 – 248-489-7484– [email protected]


![ANALYSIS OF THE HARDNESS OF A SELECTED …...important property of brake rotors is their hardness, which has an impact on the wear of their working surface. Following [L. 9, 10] presenting](https://static.fdocuments.in/doc/165x107/5f80656ed3f47250e6246972/analysis-of-the-hardness-of-a-selected-important-property-of-brake-rotors-is.jpg)