Comparison of Geometric and Radiometric Information from ... · a Nodal Ninja 3II camera bracket....
14
TS08E - Engineering Surveying – Equipment – 5272 Cornelis Stal, Philippe De Maeyer, Marijke De Ryck, Alain De Wulf, Rudi Goossens, Timothy Nuttens Comparison of Geometric and Radiometric Information from Photogrammetry and Color-enriched Laser Scanning FIG Working Week 2011 Bridging the Gap between Cultures Marrakech, Morocco, 18-22 May 2011 1/14 Comparison of Geometric and Radiometric Information from Photogrammetry and Color-Enriched Laser Scanning Cornelis STAL, Philippe DE MAEYER, Marijke DE RYCK, Alain DE WULF, Rudi GOOSSENS and Timothy NUTTENS, Belgium Key words: Photogrammetry, laser scanning, 3D modeling, quality analysis, geometry, radiometry SUMMARY Terrestrial photogrammetry and terrestrial laser scanning are important tools for the documentation of cultural heritage. The combination of both tools enables the generation of highly accurate geometric and radiometric 3D models. In many cases, the quality of these models is evaluated by taking the photogrammetric result as a reference and compare it with the model that has been acquired by the terrestrial laserscanner (Boehler and Marbs, 2004; Nuttens et al., 2009). However, the used methods focus on the geometric quality of the model, without taking into account the radiometric information within the model. Most point sets acquired by terrestrial laserscanners do not contain any color information. In this paper, a cultural and historical important object has been recorded and modeled by terrestrial photogrammetry and terrestrial laser scanning, respectively using a Rolleiflex 6008 metric analogue camera and a phase-based Leica HDS 6100 laser scanner in combination with a Canon EOS 450D digital camera. The 3D models are generated separately. There is no relation between the two datasets. Each point in the point set acquired by the laser scanner is enriched with color information, using a digital camera mounted on a Leica HDS adapter and a Nodal Ninja 3II camera bracket. This camera mounting system enables the no-parallax point of the camera to be on the same position as the center of the laserscanner. For each point in the color-enriched laser scan point set, a corresponding pixel in the photogrammetric model is found by texturing the point set with the orthophoto as well. The radiometry of both point sets are compared and the usability of color enriched terrestrial laser scanning will be evaluated.
Transcript of Comparison of Geometric and Radiometric Information from ... · a Nodal Ninja 3II camera bracket....
TS08E - Engineering Surveying – Equipment – 5272 Cornelis Stal, Philippe De Maeyer, Marijke De Ryck, Alain De Wulf, Rudi Goossens, Timothy Nuttens Comparison of Geometric and Radiometric Information from Photogrammetry and Color-enriched Laser Scanning FIG Working Week 2011 Bridging the Gap between Cultures Marrakech, Morocco, 18-22 May 2011
1/14
Comparison of Geometric and Radiometric Information from Photogrammetry and Color-Enriched Laser Scanning
Cornelis STAL, Philippe DE MAEYER, Marijke DE RYCK, Alain DE WULF, Rudi
GOOSSENS and Timothy NUTTENS, Belgium
Key words: Photogrammetry, laser scanning, 3D modeling, quality analysis, geometry, radiometry SUMMARY Terrestrial photogrammetry and terrestrial laser scanning are important tools for the documentation of cultural heritage. The combination of both tools enables the generation of highly accurate geometric and radiometric 3D models. In many cases, the quality of these models is evaluated by taking the photogrammetric result as a reference and compare it with the model that has been acquired by the terrestrial laserscanner (Boehler and Marbs, 2004; Nuttens et al., 2009). However, the used methods focus on the geometric quality of the model, without taking into account the radiometric information within the model. Most point sets acquired by terrestrial laserscanners do not contain any color information. In this paper, a cultural and historical important object has been recorded and modeled by terrestrial photogrammetry and terrestrial laser scanning, respectively using a Rolleiflex 6008 metric analogue camera and a phase-based Leica HDS 6100 laser scanner in combination with a Canon EOS 450D digital camera. The 3D models are generated separately. There is no relation between the two datasets. Each point in the point set acquired by the laser scanner is enriched with color information, using a digital camera mounted on a Leica HDS adapter and a Nodal Ninja 3II camera bracket. This camera mounting system enables the no-parallax point of the camera to be on the same position as the center of the laserscanner. For each point in the color-enriched laser scan point set, a corresponding pixel in the photogrammetric model is found by texturing the point set with the orthophoto as well. The radiometry of both point sets are compared and the usability of color enriched terrestrial laser scanning will be evaluated.
TS08E - Engineering Surveying – Equipment – 5272 Cornelis Stal, Philippe De Maeyer, Marijke De Ryck, Alain De Wulf, Rudi Goossens, Timothy Nuttens Comparison of Geometric and Radiometric Information from Photogrammetry and Color-enriched Laser Scanning FIG Working Week 2011 Bridging the Gap between Cultures Marrakech, Morocco, 18-22 May 2011
2/14
Comparison of Geometric and Radiometric Information from Photogrammetry and Color-Enriched Laser Scanning
Cornelis STAL, Philippe DE MAEYER, Marijke DE RYCK, Alain DE WULF, Rudi
GOOSSENS and Timothy NUTTENS, Belgium 1. INTRODUCTION
The research presented in this paper, covers an accuracy assessment of geometric and radiometric modeling by using both terrestrial photogrammetry (TP) and terrestrial laser scanning (TLS). Both techniques are used side by side for the documentation and reconstruction of ancient buildings, ruins or erected archaeological structures. TP is being used for many decades for the modeling of architectural or archaeological objects (Tack et al., 2005). Since orthorectified photos and the accompanying 3D envelope models have a relatively high geometric quality, the resulting products of this technique are considered to be valuable sources for the reconstruction of all kinds of vertical constructions. Even more important for TP is the quality of the radiometric information that can be obtained by the results. The latter is the biggest strength of TP in comparison with TLS. TLS is more recent than TP, but is nevertheless very useful for the fast acquisition of a huge amount of accurate detail points of an object of interest (Nuttens et al., 2010). In contrast with the first technique, the laserscanner does not necessarily acquire an image or equidistant grid, but the resulting point set contains 3D coordinates, possibly supplied with an intensity value or, when an internal camera is present, a RGB-value (Red-Green-Blue). On behalf of 3D modeling, the integration of both techniques results in a combination of the best of two worlds: high resolution images by means of TP and high density point sets by means of TLS. The biggest issue on the combination of TP and TLS is the assessment and control of the accuracy of the resulting multisource models. Even though the error sources and resulting decrease of accuracy are well defined for both TP and TLS separately, the question arises if the acquisition of photogrammetric recording can be combined with the TLS dataset from the same position, without separate orthorectification and with respect to known accuracy criteria. In this paper, the given issue is performed by texturing a point set by a perspective image, taken from the scanning position. The resulting dataset is compared statistically with the radiometric information of the color enriched points for corresponding points of the orthophoto. A short overview of the photographed and measured object, the ‘Porte de Landelies’ or the ‘Gate to Landelies’ is given in section 2. In section 3, the used camera and laserscanner are discussed, as well as the acquisition and processing of the data. Since the resulting orthophoto and photo taken from the scanning location are compared with each other by geometric measures, the process of texturing the point set is discussed in section 4. The quality analysis itself is given in section 5, where firstly an overall comparison of the two acquired images is given by the analysis of general statistics. Secondly, a point based comparison of the two
TS08E - Engineering Surveying – Equipment – 5272 Cornelis Stal, Philippe De Maeyer, Marijke De Ryck, Alain De Wulf, Rudi Goossens, Timothy Nuttens Comparison of Geometric and Radiometric Information from Photogrammetry and Color-enriched Laser Scanning FIG Working Week 2011 Bridging the Gap between Cultures Marrakech, Morocco, 18-22 May 2011
3/14
datasets is made by defining the RGB-values difference within a color cube. Finally, the results and discussion are formulated in the section 6. 2. STUDY AREA
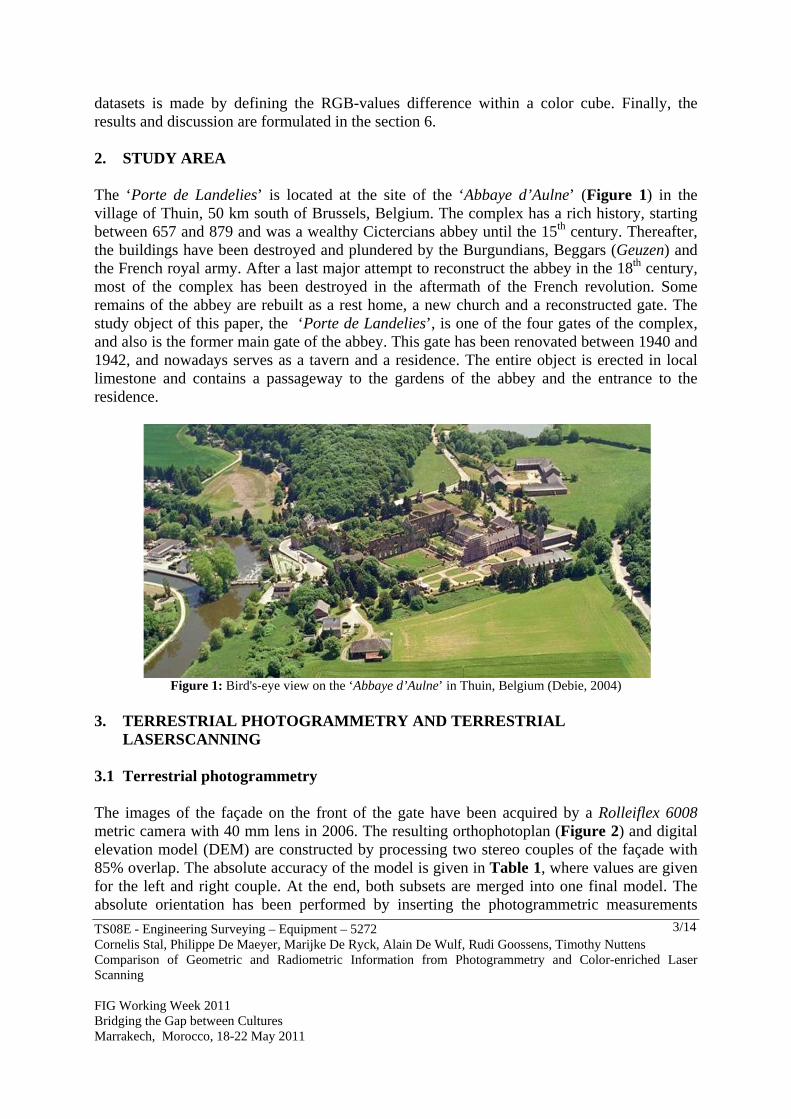
The ‘Porte de Landelies’ is located at the site of the ‘Abbaye d’Aulne’ (Figure 1) in the village of Thuin, 50 km south of Brussels, Belgium. The complex has a rich history, starting between 657 and 879 and was a wealthy Cictercians abbey until the 15th century. Thereafter, the buildings have been destroyed and plundered by the Burgundians, Beggars (Geuzen) and the French royal army. After a last major attempt to reconstruct the abbey in the 18th century, most of the complex has been destroyed in the aftermath of the French revolution. Some remains of the abbey are rebuilt as a rest home, a new church and a reconstructed gate. The study object of this paper, the ‘Porte de Landelies’, is one of the four gates of the complex, and also is the former main gate of the abbey. This gate has been renovated between 1940 and 1942, and nowadays serves as a tavern and a residence. The entire object is erected in local limestone and contains a passageway to the gardens of the abbey and the entrance to the residence.
Figure 1: Bird's-eye view on the ‘Abbaye d’Aulne’ in Thuin, Belgium (Debie, 2004)
3. TERRESTRIAL PHOTOGRAMMETRY AND TERRESTRIAL
LASERSCANNING 3.1 Terrestrial photogrammetry The images of the façade on the front of the gate have been acquired by a Rolleiflex 6008 metric camera with 40 mm lens in 2006. The resulting orthophotoplan (Figure 2) and digital elevation model (DEM) are constructed by processing two stereo couples of the façade with 85% overlap. The absolute accuracy of the model is given in Table 1, where values are given for the left and right couple. At the end, both subsets are merged into one final model. The absolute orientation has been performed by inserting the photogrammetric measurements

TS08E - Engineering Surveying – Equipment – 5272 Cornelis Stal, Philippe De Maeyer, Marijke De Ryck, Alain De Wulf, Rudi Goossens, Timothy Nuttens Comparison of Geometric and Radiometric Information from Photogrammetry and Color-enriched Laser Scanning FIG Working Week 2011 Bridging the Gap between Cultures Marrakech, Morocco, 18-22 May 2011
4/14
within a polygon in an absolute coordinate system, using a total station. Based on this polygon, 7 control points are measured on the façade, with an root mean square of 10.9 mm planimetric and 25.9 mm altimetric. The Virtuozzo photogrammetric processing software is used for the generation of the geometrical framework and the orthophoto.
Figure 2: Conventional terrestrial orthophoto of the 'Porte de Langelies' (De Ryck, 2006)
General properties
Scale 1 : 150 Pixel size (mm) 0.5
DEM spacing (mm) 10 Overlap 85%
GSD (mm) 5
Otho Spacing distance
Relative orientation DEM
(rad) Phi Omega Kappa # points 10
Left ‐0.0022 ‐0.0136 ‐0.0556 Mean average Z (mm) 0.6
Right ‐0.0004 0.0000 ‐0.0585 Mean square root (mm) 20.7
# points 130 Error interval # points %
RMS (m) 0.004 1.0 < dZ < 3.0 3 30%
4.0 < dZ < 5.0 1 10%
Absolute orientation 6.0 < dZ < 10.0 2 20%
# GCPs x (mm) y (mm) z (mm) 10.0 < dZ < 20.0 0 0%
7 6.218 9.049 25.915 20.0 < dZ < 100.0 4 40%
Table 1: Quality of the conventional terrestrial orthophoto, calculated by the Virtuozzo software (De Ryck, 2006)
TS08E - Engineering Surveying – Equipment – 5272 Cornelis Stal, Philippe De Maeyer, Marijke De Ryck, Alain De Wulf, Rudi Goossens, Timothy Nuttens Comparison of Geometric and Radiometric Information from Photogrammetry and Color-enriched Laser Scanning FIG Working Week 2011 Bridging the Gap between Cultures Marrakech, Morocco, 18-22 May 2011
5/14
3.2 Terrestrial laserscanning A dense point set of the façade has been obtained with a Leica HDS 6100 in 2011. This phase-based laserscanner is able to measure a huge amount of coordinates in a very short time range (e.g. approximately 80 million points with an acquisition time of 3.5 minutes). Based on Table 2, it can be stated that this scanner is very useful for applications in civil engineering and cultural heritage, where high accuracy is indispensible and the distance between the scanner and the object to measure is confined. The final data set contains an (x,y,z)-coordinate and an intensity value of the reflected signal for each point.
Laser Scanner System
Type Phase‐based
System Performance
Accuracy of single measurement
Position * 5 mm, 1 m to 25 m range;
9 mm to 50 m range
Angle (horizontal and vertical) 125 μrad/125 μrad, one sigma
Range 79 m ambiguity interval
79 m @90%; 50 m @18% albedo
Scan rate Up to 508,000 points/sec, maximum instantaneous rate
Scan resolution
Spot size 3 mm at exit (based on Gaussian definition) + 0.22 mrad divergence;
8 mm @25 m; 14 mm @50 m
* At 127.000 pts/sec scan rate, one sigma
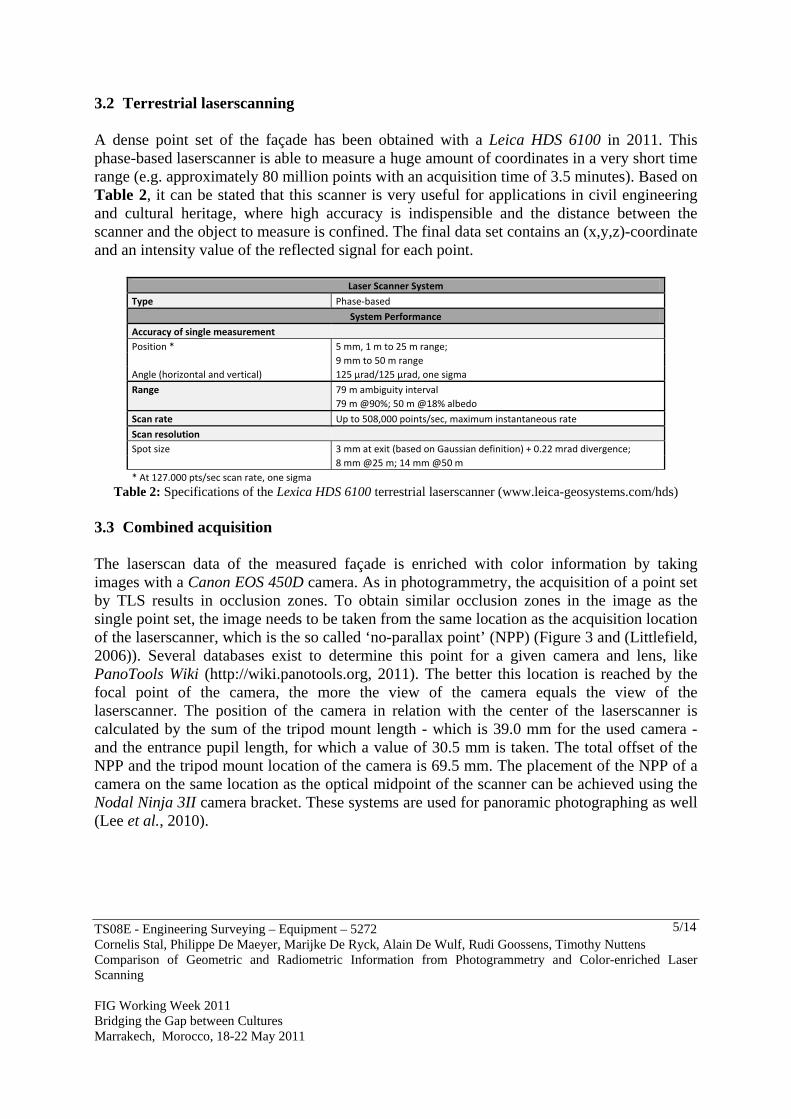
Table 2: Specifications of the Lexica HDS 6100 terrestrial laserscanner (www.leica-geosystems.com/hds) 3.3 Combined acquisition The laserscan data of the measured façade is enriched with color information by taking images with a Canon EOS 450D camera. As in photogrammetry, the acquisition of a point set by TLS results in occlusion zones. To obtain similar occlusion zones in the image as the single point set, the image needs to be taken from the same location as the acquisition location of the laserscanner, which is the so called ‘no-parallax point’ (NPP) (Figure 3 and (Littlefield, 2006)). Several databases exist to determine this point for a given camera and lens, like PanoTools Wiki (http://wiki.panotools.org, 2011). The better this location is reached by the focal point of the camera, the more the view of the camera equals the view of the laserscanner. The position of the camera in relation with the center of the laserscanner is calculated by the sum of the tripod mount length - which is 39.0 mm for the used camera - and the entrance pupil length, for which a value of 30.5 mm is taken. The total offset of the NPP and the tripod mount location of the camera is 69.5 mm. The placement of the NPP of a camera on the same location as the optical midpoint of the scanner can be achieved using the Nodal Ninja 3II camera bracket. These systems are used for panoramic photographing as well (Lee et al., 2010).
TS08E - Engineering Surveying – Equipment – 5272 Cornelis Stal, Philippe De Maeyer, Marijke De Ryck, Alain De Wulf, Rudi Goossens, Timothy Nuttens Comparison of Geometric and Radiometric Information from Photogrammetry and Color-enriched Laser Scanning FIG Working Week 2011 Bridging the Gap between Cultures Marrakech, Morocco, 18-22 May 2011
6/14
Figure 3: TLS set-up and corresponding camera offset
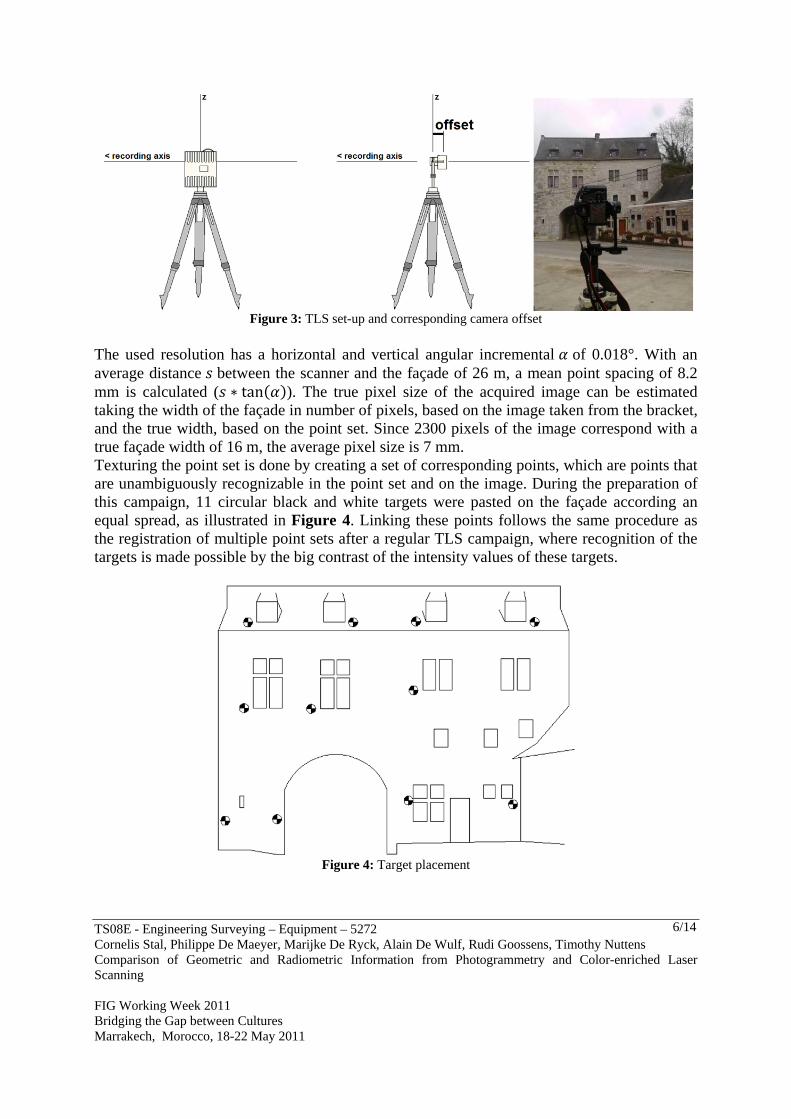
The used resolution has a horizontal and vertical angular incremental of 0.018°. With an average distance between the scanner and the façade of 26 m, a mean point spacing of 8.2 mm is calculated ( ∗ tan ). The true pixel size of the acquired image can be estimated taking the width of the façade in number of pixels, based on the image taken from the bracket, and the true width, based on the point set. Since 2300 pixels of the image correspond with a true façade width of 16 m, the average pixel size is 7 mm. Texturing the point set is done by creating a set of corresponding points, which are points that are unambiguously recognizable in the point set and on the image. During the preparation of this campaign, 11 circular black and white targets were pasted on the façade according an equal spread, as illustrated in Figure 4. Linking these points follows the same procedure as the registration of multiple point sets after a regular TLS campaign, where recognition of the targets is made possible by the big contrast of the intensity values of these targets.
Figure 4: Target placement
TS08E - Engineering Surveying – Equipment – 5272 Cornelis Stal, Philippe De Maeyer, Marijke De Ryck, Alain De Wulf, Rudi Goossens, Timothy Nuttens Comparison of Geometric and Radiometric Information from Photogrammetry and Color-enriched Laser Scanning FIG Working Week 2011 Bridging the Gap between Cultures Marrakech, Morocco, 18-22 May 2011
7/14
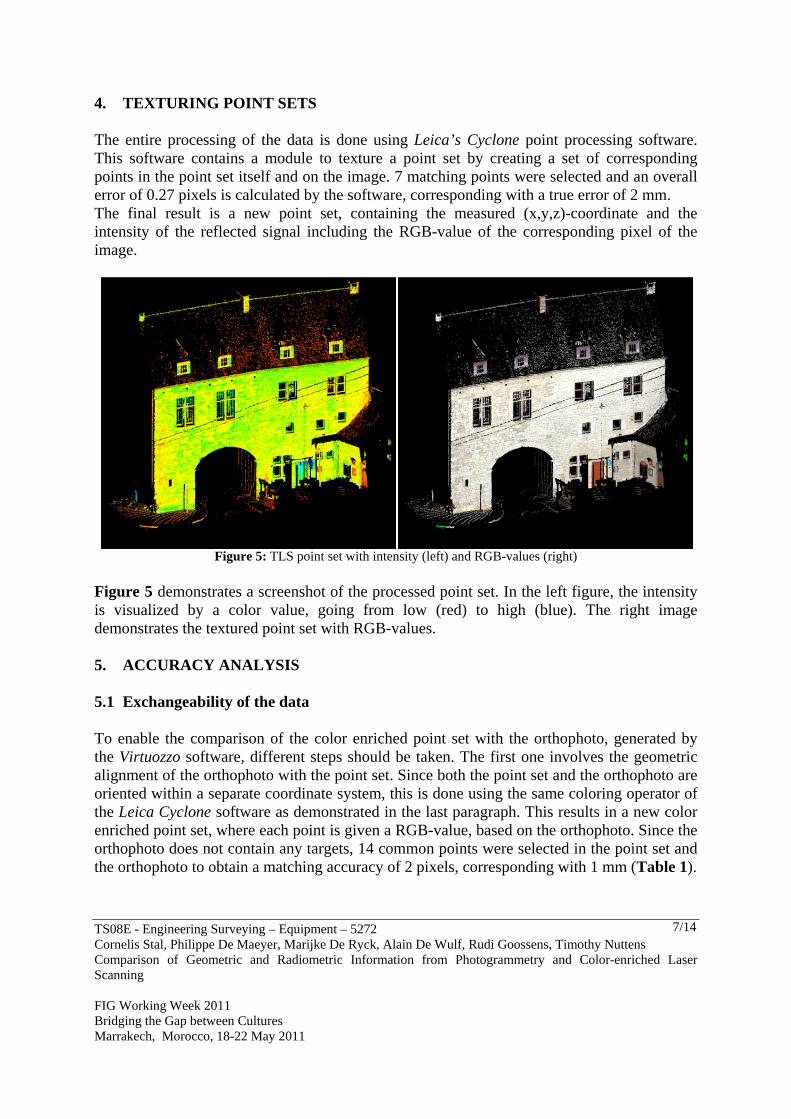
4. TEXTURING POINT SETS The entire processing of the data is done using Leica’s Cyclone point processing software. This software contains a module to texture a point set by creating a set of corresponding points in the point set itself and on the image. 7 matching points were selected and an overall error of 0.27 pixels is calculated by the software, corresponding with a true error of 2 mm. The final result is a new point set, containing the measured (x,y,z)-coordinate and the intensity of the reflected signal including the RGB-value of the corresponding pixel of the image.
Figure 5: TLS point set with intensity (left) and RGB-values (right)
Figure 5 demonstrates a screenshot of the processed point set. In the left figure, the intensity is visualized by a color value, going from low (red) to high (blue). The right image demonstrates the textured point set with RGB-values. 5. ACCURACY ANALYSIS 5.1 Exchangeability of the data To enable the comparison of the color enriched point set with the orthophoto, generated by the Virtuozzo software, different steps should be taken. The first one involves the geometric alignment of the orthophoto with the point set. Since both the point set and the orthophoto are oriented within a separate coordinate system, this is done using the same coloring operator of the Leica Cyclone software as demonstrated in the last paragraph. This results in a new color enriched point set, where each point is given a RGB-value, based on the orthophoto. Since the orthophoto does not contain any targets, 14 common points were selected in the point set and the orthophoto to obtain a matching accuracy of 2 pixels, corresponding with 1 mm (Table 1).
TS08E - Engineering Surveying – Equipment – 5272 Cornelis Stal, Philippe De Maeyer, Marijke De Ryck, Alain De Wulf, Rudi Goossens, Timothy Nuttens Comparison of Geometric and Radiometric Information from Photogrammetry and Color-enriched Laser Scanning FIG Working Week 2011 Bridging the Gap between Cultures Marrakech, Morocco, 18-22 May 2011
8/14
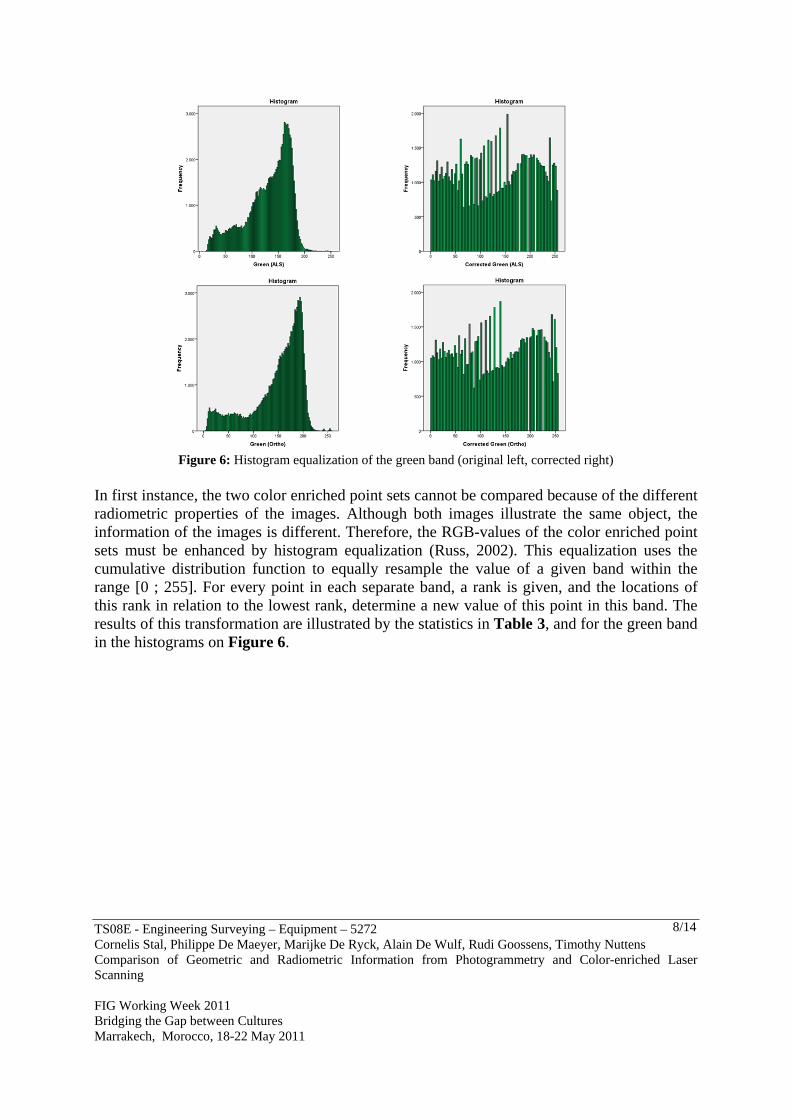
Figure 6: Histogram equalization of the green band (original left, corrected right)
In first instance, the two color enriched point sets cannot be compared because of the different radiometric properties of the images. Although both images illustrate the same object, the information of the images is different. Therefore, the RGB-values of the color enriched point sets must be enhanced by histogram equalization (Russ, 2002). This equalization uses the cumulative distribution function to equally resample the value of a given band within the range [0 ; 255]. For every point in each separate band, a rank is given, and the locations of this rank in relation to the lowest rank, determine a new value of this point in this band. The results of this transformation are illustrated by the statistics in Table 3, and for the green band in the histograms on Figure 6.
TS08E - Engineering Surveying – Equipment – 5272 Cornelis Stal, Philippe De Maeyer, Marijke De Ryck, Alain De Wulf, Rudi Goossens, Timothy Nuttens Comparison of Geometric and Radiometric Information from Photogrammetry and Color-enriched Laser Scanning FIG Working Week 2011 Bridging the Gap between Cultures Marrakech, Morocco, 18-22 May 2011
9/14
Descriptives
Mean St. Dev. Median EOM
ALS
Red Original 132,56 40,533 143,00 0,129
Corrected 128,59 74,007 128,20 0,236
Greed Original 130,13 42,485 141,00 0,136
Corrected 128,53 73,982 129,55 0,236
Blue Original 122,51 42,112 132,00 0,134
Corrected 128,50 73,952 129,09 0,236
Ortho
Red Original 157,60 50,023 173,00 0,160
Corrected 128,57 74,114 127,76 0,237
Green Original 147,66 51,948 164,00 0,166
Corrected 128,52 74,062 127,76 0,236
Blue Original 140,31 52,617 157,00 0,168
Corrected 128,42 74,093 129,34 0,237
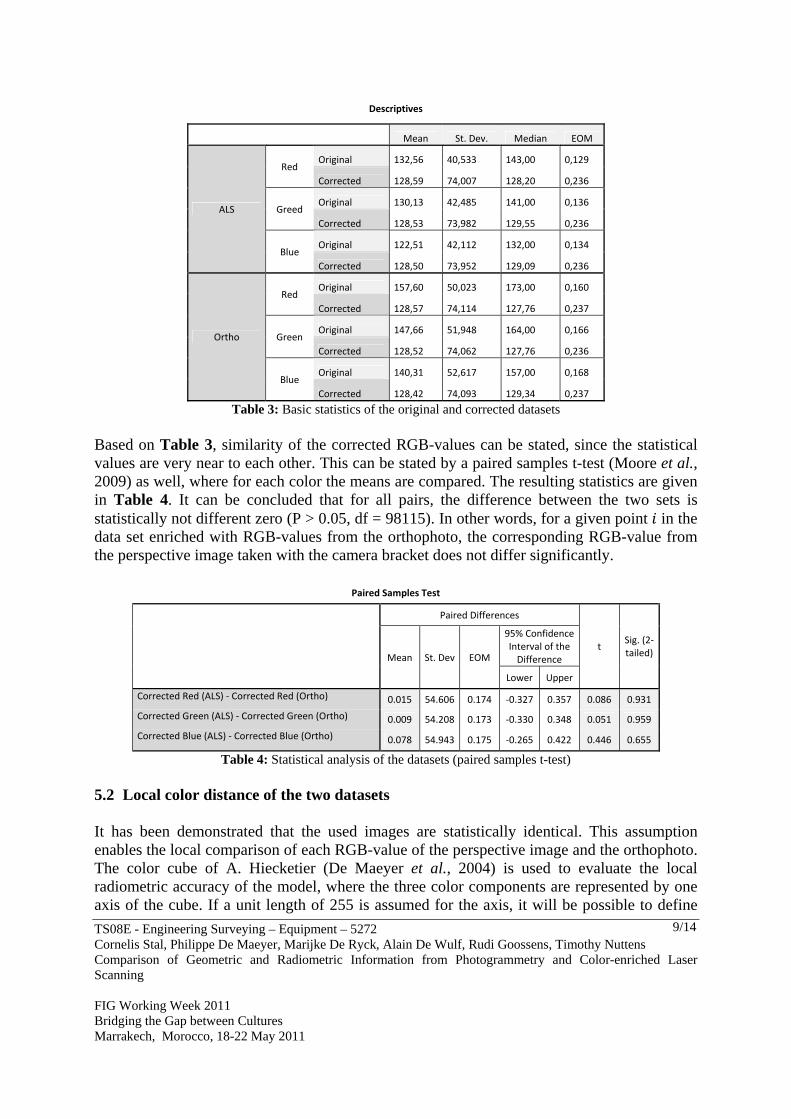
Table 3: Basic statistics of the original and corrected datasets Based on Table 3, similarity of the corrected RGB-values can be stated, since the statistical values are very near to each other. This can be stated by a paired samples t-test (Moore et al., 2009) as well, where for each color the means are compared. The resulting statistics are given in Table 4. It can be concluded that for all pairs, the difference between the two sets is statistically not different zero (P > 0.05, df = 98115). In other words, for a given point in the data set enriched with RGB-values from the orthophoto, the corresponding RGB-value from the perspective image taken with the camera bracket does not differ significantly.
Paired Samples Test
Paired Differences
t Sig. (2‐tailed) Mean St. Dev EOM
95% Confidence Interval of the Difference
Lower Upper
Corrected Red (ALS) ‐ Corrected Red (Ortho) 0.015 54.606 0.174 ‐0.327 0.357 0.086 0.931
Corrected Green (ALS) ‐ Corrected Green (Ortho) 0.009 54.208 0.173 ‐0.330 0.348 0.051 0.959
Corrected Blue (ALS) ‐ Corrected Blue (Ortho) 0.078 54.943 0.175 ‐0.265 0.422 0.446 0.655
Table 4: Statistical analysis of the datasets (paired samples t-test) 5.2 Local color distance of the two datasets It has been demonstrated that the used images are statistically identical. This assumption enables the local comparison of each RGB-value of the perspective image and the orthophoto. The color cube of A. Hiecketier (De Maeyer et al., 2004) is used to evaluate the local radiometric accuracy of the model, where the three color components are represented by one axis of the cube. If a unit length of 255 is assumed for the axis, it will be possible to define
TS08E - Engineering Surveying – Equipment – 5272 Cornelis Stal, Philippe De Maeyer, Marijke De Ryck, Alain De Wulf, Rudi Goossens, Timothy Nuttens Comparison of Geometric and Radiometric Information from Photogrammetry and Color-enriched Laser Scanning FIG Working Week 2011 Bridging the Gap between Cultures Marrakech, Morocco, 18-22 May 2011
10/14
each possible color within this cube. The difference between two RGB-values Δ , , can be made by calculating the Euclidian distance between these two colors in the cube, so:
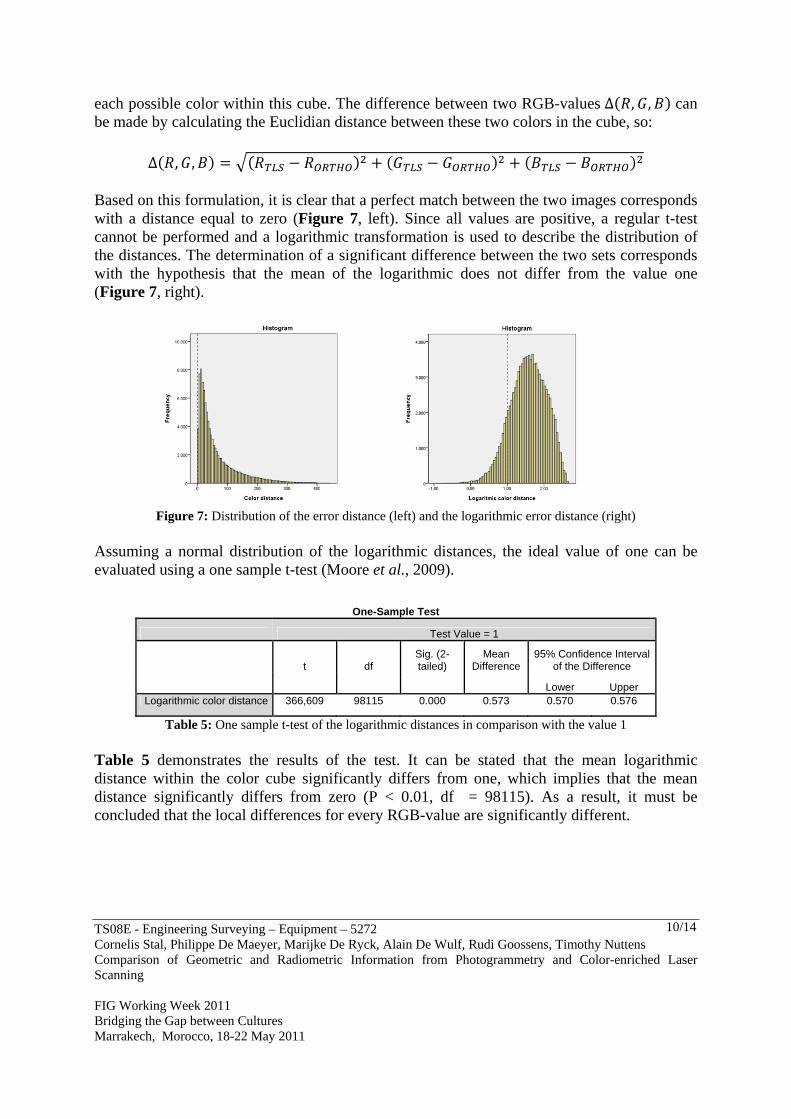
Δ , , Based on this formulation, it is clear that a perfect match between the two images corresponds with a distance equal to zero (Figure 7, left). Since all values are positive, a regular t-test cannot be performed and a logarithmic transformation is used to describe the distribution of the distances. The determination of a significant difference between the two sets corresponds with the hypothesis that the mean of the logarithmic does not differ from the value one (Figure 7, right).
Figure 7: Distribution of the error distance (left) and the logarithmic error distance (right)
Assuming a normal distribution of the logarithmic distances, the ideal value of one can be evaluated using a one sample t-test (Moore et al., 2009).
One-Sample Test
Test Value = 1
t df Sig. (2-tailed)
Mean Difference
95% Confidence Interval of the Difference
Lower Upper Logarithmic color distance 366,609 98115 0.000 0.573 0.570 0.576
Table 5: One sample t-test of the logarithmic distances in comparison with the value 1 Table 5 demonstrates the results of the test. It can be stated that the mean logarithmic distance within the color cube significantly differs from one, which implies that the mean distance significantly differs from zero (P < 0.01, df = 98115). As a result, it must be concluded that the local differences for every RGB-value are significantly different.
TS08E - Engineering Surveying – Equipment – 5272 Cornelis Stal, Philippe De Maeyer, Marijke De Ryck, Alain De Wulf, Rudi Goossens, Timothy Nuttens Comparison of Geometric and Radiometric Information from Photogrammetry and Color-enriched Laser Scanning FIG Working Week 2011 Bridging the Gap between Cultures Marrakech, Morocco, 18-22 May 2011
11/14
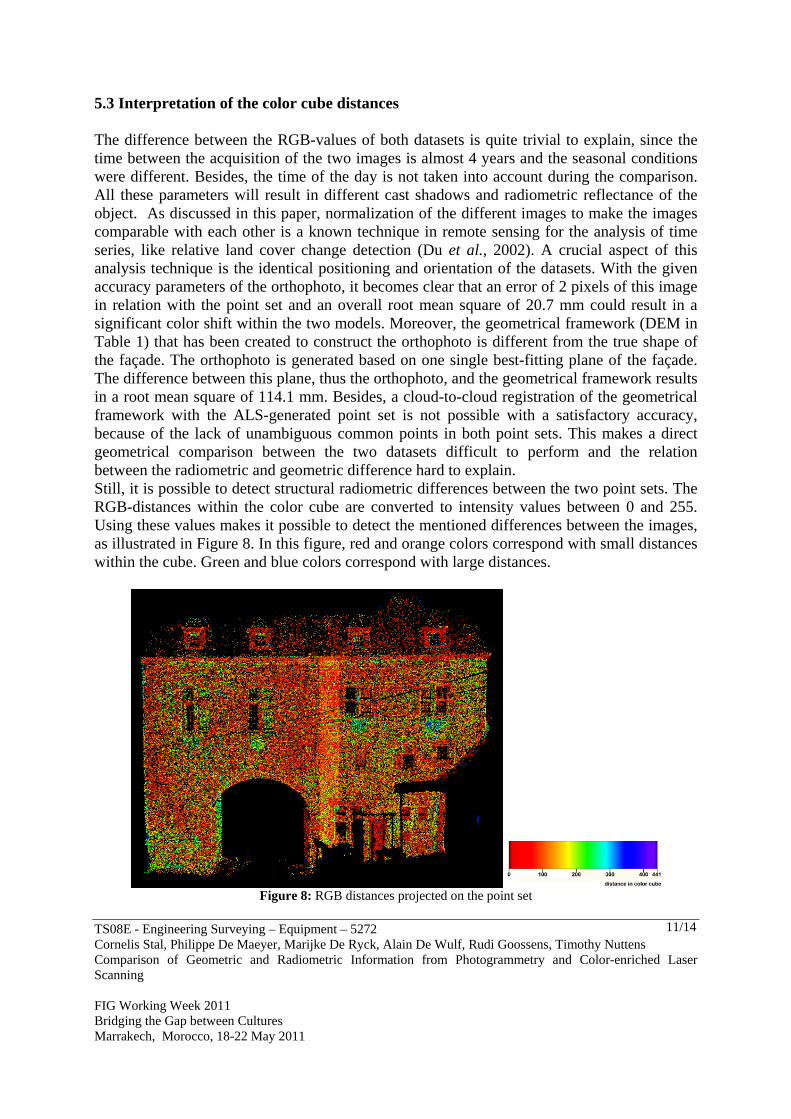
5.3 Interpretation of the color cube distances The difference between the RGB-values of both datasets is quite trivial to explain, since the time between the acquisition of the two images is almost 4 years and the seasonal conditions were different. Besides, the time of the day is not taken into account during the comparison. All these parameters will result in different cast shadows and radiometric reflectance of the object. As discussed in this paper, normalization of the different images to make the images comparable with each other is a known technique in remote sensing for the analysis of time series, like relative land cover change detection (Du et al., 2002). A crucial aspect of this analysis technique is the identical positioning and orientation of the datasets. With the given accuracy parameters of the orthophoto, it becomes clear that an error of 2 pixels of this image in relation with the point set and an overall root mean square of 20.7 mm could result in a significant color shift within the two models. Moreover, the geometrical framework (DEM in Table 1) that has been created to construct the orthophoto is different from the true shape of the façade. The orthophoto is generated based on one single best-fitting plane of the façade. The difference between this plane, thus the orthophoto, and the geometrical framework results in a root mean square of 114.1 mm. Besides, a cloud-to-cloud registration of the geometrical framework with the ALS-generated point set is not possible with a satisfactory accuracy, because of the lack of unambiguous common points in both point sets. This makes a direct geometrical comparison between the two datasets difficult to perform and the relation between the radiometric and geometric difference hard to explain. Still, it is possible to detect structural radiometric differences between the two point sets. The RGB-distances within the color cube are converted to intensity values between 0 and 255. Using these values makes it possible to detect the mentioned differences between the images, as illustrated in Figure 8. In this figure, red and orange colors correspond with small distances within the cube. Green and blue colors correspond with large distances.
Figure 8: RGB distances projected on the point set
TS08E - Engineering Surveying – Equipment – 5272 Cornelis Stal, Philippe De Maeyer, Marijke De Ryck, Alain De Wulf, Rudi Goossens, Timothy Nuttens Comparison of Geometric and Radiometric Information from Photogrammetry and Color-enriched Laser Scanning FIG Working Week 2011 Bridging the Gap between Cultures Marrakech, Morocco, 18-22 May 2011
12/14
Figure 8 demonstrates the same distribution of the distances within the color cube than the distribution as demonstrated in Figure 7 (left). The red points in Figure 8, corresponding with a distance less than 100 color units within the cube, dominate the figure and represent the geometrical shift that generates a color difference between the white limestone and the grey joints between the stones. More stringing in the figure are some clusters with extreme distance values below the windows. These differences are caused by the presence of red roses in the orthophoto of Figure 2. In the perspective image of Figure 3 (right), no flowers are present. As a consequence of this big color contrasts and the resulting distances, these changes could be detected easily. 6. RESULTS AND CONCLUSION In this research the radiometric comparability of conventional terrestrial orthophotos and the combination of perspective photogrammetry and ALS is investigated. After the acquisition of two separate datasets of a historical object, it has been stated that both the data set subtracted from the ALS and the data set subtracted from the orthophoto are in general radiometrically identical. This statement is based on the analysis of the means of all paired data sets, respectively red, green and blue. The local differences between each corresponding RGB-value are significant, based on the analysis of the distance between the color values within a color cube. These local differences could be caused by ambiguity errors during the texturing phase of the point set by the orthophoto. The resulting error will cause a shift of the entire image and the corresponding colors. Another more trivial reason for local differences is the different timeframe of the two images. As a result, color enriched point sets from the combination of ALS with perspective photogrammetry can be used as a fast alternative for conventional terrestrial photogrammetry if the accent of the research will be on both the geometric and radiometric modeling of an object. The radiometric information of both models will not necessarily be identical, but sufficient for the creation of fast 3D models. Change detection is also possible by the comparison of the different color enriched point sets by projecting the distances within the color cube on this point set. A correct approach of the origin of the TLS and the NPP is very important when using this method, but this can be achieved using a camera bracket and parameters from several available databases on the internet. ACKNOWLEDGEMENT This paper is part of the research project “3D CAD modeling of spatial architectural volumes, using terrestrial laserscanning and LiDAR” (G082309N of the Fund for Scientific Research Flanders (FWO). This project is promoted by Prof. Dr. Ir. A. De Wulf, Prof. Dr. Ph. De Maeyer, Prof. Dr. N. Van De Weghe, Prof. Dr. S. Gautama, Prof. Dr. R. De Meyer and Arch. M. Mattys. The authors would like to acknowledge the support of FWO-Flanders. The given orthophotos are generated by MSc. M. De Ryck of Ghent University in collaboration with Mr. J. Debie of the Ministry of the Walloon Region (Belgium) in 2006.
TS08E - Engineering Surveying – Equipment – 5272 Cornelis Stal, Philippe De Maeyer, Marijke De Ryck, Alain De Wulf, Rudi Goossens, Timothy Nuttens Comparison of Geometric and Radiometric Information from Photogrammetry and Color-enriched Laser Scanning FIG Working Week 2011 Bridging the Gap between Cultures Marrakech, Morocco, 18-22 May 2011
13/14
REFERENCES Boehler, W., Marbs, A., 2004. 3D Scanning and Photogrammetry for Heritage Recording: a Comparison, 12th Conference of Geoinformatics - Geospatial Information Research: Bridging the Pacific and Atlantic, University of Gävle, Sweden. De Maeyer, P., De Vliegher, B.M., Brondeel, M., 2004. Spiegel van de wereld, fundamenten van de cartografie (in Dutch). Academia Press, Ghent, Belgium. Du, Y., Teillet, P., Cihlar, J., 2002. Radiometric Normalization of Multitemporal High-resolution Satellite Images with Quality Control for Land Cover Change Detection. Remote Sensing of Environment 82, 123 - 134. http://wiki.panotools.org, 2011. PanoTools Wiki. Lee, H., Tateyama, Y., Ogi, T., 2010. Realistic Visual Environments for Immersive Projection Display System, 16th International Conference on Virtual Systems and Multimedia (VSMM), Seoul, Korea, pp. 128-132. Littlefield, R., 2006. Theory of the No-Parallax Points, www.janrik.net/PanoPostings/NoParallaxPoint/TheoryOfTheNoParallaxPoint.pdf. Moore, D., McCabe, G., Craig, B., 2009. Introduction to the Practice of Statistics, 6 ed. W.H. Freeman, New York, NY, USA. Nuttens, T., De Wulf, A., Bral, L., De Wit, B., Carlier, L., De Ryck, M., Stal, C., Constales, D., De Backer, H., 2010. High resolution terrestrial laser scanning for tunnel deformation measurements, The XXIV FIG International Congress 2010 : proceedings. FIG (Fédération Internationale des Géomètres), Sidney, Australia. Nuttens, T., De Wulf, A., Goossens, R., De Maeyer, P., Matthys, M., 2009. Comparison of Terrestrial Laser Scanning and Digital Photogrammetry for Cultural Heritage, 4th International Workshop on 3D Geo-Information. DCL Print&Sign, Ghent, Belgium, pp. 159-166. Russ, J., 2002. The Image Processing Handbook. CRC Press, Boca Raton, Fl, USA. Tack, F., Debie, J., Goossens, R., De Meulemeester, J., Devriendt, D., 2005. A Feasible Methodology for the use of Close Range Photogrammetry for the Recording of Archaeological Excavations, Proceedings of the CIPA 2005 XX International Symposium, Torino, Italy, pp. 561-565.

TS08E - Engineering Surveying – Equipment – 5272 Cornelis Stal, Philippe De Maeyer, Marijke De Ryck, Alain De Wulf, Rudi Goossens, Timothy Nuttens Comparison of Geometric and Radiometric Information from Photogrammetry and Color-enriched Laser Scanning FIG Working Week 2011 Bridging the Gap between Cultures Marrakech, Morocco, 18-22 May 2011
14/14
CONTACT Cornelis STAL Ghent University – Department of Geography 3D Data Acquisition Cluster Krijgslaan 281 (Building S8) 9000 Belgium Tel. +32 9 264 46 56 Fax. +32 9 264 49 85 Email: [email protected] Web site: http://geoweb.ugent.be/data-acquisition-3d