Comparison Of Chemical And Mineral Content Of …egyptianjournal.xyz/21_10.pdfComparison Of Chemical...
15
The Egyptian Journal of Hospital Medicine Vol., 21: 116 – 130 December 2005 I.S.S.N: 12084 1687 – 2002 Comparison Of Chemical And Mineral Content Of Milk From Human, Cow, Buffalo, Camel And Goat In Egypt. Ghada Z A Soliman Lecturer of Biochemistry, Biochemistry Department, National Nutrition Institute, Cairo Abstract Milk is an important food; it is considered as a good source of Ca. Comparison studies of chemical and mineral contents of milk from human, cow, buffalo, camel and goat in Egypt are rare, so we determine chemical and mineral composition cows; camels; buffalo and goats milk in Egypt and to compare with the human milk since such comparisons are rare in Egypt. There are several studies dealing with the chemical composition of milk, but they are foreign, non- Egyptian. It is known that changing of environment has a significant effect on natural physiological function of both human and animals, so it was very important to made such study on Egyptian environment (ecology), hoping to give understanding and explain some of the malnutrition problems in Egypt. Three hundred and two milk samples were obtained at random from: cows; camels; buffalo and goats (n: 44, 108, 40, 40 respectively), while human milk was obtained from healthy lactating women (n: 70, after 3 rd month of lactation). Chemical constituents as protein, fat, carbohydrates, moisture, ash and lactose were determined. Mineral contents as calcium (Ca), iron (Fe), Zinc (Zn), sodium (Na), potassium (K), magnesium (Mg), copper (Cu), phosphorous (P) and manganese (Mn) were measured in the ash. Human milk contains the lowest protein and ash content. Buffalo milk has the highest fat and total solids content. It gives the higher yield of energy. Human milk contains the highest carbohydrates and lactose content (4.98 gm% carbohydrates, of which 4.70 are lactose, i.e. it represent 94.46 %). Human milk contains the lowest concentration of Ca, P, Fe, Zn, Na, K and Mg. Ca: P ratio of human milk is higher (2.32 vs 1.18-1.47) than other species. Mn content of human milk is higher (human milk contains ≈ 6.5 times camel and cow milk and 24.14 times as goat milk). Buffalo milk has the highest Ca, P and Mg content. Camel milk has the highest Fe, Zn, Na and Cu content. Goat milk has the highest K content. Chemical and mineral content of the 5 studied species varied widely. Camel, buffalo, cow and goat milk cannot replace human milk but it may complement it. Key words: goat, cow, human, camel, buffalo, mineral composition, chemical composition. Introduction Milk is an excellent source of most essential minerals for human. It contains mostly calcium, phosphorus and constitutes the most important source of bioavailable calcium in our diet (ICAR, 1981). Milk and dairy products are part of a healthy diet. The composition of the milk of various animal species differs, but in every case it has a high priority in human nutrition. More than 5% of the world's milk comes from buffaloes. Over 95% of the world buffalo milk is produced in Asia (Charan, 1994). Buffalo milk is used in much the same way as cow's milk. It is high in fat and total solids, which gives it a rich flavor. Many people prefer it than cow's milk. In Egypt, for example, the severe mortality rate among buffalo calves is due in part to the sale of buffalo milk, which is in high demand, thus depriving calves of proper nourishment. The buffaloes of Egypt are used mainly for milk production. Buffalo milk is pure white because it contains no carotene since buffalo have already processed the carotene into vitamin A. Buffalo milk is also very thick. The value of goat milk in human nutrition has so far received very little 116
Transcript of Comparison Of Chemical And Mineral Content Of …egyptianjournal.xyz/21_10.pdfComparison Of Chemical...
The Egyptian Journal of Hospital Medicine Vol., 21: 116 – 130 December 2005 I.S.S.N: 12084
1687 – 2002
Comparison Of Chemical And Mineral Content Of Milk From
Human, Cow, Buffalo, Camel And Goat In Egypt.
Ghada Z A Soliman Lecturer of Biochemistry, Biochemistry Department, National Nutrition Institute, Cairo
Abstract Milk is an important food; it is considered as a good source of Ca. Comparison studies of
chemical and mineral contents of milk from human, cow, buffalo, camel and goat in Egypt are
rare, so we determine chemical and mineral composition cows; camels; buffalo and goats milk
in Egypt and to compare with the human milk since such comparisons are rare in Egypt. There are several studies dealing with the chemical composition of milk, but they are foreign, non-
Egyptian. It is known that changing of environment has a significant effect on natural
physiological function of both human and animals, so it was very important to made such study on Egyptian environment (ecology), hoping to give understanding and explain some of the
malnutrition problems in Egypt. Three hundred and two milk samples were obtained at random
from: cows; camels; buffalo and goats (n: 44, 108, 40, 40 respectively), while human milk was obtained from healthy lactating women (n: 70, after 3
rd month of lactation). Chemical
constituents as protein, fat, carbohydrates, moisture, ash and lactose were determined. Mineral
contents as calcium (Ca), iron (Fe), Zinc (Zn), sodium (Na), potassium (K), magnesium (Mg),
copper (Cu), phosphorous (P) and manganese (Mn) were measured in the ash. Human milk contains the lowest protein and ash content. Buffalo milk has the highest fat and total solids
content. It gives the higher yield of energy. Human milk contains the highest carbohydrates and
lactose content (4.98 gm% carbohydrates, of which 4.70 are lactose, i.e. it represent 94.46 %). Human milk contains the lowest concentration of Ca, P, Fe, Zn, Na, K and Mg. Ca: P ratio of
human milk is higher (2.32 vs 1.18-1.47) than other species. Mn content of human milk is
higher (human milk contains ≈ 6.5 times camel and cow milk and 24.14 times as goat milk). Buffalo milk has the highest Ca, P and Mg content. Camel milk has the highest Fe, Zn, Na and
Cu content. Goat milk has the highest K content. Chemical and mineral content of the 5 studied
species varied widely. Camel, buffalo, cow and goat milk cannot replace human milk but it may
complement it.
Key words: goat, cow, human, camel, buffalo, mineral composition, chemical composition.
Introduction Milk is an excellent source of most
essential minerals for human. It contains
mostly calcium, phosphorus and constitutes
the most important source of bioavailable calcium in our diet (ICAR, 1981). Milk and
dairy products are part of a healthy diet.
The composition of the milk of various animal species differs, but in every case it
has a high priority in human nutrition.
More than 5% of the world's milk comes from buffaloes. Over 95% of the
world buffalo milk is produced in Asia
(Charan, 1994). Buffalo milk is used in
much the same way as cow's milk. It is high
in fat and total solids, which gives it a rich
flavor. Many people prefer it than cow's
milk. In Egypt, for example, the severe
mortality rate among buffalo calves is due in part to the sale of buffalo milk, which is
in high demand, thus depriving calves of
proper nourishment. The buffaloes of Egypt are used mainly for milk production.
Buffalo milk is pure white because it
contains no carotene since buffalo have already processed the carotene into vitamin
A. Buffalo milk is also very thick.
The value of goat milk in human
nutrition has so far received very little
116

Ghada Z A Soliman
117
factual and academic attention (Haenlein
1992; Park, 1991) despite its medical need
for some people especially infants afflicted with various ailments, including cow milk
protein sensitivities (Lothe et al., 1982 and
Host et al., 1988). Goat milk proteins and
fats have many significant differences in their compositions from the milk of other
mammalian species, especially in relative
proportions of the various milk proteins and fats and in their genetic polymorphisms
(Ambrosoli et al., 1988). Goat milk have
shorter rennet coagulation time, less
resistance to heat treatment, curd firmness is weaker and cheese yields are less which
might explain significant differences to cow
and other milk in digestion by infants and patients which traditionally have been
explained by the "homogenized" nature of
goat milk fat (Haenlein 1992; Park, 1991). Human milk is believed to provide all the
nutrients and essential minerals and trace
elements (micronutrients) that are required
by the normal term infant growth, until weaning. With a few exceptions, excessive
micronutrient supplies to the mother, or a
moderate deficiency in her diet, do not greatly alter the supply to the infant. Thus,
the infant is well protected by maternal
homeostatic processes (Bates and Prentice., 1994). There is a wide variation in the
reported data on the concentrations of trace
elements in human milk from different
countries. The composition of human milk varies over the course of lactation and in
each individual. Human milk is markedly
different from cows' milk, both in terms of macronutrients and micronutrients.
It is noteworthy that milk of each
species has a particular individual pattern of
minerals, which may be a pointer ofrelative nutritional importance of the element.
The aimof this work was to investigate and
compare the mineral composition of human, cow, buffalo, camel and goat milk
in Egypt since such comparisons are rare in
Egypt. There are several studies dealing with the chemical composition of milk, but
they are foreign, non- Egyptian . It is
known that changing of environment has a
significant effect on antural physiological function of both human and animals, so it
was very important to made such study on
Egyptian environment (ecology), hoping to
give understanding and explain some of the
malnutrition problems in Egypt.
Materials And Methods Sampling
Milk samples were obtained from:
cows; camels; buffalo and goats (n: 44, 108,
40, 40 respectively), while human milk was obtained from healthy lactating women (n:
70, after 3 rd
month of lactation to get
mature milk). Milk samples were collected and stored in ice tank until reaching the
laboratory, then frozen at 4 oC if to be
analyzed in 2-3 days or at 20oC if to be
analyzed in few days if not analyzed immediately. Interestingly, camels' milk did
not sour at 4ºC for up to 2 months as the
remaining milk, which agree with Yagil et al. (1984).
Chemical Analysis Chemical constituents as protein, fat,
carbohydrates, moisture, ash and lactose
were determined according to AOAC
(1990). Mineral contents as calcium (Ca), iron (Fe), Zinc (Zn), sodium (Na),
potassium (K), magnesium (Mg), copper
(Cu) and manganese (Mn) were measured in the ash using atomic absorption, Unicam
929 (AOAC, 1981). Phosphorous (P) was
estimated colorimetrically in the ash according to (AOAC, 1981) and Ca/P was
calculated.
All data collected were subjected to a
completely randomized design model and covariance analysis (Steel and Torrie 1969).
Results
Tables (1-3) showed the chemical
composition of camels', human's, goat’s, buffalo’s and cows' milk, and the signif-
icant differences between and among them.
Human milk contained (g/100 g): 1.11 protein; 4.17 fat; 0.21 ash; 86.47 water;
13.53 total solids; 8.04 carbohydrates, of
which 7.12 are lactose (88.57%).Human milk contain significantly less protein
content than the remaining camel, goat,
cow and buffalo milk where they have a
somewhat similar content (1.11 vs 3.27,

Comparison Of Chemical And Mineral Content………
118
4.02, 3.48 and 3.32 g% respectively).
Content of human milk fat is close to goat,
cow and camel (4.17 vs 4.04-4.2). Content of human milk total solids is significantly
higher than goat and camel and comparable
with cow milk (13.53 vs 12.62-12.95, S; vs
13.3, NS, respectively). Human milk contains significantly higher carbohydrates
and lactose content than goat, camel, cow
and buffalo (8.04 vs 4.44-5.33, +61.47 % —+81.17 %; 7.12 vs 4.27—5.02, +51.4 —
+ 66.75 % respectively). Human milk gives
significantly higher calories (74.13 Kcal)
than camel, cow and goat milk (+4.32—+10.05 %) and significantly lower calories
than buffalo milk (-29.47 %), tables (2-3).
Buffalo milk contained (g/100 g): 4.02 protein; 7.52 fat; 0.80 ash; 82.33
water; 17.65 total solids; 5.33 carbohyd-
rates, of which 5.02 are lactose (94.32 %). Buffalo milk contained less water, more
total solids, more fat (7.52±0.07 vs
4.14±0.09, +81.0%), more lactose, and
more protein than cow's milk. Goat milk contained (g/100 g): 3.32
protein; 4.04 fat; 0.83 ash; 87.38 water;
12.62 total solids; 4.44 carbohydrates, of which 4.27 are lactose (96.26 %). The main
component of goat milk as protein, total
solids, carbohydrate and lactose differs from cow milk. It has significantly lower
content while fat content is somewhat
similar.
Camel milk contained (g/100 g): 3.27 protein; 4.20 fat; 0.75 ash; 87.05 water;
12.95 total solids; 4.67 carbohydrates, of
which 4.31 are lactose (92.37 %). Camel milk is significantly different from buffalo
and human milk. Camel milk has highly
significant protein and mineral content than
human milk but lower than buffalo milk. It has a similar fat content as human but
significantly lower than buffalo milk.
Camel milk resembles goat milk than cow milk. It has a comparable content of fat,
moisture, total solids and carbohydrate with
cow and goat milk. Camel milk has similar protein and lactose content as goat milk but
significantly lower protein and lactose than
cow milk.
Cow milk contained (g/100 g): 3.48 protein; 4.14 fat; 0.71 ash; 86.70 water;
13.30 total solids; 4.98 carbohydrates, of
which 4.70 are lactose (94.46 %). Cow milk
is significantly different from buffalo, goat,
camel and human milk. Cow milk has highly significant protein content than
human, camel and goat milk but lower than
buffalo milk. Cow milk has significantly
lower fat content than buffalo but similar to the other milks. It also has significantly
lower ash content than the remaining milk
except human milk where it has significantly higher ash content (table 2-3).
In general, human milk contained the
lowest protein content while buffalo milk
contained the highest content (1.11±0.04 vs 4.02±0.05). Goat milk contained the lowest
fat content while buffalo milk contained the
highest content (4.04±0.05 vs 7.52±0.07). Buffalo milk contained the lowest water
content while goat milk contained the
highest content (82.33±0.10 vs 87.38±0.06). Goat milk contained the
lowest total solids content and lowest total
energy while buffalo milk contained the
highest content of them (12.62±0.06 vs 17.65±0.10; 67.36±0.84 vs 105.11±1.21
respectively). Human milk contained the
highest lactose content (7.12±0.07) where it comprises 96.26 % of the total
carbohydrate.
Table (4) showed the different contribution of camel, buffalo, cow, goat
and human milk intake with the recom-
mended human daily dietary allowances,
RDA, 2002. A cup (250 gm) of human milk provides infants ≤1y with ≈25.0-30.0 % of
their RDA of protein vs 89.82-110.37 % of
other milks; ≈21.0-33 % of their RDA of carbohydrate vs 12-22 % of other milks;
and ≈34.0% of their RDA (or DRI) of fat vs
33-63% of other milks. It agrees with
Whitehead (1995). Camels', women's, goat’s, buffalo’s
and cows' milk were kept freezed if it is not
analyzed immediately and needs to be kept for a few days.
Tables (6-8) show elements content
(mg/100g) of Egyptian human, cow, buffalo, camel and goat milk and the
significant differences between and among
them were shown. The data of the table 1
indicate that cow, buffalo, camel and goat milk contain 3.41-3.99 times as human milk
which did not agree with ICAR (1981).
Ghada Z A Soliman
119
ICAR (1981) had reported that goat milk
had 7-10 times minerals as human and cow
milk. In this study cow, buffalo, camel and goat milk had highest mineral contents
compared to that of human milk with
significant differences between them.
Calcium (Ca): Data of table (6) shows calcium content of camel, buffalo, cow,
goat and human. In this study buffalo then
goat milk provide a great amount of calcium.
Phosphorous: Data of table (6) shows
phosphorous content of camel, buffalo,
cow, goat and human. Human milk had significantly lower content while camel had
significantly higher levels. Buffalo and goat
had somewhat comparable levels. The Calcium: Phosphorus ratio (Ca: P): A
significant difference was found among all
tested milk types especially against human milk where a significant decrease was
found (from -36.59%, buffalo, to -48.95%,
goat, tables 2-3).
Iron (Fe): Data of table (6) shows iron content of camel, buffalo, cow, goat and
human. There is a significant difference
(decrease) between: camel, buffalo milk with cow, goat and human milk. There is a
significant increase between camel and
buffalo milk. There is no significant difference in the iron content of cow and
goat or cow with human milk; or goat and
human milk. Camel had the highest iron
concentration then buffalo. While cow, goat and human have a comparable
concentration.
Zinc (Zn): Data of table (6) shows Zinc content of camel, buffalo, cow, goat
and human. Human milk had significantly
lower content while camel had significantly
higher levels. Cow and goat had somewhat comparable levels.
Sodium (Na): Data of table (6) shows
sodium content of camel, buffalo, cow, goat
and human. Camel milk had significantly higher Na content while human had the
lowest content. Buffalo, cow and goat milk
had non significantly comparable levels of Na.
Potassium (K): Data of table (6)
shows potassium content of camel, buffalo,
cow, goat and human was. The Potassium content of goat milk was significantly
higher than the remaining milk, while
human milk contained significantly lower content.
Magnesium (Mg): Data of table (6)
shows magnesium content of camel, buffalo, cow, goat and human was. The
Magnesium content of buffalo milk was
significantly higher than the remaining
milk. The magnesium content of cow and goat milk was similar.
Copper (Cu): Data of table (6) show
copper content of camel, buffalo, cow, goat and human. The Copper content of camel
milk was significantly higher than the
remaining milk. The copper content of buffalo and goat milk was similar.
Manganese (Mn): Data of table (6)
shows copper content of camel, buffalo,
cow, goat and human. Human milk contained the highest significant content of
Mn, while cow milk contained the lowest
content. Camel milk content is comparable with goat milk (no significant difference).
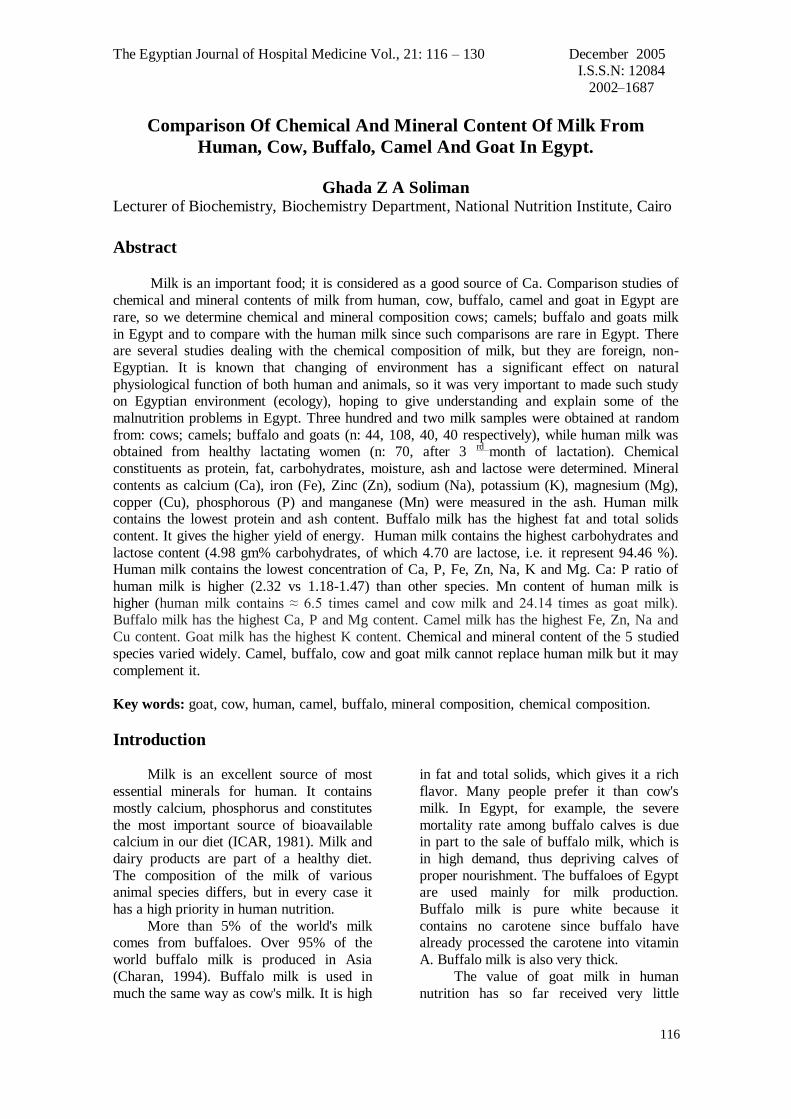
Table (1): Chemical composition of Egyptian human, cow, buffalo, camel and goat milk
(g/100g). Results are expressed as Mean±SE
Protein Fat Ash Moisture Total Solids
Carbo-
hydrate
Total
Energy Lactose %Lactose
1- Camel 3.27±0.06 4.2±0.11 0.75±0.01 87.05±0.13 12.95±0.13 4.67±0.10 70.09±0.91 4.31±0.10 92.37±0.53
2- Buffalo 4.02±0.05 7.52±0.07 0.80±0.00 82.33±0.10 17.65±0.10 5.33±0.05 105.11±1.21 5.02±0.03 94.32±0.32
3- Cow 3.48±0.03 4.14±0.09 0.71±0.00 86.70±0.13 13.30±0.13 4.98±0.02 71.06±1.05 4.70±0.02 94.46±0.23
4- Goat 3.32±0.03 4.04±0.05 0.83±0.00 87.38±0.06 12.62±0.06 4.44±0.02 67.36±0.84 4.27±0.02 96.26±0.13
5- Human 1.11±0.04 4.17±0.06 0.21±0.003 86.47±0.08 13.53±0.08 8.04±0.06 74.13±0.57 7.12±0.07 88.57±0.54
Comparison Of Chemical And Mineral Content………
120
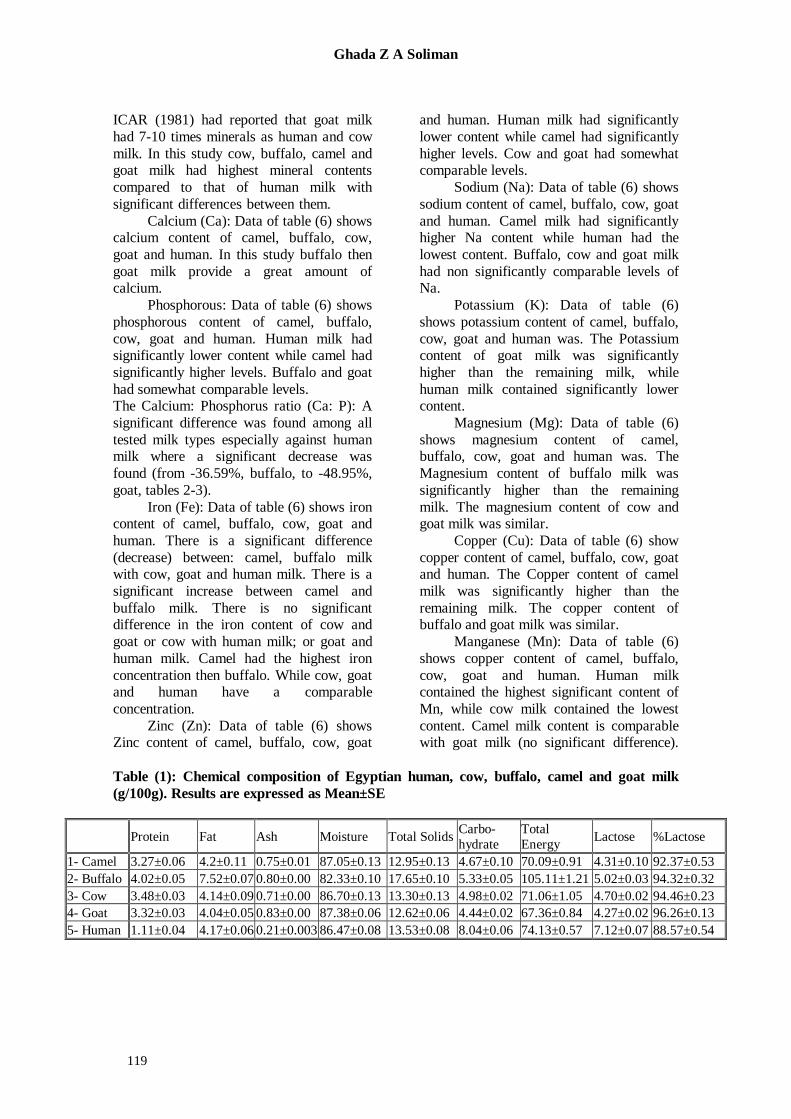
Table (2): Significant differences of chemical contents of milk between different species
Protein Fat Ash Moisture Total
Solids
Carbo-
hydrate
Total
Energy Lactose
%
Lactose
Camel vs Buffalo 0.0001 0.0001 0.0002 0.0001 0.0001 0.0005 0.0001 0.0002 0.04
Camel vs Cow 0.03 NS 0.001 NS NS NS NS 0.02 0.02
Camel vs Goat NS NS 0.001 NS NS NS NS NS 0.0001
Camel vs Human 0.0001 NS 0.0001 0.001 0.001 0.0001 0.001 0.0001 0.0001
Buffalo vs Cow 0.0001 0.0001 0.0001 0.0001 0.0001 0.0004 0.0001 0.0001 NS
Buffalo vs Goat 0.0001 0.0001 0.0001 0.0001 0.0001 0.0001 0.0001 0.0001 0.002
Buffalo vs Human 0.0001 0.0001 0.0001 0.0001 0.0001 0.0001 0.0001 0.0001 0.0001
Cow vs Goat 0.046 NS 0.0001 0.006 0.006 0.001 0.04 0.0001 0.0002
Cow vs Human 0.0001 NS 0.0001 NS NS 0.0001 0.03 0.0001 0.0001
Goat vs Human 0.0001 NS 0.0001 0.0001 0.0001 0.0001 0.0001 0.0001 0.0001
Table (3): % change of chemical contents of milk between and among different species.
Protein Fat Ash Moisture Total
Solids
Carbo-
hydrate
Total
Energy Lactose
%
Lactose
Camel
Buffalo vs Camel 22.87* 76.57* 5.71* -5.42* 36.46* 14.31* 49.97* 16.44* 2.11*
Cow vs Camel 6.38* -2.89 -5.89* -0.41 2.72 6.67 1.39 9.03* 2.27*
Goat vs Camel 1.66 -5.28 10.10* 0.37 -2.51 -4.93 -3.89 -1.01 4.21*
Human vs Camel -65.99* -2.11 -72.38* -0.67* 4.47* 72.24* 5.77* 65.08* -4.11*
Buffalo
Camel vs Buffalo -18.62* -43.36* -5.40* 5.73* -26.72* -12.51* -33.32* -14.12* -2.07*
Cow vs Buffalo -13.42* -45.00* -10.98* 5.31* -24.72* -6.68* -32.39* -6.37* 0.15
Goat vs Buffalo -17.26* -46.35* 4.15* 6.13* -28.55* -16.83* -35.91* -14.98* 2.06*
Human vs Buffalo -72.32* -44.56* -73.88* 5.03* -23.44* 50.69* -29.47* 41.77* -6.10*
Cow
Camel vs Cow -6.00* 2.98 6.26* 0.41 -2.65 -6.25 -1.37 -8.28* -2.22*
Buffalo vs Cow 15.51* 81.82* 12.33* -5.04* 32.84* 7.16* 47.92* 6.80* -0.15
Goat vs Cow -4.43* -2.46 16.99* 0.78* -5.09* -10.87* -5.20* -9.20* 1.90*
Human vs Cow -68.03* 0.80 -70.65* -0.26 1.71 61.47* 4.32* 51.41* -6.24*
Goat
Camel vs Goat -1.64 5.57 -9.17* -0.37 2.57 5.18 4.05 1.01 -4.04*
Buffalo vs Goat 20.86* 86.41* -3.99* -5.77* 39.96* 20.23* 56.04* 17.62* -2.02*
Cow vs Goat 4.64* 2.52 -14.53* -0.77* 5.36* 12.20* 5.49* 10.13* -1.87*
Human vs Goat -66.55* 3.34 -74.92* -1.03* 7.16* 81.17* 10.05* 66.75* -7.99*
Human
Camel vs Human 194.03* 2.16 262.10* 0.67* -4.28* -41.94* -5.45* -39.42* 4.29*
Buffalo vs Human 261.29* 80.38* 282.79* -4.79* 30.61* -33.64* 41.79* -29.46* 6.49*
Cow vs Human 212.79* -0.79 240.77* 0.26 -1.68 -38.07* -4.14* -33.95* 6.65*
Goat vs Human 198.92* -3.23 298.68* 1.05* -6.68* -44.80* -9.13* -40.03* 8.68*
*: Significant change (P<0.001-P<0.0001)

Ghada Z A Soliman
121
Table (4): % contribution of camel, buffalo, cow, goat and human milk
intake with the recommended human daily dietary allowances, RDA (2002)
Protein Fat Carbo-
hydrate Protein Fat
Carbo-
hydrate Protein
Carbo-
hydrate Protein
Carbo-
hydrate
Children Adult
0-6m 7-12m Male Female
Camel 89.82 34.36 19.44 74.31 35.50 12.28 14.60 8.97 17.77 8.97
Buffalo 110.37 60.67 22.23 91.31 62.69 14.04 17.94 10.26 21.83 10.26
Cow 95.55 33.37 20.74 79.05 34.48 13.10 15.53 9.57 18.90 9.57
Goat 91.32 32.54 18.49 75.55 33.63 11.68 14.84 8.53 18.07 8.53
Human 30.55 33.63 33.49 25.27 34.75 21.15 -- -- -- --
Note: This figures is per serving cup (=250 gm)
Table (5): Comparison of chemical milk constituents with other reported contents.
Protein Fat Ash Moisture
Total
Solids
Carbo-
hydrate
Total
Energy Lactose
%
Lactose
Camel * 3.27 4.26 0.75 87.05 12.95 4.67 70.1 4.31 92.37 1 3.5 3.8 0.8 87.9 12.1 4 64.2 3.9 97.5 2 4.5 5.5 0.9 85.6 14.4 3.5 81.5 3.4 97.14
Buffalo * 4.02 7.52 0.8 82.33 17.65 5.33 105.11 5.02 94.32 3 3.8 7.4 0.8 83.17 16.83 4.83 101.12 4.8 99.38 4 4.16 7.96 0.78 82.09 17.91 5.01 108.32 4.86 97.006
Cow * 3.48 4.14 0.71 86.7 13.3 4.98 71.06 4.7 94.46 5 3.4 3.5 0.7 87.8 12.2 4.6 63.5 4 3.58 4.14 0.71 86.43 13.57 5.14 72.14 4.96 96.5
Goat * 3.32 4.04 0.83 87.38 12.62 4.44 67.36 4.27 96.26 6 & 7 3.56 4.14 0.82 87.03 12.97 4.45 69.3
Human * 1.11 4.17 0.21 86.47 13.53 8.04 74.13 7.12 88.57 8 1.1 4.5 0.2 87.1 12.9 7.1 73.3 6.8 95.77 5 0.9 3.2 0.21 88.29 11.71 7.4 63
* Present study, 1 El-Bahay, 1962,
2 Knoess, 1976 and1977;
3 Wong et al. 1988;
4 Byron et al.
2005; 5 Renner, 1983, 1989;
6 Posati and Orr, 1976;
7 Alichanidis and Polychroniadou, 1996;
8
Fomon, 1974, 1993.
Table (6): Mineral composition of Egyptian human, cow, buffalo, camel and goat milk
(mg/ 100g). Results are expressed as Mean±SE
Ca P Ca/P Fe Zn Na K Mg Cu Mn
I-Camel Mean± 111.36± 81.17± 1.37± 0.23± 0.51± 57.84± 156.32± 6.70± 0.061± 0.013±
SE 4.36 3.08 0.01 0.01 0.015 1.22 2.85 0.14 0.0023 0.0006
II-Buffalo Mean± 163.19± 111.36± 1.47± 0.135± 0.24± 51.61± 167.18± 29.56± 0.04± 0.01833±
SE 4.56 2.61 0.04 0.007 0.008 0.66 3.16 0.79 0.0025 0.00034
III-Cow Mean± 119.90± 95.03± 1.26± 0.07± 0.38± 49.67± 147.02± 13.42± 0.017± 0.0037±
SE 0.69 0.72 0.01 0.02 0.00 0.70 1.55 0.24 0.0016 0.0001
IV-Goat Mean± 130.28± 110.16± 1.18± 0.06± 0.32± 50.33± 201.45± 13.87± 0.04± 0.0138±
SE 2.26 1.61 0.01 0.00 0.03 0.77 1.90 0.11 0.001 0.0004
V-Human Mean± 32.36± 13.97± 2.32± 0.053± 0.165± 16.03± 51.77± 3.43± 0.05± 0.09±
SE 0.70 0.24 0.034 0.004 0.02 0.31 0.69 0.12 0.004 0.01

Comparison Of Chemical And Mineral Content………
122
Table (7): Significant differences of chemical contents of milk between different species
Ca P Ca/P Fe Zn Na K Mg Cu Mn
I-Camel Vs Buffalo 0.0001 0.0001 0.003 0.0001 0.0001 0.004 0.04 0.0001 0.0001 0.0001
vs Cow NS 0.007 0.0001 0.0001 0.0001 0.0001 0.05 0.0001 0.0001 0.0001
vs Goat 0.013 0.0001 0.0001 0.0001 0.0001 0.0006 0.0001 0.0001 0.0001 NS
Vs Human 0.0001 0.0001 0.0001 0.0001 0.0001 0.0001 0.0001 0.0001 0.003 0.0001
II-Buffalo vs Cow 0.0001 0.0001 0.0001 0.008 0.0001 NS 0.0001 0.0001 0.0001 0.0001
vs Goat 0.0001 NS 0.0001 0.0001 0.006 NS 0.0001 0.0001 NS 0.0001
Vs Human 0.0001 0.0001 0.0001 0.0001 0.002 0.0001 0.0001 0.0001 0.04 0.0001
III-Cow vs Goat 0.0001 0.0001 0.0001 NS 0.03 NS 0.0001 NS 0.0001 0.0001
Vs Human 0.0001 0.0001 0.0001 NS 0.0001 0.0001 0.0001 0.0001 0.0001 0.0001
IV-Goat Vs Human 0.0001 0.0001 0.0001 NS 0.0001 0.0001 0.0001 0.0001 0.02 0.0001
Table (8): % change of chemical contents of milk between and among different species.
Ca P Ca/P Fe Zn Na K Mg Cu Mn
Camel Buffalo vs Camel 46.54* 37.20* 7.31* -40.49* -53.06* -10.78* 6.94* 341.15* -34.17* 39.25*
Cow vs Camel 7.66 17.07* -7.77* -69.78* -25.54* -14.13* -5.95* 100.36* -71.98* -71.78*
Goat vs Camel 16.99* 35.72* -13.60* -74.24* -36.97* -12.98* 28.87* 106.97* -35.67* 4.61
Human vs Camel -70.94* -82.79* 69.23* -76.68* -67.65* -72.29* -66.89* -48.80* -18.74* 582.11*
Buffalo Camel vs Buffalo -31.76* -27.11* -6.81* 68.05* 113.03* 12.08* -6.49* -77.33* 51.91* -28.18*
Cow vs Buffalo -26.53* -14.67* -14.05* -49.22* 58.63* -3.75 -12.06* -54.58* -57.44* -79.73*
Goat vs Buffalo -20.17* -1.07 -19.49* -56.70* 34.27* -2.47 20.50* -53.08* -2.28 -24.88*
Human vs Buffalo -80.17* -87.46* 57.70* -60.82* -31.09* -68.94* -69.04* -88.39* 23.45* 389.86*
Cow Camel vs Cow -7.12 -14.58* 8.42* 230.95* 34.29* 16.45* 6.33* -50.09* 256.95* 254.34*
Buffalo vs Cow 36.11* 17.19* 16.35* 96.94* -36.96* 3.90 13.71* 120.18* 134.97* 393.41*
Goat vs Cow 8.66* 15.93* -6.32* -14.73 -15.36* 1.34 37.03* 3.30 129.62* 270.66*
Human vs Cow -73.01* -85.30* 83.49* -22.84 -56.56* -67.73* -64.79* -74.44* 190.06* 2316.97*
Goat Camel vs Goat -14.52* -26.32* 15.74* 288.13* 58.66* 14.92* -22.40* -51.68* 55.45* -4.40
Buffalo vs Goat 25.26* 1.09 24.21* 130.96* -25.52* 2.53 -17.02* 113.14* 2.33 33.12*
Cow vs Goat -7.97* -13.74* 6.75* 17.28 18.15* -1.32 -27.02* -3.20 -56.45* -73.02*
Human vs Goat -75.16* -87.32* 95.88* -9.51 -48.67* -68.16* -74.30* -75.26* 26.32* 552.07*
Human Camel vs Human 244.12* 481.20* -40.91* 328.91* 209.13* 260.86* 201.98* 95.31* 23.06* -85.34*
Buffalo vs Human 404.28* 697.39* -36.59* 155.23* 45.11* 221.96* 222.95* 761.59* -18.99* -79.59*
Cow vs Human 270.49* 580.42* -45.50* 29.60 130.19* 209.88* 184.01* 291.31* -65.52* -95.86*
Goat vs Human 302.59* 688.82* -48.95* 10.51 94.84* 214.02* 289.16* 304.23* -20.84* -84.66*
*: Significant change

Ghada Z A Soliman
123
Table (9): % contribution of camel, buffalo, cow, goat and human milk
intake with the recommended human daily dietary allowances, RDA (2002)
Ca P Fe Zn Na K Mg Cu Mn
Children 0-6M
Camel 132.57 202.92 209.52 63.64 120.50 97.70 55.83 76.76 1096.98
Buffalo 194.27 278.40 124.68 29.88 107.51 104.48 246.30 50.53 1527.50
Cow 142.73 237.56 63.31 47.39 103.48 91.89 111.86 21.51 309.58
Goat 155.10 275.41 53.98 40.11 104.86 125.91 115.55 49.38 1147.50
Human 38.53 34.91 48.85 20.59 33.39 32.35 28.59 62.38 7482.55
7-12M
Camel 103.11 73.79 5.14 42.43 39.08 55.83 22.33 69.79 5.48
Buffalo 151.10 101.24 3.06 19.92 34.87 59.71 98.52 45.94 7.64
Cow 111.01 86.39 1.55 31.59 33.56 52.51 44.74 19.55 1.55
Goat 120.63 100.15 1.33 26.74 34.01 71.95 46.22 44.89 5.74
Human 29.96 12.70 1.20 13.73 10.83 18.49 11.43 56.71 37.41
Male 18-50y
Camel 27.84 28.99 7.07 11.57 9.64 8.31 3.99 17.06 1.43
Buffalo 40.80 39.77 4.21 5.43 8.60 8.89 17.59 11.23 1.99
Cow 29.97 33.94 2.14 8.62 8.28 7.82 7.99 4.78 0.40
Goat 32.57 39.34 1.82 7.29 8.39 10.72 8.25 10.97 1.50
Female 18-50y
Camel 27.84 28.99 3.14 15.91 9.64 8.31 5.23 17.06 1.83
Buffalo 40.80 39.77 1.87 7.47 8.60 8.89 23.09 11.23 2.55
Cow 29.97 33.94 0.95 11.85 8.28 7.82 10.49 4.78 0.52
Goat 32.57 39.34 0.81 10.03 8.39 10.72 10.83 10.97 1.91
Table (10): Comparison of milks’ mineral contents with other reported contents.
Ca P Ca/P Fe Zn Na K Mg Cu Mn
Camel
* 111.36 81.17 1.37 0.23 0.51 57.84 156.32 6.70 0.061 0.013 2 102.73 61.04 1.68 0.25 0.43 69.0 156.0 12.0 0.0194 3 118.16 76.85 1.54 0.13 0.49 58.09 170.37 7.44 0.0083
Buffalo
* 163.19 111.36 1.47 0.135 0.24 51.61 167.18 29.56 0.04 0.01833 4 & 5 169.0 117.0 1.44 0.12 0.22 52.0 178.0 31.0 0.046/- 0.018/-
Cow
* 119.90 95.03 1.26 0.07 0.38 49.67 147.02 13.42 0.017 0.0037 4 119.0 93.0 1.28 0.05 0.38 49.0 152.0 13.0 0.011 0.004 6 0.045 0.39 0.013 0.0022 7 0.02 0.4 0.005 0.0021 5 119.4 93.4 1.28 0.05 0.38 49 151.5 13.44 0.008 0.014
Goat
* 130.28 110.16 1.18 0.06 0.32 50.33 201.45 13.87 0.04 0.0138 8 100 90 1.11 0.12 0.5 42.0 170 13.0 0.03 - 4 & 5 & 9 134.0 111.0 1.21 0.05 0.3 50.0 204.0 14.0 0.046 0.018
Human
* 32.36 13.97 2.32 0.053 0.165 16.03 51.77 3.43 0.05 0.09 3 27.94 8.67 3.22 0.036 0.15 14.09 71.56 3.5 0.0015 4 & 5 32.0 14.0 2.29 0.03 0.17 17.0 51.0 3.0 7 0.026 0.215 0.0314 .0007 10 28.0 15.0 1.87 0.04 0.166 15.0 58.0 3.0 0.035 0.0015 11 28.0 14.0 2.0 0.036 0.24 14.0 45.0 3.0 0.035 0.004 1 Present study; 2 Sawaya et al.1984, 3 Gorban and Izzeldin, 1997; 4 Posati and Orr,
1976; 5 Miller et al. 1999; 6 Byron et al. 2005; 7 Anderson, 1992; 8 Holland et al.
1998; 9 Alichanidis and Polychroniadou, 1996; 10 Casey and Hambidge, 1983; 11 Fomon, 1993
Comparison Of Chemical And Mineral Content………
124
Discussion Results of human milk content agree
with Posati and Orr (1976) and Fomon
(1974 and 1993) except for carbohydrates and total solids. It disagrees with Renner
(1983 and 1989) except for ash.
Result of Buffalo milk content agrees
with Wong et al. (1988) except for protein, fat and carbohydrates and also agrees with
Byron et al. (2005) except for fat. It seems
thicker than cow's milk because it generally contained higher total solids than cow's
milk (+32.85%). In addition, its fat content
is usually +81.82 % higher than cow's milk.
Because of its high fat content, buffalo milk had considerably higher energy value than
cow's milk.
Result of Goat milk content agrees with Posati and Orr. (1976) and Alichanidis
and Polychroniadou. (1996). It disagree
with Haenlein et al. (1992) where they found that main components of goat milk
are similar to those of cow milk but differs
as to particular physical and chemical
properties (small size of fat globules, higher content of short and medium chain fatty
acids). A significant minority of infants
(≥8% in 1 year old infants, Host et al., 1988) are allergic to one or more of the
constituents of cow's milk so goats’ milk
could be equal or superior to cows’ milk (Jenness 1980 and Hachelaf et al., 1993).
Result of Camel milk content disagrees
with El-Bahay. (1962) and Knoess. (1976
and1977). Result of Cow milk content agrees
with Byron et al. (2005) and Renner (1983
and 1989). Human milk contained the lowest
protein content to meet infant’s
requirements and this reflects the slower
growth of the infant relative to the other species. Also, the lower protein content of
human milk lowers the milk buffering
capacity and hence the osmotic stress to the kidney. The lower osmotic stress is
important for kidney function, which has
not fully developed in newborn or younger infant. The high content of protein for other
milks may put a strain on an infant’s
immature kidney. In addition, the protein
and fat in other milks are more difficult for
an infant to digest and absorb than breast
milk (Ogbu 2003 and Slusser and Powers 1997). Fat content of human milk is the
most suitable source of energy. The average
energy requirements of the newborn are
about 100 Kcal/kg BW, while for adult ≈ 40.48 Kcal/kg BW, i.e. newborn infants
require 2-3 times as adults, which is
explained by the newborn’s high basal metabolism. Human milk is characterized
by higher carbohydrates content; usually
the disaccharide lactose, which have a low
osmotic value per unit of weight, which is relevant to the infant’s water balance.
Infants has a relatively high water
requirements because their relatively large body surface and hence a high evaporation.
Lactose decomposes in the gastro-intestinal
canal at a relatively slow rate, consequently, part of it reaches the terminal
ileum and colon unsplit and could
contribute there to the formation of the so-
called bifidus flora (Hamosh 1992 and Lawrence and Lawrence 2005). The fat
globule in goat’s milk does not cluster
together due to absence of agglutinin, which makes goat's milk easier for an infant
to digest. Also goat's milk does not contain
many of the allergens found in cows’ or other milks, and yet goat’s milk is
unsuitable for infants as it can cause
intestinal irritation and anaemia (Desjeux
1993; Bindal and Wadhwa 1993; Slusser and Powers 1997 and Lawrence and
Lawrence 2005).
Calcium is very important to human being. It is needed for tissue and bone
development and adequate calcium intake is
important for maintenance of bone health
and may reduce risk of osteoporosis. Calcium can be obtained from foods
naturally rich in calcium such as milk and
dairy foods. Milk and other dairy foods are the major source of calcium in Egypt. It
helps nerves conduct messages; muscle
contractions; blood clotting; signaling the heart muscle (WHO/FAO, 1996). Calcium
content of camel milk disagrees with
Sawaya et al. (1984) and Gorban and

Ghada Z A Soliman
125
Izzeldin (1997). Calcium content of buffalo,
cow, goat and human milk agrees with
Posati and Orr (1976), Miller et al. (1999) and Alichanidis and Polychroniadou
(1996). Calcium content of goat milk
disagrees with Holland et al. (1998).
Calcium content of human disagrees with Gorban and Izzeldin (1997); Casey and
Hambidge (1983) and Fomon (1993). They
provide: infants/ serving ≤ 6 months with 194.27, 155.1% of their RDA (DRI);
infants ≤ 1 year with 151.1, 120.63 of their
RDA (DRI) respectively, while human milk
provide infants with 38.53, 29.96 % of their RDA (DRI) respectively. Buffalo and goat
milk contain 3-4.5 times of the human milk
content. They provide adult (male or female) with 27.84-40.8 % of their RDA
(DRI).
Phosphorous is important in maintaining acid-base balance; protein and
energy metabolism; maintains structure of
cell membranes. Phosphorous works with
calcium to develop and maintain strong bones and teeth and enhances the use of
other nutrients (WHO/FAO, 1996).
Phosphorous content of camel milk disagree with Sawaya et al. (1984) and
Gorban and Izzeldin (1997). Phosphorous
content of buffalo and cow milk agrees with Posati and Orr (1976) and Miller et al.
(1999). Phosphorous content of goat milk
agrees with Posati and Orr (1976), Miller et
al. (1999) and Alichanidis and Polychroniadou (1996) and disagrees with
Holland et al. (1998). Phosphorous content
of human milk agrees with Posati and Orr (1976), Miller et al. (1999), Casey and
Hambidge (1983) and Fomon (1993) and
disagrees with Gorban and Izzeldin (1997).
Human milk contain the highest, significant Ca: P ratio, 2.32: 1. This higher ratio
prevents the development of hypocalcæmia
and secondary hyperparathyroidism in the newborn. In particular in the first months of
life, the infant may have difficulties in
phosphate excretion, which may lead to hyperphosphatæmia and ultimately to
hypocalcæmia and tetany (Fomon, 1993).
Ca: P ratio of camel milk disagrees with
Sawaya et al. (1984) and Gorban and Izzeldin (1997). Ca: P ratio of buffalo and
cow milk agrees with Posati and Orr (1976)
and Miller et al. (1999). Ca: P ratio of goat
milk agrees with Posati and Orr (1976) and
Miller et al. (1999) and Alichanidis and Polychroniadou (1996) and disagrees with
Holland et al. (1998). Ca: P ratio of human
milk agrees with Posati and Orr (1976) and
Miller et al. (1999) and disagrees with Gorban and Izzeldin (1997) and Casey and
Hambidge (1983). In this study buffalo and
goat milk provide a great amount of phosphorus. They provide: infants/ serving
≤ 6 months with 278.40, 275.41% of their
RDA (DRI); infants ≤ 1 year with 101.24,
100.15 of their RDA (DRI) respectively, while human milk provide infants with
34.91, 12.70 % of their RDA (DRI)
respectively. Buffalo and goat milk contain 7 times of human milk content. They
provide adult (male or female) with ≈ 39.5
% of their RDA (DRI). Iron is vital components of blood
hæmoglobin required for oxygen
transportation and enzyme systems and is
necessary for red blood cell formation and function, and for brain function
(WHO/FAO, 1996). Iron content of camel
milk agrees with Sawaya et al .(1984) and disagrees with Gorban and Izzeldin (1997) .
Iron content of buffalo and cow milk
disagrees with posati and Orr (1976) and Miller et al. (1999), Byron et al. (2005) and
Anderson (1992) Iron content of goat milk
disagrees with Posati and Orr (1976) and
Miller et al. (1999), Alichanidis and Polychroniadou (1996) and Holland et al.
(1998) . Iron content of human milk
disagrees with posati and Orr ( 1976) and Miller et al .( 1999). Gorban and Izzeldin
(1997) and Casey and Hambidge (1983). In
this study camel then buffalo milk provide a
great amount of iron. They provide: infants/ serving ≤ 6 months with 209.52, 124.68%
of their RDA (DRI); infants ≤ 1 year with
5.14, 3.06 of their RDA (DRI) respectively, while human milk provide infants with
48.85, 1.20 % of their RDA (DRI)
respectively. Camel and Buffalo milk contain 4-2.5 times of the human milk
content. They provide adult male with 7.07,
4.21%; adult female with 3.14, 1.87 % of
their RDA (DRI). Surprisingly milk provides infants ≤ 6 months with a lot of
Fe. Milk provide >100% of their need from

Comparison Of Chemical And Mineral Content………
126
camel, buffalo, cow and goat while human
milk provide ≈ 50%. This ratio decreases
with age where it reaches 1.33-5.14% with infants ≤ 1 year. Even more, milk provide
adult male with double (twice) as female
although the ratio is small (male: 1.82-
7.07% and female: 0.81-3.14%). Zinc is essential part of more than 200
enzymes involved in digestion, metabolism,
reproduction and wound healing (WHO/ FAO 1996). Zinc content of camel milk
disagrees with Sawaya et al. (1984) and
agrees with Gorban and Izzeldin (1997).
Zinc content of buffalo and cow milk agrees with Posati and Orr (1976) and
Miller et al. (1999), Byron et al. (2005) and
Anderson (1992). Zinc content of goat milk agrees with Posati and Orr (1976) and
Miller et al. (1999) and Alichanidis and
Polychroniadou (1996) and disagrees with Holland et al. (1998). Zinc content of
human milk agrees with Posati and Orr
(1976) and Miller et al. (1999) and Casey
and Hambidge (1983) and disagrees with Gorban and Izzeldin (1997) and Anderson
(1992). In most species, including human
being, zinc concentration falls as lactation advances (Cassey et al. 1989). This could
probably be due to depletion of maternal
zinc stored (Krebs et al. 1985). They (camel, buffalo, cow and goat milk)
provide: infants ≤ 6 months with 29.88-
63.64% of their RDA (DRI); infants ≤ 1
year with 19.92-42.43 % of their RDA (DRI), while human milk provide infants
with 20.59, 13.73 % of their RDA (DRI)
respectively. Buffalo and goat milk contain 7 times human milk content of Zn. Buffalo
and goat milk provide adult (male or
female) with ≈ 39.5 % of their RDA (DRI).
Sodium is important in maintaining water balance; maintaining acid-base
balance; muscle contraction; nerve
contraction (WHO/FAO 1996). Sodium content of camel milk disagrees with
Sawaya et al. (1984) and agrees with
Gorban and Izzeldin (1997). Sodium content of buffalo, goat and cow milk
agrees with Posati and Orr (1976), Miller et
al. (1999) and Alichanidis and
Polychroniadou (1996). Sodium content of goat milk disagree with Holland et al.
(1998). Sodium content of human milk
agrees with Posati and Orr (1976) and
Miller et al. (1999) and Casey and
Hambidge (1983) and disagrees with Gorban and Izzeldin (1997), Desjeux
(1993) and Fomon (1993). They (camel,
buffalo, cow and goat milk) provide: infants
≤ 6 months with 103.48-120.5 % of their RDA (DRI); infants ≤ 1 year with 33.56-
39.08 % of their RDA (DRI), while human
milk provide infants with 33.39, 10.83 % of their RDA (DRI) respectively. Camel,
buffalo, cow and goat milk contain 3-4
times human milk content of Na. Camel,
buffalo, cow and goat milk provide adult with ≈ 9.0 % of their RDA (DRI).
Potassium is important in nerve
conduction; maintaining water and fluid balance; maintain acid-base balance;
muscle contraction. It regulates heartbeat
(WHO/FAO, 1996). Potassium content of camel milk agrees with Sawaya et al.
(1984) and disagrees with Gorban and
Izzeldin (1997). Potassium content of
buffalo and cow milk disagrees with Posati and Orr (1976) and Miller et al. (1999).
Potassium content of goat milk agrees with
Posati and Orr (1976) and Miller et al. (1999) and Alichanidis and Polychroniadou
(1996) and disagrees with Holland et al.
(1998). Potassium content of human milk agrees with Posati and Orr (1976) and
Miller et al. (1999) and disagrees with
Gorban and Izzeldin (1997), Casey and
Hambidge (1983), and Fomon (1993). In this study goat then buffalo milk provide a
great amount of potassium. They provide:
infants ≤ 6 months with 125.91, 104.48% of their RDA (DRI); infants ≤ 1 year with
71.95, 59.71 of their RDA (DRI)
respectively, while human milk provide
infants with 32.35, 18.49 % of their RDA (DRI) respectively (table 9). Buffalo and
goat milk contain 4-3 times of the human
milk content. They provide adult (male or female) with 10.72-8.89 % of their RDA
(DRI).
Magnesium activates 100 enzymes and play role in over 300 enzyme reactions
in the body, many of which are directly
related to cardiovascular health and helps
nerves and muscles function. Manganese is important in protein metabolism; bone and
teeth formation (WHO/FAO 1996).

Ghada Z A Soliman
127
Magnesium content of camel milk disagrees
with Sawaya et al. (1984) and Gorban and
Izzeldin (1997). Magnesium content of buffalo, cow and goat milk agrees with
Posati and Orr (1976) and Miller et al.
(1999), Alichanidis and Polychroniadou
(1996) and Holland et al. (1998). Magnesium content of human milk agrees
with Gorban and Izzeldin (1997) and
disagrees with Posati and Orr (1976) and Miller et al. (1999), Casey and Hambidge
(1983), and Fomon (1993). In this study
buffalo then goat milk provide a great
amount of magnesium. They provide: infants ≤ 6 months with 246.3, 115.55% of
their RDA (DRI); infants ≤ 1 year with
98.52, 46.22 of their RDA (DRI) respectively, while human milk provide
infants with 28.59, 11.43 % of their RDA
(DRI) respectively. Buffalo, cow and goat milk contain 8.6-4 times human milk
content of Mg. They provide adult male
with 17.59,7.99, 8.25%, and adult female
with 23.09, 10.49, and 10.83% of their RDA (DRI).
Copper is important in normal red-
blood cell formation, Connective tissue formation, acts as a catalyst to store and
release iron to help form hæmoglobin.
Contributes to central nervous system function (WHO/FAO 1996). Copper
content of camel, buffalo, cow, goat and
human milk disagrees with all mentioned
reports here (2-11). In this study camel and human milk provide a great amount of
copper. They provide: infants ≤ 6 months
with 76.76, 62.38% of their RDA (DRI); infants ≤ 1 year with 69.76, 56.71% of their
RDA (DRI) respectively. Buffalo, cow and
goat milk contain 3-1.2 times human milk
content of Cu. Buffalo, cow and goat milk provide adult male or female with 10.97%.
Manganese is an essential trace
mineral that plays important roles in reproductive hormone production, urea
excretion, immunity, and joint/leg
development (WHO/FAO, 1996). Magnesium content of camel milk disagrees
with Sawaya et al. (1984) and Gorban and
Izzeldin (1997). Magnesium content of
buffalo milk agrees with Posati and Orr (1976) and Miller et al. (1999). Magnesium
content of cow agrees with Posati and Orr
(1976) and disagrees with Miller et al.
(1999). Byron et al. (2005) and Anderson
(1992). Magnesium content of goat milk disagrees with Posati and Orr (1976), Miller
et al. (1999) and Alichanidis and
Polychroniadou (1996). Magnesium content
of human milk disagrees with Gorban and Izzeldin (1997), Anderson (1992), Casey
and Hambidge (1983), and Fomon (1993).
Human milk contained ≈ 6.5 times camel and cow milk and 24.14 times as goat milk.
In this study human milk provide a great
amount of Mn. All tested milks provide:
infants ≤ 6 months with more than they need, > of their RDA (DRI); Human milk
provide infants ≤ 1 year with 37.41 of their
RDA (DRI) respectively, while remaining milk provide infants with 1.55-7.64 % of
their RDA (DRI) respectively and provide
adults (male and female with 0.4-2.55 % of their RDA (DRI).
The mineral content of human, cow
and goat disagree with Belewu and
Aiyegbusi (2002). The variation in mineral concentration of camel, buffalo, cow and
goat with other cited reports is due probably
to the breed, period of lactation and dietary content (ICAR, 1981). Age of mothers,
number of previous children, period and/or
season of lactation and dietary content and type of delivered baby (full or preterm) may
lead to the variation in mineral
concentration of human milk (Rodriguez et
al,. 2000 & 2002 and Aquilio et al. 1996). The reported levels of Zn, Cu, Fe, Mg and
Mn in human milk vary widely. The range
of reported mean values (mg/100g) for Fe is 0.02-0.073; for Cu 0.024-0.05; for Zn
0.116-0.383; for Mg 2.6-3.5 (Fransson and
Lönnerdal 1982, 1983 and Al-Awadi and
Srkumar, 2000). Our levels in this study of Fe 0.053; Cu 0.05; Zn 0.165 and Mg 3.43
lie within these ranges.
CONCLUSION
Mammals as camel, buffalos, cow,
goat and human being produce milk, but the composition of milk for each species varies
widely and other kinds of milk often vary
different from human breast milk. From the
viewpoint of human nutrition, despite goat’s milk is easier for an infant to digest
and it does not contain many of the

Comparison Of Chemical And Mineral Content………
128
allergens found in cow's milk and that other
milk may have higher mineral content than
human milk but still cannot replace human milk in young children but could
complement it.
References
1. Al-Awadi FM, Srikumar TS. (2000): Trace-element status in milk and plasma of
Kuwaiti and non-Kuwaiti lactating mothers.
Nutrition. 16: 1069-1073.
2. Alichanidis E, Polychroniadou A. (1996): Special features of dairy products from ewe
and goat milk from the physicochemical
and organoleptic point of view. In:
Proceedings, Production and Utilization of
Ewe and Goat Milk, Crete, Greece, Oct. 19-
21, 1995, International Dairy Federation Publ., Brussels, Belgium, p. 21-43.
3. Ambrosoli R, Stasio L di and Mazzocco
P. (1998): Content of alpha-s-1-casein and
coagulation properties in goat milk. J. Dairy
Sci,: 71: 24-28.
4. Anderson R R. (1992): Comparison of
Trace elements in milk of four species. J
Dairy Sci.; 75: 3050-3055.
5. Aquilio E, Spagnoli R, Seri S, Bottone G
and Spennati G. (1996): Trace element
content in human milk during lactation of preterm newborns. Biol Trace Elem Res.;
51(1): 63-70.
6. AOAC (1981): ―Official method of
analysis of the Association of Official
Analytical Chemists. Published by the
association of official analytical chemists,
Inc., Arlington, USA.
7. AOAC (1990): ―Official method of
analysis of the Association of Official
Analytical Chemists. Published by the
association of official analytical chemists, Inc., Arlington, USA.
8. Bates C J and Prentice A. (1994): Breast
milk as a source of vitamins, essential
minerals and trace elements. Pharmacol
Ther.; 62(1-2): 193-220.
9. Belewu M A and Aiyegbusi O F. (2002):
Comparison of the Mineral Content and
Apparent Biological Value of Milk from
Human, Cow and Goat. The Journal of
Food Technology in Africa, Vol. 7, Jan-
Mar, pp. 9-11.
10. Bindal M P and Wadhwa B K. (1993): Compositional differences between goat
milk fat and that of cows and buffaloes.
Small Rumin. Res. 12:79-88.
11. Byron H W, Arnold H J and John A A.
(2005). Fundamentals of dairy chemistry. 2 nd Ed. CBS, BS publishers and distributors.
12. Casey C E and Hambidge K M. (1983): Nutritional aspects of human lactation. In:
MC Neville, MR Neifert (eds.), Lactation:
physiology, nutrition and breatfeeding.
New York: Plenum, p: 203-204.
13. Charan C. (1994): Asian Buffalo
Association Congress 63, Sasaki.
14. Daves G K and Mertz W. (1986): Copper. Page 301. In: Trace elements in human and
animal nutrition. Vol. 1. 5 th ED. W. Mertz
ed. Academic Press, New York, N Y.
15. Desjeux J F. 1993. Nutritional value of
goat milk. Lait 73:573-580.
16. DRIs, Dietary Reference Intakes. (2002):
Recommended Intakes for Individuals.
Macronutrients, Elements. Food and
Nutrition Board, Institute of Medicine,
National Academies.
17. Elamin F M and Wilcox C J. (1992). Milk Composition of Majaheim Camelsi. J.
Dairy Sci. 75: 3155-3157.
18. El-Bahay G M. (1962): Normal contents
of Egyptian camel milk. Vet. Med. J,; 8: 7–
17.
19. Fomon S J. (1974): Nutritional require-
ments in relation to growth. Monatsschr
Kinderheilkd,; 122: suppl: 236-239.
20. Fomon S J. (1993): Nutrition of normal
infants. Mosby, St. Louis.
21. Fransson G-B and Lönnerdal Bo. (1982): Zinc, copper, calcium and magnesium in
human milk. J. Pediat., 101: 504-508.
22. Fransson G-B and Lönnerdal Bo (1983): Distribution of trace elements and minerals
in human and cow's milk. Pediatr Res.;
17(11): 912-915.
23. Gorban A M S and Izzeldin O M (1997):
Mineral content of camel milk and
colostrum, J. Dairy Sci. 64: 471-474.
24. Hachelaf W, Boukhrelda M,
Benbouabdellah M, Coquin P, Desjeux J
F, Boudraa G and Touhami M. (1993): Comparative digestibility of goat versus
cow's milk fats in children with digestive
malnutrition. Lait 73:593-599.
25. Haenlein G F W. (1992): Role of goat
meat and milk in human nutrition.
Proceedings Vth International Conference
on Goats, New Delhi, India, March 1-8,
ICAR Publ., New Delhi, 2 (II): 575-580.
26. Hamosh M. (1992): Human milk
composition and the function in the infant.
Seminars in Pediatric Gastroenterology and Nutrition.; 3(3): 4-8.

Ghada Z A Soliman
129
27. Holland B, Welch A A, Unwin D H, Buss
D H, Pall A A, and Southgate D A T.
(1998): McCance and Winddowson’s, The
composition of foods. 5 th
Ed., The Royal
Society of Chemistry, Ministries of
Agriculture, Fisheries and Food. MAFF.
28. Host A, Husby S and Osterballe O.
(1988). A prospective study of cow's milk
allergy in exclusively breast-fed infants.
Acta Paediatr. Scand. 77: 663-670.
29. ICAR, Indian Council for Agricultural Research. (1981): A Handbook of Animal
Husbandry. Edited by SHRI. P.J. Joseph for
the Indian Council of Agricultural
Research, New Delhi. Pg. 99.
30. Jenness R. (1980): Composition and
characteristics of goat milk: Review 1968-
1979. J. Dairy Sci. 63:1605-1630.
31. Krebs N F and Hambique K M. (1985).
The effects of dietary Zn supplement during
lactation. Amr. J. Clin. Nutrition; 41: 560-
570. 32. Knoess K H. (1976): Assignment reports
on animal production in the Middle Awash
Valley.; FAO, Rome,
33. Knoess K H. (1997): The camel as a meat
and milk animal. World Anim. Rev,; 2239-
2245.
34. Lawrence R A and Lawrence R M.
(2005): Breastfeeding, A Guide for the
Medical Profession, 6th Ed. Elsevier
Mosby, Phila.; p73-86, p105-214.
35. Lothe L, Lindberg T and Jacobson I. (1982). Cow's milk formula as a cause of
infantile colic. A double-blind study
Pediatrics, 70: 7-10.
36. Miller GD,Jarvis J K, and McBean LD.(
1999) : Handbook of Dairy foods and
Nutrition.2 ndEd. Edited by lra Wolinsky.
37. Park Y W. (1991): Relative buffering
capacity of goat milk, cow milk, soy-based
infant formulae and commercial
nonprescription antacid drugs. J. Dairy Sci.
74:3326-3333.
38. Ogbu ISI (2003) : The biochemical composition of the breast milk of Nigerian
mothers. Mary Slessor J of Medicine Vol.3
(1): 1-4.
39. Posati L P and Orr M L. (1976) : Composition of Foods. Dairy and Egg
Products. USDA-ARS. Consumer and Food
Economics Inst., Agr. Handbook,
Washington D.C; No.8-1,77-109
40. RDAs. (2002): Recommended Dietary
Allowances. Recommended Intakes for
Individuals. Macronutrients, Elements.
Food and Nutrition Board, Institute of
Medicine, National Academies
41. Renner E. (1983): Milk and dairy products
in human nutrition. Volkswirtschaftlicher
Verlag, Munich, Germany.
42. Renner E. (1989): Micronutrients in milk and milk-based products. Elsevier Applied
Science, London.
43. Rennert O M and Chan W-Y. (1984):
Metabolism of Trace Metals in Man, Vol. I.
CRC Press, p. 71.
44. Rodriguez Rodriguez EM, Sanz Alaejos
M and Diaz Romero C. (2000): Concentrations of iron, copper and zinc in
human milk and powdered infant formula.
Int J Food Sci Nutri. 51(5): 373-380.
45. Rodriguez Rodriguez EM, Sanz Alaejos
M and Diaz Romero C. (2002): Concentrations of calcium, magnesium,
sodium and potassium in human milk and
infant formulas. Arch Latinoam Nutr.,
52(4): 406-412.
46. Sawaya W N, Khalil A, Al-Shalhat A and
Al-Mohammad H. (1984): Chemical
composition and nutritional qualify of
camel milk. J. Food Sci. 49:744-74
47. Slusser W and Powers N G (1997):
Breastfeeding update 1: immunology, nutrition, and advocacy. Pediatrics in
Review.; 18(4): 111-119.
48. Steel R G D and Torrie J H. (1969):
Principles and procedures of statistics
McGraw-Hill Co. New York.
49. Whitehead R G. (1995): For how long is
exclusive breast feeding adequate to satisfy
the dietary energy needs of the average
young baby? Pediatr. Res. 37: 239–245.
50. Wong N P, Jenness R, Keeney M and
Marth E H. (1988): Fundamentals of
Dairy Chemistry. Van Nostrand Reinhold Company, New York, NY.
51. WHO/FAO report. (1996): Trace
elements in Human nutrition and health.
52. Yagil R, Saran A and Etzion Z. (1984): Camels' milk: for drinking only? Comp
Biochem Physiol A.; 78(2): 263-266.

Comparison Of Chemical And Mineral Content………
130
مقاروه بيه المحتوى الكيميائي ومحتوى المعادن في ألبان اإلوسان
،البقر،الجاموش،الجمال،الماعس في مصر
غاده زغلول عباش سليمان أىقبز–سيو مييبء حييت قس اىنييبء اىحييت اىعد اىق ىيخغذيت
اع اىيدب يدم صدز يعخبز اىيب غذاء صدرا جيددا ىينبىسدي ا اىقبرد دي أدبدرة بك دراسبث حبىدج اىيدب د اىداحم أىنييبويد ىندب حخدبه يبدبث غيدز
صزي اىعزف ا حغيز اىبيئت يؤثز حبثيزا يعبال عي اىظدبو اىببيعيدت ىيمسد
ي اىحيدا انسدب ىدذا مدب د اىد حدبه دذا اىلدع يد اىبيئدت اىصدزي .سيز عض اىف اىخفسيز ىبعض االلبزا بث اىغذاويت اىبوي يم سبزعس ا ي
3 3801 344 )عي عشداويت د أىبدب اىبقزجاىمبصجاىمبهجاىدبعش 23قد حمع عي ىب االردب اصحدحبء عدد اىشدز 00 يب ح حميع ( عي اىخاىم3 340 40
ىنييبوم مبىبزحيج اىد جاىنز يدراث ج ح حقديز اىحخ ا.اىثبىث اىزلبعت
اىزط دددتج اىزدددبد ج اى،مخدددس جثددد حقدددديز اىنبىسدددي جاىحديدددد جاىشدددل جاىصددددي ج قدد ظدز د اىخدبو ا ىدب . اىبحبسي جاىبغسي جاىحدبص جاىفسدفر ج اىميدش
حخد د انسب يحخد عيد اقدو ميد دزحي ردبد ىدب اىمدبص عيد اعيد
.اىد ج اىاد اىصيب يعب امبز قدر اىببقيثدو % 4.21)يحخ ىب انسب عي امبدز حخد د اىنز يددراث اى،مخدس
يحخ ىب انسب عي اقو حزميش اىنبىسي % (. 24.49ا يعبده 4.0اى،مخس
3 ي جاىبغسدي جسدب اىنبىسدي ج اىفسفر ج اىحديد ج اىشل ج اىصدي ج اىبحبسد (8.40– 8.81لد 3.23)اىفسفر ي ىب انسب عيي قبر بىببقم
دز 34.84ز لع ىب اىبقدز 9.6حاىم )حخ اىميش يم ىب انسب عي
لع ىب اىبعش يحخ ىدب اىمدبص عيد اعيد سدب د اىنبىسدي جاىفسدفر ج يحخ ىب اىمبه عي اعي سب اىحديد ج اىشل جاىصدي اىحدبص اىبغسي
يحخ ىب اىبعش عي اعي سب اىبحبسدي د دذا يخادت ا دخ،ف اىحخد
اىنييددبوم حخدد اىزددبد ا ددخ،ف مبيددزا يددم أىبددب اصدداع ححددج اىدراسددت ج ا ىددب .ىب انسب ىن يني اىمبصج اىمبه جاىبعش جاىبقز جال يحو حو