
Comparison of carbonate parameters and air–sea CO2 flux in ...
18
1 3 DOI 10.1007/s10872-016-0409-6 J Oceanogr (2017) 73:365–382 ORIGINAL ARTICLE Comparison of carbonate parameters and air–sea CO 2 flux in the southern Yellow Sea and East China Sea during spring and summer of 2011 Baoxiao Qu 1,2 · Jinming Song 1,2 · Huamao Yuan 1,2 · Xuegang Li 1,2 · Ning Li 1,2 · Liqin Duan 1,2 Received: 22 June 2016 / Revised: 13 December 2016 / Accepted: 29 December 2016 / Published online: 10 January 2017 © The Oceanographic Society of Japan and Springer Japan 2017 material were responsible for the release of CO 2 in three turbidity maximum regions. Keywords Carbon dioxide · Air–sea gas exchange · Continental shelf · Southern Yellow Sea · East China Sea · Yangtze River 1 Introduction Over the past few decades, the mechanisms involved in the air–sea CO 2 exchange process in the continental shelf seas, or marginal seas, have been investigated extensively, since such seas not only play an important role in regulating the atmospheric CO 2 concentration, but may also ultimately affect processes of global climate change (Borges et al. 2005; Cai et al. 2006; Takahashi et al. 2002; Tsunogai et al. 1999). Field surveys and model results consistently demon- strate that the ocean generally acts as a net sink for atmos- pheric CO 2 , although the exact magnitude of air–sea CO 2 exchange flux in the global oceans is still a matter of debate. One study estimated that the average annual uptake of CO 2 over the global oceans was approximately −1.4 ± 0.7 Pg C (Takahashi et al. 2009). However, others believe that the efficiency of CO 2 absorption in the oceans may be over- estimated, as studies have shown that most of the organic material can be mineralized in the water column and/or sed- iments, and large areas of the continental shelf seas show no evidence of the accumulation of organic carbon under present conditions (de Haas et al. 2002). Indeed, the absorp- tion and preservation of atmospheric CO 2 by the continental shelf requires favorable hydrological and sedimentological conditions. Therefore, questions regarding the ultimate CO 2 absorption capacity in the continental shelf seas are far from resolved, and hence further study is needed. Abstract In this work, we examined the carbonate param- eters, i.e. total alkalinity (TA), pH, and partial pressure of CO 2 (pCO 2 ), and the air–sea CO 2 flux (FCO 2 ) in the con- tinental shelves of the southern Yellow Sea (SYS) and East China Sea (ECS), based on two field surveys conducted in April and August of 2011. Surface pCO 2 showed signifi- cant spatial variations, ranging from 246 to 686 µatm in spring (average ± standard deviation = 379 ± 95 µatm) and from 178 to 680 µatm in summer (384 ± 114 µatm). During the spring cruise, the central SYS (pCO 2 < 240 µatm) and the Changjiang estuary (pCO 2 < 300 µatm) were under-saturated with CO 2 , while the southern SYS and the southwestern ECS were supersaturated (pCO 2 = 420–680 µatm). In summer, however, the CO 2 -supersaturated waters (pCO 2 = 380–680 µatm) occupied a relatively wide area, including the nearshore of the SYS and the Changjiang estuary, whereas pCO 2 -deficient water (pCO 2 = 220–380 µatm) was observed only at the offshore ECS. In general, the entire SYS and ECS area behaved as a sustained CO 2 sink, with average FCO 2 of −3.9 and −2.1 mmol m −2 d −1 in spring and summer, respectively. Phytoplankton produc- tion was the driving force for CO 2 absorption, especially during the spring cruise. In addition, we found that typi- cal water mixing processes and decomposition of terrestrial * Jinming Song [email protected] * Huamao Yuan [email protected] 1 Institute of Oceanology, Chinese Academy of Sciences, Qingdao, China 2 Qingdao National Laboratory for Marine Science and Technology, Qingdao, China
Transcript of Comparison of carbonate parameters and air–sea CO2 flux in ...

1 3
DOI 10.1007/s10872-016-0409-6J Oceanogr (2017) 73:365–382
ORIGINAL ARTICLE
Comparison of carbonate parameters and air–sea CO2 flux in the southern Yellow Sea and East China Sea during spring and summer of 2011
Baoxiao Qu1,2 · Jinming Song1,2 · Huamao Yuan1,2 · Xuegang Li1,2 · Ning Li1,2 · Liqin Duan1,2
Received: 22 June 2016 / Revised: 13 December 2016 / Accepted: 29 December 2016 / Published online: 10 January 2017 © The Oceanographic Society of Japan and Springer Japan 2017
material were responsible for the release of CO2 in three turbidity maximum regions.
Keywords Carbon dioxide · Air–sea gas exchange · Continental shelf · Southern Yellow Sea · East China Sea · Yangtze River
1 Introduction
Over the past few decades, the mechanisms involved in the air–sea CO2 exchange process in the continental shelf seas, or marginal seas, have been investigated extensively, since such seas not only play an important role in regulating the atmospheric CO2 concentration, but may also ultimately affect processes of global climate change (Borges et al. 2005; Cai et al. 2006; Takahashi et al. 2002; Tsunogai et al. 1999). Field surveys and model results consistently demon-strate that the ocean generally acts as a net sink for atmos-pheric CO2, although the exact magnitude of air–sea CO2 exchange flux in the global oceans is still a matter of debate. One study estimated that the average annual uptake of CO2 over the global oceans was approximately −1.4 ± 0.7 Pg C (Takahashi et al. 2009). However, others believe that the efficiency of CO2 absorption in the oceans may be over-estimated, as studies have shown that most of the organic material can be mineralized in the water column and/or sed-iments, and large areas of the continental shelf seas show no evidence of the accumulation of organic carbon under present conditions (de Haas et al. 2002). Indeed, the absorp-tion and preservation of atmospheric CO2 by the continental shelf requires favorable hydrological and sedimentological conditions. Therefore, questions regarding the ultimate CO2 absorption capacity in the continental shelf seas are far from resolved, and hence further study is needed.
Abstract In this work, we examined the carbonate param-eters, i.e. total alkalinity (TA), pH, and partial pressure of CO2 (pCO2), and the air–sea CO2 flux (FCO2) in the con-tinental shelves of the southern Yellow Sea (SYS) and East China Sea (ECS), based on two field surveys conducted in April and August of 2011. Surface pCO2 showed signifi-cant spatial variations, ranging from 246 to 686 µatm in spring (average ± standard deviation = 379 ± 95 µatm) and from 178 to 680 µatm in summer (384 ± 114 µatm). During the spring cruise, the central SYS (pCO2 < 240 µatm) and the Changjiang estuary (pCO2 < 300 µatm) were under-saturated with CO2, while the southern SYS and the southwestern ECS were supersaturated (pCO2 = 420–680 µatm). In summer, however, the CO2-supersaturated waters (pCO2 = 380–680 µatm) occupied a relatively wide area, including the nearshore of the SYS and the Changjiang estuary, whereas pCO2-deficient water (pCO2 = 220–380 µatm) was observed only at the offshore ECS. In general, the entire SYS and ECS area behaved as a sustained CO2 sink, with average FCO2 of −3.9 and −2.1 mmol m−2 d−1 in spring and summer, respectively. Phytoplankton produc-tion was the driving force for CO2 absorption, especially during the spring cruise. In addition, we found that typi-cal water mixing processes and decomposition of terrestrial
* Jinming Song [email protected]
* Huamao Yuan [email protected]
1 Institute of Oceanology, Chinese Academy of Sciences, Qingdao, China
2 Qingdao National Laboratory for Marine Science and Technology, Qingdao, China

366 B. Qu et al.
1 3
Oceanic carbon cycles in the continental shelf seas are controlled not only by multitudinous biogeochemical pro-cesses, but also by increasing anthropogenic activities such as land reclamation, coastal aquaculture, and industrial pollution (Borges et al. 2005; Chen et al. 2013). Based on differences in hydrological and biogeochemical driving forces, the continental shelf seas can be classified into two groups: river-dominated ocean margins (RiOMars; McKee et al. 2004) and ocean-dominated margins (OceMars; Dai et al. 2013). As the name suggests, the RiOMars receive massive freshwater discharge, biogenic nutrient input, and organic matter from terrigenous sources, and commonly serve as significant CO2 sinks, mainly due to the high bio-logical production and accompanying consumption of dis-solved inorganic carbon (DIC). In contrast, the OceMars are more affected by open seas through horizontal intru-sion of water masses, vertical water mixing, and upwelling (Dai et al. 2013). Consequently, the carbonate properties of OceMars tend to be determined largely by the characteris-tics of extraneous water masses and the relative magnitude between the production and consumption of DIC in their euphotic zones.
The southern Yellow Sea (SYS) and the East China Sea (ECS) are two of the world’s most well-known continental shelf seas. On a global scale, they are under the combined influence of the largest continent, Eurasia, and an impor-tant current system, the Kuroshio Current (Chen and Wang 1999; Chen 1996). On a basin scale, however, the oceanic carbonate characteristics of the SYS and ECS are vastly different, and the two seas have typically been studied sep-arately. In general, studies of the oceanic carbonate dynam-ics in the SYS are sparse, and the limited results thus far have described it as an atmospheric CO2 source (Xue et al. 2011; Zhang et al. 2010). In contrast, numerous investiga-tions have been conducted in the ECS since the 1990s, with abundant data supporting its role as a net sink for atmos-pheric CO2 (Chou et al. 2009a, b, 2011, 2013; Guo et al. 2015; Peng et al. 1999; Qu et al. 2013a; Shim et al. 2007; Tsunogai et al. 1997, 1999; Wang et al. 2000).
In recent decades, the SYS and ECS have undergone increasing anthropogenic environmental changes, which are likely to significantly influence the oceanic CO2 sys-tem. For example, large-scale green algae bloom has been reported in the SYS since the summer of 2008 (Huo et al. 2013; Liu et al. 2013), and both harmful algal blooms and hypoxia are frequently observed in the nearshore ECS as a result of eutrophication (Chai et al. 2006; Wang 2006; Zhu et al. 2011). Furthermore, profound changes have been reported in the discharge of freshwater and suspended par-ticulate matter (SPM) into the sea as a result of reservoir construction in the Changjiang basin (Chen et al. 2001; Dai et al. 2010; Gao and Wang 2008; Qiu and Zhu 2013). Synthesis research and model estimation have proven that
human-driven environmental changes in the coastal and continental shelf seas are closely related to the variation in oceanic CO2 dynamics (Gypens et al. 2009). To date, how-ever, the exact changes in oceanic CO2 dynamics in the SYS and ECS have only been predicted in theory and have not been thoroughly investigated (Tseng et al. 2011).
In order to explore the integral CO2 budget of the SYS and ECS, the carbonate parameters and air–sea CO2 fluxes were investigated in spring and summer based on two field surveys conducted in 2011. The objective of this study was to compare and contrast the oceanic CO2 dynamics between the SYS and the ECS so as to identify the essential differences in carbonate properties and controlling factors between these two continental shelves. This paper provides updated information on the air–sea CO2 flux in order to promote a greater understanding of the carbon cycle in the SYS and ECS, and also presents a valid attempt to compare discrepancies in carbonate parameters between different shelf seas.
2 Study sites and analytical methods
2.1 Study site and sampling stations
The SYS and ECS are two continental shelf seas located in the Northwest Pacific Ocean between 26–37° N and 109–125° E. A line running northeastward from the Qidong cape to Cheju Island divides the SYS and ECS. The two seas share many characteristics, both hydrological and geo-logical. First, the SYS and ECS are both shallow marginal seas. The average depth of the SYS is only 44 m, and it is surrounded by mainland China and the Korea Peninsula. The ECS is located to the south of the SYS and is bounded by the Ryukyu Islands, the island of Taiwan, and main-land China. More than 70% of the ECS is shallower than 200 m (Song, 2011). Second, the SYS and ECS are both influenced by the East Asian monsoon, which brings sub-stantial heat and precipitation to the shelf region in sum-mer. The biogeochemical conditions of these two marginal seas are also influenced by the Changjiang (Yangtze) River, which drains into the sea at 31.0° N, 122.0° E, with annual freshwater runoff of 9.6 × 10¹¹ m3 and a sediment load of 4.8 × 10⁸ t (Yang et al. 2006; Zhang 1996). Because of an enormous influx of terrigenous material, the Changji-ang Diluted Water (CDW), formed by the mixture of the Changjiang discharge and the nearshore seawater, typically features high nutrient content and primary production.
The major difference between these two shelves is that the SYS, because of its semi-enclosed state, is affected to a greater extent by nearshore biogeochemical processes. There is no obvious material transport between the SYS and the open sea. Tidal front mixing and the Yellow Sea

367Comparison of carbonate parameters and air-sea CO2 flux in the southern Yellow Sea and East…
1 3
Cold Water (YSCW) are the most conspicuous hydrologi-cal dynamics during warm seasons in the SYS, and both originate and develop in the local SYS (Zhang et al. 2008). The ECS, on the other hand, is subject to the effects of bio-geochemical processes from both the nearshore and open sea, with each exerting an influence on this continental shelf region. For instance, the Changjiang River brings large volumes of terrigenous nutrients into the ECS, while the Kuroshio Current (KC) transports seawater to the ECS from the tropical western Pacific through upwelling in the shelf break off northeastern Taiwan.
Our two surveys were conducted in April and August of 2011 aboard the R/V Kexue 3. The survey carried out from 6 to 25 April represented the spring cruise, and the survey from 12 to 29 August represented the summer cruise. The investigation stations were evenly dispersed over the flat, shallow shelf of the SYS and ECS, with 27 and 38 stations in the SYS and ECS, respectively (Fig. 1). The investiga-tion areas in the two seas were approximately 19.1 × 10⁴ km2 and 16.0 × 10⁴ km2, respectively.
2.2 Sampling and analytical methods
The collection and analysis of seawater was performed according to methods described in our previous studies (Qu et al. 2014), which are consistent with the standard operat-ing procedures (SOP) published by Dickson et al. (2007). Generally, seawater was sampled at four to six depths, with intervals of 5–25 m, according to the bottom depth of each station, using 10-L Niskin bottles that were mounted on a rosette assembly. Temperature and salinity were measured with an SBE 911plus conductivity, temperature, and depth (CTD) system (Sea-Bird Electronics, Inc., USA).
The pH (the total hydrogen ion concentration scale) of the samples was measured immediately on board using a PHSJ-5 pH meter (INESA Scientific Instrument Co., Ltd., China) with an E-201-D combination electrode. Meas-urements were conducted at 25 ± 0.1 °C in a water bath, and the electrode was calibrated with buffers of 2-amino-2-hydroxymethyl-1,3-propanediol (Tris) and 2-aminopyri-dine, which were prepared at salinity of 35. Care was taken to minimize the exposure of the seawater sample to the atmosphere. The standard pH of Tris and 2-aminopyridine is 8.0893 and 6.7866 at salinity of 35 and temperature of 25 °C (Dickson et al. 2007). Based on the Dickson et al. (2007) SOP, the precision and accuracy of the pH measure-ments in our study were estimated as being within ±0.002 and ±0.004 pH units, and the overall uncertainty was ±0.01 pH units (Zhai et al. 2014b).
Total alkalinity (TA) was measured using a modified Gran titration method with an automatic potentiometric titrator (798 MPT Titrino, Metrohm, Switzerland) at 25 °C based on SOP 3b of Dickson et al. (2007). Generally, a
known amount of seawater (usually about 125 g) is placed in an open cell, where it is titrated with a 0.05 mol·L−1 hydrochloric solution in a two-stage process. The seawater sample is first acidified to a pH between 3.5 and 4.0 and then stirred for a period of time to allow for the escape of CO2. The titration is continued until a pH of about 3.0 is reached. The HCl solution was prepared in NaCl media to maintain the ionic strength of the seawater. Certified refer-ence material from A.G. Dickson was used for calibration and accuracy assessment of the TA measurements (Dickson et al. 2007). The precision and accuracy of the measure-ments was approximately 0.1–0.3% (±2 to ±6 μmol·kg−1) (Qu et al. 2014).
2.3 Calculation of carbonate parameters and air–sea CO2 flux
The partial pressure of CO2 (pCO2) in this study was cal-culated from pH and TA using the CO2SYS_XLS program
Fig. 1 Schematic map of the topography, sampling stations, tran-sects, and currents in the SYS and ECS. These include the Kuroshio Current (KC), the Taiwan Warm Current (TWC), the Jiangsu Coastal Current (JSCC), and the Changjiang Diluted Water (CDW). Dia-monds indicate survey stations in the two cruises, and the red dotted lines denote the two sampling transects (transect “G” at 34°N and transect “PN” off the Changjiang estuary). The black dotted line rep-resents the boundary between the SYS and the ECS

368 B. Qu et al.
1 3
(Pierrot et al. 2006), adopting the carbonate dissociation constants proposed by Hansson (1973a, b) and refitted by Dickson and Millero (1987). Although there is no signifi-cant difference among the pCO2 values calculated using different sets of carbonate dissociation constants, the Hans-son constants (Hansson 1973a, b) provide the minimum difference (5 ± 5 µatm) between the calculated pCO2 and the measured pCO2 when employing a pH and TA combi-nation (Chou et al. 2011), and thus we chose that set of car-bonate dissociation constants for our calculations. Based on the reports of similar studies, uncertainties in pH and TA measurement can result in an error of about ±10 μatm in the pCO2 computation process (Chou et al. 2009a, b).
The air–sea CO2 exchange flux (FCO2, mmol·m−2·d−1) was calculated based on the classical formula as follows (Eq. 1):
where k is the CO2 transfer velocity (cm h−1) calculated according to the formula described by Sweeney et al. (2007) (Eq. 2); α is the solubility of CO2 in seawater (mol kg−1) (Weiss 1974); and pCO2, sea and pCO2, air are the partial pressure of CO2 in the seawater and atmosphere, respectively. We adopted atmospheric CO2 concentrations of 391 and 392 µatm for April and August 2011, respec-tively (Globalview-CO2, 2011, http://www.esrl.noaa.gov/gmd/ccgg/trends/global.html). In Eq. 2, U10 is the in situ wind speed (m s−1) at a height of 10 m, recorded by the shipborne meteorological station; Sc is the Schmidt num-ber of CO2 in seawater, which was calculated from the site-observed temperature (Wanninkhof 1992). In this paper, positive FCO2 indicates the release of CO2 from the sea-water to the atmosphere, while a negative value suggests absorption of CO2 from the atmosphere into the seawater.
3 Results
3.1 Hydrological conditions
The distribution and concentration of surface seawater tem-perature (SST) and salinity (SSS) was found to vary not only by season (i.e., spring and summer), but also between the SYS and ECS (Fig. 2; Table 1). Throughout the SYS and ECS overall, SST varied from 7.0 to 22.6 °C and from 19.2 to 30.0 °C in spring and summer, respectively. The SST of the SYS was generally colder than that of the ECS by about 4.5 °C on average, in both April and August (Table 1). We measured the monthly average atmospheric temperature near the surface (0.995 sigma level) of the SYS and ECS, and found that the temperatures of the SYS were
(1)F = 0.24 · k · α ·(
pCO2, sea − pCO2, air
)
(2)k = 0.27 · U210 · (Sc/660)
−0.5,
lower than the corresponding values in the ECS, at approxi-mately 4.96 and 1.23 °C, respectively. Consequently, in April, the difference in atmospheric temperature was likely the major cause of the higher SST in the ECS versus SYS. In August, however, the temperature gap could be ascribed, at least partially, to the invasion of the Taiwan Warm Cur-rent (TWC) and/or Kuroshio Current (KC), which continu-ously transported relatively warmer water into the ECS with the assistance of the East Asian Summer monsoon, whereas the warmer water was nearly unable to enter the SYS.
The spring and summer distribution patterns of SSS are virtually the same throughout the SYS and ECS: low concentrations of SSS at the Changjiang estuary (west of 123°E) and high values in the southeastern part of the ECS (south of 28°N) (Fig. 2b). Nevertheless, there were obvi-ous differences between the two cruises. The SSS in spring was higher than that in summer by about 1.5 both in the SYS and the ECS (Table 1). In addition, low SSS in the spring was confined to a limited coastal area, whereas in summer these SSS effects spread eastward over 124.5°E. Previous studies have suggested that the seasonal variation in Changjiang freshwater discharge is the critical factor controlling the SSS in the study area. As for the Changjiang Basin, the traditional flood season in August and dry season in April were observed. Consequently, the stronger dilution effect in August resulted in fresher seawater than in April, and the more abundant freshwater discharge transported the hypohaline water farther eastward.
Cross-shelf profiles of temperature and salinity in Tran-sects G and PN during the two cruises are illustrated in Figs. 3 and 4, respectively. Transect G was located in the middle SYS, crossing the latitude 34°N, and Transect PN stretched from the Changjiang estuary southeastward to the middle ECS shelf (Fig. 1). In April, the bottom column of Transect G was mainly occupied by cold water (T = 8.8–9.5 °C), and the isotherm of 9.5 °C gradually outcropped in the shallow nearshore region, forming a tongue-shaped cold core around 122.25–123°E above a depth of 20 m (Fig. 3a). This cold core was bounded by relatively high temperature (T = ~10 °C) in the upper layer. In August, however, the upper layer of Transect G became warmer (T = 21–26 °C) than in spring, and the bottom water became even colder (T < 8 °C) (Fig. 3b). This phenomenon was attributed to the shielding effect of the thermocline and the decay of the Yel-low Sea Warm Current (YSWC). Profiles of salinity in this transect were generally constant between the two seasons. In spring, the shallow nearshore water was fresher than the deep offshore water by nearly 2-4 PSU (Fig. 3c, d), indicat-ing the effects of riverine freshwater discharge. The fresher water (S < 31) in summer thus occupied a larger proportion than that in spring, due in part to the more abundant fresh-water discharge during the summer flooding.

369Comparison of carbonate parameters and air-sea CO2 flux in the southern Yellow Sea and East…
1 3
With regard to Transect PN, vertical temperature and salinity profiles were somewhat similar to those of Transect G. In brief, upwelling occurred around 124–125°E in the PN line in April, while in August an intense thermocline
restrained the outcropping of the bottom cold water, and extraneous warm water became the predominant factor (Fig. 4a, b). Salinity profiles of Transect PN were essen-tially invariant from spring to summer (Fig. 4c, d) and
Fig. 2 Surface distribution of a temperature, b salinity, c pH, d TA, e pCO2, and f FCO2 in the SYS and ECS during April and August 2011

370 B. Qu et al.
1 3
seemed to be unaffected by the seasonal variation in the CDW. Low salinity (<31) was restricted to the upper layer of the nearshore, while most of the water column was occu-pied by saline water (salinity of ~31–34).
3.2 Surface distribution of carbonate parameters
The distribution of pH showed obvious spatial and tempo-ral variation (Fig. 2c), though the average values for each
Fig. 2 continued

371Comparison of carbonate parameters and air-sea CO2 flux in the southern Yellow Sea and East…
1 3
shelf sea were nearly constant (Table 1). In spring, high pH (>8.100) was present in the expansive offshore region of the SYS and ECS, while low values (<8.000) appeared
only in the narrow coastal region and the connection zone of the SYS and ECS (32.0–33.5°N). With the arrival of summer, the previously high pH (~8.100–8.200) in the
Fig. 2 continued

372 B. Qu et al.
1 3
SYS decreased substantially, to about 8.000, with pH in the Changjiang estuary even dropping below 7.800 (Fig. 2c). However, pH values remained high (>8.000) in the ECS in the summer, and only its southern portion (26–28°N) began to show depressed pH (<8.000) as in the SYS.
Concentrations of surface TA ranged from 2080 to 2377 μmol kg−1 in spring and from 1998 to 2390 μmol kg−1 in summer. Owing to the conservative nature of TA, the spatial distribution of this parameter throughout the SYS and ECS varied only slightly during spring and summer. Generally, low TA values appeared in the hypohaline Changjiang estuary and adjacent area (SSS < 30), while high values occurred in the saline
offshore region (SSS > 31). According to the summary presented in Table 1, the average TA value in the SYS was slightly higher than that in the ECS, by approximately 15 and 20 μmol kg−1 in spring and summer, respectively. This result was due primarily to the abundant sediment dis-charge from the Yellow River and the turbidity maximum at the Jiangsu offshore water (Ren and Shi, 1986; Wang et al. 2011).
Surface pCO2 in spring, which varied from 246 to 686 µatm across the entire SYS and ECS, was lower on aver-age than the atmospheric equilibrium level. Extremely low pCO2 values were found in the central region of the SYS (pCO2 < 240 µatm) and the Changjiang estuary
Table 1 Average values of surface seawater temperature (°C), salinity, pH, TA (μmol kg−1), Chl a (mg m−3)a, pCO2 (µatm), and FCO2 (mmol m−2 d−1) in the SYS and the ECS in April and August 2011
a The Chl a data is derived from Wen et al. (2012)
Sea Month SST SSS pH TA Chl a pCO2 FCO2
SYS April 9.20 ± 1.00 32.23 ± 0.68 8.082 ± 0.09 2199.5 ± 43.0 1.89 ± 1.43 373.1 ± 97.2 −4.10 ± 35.53
August 22.85 ± 1.86 30.74 ± 0.61 8.055 ± 0.081 2191.8 ± 81.45 0.48 ± 0.46 404.8 ± 84.1 2.77 ± 19.44
ECS April 13.70 ± 3.01 32.33 ± 2.01 8.071 ± 0.09 2181.7 ± 32.2 1.93 ± 2.20 382.4 ± 93.8 −3.86 ± 21.99
August 27.13 ± 1.61 30.91 ± 2.99 8.085 ± 0.119 2171.2 ± 61.06 1.83 ± 3.76 368.2 ± 131.2 −5.83 ± 29.16
Fig. 3 Vertical distribution of a temperature and b salinity in Transect G SYS during April and August 2011

373Comparison of carbonate parameters and air-sea CO2 flux in the southern Yellow Sea and East…
1 3
(pCO2 < 300 µatm) (Fig. 2e), indicating that surface water there was under-saturated with atmospheric CO2. In con-trast, CO2-saturated waters were observed in the south-ern region of the SYS and the southwestern region of the ECS, where extremely high pCO2 of 420–686 µatm was observed. Compared with the spring cruise, the pCO2 in summer ranged from 178 to 680 µatm throughout the entire study area, with average pCO2 of 384 µatm. Specifically, the previously CO2-under-saturated SYS became CO2-saturated, as the average pCO2 rose from 373 µatm in the spring to 405 µatm in summer (Fig. 2e; Table 1). However, the surface pCO2 in the ECS underwent only a moderate reduction, decreasing from 382 µatm in spring to 368 µatm in summer. In addition, a higher gradient was demonstrated in the ECS in summer, with surface pCO2 decreasing from greater than 560 µatm at the Changjiang estuary to lower than 260 µatm at the central region of the ECS (29.5–31.0°N, 122.5–125.0°E).
3.3 Air–sea CO2 flux variations
The variation in patterns of air–sea CO2 flux (FCO2) in the SYS and ECS were similar to those of pCO2. Specifi-cally, during the spring cruise, negative FCO2 values were
recorded in the offshore region of the SYS (34–36°N, 122–125°E) and ECS (27–32°N, 122.5–126°E), and an extremely low FCO2 value (−59 mmol m−2 d−1) was found in the SYS at 35°N, 124°E. Conversely, posi-tive FCO2 values were observed in the coastal (west of 122.5°E) and connection zones (32–33.5°N, 122–126°E) of the two shelf seas (Fig. 2f). In other words, in spring, the offshore region of the SYS and ECS served as an obvious CO2 sink, whereas the coastal and connection zones of the two seas behaved as distinct CO2 sources. In summer, the offshore regions still maintained negative FCO2 values and served as an atmospheric CO2 sink, but the extremely low FCO2 (−56 mmol m−2 d−1) appeared in the ECS (28.7°N, 122.6°E and 29°N, 123.8°E). Similarly, the coastal con-nection zone of the two seas continued as an apparent CO2 source, but the sphere of influence expanded northeastward (Fig. 2f). It should be noted that the previous CO2 sink in the southern ECS was transformed into a CO2 source in the summer.
As for the magnitude of the air–sea CO2 flux, the entire SYS and ECS region behaved as a sustained CO2 sink, with seasonal average FCO2 of −3.9 and −2.1 mmol m−2 d−1 in spring and summer, respectively. In other words, the stud-ied area acted as a more obvious CO2 sink in spring than in
Fig. 4 Vertical distribution of a temperature and b salinity in Transect PN ECS during April and August 2011

374 B. Qu et al.
1 3
summer. Even though the SYS and ECS together remained an overall CO2 sink, the SYS and ECS separately under-went different seasonal air–sea CO2 flux variations in spring and summer (Table 1). The SYS was transformed from an atmospheric CO2 sink in spring (−4.1 mmol m−2 d−1) into a CO2 source in the summer (2.8 mmol m−2 d−1), whereas the ECS served as a persistent CO2 sink during both spring and summer (−3.9 to −5.8 mmol m−2 d−1).
3.4 Water masses and mixing process
To better understand the temporal and spatial variations in carbonate parameters in the SYS and ECS, the study area was preliminarily classified into four water masses (Fig. 5). In consideration of the practical topographical condi-tions of our investigation, our classification generally fol-lowed the principles of Chou et al. (2009a) and Zhai et al. (2014a), while making some necessary modifications in view of spatiotemporal differences between their historical research and our study. The water masses were thus iden-tified as the southern Yellow Sea Coastal water (SYSC), the southern Yellow Sea water (SYSW), the Changjiang Diluted Water (CDW), and the East China Sea Shelf water (ECSS). The areal distribution of these water masses is pre-sented in Fig. 6, and the hydrological features and carbon-ate parameters of each water mass are also summarized in Table 2.
Generally, the SYSC and the SYSW were confined to north of 32°N in the SYS and were roughly divided by 50-m isobaths (Fig. 6). They were all characterized by the lowest SST (9.37–9.81 °C in spring and 21.51–24.50 °C in summer) and the highest TA (2201–2208 μmol kg−1 in spring and 2172–2208 μmol kg−1 in summer). However, the SYSC maintained higher pCO2 values and behaved as a continuous CO2 source in both spring (9.6 mmol m−2 d−1) and summer (4.7 mmol m−2 d−1), whereas the SYSW had lower pCO2 and changed from a significant CO2 sink (−11.8 mmol m−2 d−1) in spring to a minor sink (−3.2 mmol m−2 d−1) in summer. As for the water masses in the ECS, conspicuous changes were observed from spring to summer in the CDW, while the ECSS remained basically unchanged (Fig. 6). The CDW, which was char-acterized by the lowest SSS and TA, was confined to the long narrow area off Changjiang estuary and the coast of Zhejiang in the spring and performed as a weak CO2 source (3.8 mmol m−2 d−1), while in summer it expanded north-eastward, reaching as far as 125°E, and the corresponding air–sea CO2 flux increased to 13.6 mmol m−2 d−1. The ECSS was consistently situated in the shallower shelf of the ECS (depth = 50–150 m) and behaved as an obvious CO2 sink both in spring (−9.2 mmol m−2 d−1) and in sum-mer (−13.1 mmol m−2 d−1).
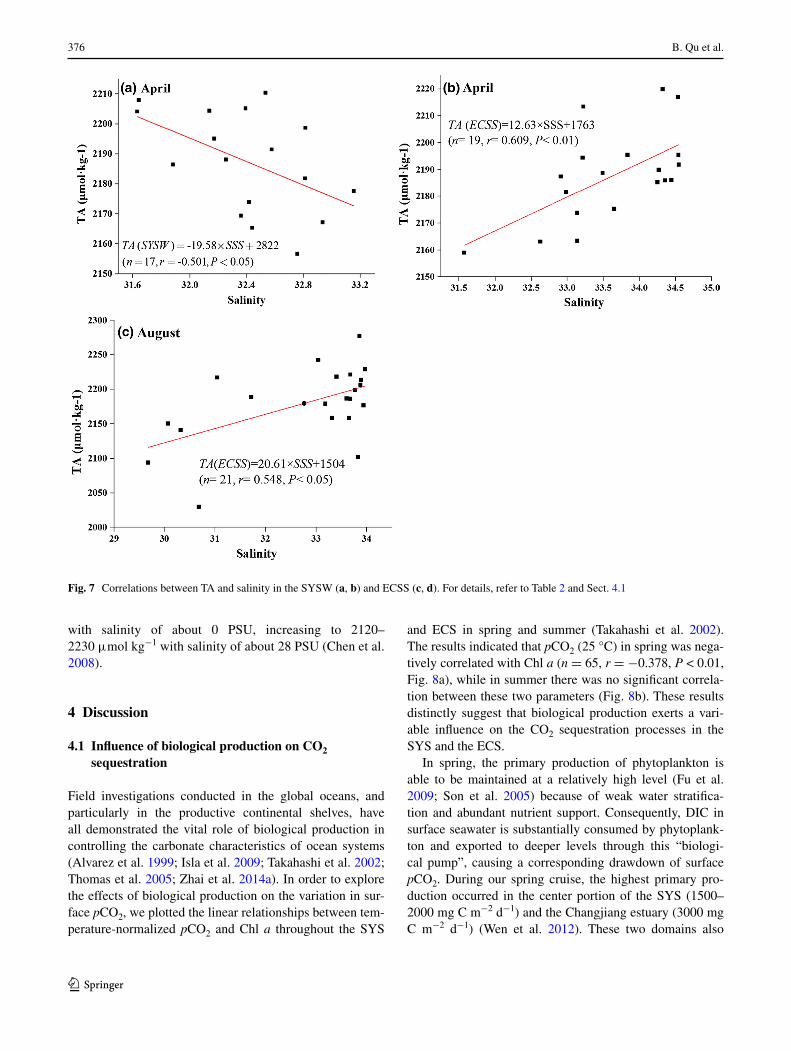
The correlation between TA and salinity largely reflected the water mixing process, given the conservative nature of TA during mixing (Wang et al. 2000; Zhai et al. 2014a, b). In this study, significant correlations between TA and SSS were found in the SYSW and ECSS (Fig. 7), while there was no obvious correlation in the other two water masses. In the SYSW, TA was negatively correlated with SSS in the spring (Eq. 3 and Fig. 7a):
This equation yields results similar to those of Zhai et al. (2014a) (TA = −3.9130 × SSS + 2423.9) obtained in the northern ECS in the spring. If Eq. 3 is extrapo-lated to the average salinity of the SYSC (SSS = 32.14) and ECSS (SSS = 33.62), the calculated results would be 2192 μmol kg−1 and 2163 μmol kg−1, respectively, which are very close to the average TA values of these two water masses (Table 2). This result indicates the intense mixing of the water of the SYSW with the SYSC and ECSS in the spring.
In the ECSS, positive correlations between TA and SSS were obtained in both spring and summer (Eqs. 4 and 5, Fig. 7c, d):
(3)
TA (SYSW) = −19.58× SSS
+ 2822 (n = 17, r = −0.501,P < 0.05)
Fig. 5 Temperature vs. salinity in surface water of the SYS and the ECS in April and August for four water masses: Changjiang Diluted Water (CDW), southern Yellow Sea Coastal water (SYSC), southern Yellow Sea water (SYSW), East China Sea Shelf water (ECSS)

375Comparison of carbonate parameters and air-sea CO2 flux in the southern Yellow Sea and East…
1 3
This was contrary to the negative relationship between TA and SSS in the SYSW during April.
Based on Eqs. 3, 4, and 5, it is evident that there were two different freshwater end-members in the SYSW and
(4)
TA (ECSS) = 12.63× SSS
+ 1763 (n = 19, r = −0.609,P < 0.01)
(5)
TA (ECSS) = 20.61× SSS
+ 1504 (n = 21, r = −0.548,P < 0.05)
the ECSS, with TA higher than that of seawater in the SYSW, and lower than seawater in the ECSS. In our opin-ion, the TA-rich freshwater end-members in the SYSW likely originated from Yellow River (YR) runoff and the turbidity maximum off the Jiangsu Shallow. Water from these two sources was all characterized by high TA con-tent because of abundant suspended sediments, and low salinity due to riverine freshwater discharge. The relatively TA-deficient freshwater end-member in the ECSS was very likely caused by Changjiang River discharge, as aver-age TA at the river end was only 1700–1850 μmol kg−1,
Fig. 6 Schematic of different water masses in the SYS and ECS in a April and b August 2011
Table 2 Hydrological [SST (°C), SSS], and carbonate parameters [pH, TA (μmol kg−1), pCO2 (µatm), FCO2 (mmol m−2 d−1)] of various water masses in the SYS and ECS during spring and summer
The average parameter values are denoted as "spring/summer"
Water mass SST SSS pH TA pCO2 FCO2
SYSC 9.81/24.50 32.14/30.62 8.034/8.044 2208/2208 422/416 9.6/4.7
SYSW 9.37/21.51 32.47/31.02 8.097/8.084 2201/2172 357/367 −11.8/−3.2
CDW 12.47/25.26 29.71/27.97 8.045/8.034 2153/2149 423/446 3.8/13.6
ECSS 15.67/28.40 33.62/32.77 8.096/8.092 2182/2180 350/349 −9.2/−13.1
376 B. Qu et al.
1 3
with salinity of about 0 PSU, increasing to 2120–2230 μmol kg−1 with salinity of about 28 PSU (Chen et al. 2008).
4 Discussion
4.1 Influence of biological production on CO2 sequestration
Field investigations conducted in the global oceans, and particularly in the productive continental shelves, have all demonstrated the vital role of biological production in controlling the carbonate characteristics of ocean systems (Alvarez et al. 1999; Isla et al. 2009; Takahashi et al. 2002; Thomas et al. 2005; Zhai et al. 2014a). In order to explore the effects of biological production on the variation in sur-face pCO2, we plotted the linear relationships between tem-perature-normalized pCO2 and Chl a throughout the SYS
and ECS in spring and summer (Takahashi et al. 2002). The results indicated that pCO2 (25 °C) in spring was nega-tively correlated with Chl a (n = 65, r = −0.378, P < 0.01, Fig. 8a), while in summer there was no significant correla-tion between these two parameters (Fig. 8b). These results distinctly suggest that biological production exerts a vari-able influence on the CO2 sequestration processes in the SYS and the ECS.
In spring, the primary production of phytoplankton is able to be maintained at a relatively high level (Fu et al. 2009; Son et al. 2005) because of weak water stratifica-tion and abundant nutrient support. Consequently, DIC in surface seawater is substantially consumed by phytoplank-ton and exported to deeper levels through this “biologi-cal pump”, causing a corresponding drawdown of surface pCO2. During our spring cruise, the highest primary pro-duction occurred in the center portion of the SYS (1500–2000 mg C m−2 d−1) and the Changjiang estuary (3000 mg C m−2 d−1) (Wen et al. 2012). These two domains also
Fig. 7 Correlations between TA and salinity in the SYSW (a, b) and ECSS (c, d). For details, refer to Table 2 and Sect. 4.1

377Comparison of carbonate parameters and air-sea CO2 flux in the southern Yellow Sea and East…
1 3
happened to be the most obvious atmospheric CO2 sinks (Fig. 2e, f), confirming that biological production was indeed responsible for the lower pCO2 values there.
In summer, the non-significant linear correlation between pCO2 and Chl a was probably due to the overall low content of integrated Chl a, which was just 24 mg m−3 on average and amounted to only one-third of that in spring (75 mg m−3) (Wen et al. 2012). Indeed, the average pri-mary production throughout the SYS and ECS was main-tained at a considerably higher level in summer (1274 mg C m−2 d−1) (Wen et al. 2012). The reason for the deviation in Chl a content from primary production was most likely the result of grazing pressure exerted by zooplankton (Fu et al. 2009). Therefore, in some sense, biological produc-tion in summer was involved in the regulation of pCO2 sim-ilar to the situation in spring, but its effect may have been masked by many other factors.
4.2 Relationship between typical water mixing processes and pCO2 variations
In general, the continental shelves of the SYS and ECS are complex hydrological regimes, with frequent river flood-ing, tidal fronts, and upwelling (Hu 1994; Lee and Chao 2003). These typical water mixing processes are closely related to the pCO2 variability in the shelf. As illustrated in Fig. 7, we found that high turbidity values (turbidity > 10 NTU) in the spring (April) of 2011 were generally located in three regions (Fig. 9a): the west shore of the SYS (here-after, “T1”), the southeastern area of the SYS (T2), and the narrow ECS coastal area (T3). Strikingly, our results also showed that these three regions just happened to be major sources of atmospheric CO2, with pCO2 values higher than 400 μatm (see details in Fig. 9b). Furthermore, when we plotted the correlations between pCO2 and turbidity
in these three regions, we found that pCO2 values were positively associated with turbidity (n = 12, r = 0.615, P < 0.05). In the sections below, we explore the internal relationships between typical water mixing processes and pCO2 variation, and discuss the key factors controlling the release of CO2 in the three turbid regions.
High turbidity in T1 was largely caused by the typical turbidity maximum in the nearshore Jiangsu SYS, which is commonly referred to in the literature as the “Subei shore water”. This area was characterized by high concentrations of suspended sediments (>30.0 mg/L) all year round (Wang et al. 2011), induced mainly by the intense vertical mix-ing. This vertical mixing process was verified by the out-crop of bottom water along Transect G (Fig. 3a, see details in Sect. 3.1). The high turbidity significantly restricted the biological uptake of CO2, because the photosynthetic effi-ciency of phytoplankton was limited by low transparency. Moreover, bottom sediments in this region were gener-ally characterized by fine-grained clay and silt, which was derived either from the ancient Yellow River Delta or the Bohai Sea. In the process of vertical mixing, the bottom sediment was re-suspended in the upper layer and released abundant DIC into the surface water through mineraliza-tion and respiration. The high content of TA around T1 (~2230 μmol kg−1, Fig. 2d) attests to this phenomenon. As a result, restricted biological sequestration and elevated DIC content, all induced by high turbidity, were responsi-ble for the CO2 outgassing in the nearshore SYS in T1 (Qu et al. 2014; Xue et al. 2011; Zhang et al. 2010).
The turbid T2 region was located at 31.5–33.0°N, 124.0–125.0°E, coinciding with the position of an impor-tant cyclonic eddy system in the northern ECS (Wang 2010). The almost vertical thermocline along 32.0°N from 123.0 to 125.0°E (Fig. 10) in April 2011 confirmed the intense vertical convection. According to Hu et al. (1980),
Fig. 8 Correlations between pCO2 and Chl a throughout SYS and ECS in a April and b August

378 B. Qu et al.
1 3
the occurrence of cyclonic eddies in the northern ECS is often accompanied by a strong upwelling, with the bot-tom sediment of the eddy typically composed of mud (Hu 1984). Therefore, it is reasonable to deduce that the
observed CO2-supersaturated surface water in T2 was prob-ably the consequence of the upwelling of bottom CO2-rich water. Thus, the cause of high pCO2 in T2 was somewhat similar to the situation in T1.
Fig. 9 Distribution of a turbidity (NTU) and b pCO2 (μatm) in the continental shelf of the SYS and ECS. T1, T2, and T3 are three turbidity maximum regions (turbidity >10 NTU)
Fig. 10 Vertical distribution of temperature (°C) along 32°N in April 2011

379Comparison of carbonate parameters and air-sea CO2 flux in the southern Yellow Sea and East…
1 3
The relationship between high turbidity and CO2 source in the T3 region can be attributed to the Changjiang river-ine discharge, and the details are discussed in the following section.
4.3 Effects of the Changjiang River Plume
The Changjiang River Plume (CRP) is one of the most important factors influencing carbonate systems in the continental SYS and ECS (Chen et al. 2008; Chou et al. 2009a, b; Tseng et al. 2014; Zhai and Dai 2009; Zhai et al. 2007). Long-term observation has shown that enor-mous volumes of freshwater (~9.0 × 10¹² m3 year−1), sus-pended sediments (~6.0 × 10⁷ t year−1), and nutrients (NO3–N = ~6.2 × 10⁵ t year−1, PO4
3−–P = ~5.3 × 10³ t year−1
SiO32−= ~2.4 × 10⁶ t year−1) are imported into the oceanic
environment through the Changjiang River (Li et al. 2007), which subsequently play an essential role in determining the biogeochemical cycles and circulation patterns in the SYS and ECS.
The Changjiang River Plume is traditionally charac-terized by low salinity (<31.0) and high nutrient content. During our spring cruise, because of insufficient water dis-charge (Fig. 11) and the prevailing northerly wind, the CRP was largely confined to the nearshore region from 27.5°N to 34.0°N, about 90–100 km off the coast (Fig. 2b). Only the turbid T3 region was included in the plume area. With the exception of two stations at the very mouth of the estu-ary (shown in Fig. 12a by the dashed circle), the pCO2 val-ues in the CRP, which was normalized to 25 °C to remove the effect of temperature, were negatively correlated with salinity in April 2011 (n = 8, r = −0.782, P < 0.05). Based on the plot in Fig. 12a, for salinity at ~28–30, the water was CO2-supersaturated, with in situ pCO2 varying from 580 to 680 μatm. However, the pCO2 rapidly decreased to below the atmospheric level—as low as 200 μatm at some sta-tions—as the salinity gradually rose to approximately 31.
This drastic variation in pCO2 within a narrow salin-ity range has been frequently observed in the inner estu-ary of the Changjiang River (Qu et al. 2013b; Zhai et al. 2007). On one hand, the river transports massive amounts of terrestrial organic and inorganic material to the plume region. Decomposition and mineralization of this material can result in markedly elevated surface pCO2 content in the seawater. On the other hand, however, the Changjiang River also discharges abundant nutrients into the plume region, which would favor the biological sequestration of CO2. Therefore, the variation in pCO2 in the CRP is deter-mined by the relative advantage of one of these two pro-cesses. In the freshwater end-member, the decomposition
Fig. 11 Average monthly water discharge of the Changjiang River (Datong station, data derived from the Hydrological Information Center of China, http://www.hydroinfo.gov.cn/). The solid gray bar denotes the 2011 data, and the dashed light gray bar displays the long-term (1950–2010) average values
Fig. 12 The relationship between pCO2 and salinity in a April and b August 2011 in the Changjiang River Plume
380 B. Qu et al.
1 3
of terrestrial material overwhelms the biological absorp-tion of CO2 (Chen et al. 2008), because the fresher zone of the CRP is generally unsuitable for phytoplankton pho-tosynthesis due to the high turbidity and low transparency, whereas with the settling of terrestrial material, transpar-ency is effectively improved in the saline end-member of the CRP. Thus phytoplankton production is finally able to draw down pCO2 content in favor of high nutrient supply.
Likely owing to the relatively abundant freshwater dis-charge (Fig. 11), the CRP area in August was more exten-sive than that in April. The isohaline of 31 reached almost as far as 125°N (Fig. 3b). We also plotted the linearity between pCO2 (25 °C) and salinity in the CRP in August, and found no significant correlation between those two parameters (Fig. 12b). Nevertheless, the CRP still demon-strated a potential controlling effect on the summertime variation in pCO2, though this effect appeared to be some-what ambiguous. The decomposition of terrestrial material in the inner estuary and the influx of CO2-rich freshwater jointly contributed to the pCO2 supersaturation in the rela-tively fresher end-member of the CRP (Chen et al. 2008). In contrast, in the outer region of the CRP, the above-men-tioned phytoplankton production and the dilution effect of offshore ECSS seawater gradually drew down the level of pCO2. With regard to the dramatic fluctuation in pCO2 around salinity = 31, this can be attributed to the intense water mixing between the CDW and ECSS, likely owing to the more abundant freshwater discharge of the Changjiang River in August.
5 Conclusions
The SYS and ECS are two typical continental shelf seas located in the Northwest Pacific Ocean. Accelerated envi-ronmental change caused by both natural and anthropo-genic activities are exerting a great influence on the oceanic CO2 systems of these shelf regions. As a result, investigat-ing the seasonal characteristics of carbonate parameters, exploring the internal relationships between pCO2 and vari-ous controlling factors, and comparing the spatial distribu-tion of air–sea CO2 flux in the SYS and ECS are essential for obtaining a comprehensive understanding of the CO2 systems in the world’s continental shelves.
In this study, we presented the temporal and spatial changes in carbonate parameters, including total alkalinity (TA), pH, and partial pressure of CO2 (pCO2), and air–sea CO2 flux (FCO2) in the continental shelves of the south-ern Yellow Sea (SYS) and East China Sea (ECS) based on two field surveys, conducted in April and August of 2011. The results indicate that the entire SYS and ECS act as a sustained CO2 sink, with average FCO2 of −3.9 and
−2.1 mmol m−2 d−1 in spring and summer, respectively. Surface pCO2 varied from 246 to 686 µatm in spring (aver-age = 379 µatm) and from 178 to 680 µatm in summer (average = 384 µatm). The central SYS (pCO2 < 240 µatm) and the Changjiang estuary (pCO2 < 300 µatm) were under-saturated with atmospheric CO2 in spring, while CO2-super-saturated waters (pCO2 = 420–680 µatm) were observed in the southern SYS and the southwestern ECS. In summer, however, the CO2-super-saturated waters (pCO2 = 380–680 µatm) occupied a relatively wide area (29–35°N), including the nearshore SYS and the Changjiang estuary, and pCO2-deficient water (pCO2 = 220–380 µatm) was observed only in the offshore region of the ECS.
This study also preliminarily classified the observed area into four water masses based on temperature-salinity properties in order to better understand the variations in water mixing processes in the SYS and ECS. The results show that the southern Yellow Sea Coastal water (SYSC) maintained higher pCO2 values and behaved as a con-tinuous CO2 source in both spring (9.6 mmol m−2 d−1) and summer (4.7 mmol m−2 d−1), whereas the southern Yellow Sea water (SYSW) was characterized by lower pCO2 values, and was transformed from a significant CO2 sink (−11.8 mmol m−2 d−1) in spring into a minor sink (−3.2 mmol m−2 d−1) in summer. The Changjiang Diluted Water (CDW) was confined to the long narrow area off Changjiang estuary and the coast of Zhejiang in the spring, and performed as a weak CO2 source (3.8 mmol m−2 d−1), while in summer it expanded northeastward, reaching as far as 125°E, and the corresponding air–sea CO2 flux increased to 13.6 mmol m−2 d−1. The East China Sea Shelf water (ECSS) was consistently situated in the shallower shelf of the ECS (depth = 50–150 m) and acted as an obvious CO2 sink both in spring (−9.2 mmol m−2 d−1) and in summer (−13.1 mmol m−2 d−1).
Phytoplankton production was the driving force for CO2 absorption, especially in the spring, but due to poor transparency, this biological sequestration effect was largely restricted to the inner estuary of the Changjiang River. In addition, typical water mixing processes and decomposition of terrestrial material were found to be responsible for the release of CO2 in three turbidity maxi-mum regions.
Acknowledgements This study was financially supported by the NSFC-Shandong Joint Fund for Marine Science Research Cent-ers (no. U1406403), the Strategic Priority Research Program of the Chinese Academy of Sciences (no. XDA11020102), the National Basic Research Program (973) of China (no. 2010CB951802), and the National Natural Science Foundation of China (NSFC; no. 41306070). We would like to thank the captain and crew of the R/V Kexue 3 for their help during the field investigations. Special thanks are extended to the editor and two anonymous reviewers for their use-ful comments and constructive suggestions.

381Comparison of carbonate parameters and air-sea CO2 flux in the southern Yellow Sea and East…
1 3
References
Alvarez M, Fernandez E, Perez FF (1999) Air-sea CO2 fluxes in a coastal embayment affected by upwelling: physical versus bio-logical control. Oceanol Acta 22:499–515
Borges AV, Delille B, Frankignoulle M (2005) Budgeting sinks and sources of CO2 in the coastal ocean: diversity of ecosystems counts. Geophys Res Lett. doi:10.1029/2005GL023053
Cai WJ, Dai MH, Wang YC (2006) Air-sea exchange of carbon diox-ide in ocean margins: a province-based synthesis. Geophys Res Lett 33:L12603. doi:10.1029/2006GL026219
Chai C, Yu ZM, Song XX, Cao XH (2006) The status and charac-teristics of eutrophication in the Yangtze River (Changjiang) Estuary and the adjacent East China Sea, China. Hydrobiologia 563:313–328
Chen CTA (1996) The Kuroshio intermediate water is the major source of nutrients on the East China Sea continental shelf. Oceanol Acta 19:523–527
Chen CTA, Wang SL (1999) Carbon, alkalinity and nutrient budg-ets on the East China Sea continental shelf. J Geophys Res 104:20675–20686
Chen XQ, Zong YQ, Zhang EF, Xu EG, Li SJ (2001) Human impacts on the Changjiang (Yangtze) River basin, China, with special reference to the impacts on the dry season water discharges into the sea. Geomorphology 41:111–123
Chen CTA, Zhai WD, Dai MH (2008) Riverine input and air-sea CO2 exchanges near the Changjiang (Yangtze River) Estuary: status quo and implication on possible future changes in metabolic sta-tus. Cont Shelf Res 28:1476–1482
Chen CTA, Huang TH, Chen YC, Bai Y, He X, Kang Y (2013) Air-sea exchanges of CO2 in the world’s coastal seas. Biogeosciences 10:6509–6544
Chou WC, Gong GC, Sheu DD, Hung CC, Tseng TF (2009a) Surface distributions of carbon chemistry parameters in the East China Sea in summer 2007. J Geophys Res 114:C07026. doi:10.1029/2008JC005128
Chou WC, Gong GC, Sheu DD, Jan S, Hung CC, Chen CC (2009b) Reconciling the paradox that the heterotrophic waters of the East China Sea shelf act as a significant CO2 sink during the summer-time: evidence and implications. Geophys Res Lett 36:L15607. doi:10.1029/2009GL038475
Chou WC, Gong GC, Tseng CM, Sheu DD, Hung CC, Chang LP, Wang LW (2011) The carbonate system in the East China Sea in winter. Mar Chem 123:44–55
Chou WC, Gong GC, Cai WJ, Tseng CM (2013) Seasonality of CO2 in coastal oceans altered by increasing anthropogenic nutrient delivery from large rivers: evidence from the Changjiang-East China Sea system. Biogeosci 10:3889–3899. doi:10.5194/bg-10-3889-2013
Dai Z, Du J, Zhang X, Su N, Li J (2010) Variation of Riverine Mate-rial Loads and Environmental Consequences on the Changjiang (Yangtze) Estuary in Recent Decades (1955–2008). Environ Sci Technol 45:223–227
Dai M, CaI Z, Guo X, Zhai W, Liu Z, Yin Z, Xu Y, Gan J, Hu J, Du C (2013) Why are some marginal seas sources of atmospheric CO2? Geophys Res Lett 40:2154–2158
de Haas H, van Weering TCE, de Stieger H (2002) Organic carbon in shelf seas: sinks or sources, processes and products. Cont Shelf Res 22:691–717
Dickson AG, Millero FJ (1987) A comparison of the equilibrium-con-stants for the dissociation of carbonic-acid in Seawater Media. Deep-Sea Res 34:1733–1743
Dickson AG, Sabine CL, Christian JR (2007) Guide to best practices for ocean CO2 measurements. PICES Special Publication 3, p 191
Fu M, Wang Z, Li Y, Li R, Sun P, Wei X, Lin X, Guo J (2009) Phy-toplankton biomass size structure and its regulation in the
Southern Yellow Sea (China): seasonal variability. Cont Shelf Res 29:2178–2194
Gao S, Wang YP (2008) Changes in material fluxes from the Changji-ang River and their implications on the adjoining continental shelf ecosystem. Cont Shelf Res 28:1490–1500
Guo XH, Zhai WD, Dai MH, Zhang C, Bai Y, Xu Y, Li Q, Wang GZ (2015) Air-sea CO2 fluxes in the East China Sea based on multi-ple-year underway observations. Biogeosci 12:5495–5514
Gypens N, Borges A, Lancelot C (2009) Effect of eutrophication on air–sea CO2 fluxes in the coastal Southern North Sea: a model study of the past 50 years. Global Change Biol 15:1040–1056
Hansson I (1973a) Determination of dissociation-constants of car-bonic-acid in synthetic sea-water in salinity range of 20–40 percent and temperature-range of 5–30 Degrees C. Acta Chem Scand 27:931–944
Hansson I (1973b) New set of acidity constants for carbonic-acid and boric-acid in sea-water. Deep-Sea Res 20:461–478
Hu DX (1984) Upwelling and sedimentation dynamics. I. The role of upwelling in sedimentation in the Huanghai Sea and East China Sea A description of general features. Chin J Oceanol Limnol 2:12–19
Hu DX (1994) Some striking features of circulation in Huanghai Sea and East China Sea. In: Zhou D, Liang YB, Zeng CK (eds) Oceanology of China seas, vol 3. Springer, Berlin, pp. 27–38
Hu DX, Ding ZX, Xiong QC (1980) A preliminary investigation of a cyclonic eddy in the northern East China Sea in summer. Chin Sci Bull 25:57–60
Huo YZ, Zhang JH, Che LP, Hu M, Yu KF, Chen QF, He Q, He PM (2013) Green algae blooms caused by Ulva prolifera in the southern Yellow Sea: identification of the original bloom location and evaluation of biological processes occurring dur-ing the early northward floating period. Limnol Oceanogr 58:2206–2218
Isla E, Gerdes D, Palanques A, Gili JM, Arntz WE, Konig-Langlo G (2009) Downward particle fluxes, wind and a phytoplankton bloom over a polar continental shelf: a stormy impulse for the biological pump. Mar Geol 259:59–72
Lee HJ, Chao SY (2003) A climatological description of circula-tion in and around the East China Sea. Deep-Sea Res Pt II 50:1065–1084
Li M, Xu K, Watanabe M, Chen Z (2007) Long-term variations in dis-solved silicate, nitrogen, and phosphorus flux from the Yangtze River into the East China Sea and impacts on estuarine ecosys-tem. Estuar Coas Shelf Sci 71:3–12
Liu DY, Keesing JK, He PM, Wang ZL, Shi YJ, Wang YJ (2013) The world’s largest macroalgal bloom in the Yellow Sea, China: for-mation and implications. Estuar Coast Shelf Sci 129:2–10
McKee BA, Aller RC, Allison MA, Bianchi TS, Kineke GC (2004) Transport and transformation of dissolved and particulate materials on continental margins influenced by major rivers: benthic boundary layer and seabed processes. Cont Shelf Res 24:899–926
Peng TH, Hung JJ, Wanninkhof R, Millero FJ (1999) Carbon budget in the East China Sea in spring. Tellus B 51:531–540
Pierrot D, Lewis E, Wallace D (2006) MS Excel program developed for CO2 system calculations. ORNL/CDIAC-105. Carbon Diox-ide Information Analysis Center, Oak Ridge National Labora-tory, US Department of Energy, Oak Ridge, Tennessee
Qiu C, Zhu JR (2013) Influence of seasonal runoff regulation by the Three Gorges Reservoir on saltwater intrusion in the Changjiang River Estuary. Cont Shelf Res 71:16–26
Qu BX, Song JM, Li XG, Yuan HM, Li N, Ma QX (2013) pCO2 distribution and CO2 flux on the inner continental shelf of the East China Sea during summer 2011. Chin J Oceanol Limnol 31:1088–1097

382 B. Qu et al.
1 3
Qu B, Song J, Yuan H, Li X, Li N (2014) Air-sea CO2 exchange pro-cess in the southern Yellow Sea in April of 2011, and June, July, October of 2012. Cont Shelf Res 80:8–19
Ren ME, Shi YL (1986) Sediment discharge of the Yellow-River (China) and its effect on the sedimentation of the Bohai and the Yellow Sea. Cont Shelf Res 6:785–810
Shim J, Kim D, Kang YC, Lee JH, Jang ST, Kim CH (2007) Seasonal variations in pCO2 and its controlling factors in surface seawater of the northern East China Sea. Cont Shelf Res 27:2623–2636
Son S, Campbell J, Dowell M, Yoo S, Noh J (2005) Primary produc-tion in the Yellow Sea determined by ocean color remote sens-ing. Mar Ecol Prog Ser 303:91–103
Song JM (2011) Biogeochemical processes of biogenic elements in China marginal seas. Springer, Berlin, p 626
Sweeney C, Gloor E, Jacobson AR, Key RM, McKinley G, Sarm-iento JL, Wanninkhof R (2007) Constraining global air-sea gas exchange for CO2 with recent bomb 14C measurements. Global Biogeochem Cy 21:GB2015. doi:10.1029/2006GB002784
Takahashi T, Sutherland SC, Sweeney C, Poisson A, Metzl N, Til-brook B, Bates N, Wanninkhof R, Feely RA, Sabine C, Olafsson J, Nojiri Y (2002) Global sea-air CO2 flux based on climatologi-cal surface ocean pCO2, and seasonal biological and temperature effects. Deep-Sea Res Pt II 49:1601–1622
Takahashi T, Sutherland SC, Wanninkhof R, Sweeney C, Feely RA, Chipman DW, Hales B, Friederich G, Chavez F, Sabine C, Wat-son A, Bakker DCE, Schuster U, Metzl N, Yoshikawa-Inoue H, Ishii M, Midorikawa T, Nojiri Y, Kortzinger A, Steinhoff T, Hoppema M, Olafsson J, Arnarson TS, Tilbrook B, Johannessen T, Olsen A, Bellerby R, Wong CS, Delille B, Bates NR, de Baar HJW (2009) Climatological mean and decadal change in surface ocean pCO2, and net sea-air CO2 flux over the global oceans. Deep-Sea Res I 56:2075–2076
Thomas H, Bozec Y, Elkalay K, de Baar HJW, Borges AV, Schiette-catte LS (2005) Controls of the surface water partial pressure of CO2 in the North Sea. Biogeosciences 2:323–334
Tseng CM, Liu KK, Gong GC, Shen PY, Cai WJ (2011) CO2 uptake in the East China Sea relying on Changjiang runoff is prone to change. Geophys Res Lett 38:L24609. doi:10.1029/2011GL049774
Tseng CM, Shen PY, Liu KK (2014) Synthesis of observed air–sea CO2 exchange fluxes in the river-dominated East China Sea and improved estimates of annual and seasonal net mean fluxes. Bio-geosciences 11:3855–3870
Tsunogai S, Watanabe S, Nakamura J, Ono T, Sato T (1997) A pre-liminary study of carbon system in the East China Sea. J Ocean-ogr 53:9–17
Tsunogai S, Watanabe S, Sato T (1999) Is there a “continental shelf pump” for the absorption of atmospheric CO2? Tellus B 51:701–712
Wang BD (2006) Cultural eutrophication in the Changjiang (Yang-tze River) plume: history and perspective. Estuar Coast Shelf S 69:471–477
Wang SL, Chen CTA, Hong GH, Chung CS (2000) Carbon dioxide and related parameters in the East China Sea. Cont Shelf Res 20:525–544
Wang G, Lan J, Sun SE (2010) A preliminary study of the center’s location and interseasonal variabilities of the cold eddy in East China Sea. Adv Earth Sci 25:184–192
Wang XH, Qiao F, Lu J, Gong F (2011) The turbidity maxima of the northern Jiangsu shoal-water in the Yellow Sea, China. Estuar, Coast and Shelf Sci 93:202–211
Wanninkhof R (1992) Relationship between wind-speed and gas-exchange over the Ocean. J Geophys Res Oceans 97:7373–7382
Weiss RF (1974) Carbon dioxide in water and seawater: the solubility of a non-ideal gas. Mar Chem 2:203–215
Wen F, Sun XX, Zheng S, Luo X, Feng QY, Sun S (2012) Spatial and seasonal variations of chlorophyll a and primary productiv-ity in spring and summer in the Yellow Sea and East China Sea. Oceanol et Limnol Sin 43:438–444 (in Chinese)
Xue L, Zhang LJ, Cai WJ, Jiang LQ (2011) Air-sea CO2 fluxes in the southern Yellow Sea: an examination of the continental shelf pump hypothesis. Cont Shelf Res 31:1904–1914
Yang Z, Wang H, Saito Y, Milliman JD, Xu K, Qiao S, Shi G (2006) Dam impacts on the Changjiang (Yangtze) River sedi-ment discharge to the sea: the past 55 years and after the Three Gorges Dam. Water Resour Res 42:W04407. doi:10.1029/2005WR003970
Zhai WD, Da MH (2009) On the seasonal variation of air-sea CO2 fluxes in the outer Changjiang (Yangtze River) Estuary, East China Sea. Mar Chem 117:2–10
Zhai WD, Dai MH, Guo XG (2007) Carbonate system and CO2 degassing fluxes in the inner estuary of Changjiang (Yangtze) River, China. Mar Chem 107:342–356
Zhai WD, Che JF, Jin HY, Li HL, Liu JW, He XQ, Bai Y (2014a) Spring carbonate chemistry dynamics of surface waters in the northern East China Sea: water mixing, biological uptake of CO2, and chemical buffering capacity. J Geophys Res-Oceans 119:5638–5653
Zhai WD, Zheng N, Huo C, Xu Y, Zhao HD, Li YW, Zang KP, Wang JY, Xu XM (2014b) Subsurface pH and carbonate saturation state of aragonite on the Chinese side of the North Yellow Sea: seasonal variations and controls. Biogeosciences 11:1103–1123
Zhang J (1996) Nutrient elements in large Chinese estuaries. Cont Shelf Res 16:1023–1045
Zhang SW, Wang QY, Lu Y, Cui H, Yuan YL (2008) Observation of the seasonal evolution of the Yellow Sea Cold Water Mass in 1996–1998. Cont Shelf Res 28:442–457
Zhang LJ, Xue L, Song MQ, Jiang CB (2010) Distribution of the sur-face partial pressure of CO2 in the southern Yellow Sea and its controls. Cont Shelf Res 30:293–304
Zhu ZY, Zhang J, Wu Y, Zhang YY, Lin J, Liu SM (2011) Hypoxia off the Changjiang (Yangtze River) Estuary: oxygen depletion and organic matter decomposition. Mar Chem 125:108–116


