Comparison of AT-Tester with Other Popular Testers...
29
1 Comparison of AT-Tester with Other Popular Testers for Quality of Service Experience (QoSE) of an Internet Connection 1 Timothy A. Gonsalves & Anuraag Bharadwaj TeNeT Group, Dept of Computer Science & Engg, IIT-Madras August 2009 Table of Contents 1. Introduction ..................................................................... 2 2. Experimental Methodology ................................................. 2 2.1 Metrics ........................................................................ 2 2.2 Factors Affecting the Measurements................................ 4 3. AT-Tester and Other Popular Testers ................................... 5 3.1 AT-Tester (http://www.broadbandasia.info) ..................... 5 3.2 Speedtest.net (http://www.speedtest.net/) ..................... 8 3.3 Speedtest2.com (http://www.speedtest2.com) ...............12 3.4 Internetfrog (http://www.internetfrog.com/mypc/speedtest/) ..................13 4. Comparative Evaluation ....................................................15 Appendix: Other Test Tools ...................................................19 1. BBC News (http://news.bbc.co.uk/2/hi/technology/7416471.stm)..........19 2. ZDNet UK (http://resources.zdnet.co.uk/speedtest) ..........20 3. Toast Internet Service (http://performance.toast.net/) ......21 4. Thinkbroadband (http://www.thinkbroadband.com/speedtest.html)................22 5. Broadband DSL Reports (http://www.dslreports.com/) ......24 6. Auditmypc (http://www.auditmypc.com/internet-speed- test.asp) ..........................................................................25 7. Voiptest (http://www.voiptest.org) ..................................26 8. BSNL Free Broadband Speed Checker .............................. 27 References ..........................................................................29 1 This work was sponsored by LirneAsia, Sri Lanka with the aid of a grant from the International Development Research Centre, Canada and the Department for International Development, UK.
Transcript of Comparison of AT-Tester with Other Popular Testers...

1
Comparison of AT-Tester with Other Popular Testers for Quality of Service Experience (QoSE) of an
Internet Connection1
Timothy A. Gonsalves & Anuraag Bharadwaj TeNeT Group,
Dept of Computer Science & Engg, IIT-Madras August 2009
Table of Contents 1. Introduction ..................................................................... 2 2. Experimental Methodology ................................................. 2
2.1 Metrics........................................................................ 2 2.2 Factors Affecting the Measurements................................ 4
3. AT-Tester and Other Popular Testers ................................... 5 3.1 AT-Tester (http://www.broadbandasia.info)..................... 5 3.2 Speedtest.net (http://www.speedtest.net/) ..................... 8 3.3 Speedtest2.com (http://www.speedtest2.com) ...............12 3.4 Internetfrog (http://www.internetfrog.com/mypc/speedtest/) ..................13
4. Comparative Evaluation ....................................................15 Appendix: Other Test Tools ...................................................19
1. BBC News (http://news.bbc.co.uk/2/hi/technology/7416471.stm)..........19 2. ZDNet UK (http://resources.zdnet.co.uk/speedtest) ..........20 3. Toast Internet Service (http://performance.toast.net/) ......21 4. Thinkbroadband (http://www.thinkbroadband.com/speedtest.html)................22 5. Broadband DSL Reports (http://www.dslreports.com/) ......24 6. Auditmypc (http://www.auditmypc.com/internet-speed-test.asp) ..........................................................................25 7. Voiptest (http://www.voiptest.org)..................................26 8. BSNL Free Broadband Speed Checker ..............................27
References..........................................................................29
1 This work was sponsored by LirneAsia, Sri Lanka with the aid of a grant from the International Development Research Centre, Canada and the Department for International Development, UK.

2
1. Introduction Internet service providers (ISPs) offer various broadband packages to their subscribers. They typically specify the minimum, maximum or range of bandwidths that the subscriber could obtain on the last-mile link. The ISP may also use Quality of Service (QoS) techniques to ensure a minimum service level, say 256 kb/s on the broadband link [QoS09]. In practice, the achieved bandwidth may differ significantly from the advertised bandwidth as subscribers are more interested in the overall quality of their service experience (QoSE) when using Internet services such as browsing, VOIP, streaming video, etc. This includes the end-to-end path through the Internet to a distant server, in addition to the last-mile. QoSE is the actual measure of the user’s experience with an operator in terms of delivered quality with or without reference to what is being promised. This is measured quantitatively and not subjective [QoSE09]. The TeNeT Group of IIT-Madras and LirneAsia, Colombo have developed the AshokaTissa (AT) Tester Methodology by which a subscriber can measure his/her quality of service experience. A freely downloadable tool is available (currently for Windows) by which the subscriber can run the tests and generate a report on the QoSE of his/her broadband connection. The results are stored on a server from which the average performance of all subscribers of each ISP are publicly available. While there are a large number of free broadband speed testers available, there are practically no critical evaluations of them. There are reviews of individual testers (see e.g. [Fisher]). One of the few reports on multiple testers merely only gives a terse description of each of 6 test tools [Mitchell]. In this document, we review some of the popular tools that are available for testing the performance of a subscriber’s Internet connection. In the next section, we review the test methodology and the factors that influence the QoSE. In Section 3, we give a detailed evaluation of the more popular testers and the AT-Tester. This is followed by a summary table and our conclusions in Section 4. The Appendix lists the features and our rating of all the other testers that we have surveyed. Note that we only review tools that are free to use.
2. Experimental Methodology
2.1 Metrics Different applications make different demands on the Internet connection. For example, browsing a photo gallery requires high download speed while a networked game requires low round trip delay. Hence, the AT Tester Methodology [AT08] defines a

3
comprehensive set of 6 performance metrics that should be measured in each experiment. Note that these metrics are similar to the metrics defined by ITU-T [ITUT02] and the IETF [IETF09] for operator-centric QoS. The 6 metrics are briefly described below. Download speed (kbps)
The maximum rate at which data can be received from the Internet. This is measured by downloading a large file over about 1 minute, in order to average out temporary fluctuations in speed. It is an indicator of the basic browsing experience.
Upload speed (kbps)
This metric defines the speed at which the subscriber can send data to the Internet. It plays a significant role in responsiveness of real-time applications like VOIP.
Round trip time or RTT (millisec)
Time taken for a packet to reach the destination and return. This is significant in systems that require two-way interactive communication such as online commerce and gaming.
Jitter (millisec)
Jitter is the variation of end-to-end delay from one packet to the next within the same packet stream/connection/flow. Jitter is more relevant for real-time traffic like VOIP.
Packet-Loss (%)
The fraction of packets which do not reach the destination. This can result in noticeable performance degradation with streaming traffic such as video where retransmission is not done.
Availability (%)
This measures the number of times we are able to access the Broadband services. If T attempts are made to connect to the Internet, and if F attempts fail, then Availability = (1–F/T)×100%
These 6 metrics help the subscriber to estimate the quality of experience with various applications in a qualitative manner. This is done using Table 1 below.

4
Table 1: Relevance of Metrics to Various Internet Services Legend: +++ highly relevant, ++ very relevant, + relevant, - not relevant
Speed Delay Service
Down
Up
RTT
Jitter
Loss
Browse (text) ++ - ++ - - Browse (media)
+++ - ++ + +
Download file +++ - - - - Transactions - - ++ + - Streaming media
+++ - ++ ++ ++
VOIP + + +++ +++ +++ Games + + +++ ++ ++
2.2 Factors Affecting the Measurements There are many factors that can influence the Quality of Service Experience perceived by the subscriber. These include:
a) The theoretical maximum data transfer rate of the subscriber’s Internet connection (last mile)
b) The nature of the last-mile medium (copper, optical fibre, wireless or satellite)
c) Sharing of the last mile by any other users d) The number of links and number of ISPs between the source
and the destination, and the congestion on these links e) The number of other requests being handled by the remote
server. f) The presence of interference in the last mile due to lightning,
electrical noise, loose connections, etc. g) Subscriber’s computer configuration and other applications
running on it h) Time of day and day of week (peak business time, national
holiday, etc). Many of the factors vary dynamically. For example, a backbone link serving a business area may be heavily congested at 10 a.m. but may have almost zero traffic at 2 a.m. Likewise, a short thunderstorm may cause severe degradation of performance for a few minutes. Hence, it is clear that a single measurement is meaningless. Any experiment must be repeated at different times of day, different days of the week, with different servers (some nearby, some distant), etc. Only with such a systematic experiment can the subscriber get a true picture of the quality of the Internet connection. To account for the effects of these factors, the experiments should be by each subscriber as follows: Type of day Week day, week end, holiday (local/national)
5
Time of the day Peak/non-peak business hours, peak/non-peak residential hours Location of server
• ISP Level Test – to/from a server in the subscriber’s ISP
• Country Level Test – to/from a server in the subscriber’s country but hosted by a different ISP
• Global Level Test – to/from a server outside the subscriber’s country.
In all cases, the server chosen should be a widely-used one so that it is representative and is likely to have high-bandwidth network connections.
3. AT-Tester and Other Popular Testers We now describe the AT-Tester and 3 other popular testers. Each tool is described under the following headings: 1. Description: This describes the tool and its salient features. 2. Performance Metrics: The metrics that are quantified by the
tool. 3. Drawbacks: The various important drawbacks of the tool. 4. Rating: A good tool must satisfy two requirements:
a. Technical merit: it must use a sound methodology to measure a comprehensive set of QoSE metrics. The test results must be analysed to produce meaningful summaries.
b. Convenience: Use: the tool must be easy for a non-technical subscriber to use Results: must be presented in a form that such the person can easily understand.
For each of these parameters, we rate the tool as Poor, Marginal, Average, Good or Excellent
3.1 AT-Tester (http://www.broadbandasia.info)
Description
The client software referred to as the AT-Tester is pre-installed in the user PC for measuring the QoSE metrics periodically. Results can be viewed locally and uploaded to the www.broadbandasia.info server. The tool is written in VBScript. The tests are done using ping, download of files from selected servers, and upload of files to the www.broadbandasia.info server. The AT-Tester allows the subscriber to test against 3 different servers: global, national and ISP. Widely-used servers are selected

6
for each country and ISP. This allows the subscriber to assess the QoSE for services hosted in different parts of the Internet cloud.
• ISP Level Test – to/from a server in the subscriber’s ISP
• Country Level Test – to/from a server in the subscriber’s country but hosted by a different ISP
• Global Level Test – to/from a server outside the subscriber’s country.
Salient features of the AT-Tester: • The client application supports registration, scheduling of
tests, manual running of tests, viewing and uploading of results (see Figure 1).
• During registration, the subscriber selects his/her location, ISP and tariff package
• Tests can be run manually, or can be run by the scheduler at selected times
• Results are stored on the PC and can be viewed locally. • The results are uploaded manually to the
www.broadbandasia.info server. There they are aggregated
Figure 1: AT-Tester main window, scheduler, local results (clockwise from top-left)

7
with other results for the same ISP and location, and the aggregate results are publicly viewable (see Figure 2).
• Results for different service providers can be compared. • It tests the throughput to three servers, namely (a) the local
ISP (b) another server within the same country and (c) a global server outside the country (this is located in Germany for the US and in the US for all other countries)
• Care is taken to ensure that there is no other network traffic on the subscriber’s link during the tests.
• Both the test methodology and the source code for the AT-Tester are open.
Performance Measures
The AshokaTissa methodology includes all the 6 key metrics described, viz. download speed, upload speed, RTT (latency), jitter, packet loss and availability. See the figure below for a sample report of the aggregate statistics for one ISP. The times of the
Figure 2: AT Tester aggregate global server results for an ISP at various times of day

8
tests cover peak/non-peak business and peak/non-peak residential use.
Drawbacks
• Total time taken for each test is about 5 minutes. The complete test suite consists of 6 tests day on at least 2 days.
• At the time of registration, if the subscriber’s ISP is not in the configured list, s/he has to wait for it to be configured by the www.broadbandasia.info admin and only then can tests be run
• The user interface could be better, e.g. results are presented only in tabular form
Rating
Table 2: AT-Tester Rating
Measure Score Comments Technical merit
Excellent Covers all metrics, multiple well-defined servers, meaningful aggregation of statistics, sound experimental methods
Convenience Use: Average Results: Good
Results are useful to a technically savvy person, not so easily used by a non-technical person. Tedious registration process.
3.2 Speedtest.net (http://www.speedtest.net/)
Description
Speedtest.net is provided by Ookla (www.ookla.com), a company that is focused on web-based network diagnostic applications. Ookla provides network speed testing applications for an annual license fee ranging from $400-$2,000. The services of the speedtest.net website, reviewed here, are provided free. Salient features of Speedtest.net:
• This tool allows you to check the performance of their connection to and from hundreds of locations around the world.
• The tool is browser-based, there is no application to be installed on the PC
• The tester is implemented in Adobe Flash which must be installed in the browser. Flash is freely available for all PC browsers, and is installed in most browsers.
• The tests are done against a server which is selected from a large list. There are about 100 servers each in N. America and Europe, and about 100 in the rest of the world. Servers

9
are available in all continents. There are 2 servers in India (Mumbai and Delhi) and one in Sri Lanka (Colombo).
• It is very user friendly. It also shows the ISP name, IP address and the physical distance between your system and the selected server. Results are shown in an attractive graphical form (see Figure 3).
• World results can be viewed and compared easily on basis of download and upload speed. It also shows the top 10 results (Only the best test scores are used for the ranking) of the world/continent/country/city.
• The subscriber can see a summary of his/her Internet speed, including past results, and compare with the ISP’s average, and with other ISPs nationally (see Figure 4) and around the world (see Error! Reference source not found.)
• It allows the subscriber to upload results and rate the ISP • Total time taken for the test is less than one minute • Speedtest.net also allows individuals and organizations to
register their servers in the list of available servers. This requires some configuration of the server.
• Speedtest,net can also be used from an iPhone
Figure 3: Speedtest.net: test results for top ISPs in India

10
Performance Measures
Speedtest.net performs three measurements, viz. download speed, upload speed and round trip time (RTT) out of the 6 metrics defined above. (Note: the commercial versions of the tester also measure jitter and packet loss.)
Drawbacks
• Only three parameters Download Speed, Upload Speed and Latency are considered for generating the result whereas other parameters like Jitter, availability and packet loss are not considered
• Results are averaged over different times of day and different days. Hence they can be misleading if one ISP is tested at peak time and another at off-peak time.
• Results are averaged across the large number of servers chosen by each subscriber.
Figure 4: Speedtest.net: Top ISPs in India

11
Rating
Table 3: Speedtest.net Rating
Measure Score Comments Technical merit
Average Covers 3 metrics, many servers around the world; aggregation of statistics misleading
Convenience Use: Excellent Results: Average
Effective graphics. Results are easily understood by a lay person, but could be misleading. Large database of test results.
Figure 5 Speedtest.net: Summary of world-wide results

12
3.3 Speedtest2.com (http://www.speedtest2.com)
Description
Note: this tester is quite distinct from Speedtest.net, though it appears to have been inspired by it (user interface, metrics and Flash implementation).
• Very user friendly with a good GUI, the ISP name and location are automatically determined (see Figure 6)
• The tool is browser based • No registration is needed, the subscriber selects a server and
the test is run immediately • Total time taken is less than one minute • It allows the subscriber to upload results and rate the ISP • Global summaries can be displayed • An individual or organization can register their server to be
used. This requires about 100 MB of disk space and PHP support.
Performance Measures
Speedtest2.com performs three key measurements used to determine the overall quality and performance of Internet
Figure 6: Speedtest2: Summary of test results

13
connection, which are download Speed, Upload Speed and Ping (Latency).
Drawbacks
• Only three parameters Download Speed, Upload Speed and Latency are considered for generating the result whereas parameters like Jitter, availability and packet loss are not considered
• Results are averaged over different times of day and different days. Hence they can be misleading if one ISP is tested at peak time and another at off-peak time.
• Results are averaged across the large number of servers chosen by each subscriber.
• The number of servers (10) is small compared to Speedtest.net: there are 5 servers in Poland, 3 in the rest of Europe, 1 in the US and 1 in Kolkata, India.
Rating
Table 4: Speedtest2.com Rating
Measure Rating Comments Technical merit
Average Covers 3 metrics, limited servers around the world; aggregation of statistics misleading
Convenience Use: Good Results: Average
Effective use of graphics. Results are easily understood and used by a lay person, but could be misleading
3.4 Internetfrog (http://www.internetfrog.com/mypc/speedtest/)
Description
• The Internet Frog has many tools for webmasters, domain owners, network administrators, and website developers.
• The tool is browser based. • The measured speed is compared with a speed guide (see
Figure 7) • The time for downloading a file (1MB, 10MB or 100 MB) from
the Internet is estimated, to help the subscriber understand the speed results
• It also shows the Quality of Service in percentage, which is not seen in other tools.
• Total time taken is less than one minute

14
Figure 7: Internetfrog.com: Test results
Performance Measures
It provides information regarding download and upload speeds, RTT, max pause (longest gap between successive packets) and “Quality of Service” (a percentage measure of the consistent download capacity).
Drawbacks
• Jitter, availability and packet loss are not considered • A single pre-determined server is used • The tester uses a Java applet and hence will not run on
browsers that do not have the correct version of Java installed.
Rating
Table 5: Internetfrog Rating
Measure Score Comments Technical merit
Marginal Covers 3 metrics, many servers around the world
Convenience Use: Good Results: Marginal
Results are easily understood and used by a lay person, but aggregation is misleading

15
4. Comparative Evaluation We now compare the above 4 broadband testers. A good tool must satisfy two requirements, technical merit and convenience (see Section 3).
Technical Merit
ISPs advertise only the bandwidth of a broadband service and most of the testers concentrate only on this metric. However, subscribers use the Internet for a diversity of uses, each making different demands on the network. In this regard, the AT-Tester is superior to the other testers. As discussed earlier, a single experiment is meaningless given the number of factors that could affect the experiment. Again, the AT-Tester scores much above the other testers in the rigour of its experimental methodology. All the other testers take single tests done by uncoordinated users and average them to yield a single figure of merit. The AT-Tester gets each user to repeat the tests at least 12 times as carefully chosen times and days with each of 3 different servers. The results are averaged across multiple users only when other factors are the same. This produces a set of numbers that define the QoSE of each ISP. The detailed performance is also available at a click of a button. A single figure of merit may seem attractive but is often meaningless. Suppose that a user in Delhi is considering a 6 Mb/s ADSL service. The “fact” that Tata Internet Services achieves 4.73 Mb/s vs. 3.31 Mb/s for SIFY (from the Speedtest.net website) may give a false picture. It may be that the SIFY tests were done at peak business hours with high congestion while the Tata tests were done during the early morning with light load. Likewise, the Tata testers may have had high-speed packages, while the SIFY testers could have had lower speed packages. The AT-Tester which gives time of day, type of day, ISP, package, and region allows the user to do an apples to apples comparison. Table 6 compares the technical merit of the 4 testers. We consider several issues. First is the number of metrics. As discussed in Section 2.1, a comprehensive set consists of 6 metrics. Next is the experimental method. Does the tester attempt to compensate for uncontrolled factors such as line quality, thunderstorms, etc? The third issue is repetition of the test from the same location to account for daily and weekly variations. Next, we examine the servers used for the testing. Another issue is the degree of openness, which enabled the public to understand and criticize the methodology. Next, we consider the issue of the analysis. Is this done to produce meaningful and useable summaries? Finally, based on these issues, we give our overall rating on a scale of 1-5.

16
Table 6: Comparison of Technical Merit of 4 Testers
Issue AT-Tester Speedtest.net Speedtest2.com Internetfrog Metrics 6 (download
and upload speed, RTT, jitter, packet loss, availability)
3 (download and upload speed, RTT)
3 (download and upload speed, RTT)
3 (download and upload speed, RTT)
Experimental method
Tests done with large files, ping repeated 100 times, other network activity stopped
File size and ping repetitions not known. Browser may generate spurious network traffic.
File size and ping repetitions not known. Browser may generate spurious network traffic.
Large file size used. Ping repetitions not known. Browser may generate spurious network traffic.
Repetitions Each test is repeated at 6 times of day, and on 2 days (weekday and weekend)
Depends on the subscriber, typically only one test is done
Depends on the subscriber, typically only one test is done
Depends on the subscriber, typically only one test is done
Servers Carefully chosen servers, per ISP, each country and global. ISPs and countries added on demand.
About 300 servers in N. America, Europe and ROW. Most countries covered.
Only 10 servers (5 of which are in Poland)
Many servers around the world
Analysis Uploaded data is manually scanned for any obvious inconsistencies. Data is averaged in a meaningful way: for the same time of day, type of day, ISP, country, etc. to produce detailed summaries.
Averaging is done across all subscribers to produce a single figure of merit for one ISP or one country. No distinction is made for time of day, type of day, etc.
Averaging is done across all subscribers to produce a single figure of merit for one ISP or one country. No distinction is made for time of day, type of day, etc.
Averaging is done across all subscribers to produce a single figure of merit for one ISP or one country. No distinction is made for time of day, type of day, etc.

17
Issue AT-Tester Speedtest.net Speedtest2.com Internetfrog Openness Methodology
and source code are fully public. Public seminars are conducted to disseminate and discuss results. Results are shared with ISPs.
Metrics and some details of the methodology are described on the website.
Metrics and some details of the methodology are described on the website.
Metrics and some details of the methodology are described on the website.
Rating Excellent Average Marginal Marginal
Convenience
In convenience, all the testers except AT-Tester run entirely within the browser. There is no need for registration. The tester automatically determines the subscriber’s ISP name and location. Extensive use of graphics enhances convenience and appeal. The user can run a test in about 1 minute. With the AT-Tester, one test takes about 5 minutes and the complete suite of tests requires 2 days. In the presentation of the results, again all the testers except AT-Tester present a single number. This is easy to use but as discussed above can be very misleading. The AT-Tester summaries contain more detailed information that avoid misleading data but require more effort on the part of the user. The use of a browser has a downside. The browser may have tabs open that use the network in the background, eg. for periodic refresh of content. This will affect the accuracy of the readings. The AT-Tester runs stand-alone and cautions the user to stop all network activity. Automatic determination of ISP information is a convenience that is not always useful. For example, the IP addresses for BSNL (a large nationwide ISP in India) are sometimes listed as “NIB (National Internet Backbone)” and sometimes as BSNL. The automatic algorithm thus mistakes BSNL as two ISPs. Most users who see a report for NIB will not know that this in fact is a part of BSNL. Finally, developed by an academic group, TeNeT of IIT-Madras, and LirneAsia, an NGO, the AT-Tester screens are completely devoted to test information. In contrast, all the other testers include ads that distract the user and may consume bandwidth!

18
Summary
In summary, the AT-Tester is the best tester for broadband QoSE in technical merit compared to all other testers surveyed (above and see the Appendix below). AT-Tester lacks in ease of use, and could be enhanced by better use of graphics and perhaps a browser version. We note that results of a few technically rigourous studies of broadband performance have been published by academic groups (e.g. [Dischinger07]). However, these are not readable by the general public, the test tools are not freely available, and the results only cover the US and Europe. The AT-Tester makes technically rigourous measurements available to the general public, with a focus on South Asia.

19
Appendix: Other Test Tools Here, we describe some of the other test tools that are available for free use on the Internet. These are generally less useful than the ones surveyed above. Each tool is described in the same format as in Section 3 above.
1. BBC News (http://news.bbc.co.uk/2/hi/technology/7416471.stm)
Description
• This tool, provided by BBC News, UK, is browser based • It provides the speed at which a small file (e.g. song) and a
big file (e.g. movie) could be downloaded from the BBC website only
• It allows the subscriber to plot his/her location and speed on a map and upload a message.
• Total time taken is less than one minute. • It displays the pattern of results submitted from across the
UK
Figure 8 BBC News Speed Tester

20
Performance Measures
• It only measures download speed
Drawbacks
• Only one parameter i.e. download speed, that too from only one BBC server
• Upload Speed, Latency, Jitter, availability and packet loss are not considered
Rating
Table 7: BBC News Tester Rating
Measure Score Comments Technical merit
Poor Single metric, single server
Convenience Use: Good Results: Very Poor
Useful to a user of the BBC website only
2. ZDNet UK (http://resources.zdnet.co.uk/speedtest)
Description
• This tool is provided by zdnet.co.uk • The tool is browser based • Total time taken is less than one minute • Once the test is conducted it plots the speed along with the
expected speed for comparison
Performance Measures
It only provides the information regarding download speed and the total time taken.
Drawbacks
• Only one parameter, download speed, is provided from a single pre-determined server
• Upload speed, latency, jitter, availability and packet loss are not considered for generating the results.
Rating
Table 8: ZDNet UK Rating
Measure Score Comments Technical merit
Poor Single metric, single server
Convenience Use: Good Results: Very Poor

21
Figure 9 ZDNet UK broadband speed tester
3. Toast Internet Service (http://performance.toast.net/)
Description
• Average bandwidth results from other ISP users that use this testing site are displayed
• It allows testing of the Internet connection from about 20 locations (1 in Syria, the others in the US).
• It allows adding of a server • It maintains a list of the fastest ISPs and web host • The tool is browser based • History of the subscriber’s past tests are not maintained in the
free version • Total time taken is less than one minute
Performance Measures
Both upload and download speeds are measured from any one of the list of servers.

22
Figure 10 Toast.net: List of servers available for testing
Drawbacks
• Only two parameters, download speed and upload speed, are considered.
• Latency, jitter, availability and packet loss are not considered • Almost all the servers are located in the US
Rating
Table 9: Toast Internet Rating
Measure Score Comments Technical merit
Marginal 2 metrics, several US-centric servers
Convenience Use: Very Good Results: Marginal
Aggregation could be misleading
4. Thinkbroadband (http://www.thinkbroadband.com/speedtest.html)
Description
• The tool is browser based • It takes 2 to 3 minutes for the test to complete. • Results are logged for statistical purposes and are an
indication of the connection speed only.

23
• Results can also be shared with the service provider to help troubleshoot problems or improve their service.
• To use this tester, Java must be installed and enabled • The subscriber is cautioned not to use the Internet during a
test • Download is done from a single pre-determined server
Performance Measures
It only provides the download speed from a single pre-determined server. Files ranging from 5 MB up to 1 GB in size are provided for downloading. A Rough Speed Guide is provided for comparison:
ADSL Speed Typical Download Typical Upload 512 Kbps 460 Kbps 200-240 Kbps
1 Mbps 920 Kbps 200-240 Kbps 2 Mbps 1840 Kbps 200-240 Kbps 8 Mbps 7000 Kbps 400-750 Kbps
Figure 11 Thinkbroadband: Home page with test running
Drawbacks
• Only one parameter, download speed, is provided, from a single pre-determined server
• Upload speed, latency, jitter, availability and packet loss are not considered
24
• Total time taken is slightly higher than many of the other testers
• Downloading the Java applet takes time and it will not run unless the browser supports the right version of Java
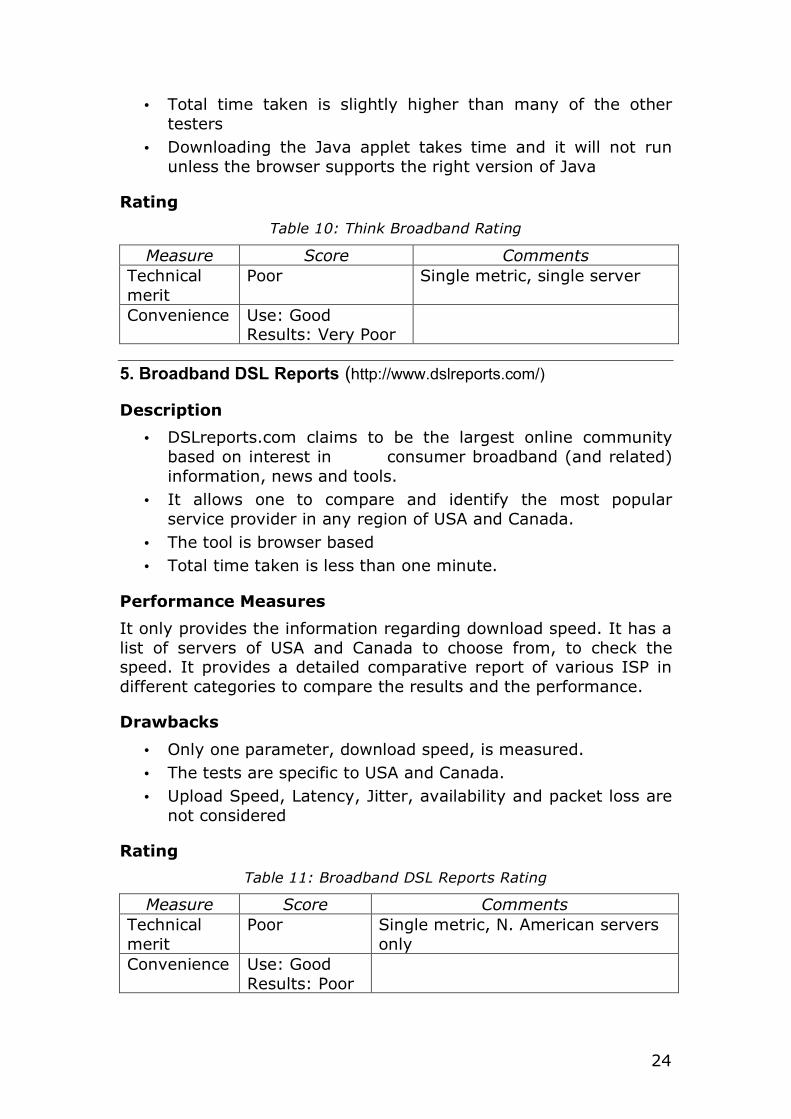
Rating
Table 10: Think Broadband Rating
Measure Score Comments Technical merit
Poor Single metric, single server
Convenience Use: Good Results: Very Poor
5. Broadband DSL Reports (http://www.dslreports.com/)
Description
• DSLreports.com claims to be the largest online community based on interest in consumer broadband (and related) information, news and tools.
• It allows one to compare and identify the most popular service provider in any region of USA and Canada.
• The tool is browser based • Total time taken is less than one minute.
Performance Measures
It only provides the information regarding download speed. It has a list of servers of USA and Canada to choose from, to check the speed. It provides a detailed comparative report of various ISP in different categories to compare the results and the performance.
Drawbacks
• Only one parameter, download speed, is measured. • The tests are specific to USA and Canada. • Upload Speed, Latency, Jitter, availability and packet loss are
not considered
Rating
Table 11: Broadband DSL Reports Rating
Measure Score Comments Technical merit
Poor Single metric, N. American servers only
Convenience Use: Good Results: Poor

25
Figure 12 DSL Reports: speed of various US-based ISPs compared
6. Auditmypc (http://www.auditmypc.com/internet-speed-test.asp)
Description
• The tool is browser-based. Both Flash and Java versions are available
• Testing is done using the packet-pair technique rather than downloading of a file. This gives an approximate estimate of the throughput but uses less bandwidth compared to the more common file download method.
• It provides a speed guide for comparison • The tests are done with one pre-determined server
Performance Measures
It only measures upload and download speeds.
Drawbacks
• Only two parameters i.e. upload and download speed are provided
• Latency, Jitter, availability and packet loss are not considered • A single pre-determined server is used

26
• Figure 13 Auditmypc speedtest results
Rating
Table 12: Auditmypc Rating
Measure Score Comments Technical merit
Poor Two metrics, single server
Convenience Use: Good Results: Poor
7. Voiptest (http://www.voiptest.org)
Description
• This test measures the quality and performance of Internet connections for Voice over IP by simulating real VoIP sessions between 5 pre-determined servers and the subscriber’s PC
• Total time taken is less than one minute. • The tool is browser based
Performance Measures
It only provides the information regarding latency, upload and download speed, over five different servers located in different continents.

27
Drawbacks
• Only latency, upload speed and download speed, specific to only five servers in the world, are measured
• Jitter, availability and packet loss are not considered
Rating
Table 13: Voiptest Rating
Measure Score Comments Technical merit
Marginal 3 metrics, but few servers
Convenience Use: Good Results: Average
One of the few testers that considers an application (VOIP)
8. BSNL Free Broadband Speed Checker
Description
• This is a tool provided by Dataone Broadband, BSNL to test Dataone connections
• The tool is browser based • Total time taken is less than one minute • The test is done to a local Dataone server • Testing is done with 128 KB of sample data • The measured speed is compared with the speed guide.
• Figure 14 Voiptest.org testing in progress

28
Performance Measures
It only provides the download speed from a specific server in the local region of BSNL, eg. in Kolkata the server is www.calcuttatelephones.com.
Drawbacks
• Only one parameter, download speed from a specific ISP server is provided.
• Upload Speed, Latency, Jitter, availability and packet loss are not considered
Rating
Table 14: BSNL Dataone Tester Rating
Measure Score Comments Technical merit
Poor Single metric, single ISP, single server
Convenience Use: Good Results: Poor
Useful to a BSNL subscriber only
Figure 15 BSNL Dataone broadband speed test results

29
References [AT08] T.A. Gonsalves, R. Thirumurthy and C. Wattegama,
“AshokaTissa Broadband QoSE benchmarking methodology”, TeNeT Group, IIT-Madras and LirneAsia, Colombo, 2008 http://www.lirneasia.net/wp-content/uploads/2008/03/broadband-quality-test-plan1.pdf,
[Dischinger07] M. Dischinger et al., “Characterizing Residential Broadband Networks”, Proc. IMC’07 Internet Measurement Conf., San Diego, USA, pp. 43-56, October 24-26, 2007.
[Fisher] T. Fisher, “Speedtest.net”, About.com: Wireless / Networking, http://pcsupport.about.com/od/toolsofthetrade/gr/speedtestnet.htm
[IETF09] “IP Performance Metrics (ippm)”, IETF Working Group, http://www.ietf.org/dyn/wg/charter/ippm-charter.html, Apr. 2009.
[ITUT03] “IP Packet Transfer And Availability Performance Parameters”, ITU-T Recommendation Y.1540, Nov. 2002.
[Mitchell] B. Mitchell, “Top Internet Speed Test Services”, About.com: Wireless / Networking, http://compnetworking.about.com/od/speedtests/tp/Internet-download-speed-tests.htm
[QoS09] “Quality of service“, Wikipedia, the free encyclopedia, http://en.wikipedia.org/wiki/Quality_of_Service, July 2009
[QoSE09] “Quality of service experience “, Wikipedia, the free encyclopedia, July 2009 http://en.wikipedia.org/wiki/Quality_of_service_experience,