Comparison among different tools for tolerance analysis of ...
9
36 Int. J. Computer Applications in Technology, Vol. 62, No. 1, 2020 Copyright © 2020 Inderscience Enterprises Ltd. Comparison among different tools for tolerance analysis of rigid assemblies Andrea Corrado and Wilma Polini* Department of Civil and Mechanical Engineering, University of Cassino and Southern Lazio, 03043 Cassino, Italy Email: [email protected] Email: [email protected] *Corresponding author Abstract: Tolerance analysis is an important task to design and to manufacture high-precision mechanical assemblies; it has received considerable attention in the literature. Actually there are some different tools used or proposed by the literature to make the tolerance analysis of an assembly, but no one of them is completely and univocally accepted. A comparison between a Computer Aided Tolerancing (CAT) tool for geometry assurance and some methods proposed in the literature is discussed in this work. Therefore, the aim of this work is to solve by a CAT software five case studies that were already solved by different methods. The potentialities and the limits of using a CAT technique for geometry assurance are highlighted. Keywords: geometry assurance; tolerance analysis; computer aided tolerancing. Reference to this paper should be made as follows: Corrado, A. and Polini, W. (2020) ‘Comparison among different tools for tolerance analysis of rigid assemblies’, Int. J. Computer Applications in Technology, Vol. 62, No. 1, pp.36–44. Biographical notes: Andrea Corrado is a young researcher at the University of Cassino and Southern Lazio. He studies the measurement though coordinate measuring machine and the transfer of part geometrical deviations to an assembly product. He closed his PhD program on the tolerance analysis of compliant assemblies in composite material through both a numerical and an experimental approach. Wilma Polini is an Associate Professor at the University of Cassino and Southern Lazio. She studies manufacturing technologies and systems and, in particular, she focuses her research activity on tolerance analysis, inspection by coordinate measuring machine, manufacturing processes for composite materials and stones. She is the author of more than 100 papers in international journals and conferences. 1 Introduction The set of all the activities that minimise the effect of geometrical variation in the final product is called geometry assurance (Söderberg et al., 2016). In the concept phase, the effect of manufacturing variation is tested virtually by means of the available production data in order to analyse different alternative concepts. The robustness of the product concept and the appearance of the product are optimised and then, they are verified by means of statistical tolerance analysis assuming a given production system (Hanyf and Silkam, 2019). The product tolerances are allocated down to the components of the product. In the verification phase the product and the production system are physically tested and verified (Zhu et al., 2019). Adjustments are made to both product and production system to correct errors and prepare full production (Weiqiang et al., 2019). In this phase computer aided inspection planning of coordinate measurement machines and scanning equipment takes place to decide inspection strategies and sensor path. In the production step all needed adjustments are carried out on production processes. Inspection data are collected to control the production. Unclear concepts or tolerances typically cause 60% of all late changes in the development of a new product (Ebro et al., 2014). Late changes involve high costs for a company; therefore, it has a great potential to anticipate the changes in order to prevent failure, by using more robust concepts. In this context, tolerance analysis is a key tool for product and process developers to predict the effects of inevitable part deviations on functional key characteristics of mechanical assemblies and to assess the consequences of variation on product quality (Dantan and Qureshi, 2009; Soderberg et al., 2007). Tolerance analysis is widely used in engineering design to verify the functionality, the manufacturability and the perceived quality of a product. Assembly requirements depend on individual geometric tolerances; it means that assembly requirements and performance vary with the constituent tolerances. The individual tolerances have their own
Transcript of Comparison among different tools for tolerance analysis of ...

36 Int. J. Computer Applications in Technology, Vol. 62, No. 1, 2020
Copyright © 2020 Inderscience Enterprises Ltd.
Comparison among different tools for tolerance analysis of rigid assemblies
Andrea Corrado and Wilma Polini* Department of Civil and Mechanical Engineering, University of Cassino and Southern Lazio, 03043 Cassino, Italy Email: [email protected] Email: [email protected] *Corresponding author
Abstract: Tolerance analysis is an important task to design and to manufacture high-precision mechanical assemblies; it has received considerable attention in the literature. Actually there are some different tools used or proposed by the literature to make the tolerance analysis of an assembly, but no one of them is completely and univocally accepted. A comparison between a Computer Aided Tolerancing (CAT) tool for geometry assurance and some methods proposed in the literature is discussed in this work. Therefore, the aim of this work is to solve by a CAT software five case studies that were already solved by different methods. The potentialities and the limits of using a CAT technique for geometry assurance are highlighted.
Keywords: geometry assurance; tolerance analysis; computer aided tolerancing.
Reference to this paper should be made as follows: Corrado, A. and Polini, W. (2020) ‘Comparison among different tools for tolerance analysis of rigid assemblies’, Int. J. Computer Applications in Technology, Vol. 62, No. 1, pp.36–44.
Biographical notes: Andrea Corrado is a young researcher at the University of Cassino and Southern Lazio. He studies the measurement though coordinate measuring machine and the transfer of part geometrical deviations to an assembly product. He closed his PhD program on the tolerance analysis of compliant assemblies in composite material through both a numerical and an experimental approach.
Wilma Polini is an Associate Professor at the University of Cassino and Southern Lazio. She studies manufacturing technologies and systems and, in particular, she focuses her research activity on tolerance analysis, inspection by coordinate measuring machine, manufacturing processes for composite materials and stones. She is the author of more than 100 papers in international journals and conferences.
1 Introduction
The set of all the activities that minimise the effect of geometrical variation in the final product is called geometry assurance (Söderberg et al., 2016). In the concept phase, the effect of manufacturing variation is tested virtually by means of the available production data in order to analyse different alternative concepts. The robustness of the product concept and the appearance of the product are optimised and then, they are verified by means of statistical tolerance analysis assuming a given production system (Hanyf and Silkam, 2019). The product tolerances are allocated down to the components of the product. In the verification phase the product and the production system are physically tested and verified (Zhu et al., 2019). Adjustments are made to both product and production system to correct errors and prepare full production (Weiqiang et al., 2019). In this phase computer aided inspection planning of coordinate measurement machines and scanning equipment takes place to decide inspection strategies and sensor path. In
the production step all needed adjustments are carried out on production processes. Inspection data are collected to control the production. Unclear concepts or tolerances typically cause 60% of all late changes in the development of a new product (Ebro et al., 2014). Late changes involve high costs for a company; therefore, it has a great potential to anticipate the changes in order to prevent failure, by using more robust concepts.
In this context, tolerance analysis is a key tool for product and process developers to predict the effects of inevitable part deviations on functional key characteristics of mechanical assemblies and to assess the consequences of variation on product quality (Dantan and Qureshi, 2009; Soderberg et al., 2007). Tolerance analysis is widely used in engineering design to verify the functionality, the manufacturability and the perceived quality of a product. Assembly requirements depend on individual geometric tolerances; it means that assembly requirements and performance vary with the constituent tolerances. The individual tolerances have their own
Comparison among different tools for tolerance analysis of rigid assemblies 37
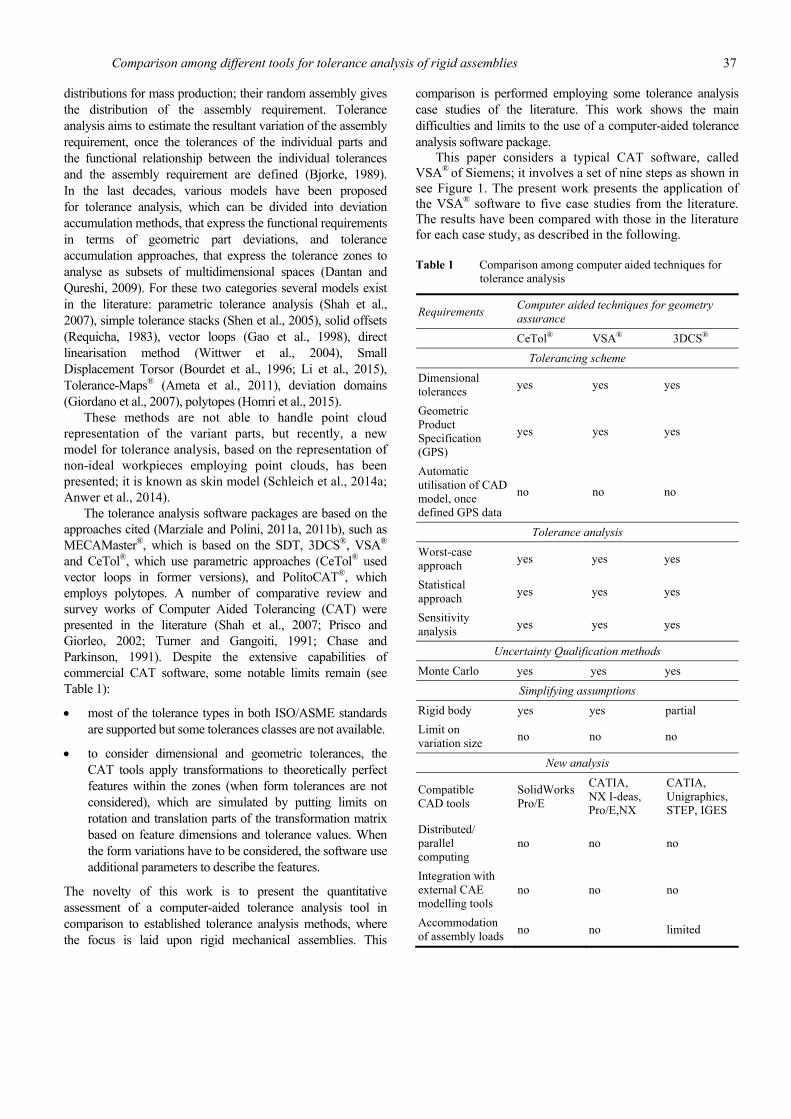
distributions for mass production; their random assembly gives the distribution of the assembly requirement. Tolerance analysis aims to estimate the resultant variation of the assembly requirement, once the tolerances of the individual parts and the functional relationship between the individual tolerances and the assembly requirement are defined (Bjorke, 1989). In the last decades, various models have been proposed for tolerance analysis, which can be divided into deviation accumulation methods, that express the functional requirements in terms of geometric part deviations, and tolerance accumulation approaches, that express the tolerance zones to analyse as subsets of multidimensional spaces (Dantan and Qureshi, 2009). For these two categories several models exist in the literature: parametric tolerance analysis (Shah et al., 2007), simple tolerance stacks (Shen et al., 2005), solid offsets (Requicha, 1983), vector loops (Gao et al., 1998), direct linearisation method (Wittwer et al., 2004), Small Displacement Torsor (Bourdet et al., 1996; Li et al., 2015), Tolerance-Maps® (Ameta et al., 2011), deviation domains (Giordano et al., 2007), polytopes (Homri et al., 2015).
These methods are not able to handle point cloud representation of the variant parts, but recently, a new model for tolerance analysis, based on the representation of non-ideal workpieces employing point clouds, has been presented; it is known as skin model (Schleich et al., 2014a; Anwer et al., 2014).
The tolerance analysis software packages are based on the approaches cited (Marziale and Polini, 2011a, 2011b), such as MECAMaster®, which is based on the SDT, 3DCS®, VSA® and CeTol®, which use parametric approaches (CeTol® used vector loops in former versions), and PolitoCAT®, which employs polytopes. A number of comparative review and survey works of Computer Aided Tolerancing (CAT) were presented in the literature (Shah et al., 2007; Prisco and Giorleo, 2002; Turner and Gangoiti, 1991; Chase and Parkinson, 1991). Despite the extensive capabilities of commercial CAT software, some notable limits remain (see Table 1):
most of the tolerance types in both ISO/ASME standards are supported but some tolerances classes are not available.
to consider dimensional and geometric tolerances, the CAT tools apply transformations to theoretically perfect features within the zones (when form tolerances are not considered), which are simulated by putting limits on rotation and translation parts of the transformation matrix based on feature dimensions and tolerance values. When the form variations have to be considered, the software use additional parameters to describe the features.
The novelty of this work is to present the quantitative assessment of a computer-aided tolerance analysis tool in comparison to established tolerance analysis methods, where the focus is laid upon rigid mechanical assemblies. This
comparison is performed employing some tolerance analysis case studies of the literature. This work shows the main difficulties and limits to the use of a computer-aided tolerance analysis software package.
This paper considers a typical CAT software, called VSA® of Siemens; it involves a set of nine steps as shown in see Figure 1. The present work presents the application of the VSA® software to five case studies from the literature. The results have been compared with those in the literature for each case study, as described in the following.
Table 1 Comparison among computer aided techniques for tolerance analysis
Requirements Computer aided techniques for geometry assurance
CeTol® VSA® 3DCS®
Tolerancing scheme
Dimensional tolerances
yes yes yes
Geometric Product Specification (GPS)
yes yes yes
Automatic utilisation of CAD model, once defined GPS data
no no no
Tolerance analysis
Worst-case approach
yes yes yes
Statistical approach
yes yes yes
Sensitivity analysis
yes yes yes
Uncertainty Qualification methods
Monte Carlo yes yes yes
Simplifying assumptions
Rigid body yes yes partial
Limit on variation size
no no no
New analysis
Compatible CAD tools
SolidWorks Pro/E
CATIA, NX I-deas, Pro/E,NX
CATIA, Unigraphics, STEP, IGES
Distributed/ parallel computing
no no no
Integration with external CAE modelling tools
no no no
Accommodation of assembly loads
no no limited

38 A. Corrado and W. Polini
Figure 1 Flow chart of a computer aided technique for tolerance analysis
2 Case study 1: two pins and a plate
The first case study is a simple assembly where the clearance X between two pins connected to a plate is to be accurately controlled (see Figure 2(a)) (Armillotta, 2016). Geometric tolerances according to ISO standards are specified on the two parts (see Figure 2(b)), showing only dimensions relevant to the problem. The author presents the results of an analytical approach by assuming k = 0.15 and performing a Monte Carlo simulation with 10,000 runs (see Figure 3(a)); they are significantly different from those without the contact errors
(k = 0) that show a clear increase of the ±3σ tolerance range on the requirement (see Figure 3(b)).
The case study has been solved by the VSA® software of Siemens, three measurement operations were defined (see Figure 4), top, bottom and centre respectively. The results of 10,000 runs of simulation are shown in Figure 4. They are significantly different from those due to the analytical approach (Armillotta, 2016); this is probably due to the different way the mating between planes with form deviations is simulated: Armillotta finds probably the minimum distance among the planes in contact.
Figure 2 First-case study: a) assembly, b) toleranced parts
Source: Armillotta, 2016

Comparison among different tools for tolerance analysis of rigid assemblies 39
Figure 3 Distribution of the assembly requirement: a) with contact errors, b) without contact error
Figure 4 Measurements of CAT software on the first-case study
Figure 5 Results of the CAT simulations on the first-case study
40 A. Corrado and W. Polini
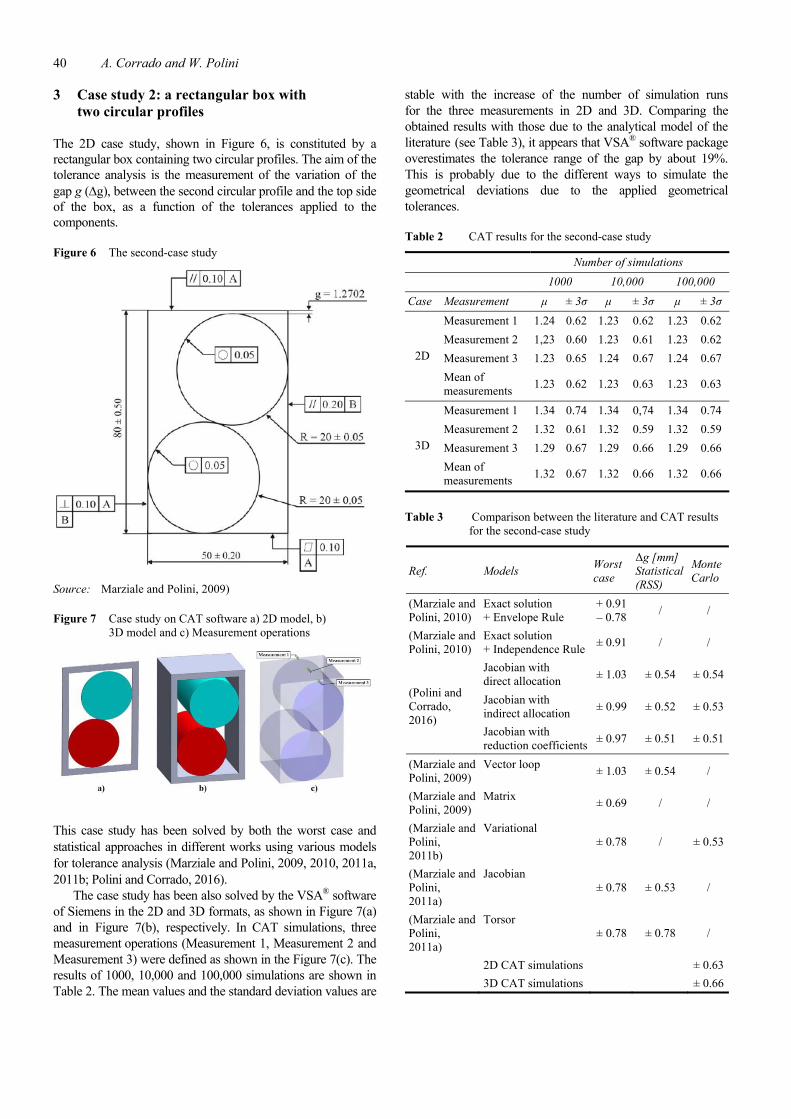
3 Case study 2: a rectangular box with two circular profiles
The 2D case study, shown in Figure 6, is constituted by a rectangular box containing two circular profiles. The aim of the tolerance analysis is the measurement of the variation of the gap g (g), between the second circular profile and the top side of the box, as a function of the tolerances applied to the components.
Figure 6 The second-case study
Source: Marziale and Polini, 2009)
Figure 7 Case study on CAT software a) 2D model, b) 3D model and c) Measurement operations
This case study has been solved by both the worst case and statistical approaches in different works using various models for tolerance analysis (Marziale and Polini, 2009, 2010, 2011a, 2011b; Polini and Corrado, 2016).
The case study has been also solved by the VSA® software of Siemens in the 2D and 3D formats, as shown in Figure 7(a) and in Figure 7(b), respectively. In CAT simulations, three
measurement operations (Measurement 1, Measurement 2 and Measurement 3) were defined as shown in the Figure 7(c). The results of 1000, 10,000 and 100,000 simulations are shown in Table 2. The mean values and the standard deviation values are
stable with the increase of the number of simulation runs for the three measurements in 2D and 3D. Comparing the obtained results with those due to the analytical model of the literature (see Table 3), it appears that VSA®
software package
overestimates the tolerance range of the gap by about 19%. This is probably due to the different ways to simulate the
geometrical deviations due to the applied geometrical tolerances.
Table 2 CAT results for the second-case study
Number of simulations
1000 10,000 100,000
Case Measurement μ ± 3σ μ ± 3σ μ ± 3σ
2D
Measurement 1 1.24 0.62 1.23 0.62 1.23 0.62
Measurement 2 1,23 0.60 1.23 0.61 1.23 0.62
Measurement 3 1.23 0.65 1.24 0.67 1.24 0.67
Mean of measurements
1.23 0.62 1.23 0.63 1.23 0.63
3D
Measurement 1 1.34 0.74 1.34 0,74 1.34 0.74
Measurement 2 1.32 0.61 1.32 0.59 1.32 0.59
Measurement 3 1.29 0.67 1.29 0.66 1.29 0.66
Mean of measurements
1.32 0.67 1.32 0.66 1.32 0.66
Table 3 Comparison between the literature and CAT results for the second-case study
Ref. Models Worst case
Δg [mm] Statistical (RSS)
Monte Carlo
(Marziale and Polini, 2010)
Exact solution + Envelope Rule
+ 0.91 – 0.78
/ /
(Marziale and Polini, 2010)
Exact solution + Independence Rule
± 0.91 / /
(Polini and Corrado, 2016)
Jacobian with direct allocation
± 1.03 ± 0.54 ± 0.54
Jacobian with indirect allocation
± 0.99 ± 0.52 ± 0.53
Jacobian with reduction coefficients
± 0.97 ± 0.51 ± 0.51
(Marziale and Polini, 2009)
Vector loop ± 1.03 ± 0.54 /
(Marziale and Polini, 2009)
Matrix ± 0.69 / /
(Marziale and Polini, 2011b)
Variational ± 0.78 / ± 0.53
(Marziale and Polini, 2011a)
Jacobian ± 0.78 ± 0.53 /
(Marziale and Polini, 2011a)
Torsor ± 0.78 ± 0.78 /
2D CAT simulations ± 0.63
3D CAT simulations ± 0.66

Comparison among different tools for tolerance analysis of rigid assemblies 41
4 Case study 3: two blocks
This case study, presented in Schleich et al. (2014a, 2014b), consists of two parts, where the second part is assembled on the first part as shown in Figure 8. In order to ensure that the resulting gap between parts lies within some pre-defined requirements, flatness deviations of the mating surfaces and the measurement surfaces as well as perpendicularity and position tolerances are assigned to the parts as shown in Figure 8.
Figure 8 The third-case study
Source: Schleich et al., 2014a, 2014b
Moreover, the aim of this case study is the evaluation of the effects of different assembly sequences on the gap between the parts. Two cases are examined, as shown in Figure 9; in the first case, the contact between parts is in the y-direction and then in the x-direction; in the second case, the contact between parts is in the x-direction and then in the y-direction.
The gap was measured as the distance between the central points of both parts’ plane features. The results are shown in Figure 10. The influence of the assembly sequence is negligible because of the comparably small part deviations. Moreover, a mean shift of the distributions for the functional requirement between the VSA® software of Siemens and the Skin Model Shape approach is observed.
Possible explanations for this result are the incomplete consideration of form deviations in the VSA® software.
However, since the algorithms implemented in the VSA®
software are presented as a black-box to the designers and researchers, it is impossible to clearly identify the underlying reasons for the slight differences results between both tools.
Figure 9 Assembly sequences: a) Case 1, b) Case 2
Figure 10 Results for the third-case study
5 Case study 4: the centring pin mechanism
The centring pin mechanism, shown in Figure 11, was presented (Ghie, 2010). The mechanism featured three parts with a functional condition called “FR”. The purpose of this example is to explore the only functional condition where the designer specified an FR of ± 0.5mm.
The case study has been also solved by the VSA® software of Siemens by using 500 runs and the obtained results are shown in Figure 12 in comparison with those due to the Jacobian-torsor model. It is evident how the VSA® software gives a mean value of FR smaller than that due to the Jacobian-torsor model. Moreover, the dispersion of the results are smaller too. Even in this case the explanation is probably in the way to simulate the geometrical tolerances.

42 A. Corrado and W. Polini
Figure 11 The fourth-case study
Source: Ghie, 2010
Figure 12 Results for the fourth-case study
6 Case study 5: the rotary assembly
The rotary assembly, shown in Figure 13, is composed of two shafts and one frame, which is a typical structure used in CNC rotary tables (Weihua and Zhenqiang, 2013). The part marked with the reference A is the working shaft, and the short part assembled with the bore in the frame is called the orientation shaft. The two shafts and the frame form a rotary assembly. Two flange planes of the shafts and two end faces of the frame form the plane fittings. The functional requirements are the radial rotary errors of the
working shafts relative to the common axis of two bores in the frame. The radial rotation errors have been obtained through Jacobian-torsor model after 1000 simulations. Figure 14 shows the probability of the components of radial rotation error along the z- and y-directions. Owing the symmetry structure of the rotary assembly, the mean value of the radial rotation error is zero. The results obtained through VSA® software of Siemens are slightly smaller than those due to the Jacobian-torsor model both for the mean and the standard deviation values of the probability of radial rotation error.

Comparison among different tools for tolerance analysis of rigid assemblies 43
Figure 13 The fifth-case study
Source: Weihua and Zhenqiang, 2013)
Figure 14 Radial rotation error: a) the component along z-direction, b) the component along y-direction
(a) (b)
7 Results discussion and conclusions
Many tools for tolerance analysis exist; they are software packages that allow to assure the geometry of the assembly product by analysing the geometrical interferences. The present work shows the application of one of these tools for tolerance analysis, known as VSA® by Siemens, to four case studies from the literature. The results due to the application of the VSA® software are sometimes different from those due to all of the four methods of the literature for many reasons. The CATs for tolerance analysis have a 3-D nature and they
are not able to consider 1D or 2D case studies. They are not able to simulate a form tolerance according to international standard for GPS, or more tolerances applied to the same surface, or assembly constraints refers to actual assembly operations. This paper demonstrates how computer aided technologies for tolerance analysis need further knowledge of the assembly problems and further development. More efforts are needed to clarify the limits and the potentialities of the computer-aided software packages for tolerance analysis in order to better define their domain of applicability.

44 A. Corrado and W. Polini
Acknowledgements
This research was partially funded by Ministry of Italian University and Research (MIUR).
Reference
Ameta, G., Serge, S. and Giordano, M. (2011) ‘Comparison of spatial math models for tolerance analysis: tolerance-maps, deviation domain, and TTRS’, Journal of Computing and Information Science in Engineering, Vol. 11, pp.021004–021004.
Anwer, N., Schleich, B., Mathieu, L. and Wartzack, S. (2014) ‘From solid modelling to skin model shapes: shifting paradigms in computer-aided tolerancing’, CIRP Annals – Manufacturing Technology, Vol. 63, pp.137–140.
Armillotta, A. (2016) ‘Tolerance analysis considering form errors in planar datum features’, Procedía CIRP, Vol. 43, pp.64–69.
Bjorke, O. (1989) Computer Aided Tolerancing, ASME Press, New York.
Bourdet, P., Mathieu, L., Lartigue, C. and Ballu, A. (1996) ‘The concept of the small displacement torsor in metrology’, Series on Advances in Mathematics for Applied Sciences, Vol. 40, pp.110–122.
Chase, K.W. and Parkinson, A.R. (1991) ‘A survey of research in the application of tolerance analysis to the design of mechanical assemblies’, Research in Engineering Design, Vol. 3, pp.23–37.
Dantan J-Y. and Qureshi, A-J. (2009) ‘Worst-case and statistical
tolerance analysis based on quantified constraint satisfaction
problems and Monte Carlo simulation’, Computer-Aided Design, Vol. 41, pp.1–12.
Ebro, M., Olesen, J. and Howard, T.J. (2014) ‘Robust design impact metrics: measuring the effect of implementing and using robust design’, Proceedings of the 1st International Symposium on Robust Design, pp.1–9.
Gao, J., Chase, K.W. and Magleby, S.P. (1998) ‘Generalized 3-D tolerance analysis of mechanical assemblies with small kinematic adjustments’, IIE Transactions, Vol. 30, pp.367–377.
Ghie, W. (2010) Tolerance Analysis Using Jacobian-Torsor Model: Statistical and Deterministic Applications, INTECH Open Access Publisher.
Giordano, M., Samper, S. and Petit, J-P. (2007) ‘Tolerance analysis and synthesis by means of deviation domains, axi-symmetric cases’, in Davidson, J. (ed.): Proceedings of the Models for Computer Aided Tolerancing in Design and Manufacturing, Springer, pp.84–94.
Hanyf, Y. and Silkan, H. (2019) ‘A fast and scalable similarity search in high-dimensional image datasets’, International Journal of Computer Applications in Technology, Vol. 59, No. 1, pp.95–104.
Homri, L., Teissandier, D. and Ballu, A. (2015) ‘Tolerance analysis by polytopes: taking into account degrees of freedom with cap half-spaces’, Computer-Aided Design, Vol. 62, pp.112–130.
Li, H., Zhu, H., Li, P. and He, F. (2014) ‘Tolerance analysis of mechanical assemblies based on small displacement torsor and deviation propagation theories’, The International Journal of Advanced Manufacturing Technology, Vol. 72, pp.89–99.
Marziale, M. and Polini, W. (2009) ‘A review of two models for tolerance analysis of an assembly: vector loop and matrix’, The International Journal of Advanced Manufacturing Technology, Vol. 43, pp.1106–1123.
Marziale, M. and Polini, W. (2010) ‘Tolerance analysis: a new model based on variational solid modelling’, Proceedings of the ASME 10th Biennial Conference on Engineering Systems Design and Analysis, pp.383–392.
Marziale, M. and Polini, W. (2011a) ‘A review of two models for tolerance analysis of an assembly: Jacobian and torsor’, International Journal of Computer Integrated Manufacturing, Vol. 24, pp.74–86.
Marziale, M. and Polini, W. (2011b) ‘Review of variational models for tolerance analysis of an assembly’, Proceedings of the Institution of Mechanical Engineers, Part B: Journal of Engineering Manufacture, Vol. 225, pp.305–318.
Prisco, U. and Giorleo, G. (2002) ‘Overview of current CAT systems: Review Article’, Integrated Computer Aided Engineering, Vol. 9, pp.373–387.
Polini, W. and Corrado, A. (2016) ‘Geometric tolerance analysis through Jacobian model for rigid assemblies with translational deviations’, Assembly Automation, Vol. 36, pp.72–79.
Requicha, A.G. (1983) ‘Toward a theory of geometric tolerancing’, The International Journal of Robotics Research, Vol. 2, pp.45–60.
Schleich, B., Anwer, N., Mathieu, L. and Wartzack, S. (2014a) ‘Skin model shapes: a new paradigm shift for geometric variations modelling in mechanical engineering’, Computer-Aided Design, Vol. 50, pp.1–15.
Schleich, B., Anwer, N., Zhu, Z., Qiao, L., Mathieu, L. and Wartzack, S. (2014b) ‘Comparative study on tolerance analysis approaches’, Proceedings of the International Symposium on Robust Design (ISoRD’14), pp.29–39..
Shah, J.J., Ameta, G., Shen, Z. and Davidson, J. (2007) ‘Navigating the tolerance analysis maze’, Computer-Aided Design and Applications, Vol. 4, pp.705–718.
Shen, Z., Ameta, G., Shah, J.J. and Davidson, J.K. (2005) ‘A comparative study of tolerance analysis methods’, Journal of Computing and Information Science in Engineering, Vol. 5, pp.247–256.
Soderberg, R., Lindkwist, L. and Dahlstrom, S. (2007) ‘Computer-aided robustness analysis for compliant assemblies’, Journal of Engineering Design, Vol. 17, pp. 411–428.
Söderberg, R., Lindkvist, L., Wärmefjord, K. and Carlson, J.S. (2016) ‘Virtual geometry assurance process and toolbox’, Procedia CIRP, Vol. 43, pp.3–12.
Turner, J.U. and Gangoiti, A. (1991) ‘Tolerance analysis approaches in commercial software’, Concurrent Engineering, Vol. 1, pp.11–23.
Zhu, L., Zhou, Y., Wang, Z. and Liu, Y. (2019) ‘A novel control for MDF continuous hot-pressing accurate tracking: adaptive fuzzy approach’, International Journal of Computer Applications in Technology, Vol. 159, No. 2, pp.175–184.
Weihua, N. and Zhenqiang, Y. (2013) ‘Integrating cylindricity error into tolerance analysis of precision rotary assemblies using Jacobian-Torsor model’, Proceedings of the Institution of Mechanical Engineers, Part C: Journal of Mechanical Engineering Science, Vol. 227, pp.2517–2530.
Weiqiang, L., Rencheng, Z., Defeng, W., Wanneng, Y. and Kai, Y. (2019) ‘Multi-objective optimisation of ship microgrid research based on priority selective control strategy of diesel generator and energy storage’, International Journal of Computer Applications in Technology, Vol. 59, No. 3, pp.193–204.
Wittwer, J.W., Chase, K.W. and Howell, L.L. (2004) ‘The direct linearization method applied to position error in kinematic linkages’, Mechanism and Machine Theory, Vol. 39, pp.681–693.