Ch. 26 Comparing Economic Systems Section 2 Economic Systems.

Alexandre Cunha,1 Diana Sawyer, José Monteiro da Silva, Luca Lazzarini, Marília Rocha, Tamara Santos, Vinícius Vaz Nogueira and Mariana Hoffmann2
Comparing international Iabour law systems: a methodology for country profiles
This monograph describes the process for selecting five countries which, along with Brazil, will be the subject of an international comparative study regarding labour justice. The process involves clustering 71 countries with certain socio-economic conditions, different models of state organisation and governance, and different labour law systems.
The Grade of Membership (GoM) model was used to cluster the categories of 39 variables into three extreme profiles according to the associations among them, as follows:
y profile 1, with a high level of socio-economic development, well-established rule of law and flexible labour laws;
y profile 2, with an intermediate level of socio-economic development, precarious rule of law and labour laws with a moderate to high level of workers’ protection; and
y profile 3, with a low level of socio-economic development, precarious rule of law and a low level of protection for workers.
The model also estimated the proximity or the grade of membership of each of the countries to the three profiles according to the similitude of the characteristics of the country to the respective profiles. This procedure allowed the classification of those countries with characteristics of more than one profile—for example, those countries that predominantly have features of profile 1, some proximity to profile 2 and none of the characteristics of profile 3, possibly those countries recently achieving a high level of development but still retaining some characteristics of the intermediate profile.
1 IntroductionThis monograph is part of a project with a broader scope, ‘Strengthening the Production and Management of Information related to Labour Law to Increase Understanding and Improve the Brazilian Justice System’.3 One of the objectives of the project is to perform a descriptive international comparative analysis of labour justice systems. Six case studies, including Brazil, will be produced to understand how labour disputes are processed and judged by the judicial system in different contexts. The first stage of the study is, therefore, to select international cases based on criteria that allow different socio-economic realities, legal structures and degrees of labour litigiousness. To cover those three criteria, a set of 39 variables representing socio-economic conditions, the labour market and labour law were chosen from 71 countries around the world.
The selection process comprised the following steps:
y determine three extreme profiles4 of associated categories of variables in the study, by estimating the probability that a category of a variable will be characteristic of a given profile, through a fuzzy model of GoM (Manton et al. 1994);
y simultaneously, the model estimated the proximity or the grade of membership of each country to each of the profiles, according to the similitude of the characteristics of the country to the set of characteristics of those profiles;
y classification of the countries according to the grades of membership to the three profiles; and
y an external collegiate selection of five countries based on the criterion of degrees of similitude to the characteristics of Brazil.
After the current section 1, section 2 presents the main elements of fitting the model. It presents the model and the Likelihood Function as well as the equations for estimating the parameters and the data used in the model, comprising description of the 39 variables as well as the procedure for their categorisation. Section 3 refers to the outcomes of the model, more specifically the characteristics of the profiles and the classification of the countries according to their grade of membership to the extreme profiles, and section 4 presents the criteria for
The International Policy Centre for Inclusive Growth is jointly supported by the United Nations Development Programme and the Government of Brazil.
research brief
ISSN 2358-1379 February 202065

2 International Policy Centre for Inclusive Growth
the selection of the five countries. Section 5 then presents final considerations regarding the methodology and its full potential.
2 Fitting the Grade of Membership model2.1 The modelThe GoM model was chosen because, compared to other non-fuzzy clustering models, it allows more flexibility in the classification of the countries, since each country presents a set of three degrees of membership, relative to each of the extreme profiles in the model, permitting a classification with characteristics of a mixture of the defined profiles. It also has the advantage of providing a better fit for a larger number of variables than would have been possible in other crisp multivariate models.5
The following elements and conditions are keys to define the model, through 39 indicators or variables for 71 countries and 3 extreme profiles.
I: index of countries in the model (i = 1, ..., 71)
J: index of indicators/variables (j = 1, ..., 39)
L: index of response categories of the variable (l = 1, ..., Lj)
Xijl: a binary variable that indicates the observation of response/category L of the variable J in country I. It takes on the value of 1 if category L is observed in the country, and 0 otherwise. The main assumption is that the observed categories are independent for different indicators and countries.
K: index of extreme profiles in the model (predefined) (k = 1, ..., 3);
λkjl: probability of a response category L of J being in the extreme profile K;
Under the conditions: λkjl ≥ 0 and �𝐿𝑗
𝑙=1
𝜆𝑘𝑗𝑙 λkjl = 1
gik: grade of membership of country I to extreme profile K according to its similitude.
Under the conditions gik ≥ 0 and �𝑔𝑖𝑘𝑘
=1, i=1, ... , N
The objective of fitting the model is to estimate the parameters λkjl and gik. The former will delineate the extreme profiles, and the latter will classify the countries according to the proximity to the extreme profiles.
Those parameters can be estimated by likelihood functions using either of the three assumptions: 1) treating gik as fixed and unknown; 2) treating gik as realisations of random variables following some distribution; and 3) eliminating the gik parameters from likelihood, considering the conditional distribution, given sufficient statistics, as long as these exist. The first two are estimated by methods of maximum joint and marginal likelihood, and the third technique is estimated by the method of maximum conditional likelihood (Erosheva 2002). In this analysis, the parameters were estimated by the method of maximum joint likelihood, based on algorithms implemented in the sirt package for the R statistical computing software (Robitzsch 2019).
Considering the random binary variable Xijl with values 0 and 1, and given that xijl = 1 if country I responds to indicator J in category L, then the probabilities of response to extreme profiles, denoted by λkjl , are the response probabilities to category L for indicator J by a member belonging completely to the k-th extreme profile ( 𝜆𝑘𝑗𝑙 = 𝑃𝑟(𝑥𝑖𝑗𝑙 = 1|𝑔𝑖𝑘 = 1�). Thus,
𝑃𝑟(𝑥𝑖𝑗𝑙 = 1|𝑔𝑖) = �𝑔𝑖𝑘
𝐾
𝑘=1
. 𝜆𝑘𝑗𝑙
and the likelihood function to be maximised is given by
𝐿(𝛌,𝐠|𝑥) = ���(𝑙𝑗𝑖
�𝑔𝑖𝑘𝑘
𝜆𝑘𝑗𝑙 ) 𝑥𝑖𝑗𝑙 ,
in which λ = {λkjl: k=1, ..., K, j=1, ..., J, l=1, ..., Lj} are the category parameters, g= {gik: i=1, ..., I, k=1, ..., K} are the country parameters, and x= {xijl: i=1, ..., N, j=1, J, l=1, Lj} are answers observed for all countries (Manton et al. 1994).
The solution for gik and λkjl can be found by equating the first-order derivative of L(λ, g|x) related to gik and λkjl to 0, subject to the restrictions of 0 ≤ gik ≤ 1 and 0 ≤ λkjl ≤ 1. A set of parameters (gik, for example) is estimated initially, maintaining the other constant (λkjl) and, therefore, obtaining an iterative estimation (Guedes et al. 2016).
The parameter estimation equations are given by
𝑔𝑖𝑘� =1
𝑦𝑖++��𝑥𝑖𝑗𝑙
𝐿
𝑙=1
𝐼
𝑖=1
𝑔𝑖𝑘 ∗ 𝜆𝑘𝑗𝑙∗
𝑝𝑖𝑗𝑙 e
𝜆𝑘𝑗𝑙� =∑ 𝑥𝑖𝑗𝑙𝐼𝑖=1
𝑔𝑖𝑘∗ 𝜆𝑘𝑗𝑙∗
𝑝𝑖𝑗𝑙
∑ 𝑥𝑖𝑗+𝐼𝑖=1 ∑
𝑔𝑖𝑘 ∗ 𝜆𝑘𝑗𝑙∗
𝑝𝑖𝑗𝑙𝐿𝑖𝑗𝑖=1
,
where 𝑦𝑖++ = ��𝑦𝑖𝑗𝑙𝑖𝑗
and 𝑝𝑖𝑗𝑙 = �𝑔𝑖𝑘∗
𝑘
𝜆𝑘𝑗𝑙∗
(Manton et al. 1994).
2.2 Data, variables and categoriesDimensions in the modelTo delimit the country profiles, indicators were defined, subdivided into 10 dimensions: 1) demographic; 2) education; 3) health; 4) income; 5) labour market; 6) productive sector; 7) work relations; 8) state governance; 9) judicial system; and 10) labour law. Appendix A presents the indicators with their respective dimensions, descriptions, categories and data sources.
Dimensions 1, 2, 3 and 4 cover countries’ social and economic aspects—such as dependency rates for youth and elderly people, life expectancy, Gini index and years of schooling, among others—which were included to distinguish the countries’ different stages of demographic transition and the distinct life situations of their populations. Indicators in dimensions 5, 6 and 7 deal specifically with the countries’ labour market measures, such as the main productive sectors for jobs and unemployment rates, among others. These dimensions are used to delimit countries according to their most predominant economic activities, the composition of the employed population and the prevalence of different work relations. Dimension 8 describes the State’s organisational model (federal, unitary or other), and dimension 9 covers aspects related to the rule of law and the State’s level of fragility,6 as well as the countries’ legal tradition.
and

Policy Research Brief 3
Finally, dimension 10 takes into consideration, through specific indicators, five areas of labour law: work relations and different forms of employment (including the regulation of the legal form of different parties and rules related to part-time, fixed-term and outsourced work); laws regarding the duration of working time (daily and weekly); rules and procedures for laying off workers; laws governing workers’ representation; and laws concerning collective action. A total of 39 indicators were elaborated and/or gathered, as can be seen in Appendix A.
The reference periodTo maximise the availability of information in the data set, we have considered data within the period 2013–2020 for all indicators, taking the most recent year or the year with the fewest missing data as the source of information. The year 2020 was used for some estimated International Labour Organization (ILO) indicators.
The number of countries in the modelThere was an initial list of 235 countries, with population volume estimated by the United Nations Population Division (UN DESA 2019). Using population size as a cut-off point, countries with a population above the median global population (5.38 million) were selected.7 Of the 120 remaining countries, those with a Fund for Peace Fragile States Index over 90 (those on alert, high alert and very high alert) and non-secular States were removed (Fund for Peace 2019). Finally, States not recognised as countries by the United Nations were also removed. After these filters were applied, a list of 86 countries remained. However, 15 of these countries did not present data for all indicators of the labour law dimension, which hindered estimates of the extreme profiles of the model. Therefore, we have opted to exclude them from the analysis, and the final list comprises 71 countries.
Categorisation of variablesThe fitting of the GoM model (Manton et al. 1994) requires categorical variables as inputs. All indicators, except those of dimension 10 (labour law), for which the selected variables were already of a categorical nature or which had some sort of categorisation pre-established by the institution responsible for the data compilation, kept their initial standard. On the other hand, the selected continual variables were evaluated according to several aspects. The quartiles of the variables were analysed, and groupings were implemented using Euclidean distance.8 From these two strategies, each categorised variable was evaluated individually, and their cut-off values were rounded and established ad hoc, to maintain a degree of consistency in terms of each country’s belonging to each category and avoiding categories with a small number of countries.
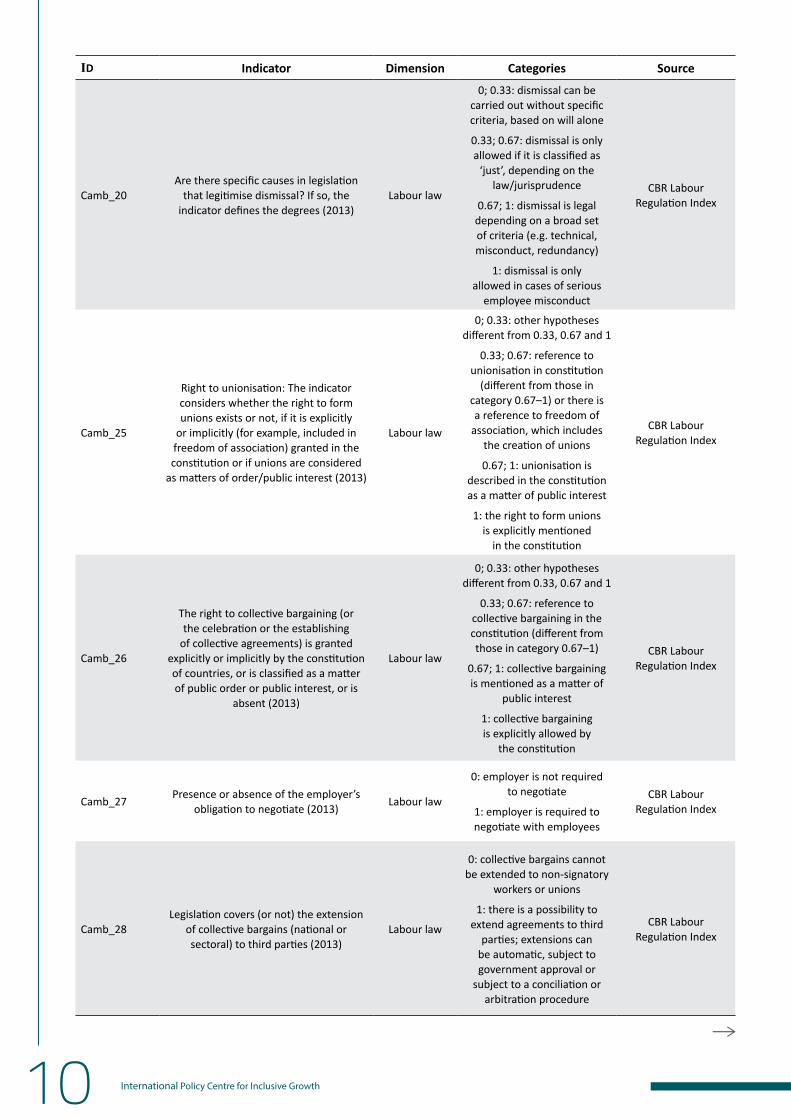
Regarding indicators of dimension 10 (labour law)—whereby, from a general perspective, the value 0 represents little to no worker protection and 1 represents considerable or maximum worker protection. The source of those data was the Cambridge (CBR) Labour Regulation Index. These indicators, referred to in Appendix A (Camb_n), were categorised as:
y Camb_4, 27, 28, 32, 35 and 39 indicators: Seeking to allow for a comparison of the evolution of legislation in a given country
across time, these indicators attribute values from 0 to 1. Therefore, values within the [0; 0.5] interval are considered 0, and values in the [0.5; 1] interval are considered 1. A qualitative analysis is performed for values equal to 0.5, depending on the case, for the 2013 legislation, and afterwards the value from 0 to 1 is attributed to the country.
y Camb_14 and 15 indicators: Values are normalised on a scale of 0 to 1 and then categorised in intervals of 0.25.
y Camb_1, 2, 5, 7, 19, 20, 25 and 26: Each indicator is divided into three or four categories, and the values attributed by the Cambridge Index to each category were maintained.
3 Outcomes3.1 Determining extreme profilesOnce the parameters gik and λkjl are estimated, the defining characteristics of each profile are established by the comparison between the λkjl values and the marginal frequencies of l responses to the j - fmjl indicators. Therefore, the l category is considered a marker for the k profile when the values for λkjl are equal to or higher than the respective marginal frequency in 50 per cent of indicators, or 𝜆𝑘𝑗𝑙 𝑓⁄ 𝑚𝑗𝑙 ≥ 1.50 . The extreme profiles could be described as:
y Profile 1: High/medium level of elderly age-dependency rate; high proportion of the population with tertiary education; high ratio of gross domestic product (GDP) originating from labour income; reduced weekly working hours; not following procedural layoff procedures is one of the criteria used to define a layoff as unfair; part-time workers have the same rights as full-time workers; unionisation is described in the constitution as a matter of public interest; employers do not have bargaining obligations; conciliation between employer and employee is not mandatory; workers with fixed-term contracts have the same rights as full-time workers; low rate of people employed in family businesses; low rate of autonomous workers; low Gini index; high gross national income (GNI); very high life expectancy; and high proportion of employees in the service sector
y Profile 2: Low level of elderly dependency; moderate proportion of the population with tertiary education; low ratio of GDP originating from labour income; workers’ legal status defined by law; collective bargaining is expressly permitted by the constitution; there are restrictions on establishing fixed-term contracts; average proportion of autonomous workers; high Gini index; average to high GNI; high life expectancy; and high proportion of employees in the industry sector
y Profile 3: High level of youth dependency and extremely low elderly dependency; extremely low proportion of the population with tertiary education; high ratio of the economically active population in the workforce; very low ratio of GDP originating from labour income; high weekly working hours; part-time workers do not have the same rights as full-time workers; layoffs are permitted only if considered ‘fair’, depending on jurisprudence/law; the law does not impose restrictions

4 International Policy Centre for Inclusive Growth
on fixed-term work contracts; and fixed-term workers do not enjoy the same rights as full-time workers.
Classification of countries by grade of membership to extreme profilesWith the profiles thus determined, the groups of countries were formed according to cut-offs defined for the value of the grade of membership to the extreme profile (gik). For (gik) values above 0.65, the country was considered as belonging to the group with the characteristics of the k extreme profile in question. The remaining countries were classified in mixed groups, based on values of grades of membership to the other extreme profiles.
Therefore, 54 countries were classified in groups with extreme profiles. The groups and respective countries, in order of grade of membership to the group, are:
y Group 1: Countries with a high level of socio-economic development, well-established rule of law and some degree of flexibility in labour laws: Australia, Austria, Belgium, Canada, Switzerland, Germany, Denmark, Finland, France, United Kingdom, Netherlands, Sweden, United States, Spain, Hungary, Slovakia, New Zealand, Czech Republic, Singapore, Portugal, Italy, South Korea, Bulgaria and Poland
y Group 2: Countries with an intermediate level of socio-economic development, fragile rule of law and labour laws with a moderate to high level of workers’ protection: Brazil, Algeria, Ecuador, Mexico, Paraguay, Tunisia, Turkey, Venezuela, Dominican Republic, Argentina, Serbia, Kazakhstan, Colombia, Kyrgyzstan, Thailand, Malaysia, Romania, Nicaragua, Bolivia and Chile
y Group 3: Countries with a low level of socio-economic development, fragile rule of law and low workers’ protection: India, Rwanda, Tanzania, Zambia, Bangladesh, Angola, Ghana, Senegal and Cambodia.
Seventeen of the 71 countries did not have a grade of membership above 0.65 for any of the three profiles. These were categorised in mixed groups:
y 1-2 mixed groups: Cuba (g1 > g2), Greece (g1 > g2), Russia (g1 > g2), Uruguay (g1 > g2), Belarus (g1 < g2) and Ukraine (g1 = g2)
y 1-3 mixed groups: China (g1 > g3), Egypt (g1 > g3), Sri Lanka (g1 > g3), Peru (g1 > g3), Philippines (g1 > g3), Honduras (g1 < g3), Indonesia (g1 < g3), Morocco (g1 < g3), Viet Nam (g1 < g3) and Azerbaijan (g1 = g3)
y 1-2-3 mixed groups: South Africa.
y Coherent results can be noted by analysing the resulting groupings and the characteristics of each group. This is also evident when a certain geographic proximity is noted. For example, countries in group 1 are concentrated in Europe, except for Australia, New Zealand, Singapore and the United States; those in group 2 are concentrated in Latin America, with a few in Eastern
Europe and East Asia; and countries in group 3 are concentrated in Africa and Asia.
4 Countries chosen for the case studyThe GoM score for profile 2 for Brazil was 0.998, meaning a very high adherence to the characteristics of the extreme profile.
It is worth stressing that data for indicators of labour law (dimension 10) are only up to date until 2013. This means that, in the case of Brazil, this indicator does not reflect the changes implemented in the 2017 labour reform.
The rise of flexible forms of work has gained increased attention from governments, companies and workers’ organisations in recent years. The increased flexibility of the labour market came about in tandem with changes to the global organisation of production, liberalisation of commerce, processes of economic restructuring and legislative reform. It is believed that this trend will increase competitiveness in increasingly technological markets in a constant state of flux. Flexibility is often understood as opposing ‘rigidity’ in labour, which is characterised by protective legislation, with collective bargaining agreements and a clear definition of labour in law. The 2017 labour reform in Brazil fits this trend (see Krein, Gimenez, and Santos 2018 and Carvalho 2017).
Therefore, the incorporation of changes originating from the 2017 reform of Brazilian legislation could alter the results obtained, bringing the country’s labour law closer to practices in countries in group 1.
The main criterion for the selection of the five countries was to have GoM scores representing characteristics in a continuum between profiles 1 and 2. The final selection was made in discussion with peers, as follows:
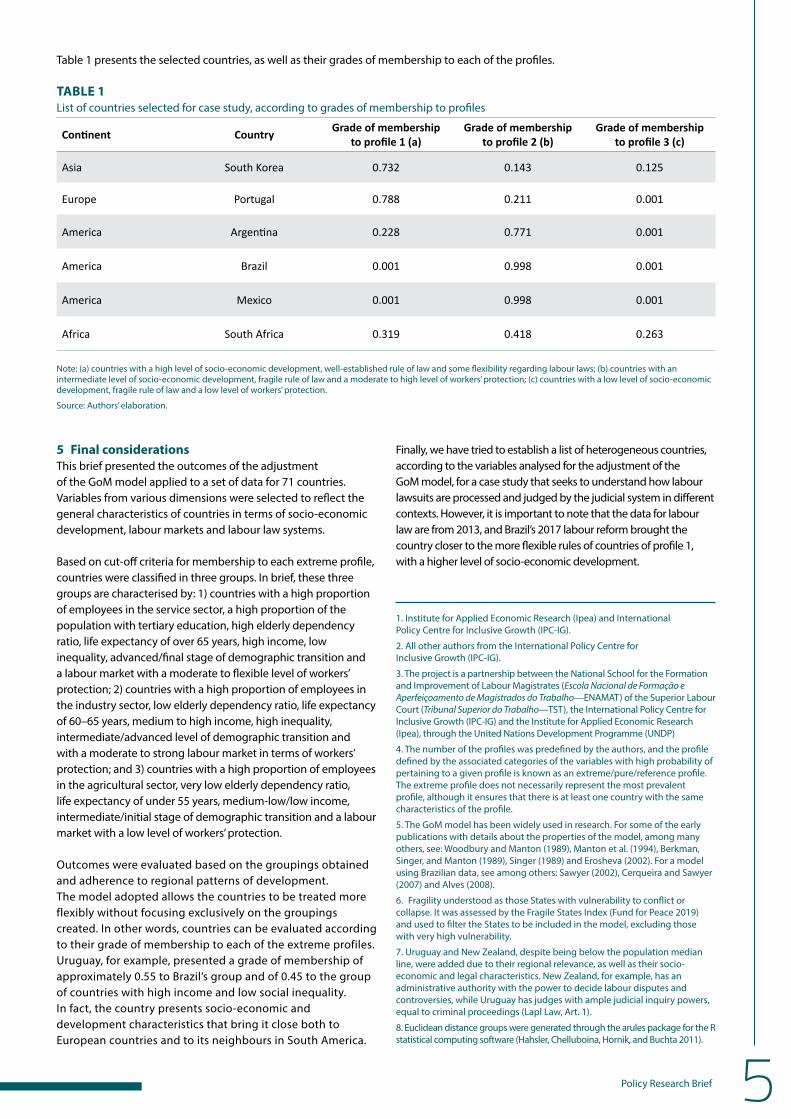
y two countries with grades of membership above 0.70 to profile 1 and which share some characteristics with other profiles: South Korea, with grades of membership to profiles 1, 2 and 3: 0.732, 0.143 and 0.125, respectively, and Portugal, with grades of membership of 0.788, 0.211 and 0.001, respectively. These countries represent countries in transition from intermediate socio-economic development to high socio- economic development;
y two countries with a high grade of membership (0.998) to profile 2: Mexico and Brazil, which are very similar to the extreme profile, representing countries in an intermediate state of socio-economic development;
y one country with intermediate socio-economic development which also shares some characteristics with countries with high socio-economic development: Argentina, with grades of membership of 0.771 and 0.228, respectively, to profiles 2 and 1; and
y one country without predominating characteristics, or in other words, with grades of membership equally distributed among the three profiles: South Africa, with grades of membership of 0.319, 0.418 and 0.263 to profiles 1, 2 and 3, respectively.
Policy Research Brief 5
Table 1 presents the selected countries, as well as their grades of membership to each of the profiles.
TABLE 1List of countries selected for case study, according to grades of membership to profiles
Continent Country Grade of membership to profile 1 (a)
Grade of membership to profile 2 (b)
Grade of membership to profile 3 (c)
Asia South Korea 0.732 0.143 0.125
Europe Portugal 0.788 0.211 0.001
America Argentina 0.228 0.771 0.001
America Brazil 0.001 0.998 0.001
America Mexico 0.001 0.998 0.001
Africa South Africa 0.319 0.418 0.263
Note: (a) countries with a high level of socio-economic development, well-established rule of law and some flexibility regarding labour laws; (b) countries with an intermediate level of socio-economic development, fragile rule of law and a moderate to high level of workers’ protection; (c) countries with a low level of socio-economic development, fragile rule of law and a low level of workers’ protection.
Source: Authors’ elaboration.
5 Final considerationsThis brief presented the outcomes of the adjustment of the GoM model applied to a set of data for 71 countries. Variables from various dimensions were selected to reflect the general characteristics of countries in terms of socio-economic development, labour markets and labour law systems.
Based on cut-off criteria for membership to each extreme profile, countries were classified in three groups. In brief, these three groups are characterised by: 1) countries with a high proportion of employees in the service sector, a high proportion of the population with tertiary education, high elderly dependency ratio, life expectancy of over 65 years, high income, low inequality, advanced/final stage of demographic transition and a labour market with a moderate to flexible level of workers’ protection; 2) countries with a high proportion of employees in the industry sector, low elderly dependency ratio, life expectancy of 60–65 years, medium to high income, high inequality, intermediate/advanced level of demographic transition and with a moderate to strong labour market in terms of workers’ protection; and 3) countries with a high proportion of employees in the agricultural sector, very low elderly dependency ratio, life expectancy of under 55 years, medium-low/low income, intermediate/initial stage of demographic transition and a labour market with a low level of workers’ protection.
Outcomes were evaluated based on the groupings obtained and adherence to regional patterns of development. The model adopted allows the countries to be treated more flexibly without focusing exclusively on the groupings created. In other words, countries can be evaluated according to their grade of membership to each of the extreme profiles. Uruguay, for example, presented a grade of membership of approximately 0.55 to Brazil’s group and of 0.45 to the group of countries with high income and low social inequality. In fact, the country presents socio-economic and development characteristics that bring it close both to European countries and to its neighbours in South America.
Finally, we have tried to establish a list of heterogeneous countries, according to the variables analysed for the adjustment of the GoM model, for a case study that seeks to understand how labour lawsuits are processed and judged by the judicial system in different contexts. However, it is important to note that the data for labour law are from 2013, and Brazil’s 2017 labour reform brought the country closer to the more flexible rules of countries of profile 1, with a higher level of socio-economic development.
1. Institute for Applied Economic Research (Ipea) and International Policy Centre for Inclusive Growth (IPC-IG).
2. All other authors from the International Policy Centre for Inclusive Growth (IPC-IG).
3. The project is a partnership between the National School for the Formation and Improvement of Labour Magistrates (Escola Nacional de Formação e Aperfeiçoamento de Magistrados do Trabalho—ENAMAT) of the Superior Labour Court (Tribunal Superior do Trabalho—TST), the International Policy Centre for Inclusive Growth (IPC-IG) and the Institute for Applied Economic Research (Ipea), through the United Nations Development Programme (UNDP)
4. The number of the profiles was predefined by the authors, and the profile defined by the associated categories of the variables with high probability of pertaining to a given profile is known as an extreme/pure/reference profile. The extreme profile does not necessarily represent the most prevalent profile, although it ensures that there is at least one country with the same characteristics of the profile.
5. The GoM model has been widely used in research. For some of the early publications with details about the properties of the model, among many others, see: Woodbury and Manton (1989), Manton et al. (1994), Berkman, Singer, and Manton (1989), Singer (1989) and Erosheva (2002). For a model using Brazilian data, see among others: Sawyer (2002), Cerqueira and Sawyer (2007) and Alves (2008).
6. Fragility understood as those States with vulnerability to conflict or collapse. It was assessed by the Fragile States Index (Fund for Peace 2019) and used to filter the States to be included in the model, excluding those with very high vulnerability.
7. Uruguay and New Zealand, despite being below the population median line, were added due to their regional relevance, as well as their socio-economic and legal characteristics. New Zealand, for example, has an administrative authority with the power to decide labour disputes and controversies, while Uruguay has judges with ample judicial inquiry powers, equal to criminal proceedings (Lapl Law, Art. 1).
8. Euclidean distance groups were generated through the arules package for the R statistical computing software (Hahsler, Chelluboina, Hornik, and Buchta 2011).

6 International Policy Centre for Inclusive Growth
Appendix A — Description of indicators
ID Indicator Dimension Categories Source
CD_TXRatio of youth dependency
(100 * population 0–14/population 15–64) (2020)
Demographic
0–25: low
25–40: average-low
40–60: average-high
60–100: high
0–10: low
United Nations Population Division—
World Population Prospects
OAD_TX Ratio of elderly dependency (100 * population 65+/population 15–64) (2020) Demographic
10–20: average-low
20–30: average-high
30–50: high
United Nations Population Division—
World Population Prospects
POP_THOU
Total population (2019) (in millions)
This indicator was used solely as a filter for the selection of countries to be used for the
implementation of the GoM model.
Demographic
0–10: very low
10–25: low
25–50: average
50–90: high
90+: very high
United Nations Population Division—
World Population Prospects
EDU_LPProportion of adults (aged 15–64) with a sub-primary maximum schooling level
(2015) (%)Education
0–10: low
10–25: average-low
25–50: average-high
50–100: high
Vienna Institute of Demography
<http://dataexplorer.wittgensteincentre.
org/wcde-v2/>
EDU_PProportion of adults (aged 15–64) with
a maximum schooling level equal to complete basic education (2015) (%)
Education
0–15: low
15–30: average-low
30–45: average-high
45–100: high
Vienna Institute of Demography
<http://dataexplorer.wittgensteincentre.
org/wcde-v2/>
EDU_SProportion of adults (aged 15–64) with
a maximum schooling level equal to complete secondary education (2015) (%)
Education
0–15: low
15–30: average-low
30–45: average-high
45–100: high
Vienna Institute of Demography
<http://dataexplorer.wittgensteincentre.
org/wcde-v2/>
EDU_T
Proportion of adults (aged 15–64) with a maximum schooling level equal to
complete tertiary or higher education (2015) (%)
Education
0–10: low
10–20: average-low
20–30: average-high
30–100: high
Vienna Institute of Demography
<http://dataexplorer.wittgensteincentre.
org/wcde-v2/>
EXP15 Life expectancy at 15 (in years) (average between 2015 and 2020) Health
0–55: low
55–60: average
60–65: high
65–70: very high
United Nations Population Division—
World Population Prospects
GINIGini index (net household income) (most recent year for each country
between 2014 and 2017) Income
0–30: low inequality
30–35: average-low inequality
35–40: average-high inequality
40–100: high inequality
The Standardized World Income
Inequality Database (SWIID)
GNIGNI per capita (gross national income
divided by total population) (2018) (in US dollars)
Income
0–995: low income
995–3,895: average-low income
3,895–12,055: average-high income
12,055+: high income
World Bank

Policy Research Brief 7
ID Indicator Dimension Categories Source
FLF_TX_EMPLOY
Percentage of women in the workforce relative to the total working-age
population (aged 15–64) (%) (most recent year for each country
between 2015 and 2019)
Labour market
0–25: low
25–30: moderate-low
30–35: moderate-high
35–100: high
ILO—ILOSTAT
LFP_TX
Rate of participation in the workforce (people in the workforce/economically
active population) (%) (most recent year for each country between 2015 and 2019)
Labour market
0–50: very low
50–60: low
60–70: average
70–100: high
ILO—ILOSTAT
LI_TX_GDPShare of GDP from labour income (%)
(most recent year for each country between 2015 and 2019)
Labour market
0–35: very low
35–45: low
45–55: average
55–100: high
ILO—ILOSTAT
UNEMP_TX Unemployment rate (%) (most recent year for each country between 2015 and 2019) Labour market
0–3: very low
3–5: low
5–7: moderate
7–10: high
10–30: very high
ILO—ILOSTAT
AGR_TX_EMPLOY
Share of the population employed in agriculture (population employed in
agriculture/employed population) (%) (most recent year for each country
between 2015 and 2019)
Productive sector
0–10: very low
10–25: low
25–40: average
40–100: high
ILO—ILOSTAT
IND_TX_EMPLOY
Share of the population employed in industry (population employed in industry/employed population) (%) (most recent year for each country
between 2015 and 2019)
Productive sector
0–15: very low
15–20: low
20–25: average
25–30: high
30–100: very high
ILO—ILOSTAT
SRV_TX_EMPLOY
Share of the population employed in the service sector (population employed in
the service sector/employed population) (%) (most recent year for each country
between 2015 and 2019)
Productive sector
0–30: very low
30–45: low
45–60: average
60–75: high
75–100: very high
ILO—ILOSTAT
CFW_TX_EMPLOY
Share of workers in family businesses (population dedicated to working in
family businesses/employed population) (%) (most recent year for each country
between 2015 and 2019)
Work relations
0–5: very low
5–15: low
15–25: average
25–100: high
ILO—ILOSTAT
EMPS_TX_EMPLOY
Share of employed people in relation to the total employed population (%) (most recent year for each country
between 2015 and 2019)
Work relations
0–25: very low
25–50: low
50–75: average
75–100: high
ILO—ILOSTAT
EMPR_TX_EMPLOY
Share of employers relative to the total of the employed population (%)
(most recent year for each country between 2015 and 2019)
Work relations
0–1.5: very low
1.5–3: low
3–4.5: average
4.5–100: high
ILO—ILOSTAT
OAW_TX_EMPLOY
Share of self-employed workers relative to the total employed population (%)
(most recent year for each country between 2015 and 2019)
Work relations
0–15: low
15–35: average
35–100: high
ILO—ILOSTAT

8 International Policy Centre for Inclusive Growth
ID Indicator Dimension Categories Source
political_system Governance (2019) Political
system
Unitary
Federation
Other
Multiple sources
-
Fragile States Index (2019)
This indicator was used solely as a filter for the selection of countries to
be used for the implementation of the GoM model, except for countries with a fragility index over 90 (States on alert,
high alert and very high alert).
Judicial system0: very stable State to
120: very high alert StateThe Fund for Peace
rule_of_law Rule of Law Index (2019) Judicial system
Very weak
Weak
Average-weak
Average-strong
Strong
Very strong
World Justice Project
legal_systems Legal system tradition (2019) Judicial system
Common law
Civil law
Customary law
Mixed (various combinations)
JuriGlobe—World Legal Systems
Research Group—University of Ottawa
Camb_1The worker’s legal status is defined by law or can be freely defined between
employee and employer (2013)Labour law
0; 0.5: defined by employer and employee
0.5; 1: the law allows for the status to be determined by the nature of the contract
established between parties
1: the law determines the status of the employee based on certain criteria (e.g. form
of payment, duration of occupation etc.)
CBR Labour Regulation Index
Camb_2 Do part-time workers have the same rights as full-time workers? (2013) Labour law
0; 0.5: other hypotheses different from 0.5 and 1
0.5; 1: the judicial system recognises a limited right to
equal treatment for half-time workers (e.g. there are broader workers’ rights so that they are not treated arbitrarily at their jobs)
1: the judicial system recognises the right to
equal treatment
CBR Labour Regulation Index
Camb_4Does the law impose restrictions on
the establishment of fixed-term work contracts? (2013)
Labour law
0: other hypotheses different from 1
1: the law imposes a substantial restriction on the
conclusion of a fixed-term contract (e.g. only allowing
temporary contracts for work that is temporary by
nature, such as seasonal work, substitution of workers due to
maternity leave etc.)
CBR Labour Regulation Index

Policy Research Brief 9
ID Indicator Dimension Categories Source
Camb_5 Do temporary workers have the same rights as full-time workers? (2013) Labour law
0; 0.5: other hypotheses different from 0.5 and 1
0.5; 1: the judicial system recognises a limited right
to equal treatment for temporary workers
(e.g. there are broader workers’ rights so that they are not treated arbitrarily
at their place of work)
1: the judicial system recognises the right to
equal treatment
CBR Labour Regulation Index
Camb_7 Outsourcing is allowed, controlled or forbidden (2013) Labour law
0; 0.5: other hypotheses different from 0.5 and 1
0.5; 1: the judicial system applies substantial restrictions
on their use (only allowing outsourcing if some
conditions are met, such as the demonstrable need of the employer to meet fluctuations
in labour demand)
1: forbidden
CBR Labour Regulation Index
Camb_14 Maximum weekly working hours allowed, excluding overtime (2013) Labour law
0; 0.25: very high working hours (46.25–50 hours
or more)
0.25; 0.50: high working hours (42.5–46.25 hours)
0.50; 0.75: moderate working hours (38.75–42.5 hours)
0.75; 1: reduced working hours (38.75–35 hours or less)
CBR Labour Regulation Index
Camb_15 Maximum daily working hours permitted, including breaks (2013) Labour law
0; 0.25: very high working hours (15.5–18 hours or more)
0.25; 0.50: high working hours (13–15.5 hours)
0.50; 0.75: moderate working hours (10.5–13 hours)
0.75; 1: reduced working hours (8–10.5 hours or less)
CBR Labour Regulation Index
Camb_19
Are there procedural requirements to dismiss a worker? If so, the indicator also measures whether non-compliance with
these requirements leads to the layoff being deemed without just cause or
illegal (2013)
Labour law
0; 0.33: there are no procedural prerequisites for dismissal
0.33; 0.67: not following procedural dismissal procedures is one of the criteria for defining
the layoff as unjust
0.67; 1: not following procedural requirements for dismissal usually leads to the layoff being considered unjust
1: dismissal is unjust if the employer does not follow procedural layoff requirements
CBR Labour Regulation Index
10 International Policy Centre for Inclusive Growth
ID Indicator Dimension Categories Source
Camb_20Are there specific causes in legislation
that legitimise dismissal? If so, the indicator defines the degrees (2013)
Labour law
0; 0.33: dismissal can be carried out without specific criteria, based on will alone
0.33; 0.67: dismissal is only allowed if it is classified as
‘just’, depending on the law/jurisprudence
0.67; 1: dismissal is legal depending on a broad set of criteria (e.g. technical, misconduct, redundancy)
1: dismissal is only allowed in cases of serious
employee misconduct
CBR Labour Regulation Index
Camb_25
Right to unionisation: The indicator considers whether the right to form unions exists or not, if it is explicitly
or implicitly (for example, included in freedom of association) granted in the constitution or if unions are considered
as matters of order/public interest (2013)
Labour law
0; 0.33: other hypotheses different from 0.33, 0.67 and 1
0.33; 0.67: reference to unionisation in constitution
(different from those in category 0.67–1) or there is a reference to freedom of
association, which includes the creation of unions
0.67; 1: unionisation is described in the constitution as a matter of public interest
1: the right to form unions is explicitly mentioned
in the constitution
CBR Labour Regulation Index
Camb_26
The right to collective bargaining (or the celebration or the establishing
of collective agreements) is granted explicitly or implicitly by the constitution of countries, or is classified as a matter of public order or public interest, or is
absent (2013)
Labour law
0; 0.33: other hypotheses different from 0.33, 0.67 and 1
0.33; 0.67: reference to collective bargaining in the constitution (different from those in category 0.67–1)
0.67; 1: collective bargaining is mentioned as a matter of
public interest
1: collective bargaining is explicitly allowed by
the constitution
CBR Labour Regulation Index
Camb_27 Presence or absence of the employer’s obligation to negotiate (2013) Labour law
0: employer is not required to negotiate
1: employer is required to negotiate with employees
CBR Labour Regulation Index
Camb_28Legislation covers (or not) the extension
of collective bargains (national or sectoral) to third parties (2013)
Labour law
0: collective bargains cannot be extended to non-signatory
workers or unions
1: there is a possibility to extend agreements to third
parties; extensions can be automatic, subject to government approval or
subject to a conciliation or arbitration procedure
CBR Labour Regulation Index

Policy Research Brief 11
ID Indicator Dimension Categories Source
Camb_32 Are unofficial strikes legal or illegal? (2013) Labour law
0: other hypotheses different from 1
1: strikes are not illegal simply for being unofficial
CBR Labour Regulation Index
Camb_35 Lockout permission (2013) Labour law0: allowed
1: not allowedCBR Labour
Regulation Index
Camb_39 Conciliation between employees and employers is compulsory or not (2013) Labour law
0: compulsory conciliation
1: non-compulsory conciliation
CBR Labour Regulation Index

12 International Policy Centre for Inclusive Growth
Appendix B — Profile characteristics
Indicator Dimension Profile 1 Profile 2 Profile 3
Youth dependency ratio (100 * population 0–14/population 15–64) (2020) 1) Demographics Very low Average High
Elderly dependency ratio (100 * population 65+/population 15–64) (2020) 1) Demographics
Average
HighLow Very low
Proportion of adults (aged 15–64) with a sub-primary maximum schooling level (2015) (%)
2) Education Very low Low
Average
High
Proportion of adults (aged 15–64) with a maximum schooling level equal to complete basic education (2015) (%)
2) EducationVery low
LowLow High
Proportion of adults (aged 15–64) with a maximum schooling level equal to complete secondary education (2015) (%)
2) Education Average Low Very low
Proportion of adults (aged 15–64) with a maximum schooling level equal to complete tertiary or higher education (2015) (%)
2) Education High
Low
Average Very low
Life expectancy at 15 (in years) (average values between 2015 and 2020) 3) Health Very high High
Low
Average
Gini index (net household income) (most recent year for each country between 2014 and 2017)
4) IncomeLow
Average-low
Average-high
High
High
No data
GNI per capita (gross national income divided by total population) (2018) (in USD)
4) Income High income Medium-high income
Low income
Medium-low
Percentage of women in the workforce relative to the total working-age population (aged 15–64) (%) (most recent year for each country between 2015 and 2019)
5) Labour marketAverage-low
Average-highLow High
Rate of participation in the workforce (people in the work force/economically active population) (%) (most recent year for each country between 2015 and 2019)
5) Labour market Very low High
Share of GDP from labour income (%) (most recent year for each country between 2015 and 2019)
5) Labour market High Low
Very low
High
Unemployment rate (%) (most recent year for each country between 2015 and 2019)
5) Labour market Low Very high Very low
Share of the population employed in agriculture (population employed in agriculture/employed population) (%) (most recent year for each country between 2015 and 2019)
6) Productive sector Very low Low
Average
High
Share of the population employed in industry (population employed in industry/employed population) (%) (most recent year for each country between 2015 and 2019)
6) Productive sector Alta Very low

Policy Research Brief 13
Indicator Dimension Profile 1 Profile 2 Profile 3
Share of the population employed in the service sector (population employed in the service sector/employed population) (%) (most recent year for each country between 2015 and 2019)
6) Productive sector Very high Average
Very low
Low
Share of workers in family businesses (population dedicated to working in family businesses/employed population) (%) (most recent year for each country between 2015 and 2019)
7) Work relations Very low
Low
Average
High
Share of employed people in relation to the total employed population (%) (most recent year for each country between 2015 and 2019)
7) Work relations Very low
Low
Share of employed people in relation to the total employed population (%) (most recent year for each country between 2015 and 2019)
7) Work relations Alta Average
Very low
Low
Share of self-employed workers relative to the total employed population (%) (most recent year for each country between 2015 and 2019)
7) Work relations Low Average High
Governance (2019)8) State
governance system
Federation Other
Law system tradition (2019) 9) Judicial system Common
Consuetudinary
Rule of Law Index (2019) 9) Judicial systemStrong
Very strong
Very weak
Weak
Average-weak
Weak
The worker’s legal status is defined by law or can be freely defined between employee and employer (2013)
10) Labour law
The law determines the status of the
employee based on certain criteria (e.g. form of payment,
duration of occupation etc.)
Defined by employee and employer
Maximum weekly working hours allowed, excluding overtime (2013) 10) Labour law
Reduced working hours
(38.75–35 hours or less)
High working hours (42.5–46.25 hours)
Very high working hours (46.25–50 hours or more)
Maximum daily working hours permitted, including breaks (2013) 10) Labour law High work hours
(13h a 15,50h)Very high working hours (15.5–18 hours or more)
Are there procedural requirements for dismissing a worker? If so, the indicator also measures whether non-compliance with these requirements leads to the layoff being deemed without just cause or illegal (2013)
10) Labour law
Not following procedural dismissal
requirements is one of the criteria for
defining the layoff as unjust
Not following procedural requirements for
dismissal usually leads to the layoff being considered unjust
Do part-time workers have the same rights as full-time workers? (2013) 10) Labour law
The judicial system
recognises the right to
equal treatment
Other hypotheses different from 0.5 and 1

14 International Policy Centre for Inclusive Growth
Indicator Dimension Profile 1 Profile 2 Profile 3
Are there specific causes in legislation that legitimise dismissal? If so, the indicator defines the degrees (2013)
10) Labour law
Dismissal can be carried out without
specific criteria, based on will alone
Dismissal is only allowed in cases of serious employee
misconduct
Dismissal is only allowed if it is classified as ‘just’,
depending on the law/jurisprudence
Right to unionisation: The indicator considers whether the right to form unions exists or not, if it is explicitly or implicitly (for example, included in freedom of association) granted in the constitution or if unions are considered as matters of order/public interest (2013)
10) Labour law
Unionisation is described in the constitution as
a matter of public interest
Reference to unionisation in the constitution
(different from those in category 0.67–1) or there is a reference to freedom
of association, which includes the creation
of unions
The right to collective bargaining (or the celebration or the establishing of collective agreements) is granted explicitly or implicitly by the constitution of countries, or is classified as a matter of public order or public interest, or is absent (2013)
10) Labour law
Collective bargaining is mentioned as
a matter of public interest
Collective bargaining is
explicitly allowed by the constitution
Reference to collective bargaining in the
constitution (different from those in category
0.67–1) Other hypotheses
different from 0.33, 0.67 and 1
Presence or absence of the employer’s negotiation obligations (2013) 10) Labour law
Employer is not required to negotiate
Employer is not required to negotiate
Legislation covers (or not) the extension of collective bargains (national or sectorial) to third parties (2013)
10) Labour law
Are unofficial strikes legal or illegal? (2013) 10) Labour lawStrikes are not
illegal simply for being unofficial
Strikes are not illegal simply for being unofficial
Lockout permission (2013) 10) Labour law
Conciliation between employees and employers is compulsory or not (2013) 10) Labour law Conciliation is
not compulsory
Does the law impose restrictions on the establishment of fixed-term work contracts? (2013)
10) Labour law
The law imposes a substantial restriction on the conclusion of a fixed-term
contract (e.g. only allowing temporary contracts for work that is temporary by nature, such
as seasonal work, substitution of workers due to
maternity leave etc.)
Other hypotheses different from 1

Policy Research Brief 15
Indicator Dimension Profile 1 Profile 2 Profile 3
Do temporary workers have the same rights as full-time workers? (2013) 10) Labour law
The judicial system
recognises the right to equal
treatment
The judicial system recognises a limited
right to equal treatment for
temporary workers (e.g. there are
broader workers’ rights so that they
are not treated arbitrarily at their
place of work)
Other hypotheses different from 0.5 and 1
Outsourcing is allowed, controlled or forbidden (2013) 10) Labour law Forbidden
References:
Alves, L.C., I. da C. Leite, and C.J. Machado. 2008. “Perfis de Health dos idosos no Brasil: análise da Pesquisa Nacional por Amostra de Domicílios de 2003 utilizando o método grade of membership.” Cadernos de Saúde Pública 24(3): 535–546.
Berkman, L.F., B. Singer, and K. Manton. 1989. “Black/White Differences in Health Status and Mortality Among the Elderly.” Demography 26: 661–678.
Carvalho, S.S. 2017. “Uma visão geral sobre a reforma trabalhista.” Boletim do Labour Market 63, Política em Foco. Brasília: Instituto de Pesquisa Econômica Aplicada,
Cerqueira, C.A., and D. O. Sawyer. 2007. “Tipologia dos estabelecimentos escolares brasileiros.” Revista Brasileira de Estudos de População 24: 53–67.
Erosheva, E.A. 2002. “Grade of membership and latent structure models with application to disability survey data.” Unpublished doctoral thesis. Pittsburgh, PA: Department of Statistics, Carnegie Mellon University.
Erosheva, E.A. 2005. “Comparing latent structures of the grade of membership, rasch, and latent class models.” Psychometrika 70(4): 619–628.
Fund For Peace. 2019. Fragile states index annual report. Washington, DC: Fund For Peace.
Guedes, G.R., P. Siviero, C.J. Machado, J. Pinto, and M. Rodarte. 2016. “Grade of membership: Conceitos básicos e aplicação empírica usando o programa GoM para Windows, Linux, Stata e R.” Belo Horizonte: Universidade Federal de Minas Gerais.
Hahsler, M., S. Chelluboina, K. Hornik, and C. Buchta. 2011. “The arules r-package ecosystem: analyzing interesting patterns from large transaction datasets.” Journal of Machine Learning Research 12: 1977–1981. <http://jmlr.csail.mit.edu/papers/v12/hahsler11a.html>. Accessed 27 January 2020.
IPC-IG. 2019. “Evaluation of the Coverage and Benefit Incidences of Food Fortification in Mozambique.” Research Report, No. 32. Brasília: International Policy Centre for Inclusive Growth. <https://ideas.repec.org/p/ipc/cstudy/32.html>. Accessed 27 January 2020.
Kaufman, L., and P.J. Rousseeuw. 2009. Finding groups in data: an introduction to cluster analysis. Hoboken, NJ: Wiley InterScience.
Krein, J.D., D.M. Gimenez, and A.L. Santos. 2018. Dimensões críticas da reforma trabalhista no Brasil. Campinas: Curt Nimuendajú.
Manton, K.G., M.A. Woodbury, and H.D. Tolley. 1994. Statistical applications using fuzzy sets. Hoboken, NJ: John Wiley & Sons.
Robitzsch, A. “Sirt: Supplementary Item Response Theory Models.” 2019. CRAN.R Project website. <https://CRAN.R-project.org/package=sirt>. Accessed 27 January 2020.
Sawyer, D.O., I. da C. Leite, and R. Alexandrino. 2002. “Perfis de utilização de serviços de saúde no Brasil.” Ciência & Saúde Coletiva 7: 757–776.
Singer, B. 1989. “Grade of Membership Representations, Concepts and Problems.” In Probability, Statistics, and Mathematics, Papers in Honor of Samuel Karlin, edited by T.W. Anderson, K.B. Athreya, and D.L. Iglehart, 317–334. Boston, MA: Academic Press.
UN DESA. 2019. “World population prospects 2019.” United Nations Department of Economic and Social Affairs website. <https://population.un.org/wpp/>. Accessed 27 January 2020.
Woodbury, M. A. and K. G. Manton. 1989. “Grade of Membership Analysis of Depression-Related Psychiatric Disorders. Social Method & Research. 18(1): 126-163.

The views expressed in this brief are the authors’ and not necessarily those of the Government of Brazil or the United Nations Development Programme.
International Policy Centre for Inclusive GrowthSBS, Quadra 1, Bloco J, Ed. BNDES, 13º andar – 70076-900, Brasília, DF – Brazil +55 61 2105 5000 [email protected] ww.ipcig.org