Comparative Study of Visual Pathways in Owls (Aves ...dwylie/Gutierrez Ibanez et al. 2013 BBE... ·...
13
Fax +41 61 306 12 34 E-Mail [email protected] www.karger.com Original Paper Brain Behav Evol DOI: 10.1159/000343810 Comparative Study of Visual Pathways in Owls (Aves: Strigiformes) Cristián Gutiérrez-Ibáñez a Andrew N. Iwaniuk c Thomas J. Lisney b Douglas R. Wylie a, b a Centre for Neuroscience, and b Department of Psychology, University of Alberta, Edmonton, Alta., and c Department of Neuroscience, Canadian Centre for Behavioural Neuroscience, University of Lethbridge, Lethbridge, Alta., Canada ing, has reduced visual pathways compared to strigid owls. Our results also suggest there could be a trade-off between the relative size of visual pathways and auditory pathways, similar to that reported in mammals. Finally, our results show that although there is no relationship between activity pat- tern and the relative size of either the tectofugal or the thal- amofugal pathway, there is a positive correlation between the relative size of both visual pathways and the relative number of cells in the retinal ganglion layer. Copyright © 2012 S. Karger AG, Basel Introduction In birds, several studies have shown that differences in activity pattern are correlated with differences in the vi- sual system. For example, compared to diurnal birds, noc- turnal species tend to exhibit a number of adaptations that serve to enhance visual sensitivity, such as: a larger cornea relative to total eye size, high rod:cone photoreceptor ra- tios, relatively fewer retinal ganglion cells (RGCs) and a relatively smaller optic foramen [Tansley and Erichsen, 1985; Rojas de Azuaje et al., 1993; Hall and Ross, 2007; Hall et al., 2009; Iwaniuk et al., 2010a; Corfield et al., 2011]. Although within most avian orders activity pattern Key Words Optic tectum Wulst Tectofugal Thalamofugal Bird Eye Habitat Retinal ganglion cell Abstract Although they are usually regarded as nocturnal, owls ex- hibit a wide range of activity patterns, from strictly noctur- nal, to crepuscular or cathemeral, to diurnal. Several studies have shown that these differences in the activity pattern are reflected in differences in eye morphology and retinal orga- nization. Despite the evidence that differences in activity pattern among owl species are reflected in the peripheral visual system, there has been no attempt to correlate these differences with changes in the visual regions in the brain. In this study, we compare the relative size of nuclei in the main visual pathways in nine species of owl that exhibit a wide range of activity patterns. We found marked differences in the relative size of all visual structures among the species studied, both in the tectofugal and the thalamofugal path- way, as well in other retinorecipient nuclei, including the nu- cleus lentiformis mesencephali, the nucleus of the basal op- tic root and the nucleus geniculatus lateralis, pars ventralis. We show that the barn owl (Tyto alba) , a species widely used in the study of the integration of visual and auditory process- Received: July 9, 2012 Returned for revision: August 27, 2012 Accepted after revision: September 25, 2012 Published online: $$$ Cristián Gutiérrez-Ibáñez University of Alberta, Centre for Neuroscience Biological Sciences Building, P-217 Edmonton AB T6G 2E9 (Canada) E-Mail cagutier @ ualberta.ca © 2012 S. Karger AG, Basel 0006–8977/12/0000–0000$38.00/0 Accessible online at: www.karger.com/bbe BBE343810.indd 1 BBE343810.indd 1 10.12.2012 14:49:15 10.12.2012 14:49:15
Transcript of Comparative Study of Visual Pathways in Owls (Aves ...dwylie/Gutierrez Ibanez et al. 2013 BBE... ·...

Fax +41 61 306 12 34E-Mail [email protected]
Original Paper
Brain Behav Evol DOI: 10.1159/000343810
Comparative Study of Visual Pathways in Owls (Aves: Strigiformes)
Cristián Gutiérrez-Ibáñez a Andrew N. Iwaniuk c Thomas J. Lisney b
Douglas R. Wylie a, b
a Centre for Neuroscience, and b Department of Psychology, University of Alberta, Edmonton, Alta. , and c Department of Neuroscience, Canadian Centre for Behavioural Neuroscience, University of Lethbridge, Lethbridge, Alta. , Canada
ing, has reduced visual pathways compared to strigid owls. Our results also suggest there could be a trade-off between the relative size of visual pathways and auditory pathways, similar to that reported in mammals. Finally, our results show that although there is no relationship between activity pat-tern and the relative size of either the tectofugal or the thal-amofugal pathway, there is a positive correlation between the relative size of both visual pathways and the relative number of cells in the retinal ganglion layer.
Copyright © 2012 S. Karger AG, Basel
Introduction
In birds, several studies have shown that differences in activity pattern are correlated with differences in the vi-sual system. For example, compared to diurnal birds, noc-turnal species tend to exhibit a number of adaptations that serve to enhance visual sensitivity, such as: a larger cornea relative to total eye size, high rod:cone photoreceptor ra-tios, relatively fewer retinal ganglion cells (RGCs) and a relatively smaller optic foramen [Tansley and Erichsen, 1985; Rojas de Azuaje et al., 1993; Hall and Ross, 2007; Hall et al., 2009; Iwaniuk et al., 2010a; Corfield et al., 2011]. Although within most avian orders activity pattern
Key Words
Optic tectum � Wulst � Tectofugal � Thalamofugal � Bird � Eye � Habitat � Retinal ganglion cell
Abstract
Although they are usually regarded as nocturnal, owls ex-hibit a wide range of activity patterns, from strictly noctur-nal, to crepuscular or cathemeral, to diurnal. Several studies have shown that these differences in the activity pattern are reflected in differences in eye morphology and retinal orga-nization. Despite the evidence that differences in activity pattern among owl species are reflected in the peripheral visual system, there has been no attempt to correlate these differences with changes in the visual regions in the brain. In this study, we compare the relative size of nuclei in the main visual pathways in nine species of owl that exhibit a wide range of activity patterns. We found marked differences in the relative size of all visual structures among the species studied, both in the tectofugal and the thalamofugal path-way, as well in other retinorecipient nuclei, including the nu-cleus lentiformis mesencephali, the nucleus of the basal op-tic root and the nucleus geniculatus lateralis, pars ventralis. We show that the barn owl (Tyto alba) , a species widely used in the study of the integration of visual and auditory process-
Received: July 9, 2012 Returned for revision: August 27, 2012 Accepted after revision: September 25, 2012 Published online: $ $ $
Cristián Gutiérrez-Ibáñez University of Alberta, Centre for Neuroscience Biological Sciences Building, P-217 Edmonton AB T6G 2E9 (Canada) E-Mail cagutier @ ualberta.ca
© 2012 S. Karger AG, Basel0006–8977/12/0000–0000$38.00/0
Accessible online at:www.karger.com/bbe
BBE343810.indd 1BBE343810.indd 1 10.12.2012 14:49:1510.12.2012 14:49:15

Gutiérrez-Ibáñez /Iwaniuk /Lisney /Wylie
Brain Behav Evol2
is fairly uniform (e.g. all members are diurnal), in a few orders species vary widely in activity pattern along the nocturnal-diurnal gradient. One order of specific interest in this respect is that of the owl: Strigiformes. Although owls are generally regarded as nocturnal birds, only about 30% of owl species are strictly nocturnal; the rest of the species exhibit a wide range of activity patterns, from cre-puscular or cathemeral, to diurnal [Martin, 1986; Voous, 1988; del Hoyo et al., 1999; König and Weick, 2008]. Past studies have shown that these differences in activity pat-tern are associated with the organization of the visual sys-tem of these birds. Owl species with different activity pat-terns differ in their photoreceptor density, shape and depth of the fovea [Oehme, 1961], rod:cone ratios, critical flicker fusion frequency [see Lisney et al., 2011] and num-ber and distribution of RGCs [Oehme, 1961; Bravo and Pettigrew, 1981]. Recently, a detailed study [Lisney et al., 2012] of the eyes and retinas of eight species of owl with different activity patterns showed that nocturnal owls have relatively larger corneal diameters than diurnal spe-cies. Further, it was shown by these authors that the topo-graphic distribution of neurons in the RGC layer among owl species is related to both activity pattern and habitat preference. Species that live in open habitats and/or are more diurnal have well-defined, elongated visual streaks, while more nocturnal and/or forest-dwelling species have a poorly defined visual streak and exhibit a more radially symmetrical retinal topography pattern.
In recent years, several studies have shown that differ-ent demands on the visual system in birds are correlated with variation in the relative size of visual areas in the brain [Iwaniuk and Wylie, 2006, 2007; Iwaniuk et al., 2008, 2010b; Corfield et al., 2011]. However, despite the compelling evidence that differences in activity patterns among owl species are reflected in the organization of the eyes, there has been no attempt so far to correlate these differences with variation in the relative size of visual re-gions in the brain. Owls, like all vertebrates, have several visual pathways from the retina to the brain [Bravo and Pettigrew, 1981; Bagnoli et al., 1990]. One of the main vi-sual pathways in birds is the tectofugal pathway, which is comprised of three main structures: optic tectum (TeO), nucleus rotundus (nRt) and entopallium (E). This path-way is involved in processing brightness, colour, pattern discrimination, simple motion and looming stimuli [Wang et al., 1993; Bischof and Watanabe, 1997; Sun and Frost, 1998; Husband and Shimizu, 2001; Nguyen et al., 2004]. A second pathway is the thalamofugal pathway, which includes the dorsal thalamus and the wulst (also known as the hyperpallium) [Reiner et al., 2004].
In owls, contralateral retinal projections reach the lat-eral part of the nucleus dorsolateralis anterios thalami (DLL) [Karten and Nauta, 1968; Karten, 1969], which in turn give rise to ipsilateral and contralateral projections to the visual wulst Karten et al., 1973. Several studies show that cells in the visual wulst of owls respond to bin-ocular disparity which suggest that this structure isinvolved in stereopsis [e.g. Pettigrew and Konishi, 1976; Pettigrew, 1979; Wagner and Frost, 1994; Nieder and Wagner, 2001; Baron et al., 2007]. This is further sup-ported by the presence of an enlarged wulst in owls and other bird species with large binocular fields [Iwaniuk et al., 2008]. There is also some evidence that the visualwulst is involved in the representation of illusory con-tours [Nieder and Wagner, 1999] and learning of visual discrimination tasks [Budzynski and Bingman, 2004]. Other retinorecipient nuclei in birds include the nucleus lentiformis mesencephali (LM) and the nucleus of the basal optic root (nBOR) [Karten et al., 1977; Fite et al., 1981; McKenna and Wallman, 1985; Gamlin and Cohen, 1988], which are involved in the generation of the opto-kinetic response [Frost et al., 1994], as well as the nucleus geniculatus lateralis, pars ventralis (GLv), the function of which remains largely unclear [but for some proposed functions see Maturana and Varela, 1982; Gamlin et al., 1984; Wakita et al., 1992; Vega-Zuniga et al., 2011].
Given the variation among activity patterns, eye mor-phology and retinal organization in owls, there are like-ly corresponding differences in the size of retinorecipient and other brain regions processing visual information. For example, several studies suggest that a transition from diurnality to nocturnality results in a reduction of the number of RGCs and a reduction of the tectofugal pathway [Kay and Kirk, 2000; Kirk and Kay, 2004; Hall et al., 2009; Iwaniuk et al., 2010b; Corfield et al., 2011]. Therefore, we would expect that nocturnal owl species have a relative smaller tectofugal pathway than more di-urnal species. With respect to the thalamofugal pathway, Bravo and Pettigrew [1981] compared the amount of RGCs that project to the TeO and the thalamus between the burrowing owl (Athene cunicularia) and the barn owl (Tyto alba) . These authors found that while both species have a peak density of RGCs that project to the TeO of around 10,000 cells/mm 2 , the peak density of RGCs that project to the thalamus is much smaller in the barn owl, around 4,000 cells/mm 2 . These two species differ in ac-tivity pattern with the burrowing owl being diurnal while the barn owl is strictly nocturnal, but they alsobelong to the two different families within the orderStrigiformes: Strigidae and Tytonidae, respectively [del
BBE343810.indd 2BBE343810.indd 2 10.12.2012 14:49:3410.12.2012 14:49:34
Relative Size of Visual Pathways in Owls Brain Behav Evol 3
Hoyo et al., 1999; König and Weick, 2008]. On the basis of Bravo and Pettigrew’s [1981] results, we expect differ-ences in the relative size of the thalamofugal pathway, between diurnal and nocturnal species and/or between strigid and tytonid owls. Finally, we have recently shown that asymmetrically eared owls have enlarged auditory pathways when compared to symmetrically eared ones [Gutiérrez-Ibáñez et al., 2011]. Several studies in mam-mals [Eisenberg, 1981; Baron et al., 1996; Barton, 1998; Catania, 2005] have shown that trade-offs can occur be-tween different sensory systems, and species that rely heavily on one sensory modality (with a corresponding enlargement of associated brain areas) have relatively smaller brain regions dedicated to other sensory modal-ities. If such a ‘trade-off ’ exists in owls, we expect that asymmetrically eared owls will have relatively smaller visual pathways compared to symmetrically eared owls because of the presumably greater reliance on auditory rather than visual cues when foraging in asymmetrically eared species. Here, we test all of the predictions dis-cussed above across nine owl species that vary in activity pattern.
Methods
We measured the relative volume of eight visual nuclei in 12 specimens representing nine species of owl and the tawny frog-mouth (Podargus strigoides) , a caprimulgiform (see below). All specimens were provided to us dead by conservation authorities or wildlife veterinarians, or were donated by other researchers. In some cases the head without the eyes was provided to us. Owls are classified into two extant families: Tytonidae (barn and bay owls) and Strigidae (‘typical’ owls) [del Hoyo et al., 1999; König and Weick, 2008]. The barn owl is the most studied species with re-spect to the visual system [for review see Harmening and Wagner, 2011] and we include one individual in our analyses as a represen-tative tytonid owl. Within the Strigidae, we examined eight spe-cies: the northern saw-whet owl (Aegolius acadicus) , the short-eared owl (Asio flammeus) , the snowy owl (Bubo scandiacus) , the great horned owl (Bubo virginianus) , the great grey owl (Strix ne-bulosa) , the barred owl (Strix varia) , the northern hawk owl (Sur-nia ulula) and the boobook owl (Ninox boobook) . This last species was not included in our previous work on the relative size of the auditory system [Gutiérrez-Ibáñez et al., 2011] or retinal organi-zation of owls [Lisney et al., 2012] because we had no access to the eyes of this specimen and there was some tissue damage to the cochlear nuclei during processing of the brain. Finally, we includ-ed the tawny frogmouth (P. strigoides) for comparative purposes. This is a nocturnal bird with feeding habits and morphology sim-ilar to owls [Cleere, 1998; Higgins, 1999]. They have frontally ori-ented eyes with similar binocular overlap to owls [Wallman and Pettigrew, 1985] and the relative size of the brain, telencephalon and wulst are similar to that of owls [Iwaniuk and Hurd, 2005; Iwaniuk and Wylie, 2006; Iwaniuk et al., 2008].
For all specimens, the head was immersion-fixed in 4% para-formaldehyde in 0.1 M phosphate buffer. The brain was then ex-tracted, weighed to the nearest milligram, cryoprotected in 30% sucrose in phosphate buffer, embedded in gelatine and sectioned in the coronal or sagittal plane on a freezing stage microtome at a thickness of 40 � m. Sections were collected in 0.1 M phosphate-buffered saline, mounted onto gelatinized slides, stained with thi-onine and coverslipped with Permount. The olfactory bulbs were intact in all the specimens we collected and sectioned. All brains were cut following bird brain atlases [e.g. Karten and Hodos, 1967; Puelles et al., 2007] in which the brainstem ends at the same ros-trocaudal point as the cerebellum. In this manner, brain measure-ments were consistent among our specimens. Photomicrographs of every fourth section were taken throughout the rostrocaudal extent of each nucleus using a Retiga EXi FAST Cooled mono 12-bit camera (Qimaging, Burnaby, B.C., Canada) and OPENLAB Imaging system (Improvision, Lexington, Mass., USA) attached to a compound light microscope (Leica DMRE, Richmond Hill, Ont., Canada). Measurements of all the nuclei were taken direct-ly from these photos with ImageJ (NIH, Bethesda, Md., USA; http://rsb.info.nih.gov/ij/) and volumes were calculated by multi-plying the area in each section by the thickness of the section (40 � m) and the sampling interval. For those species represented by more than one specimen ( table 1 ), the average of the measure-ments was taken as the species’ given value. Brain volume for each specimen was calculated by dividing the mass of the brain by the density of brain tissue (1.036 g/mm 3 ) [Stephan, 1960] as in previ-ous studies [Iwaniuk and Wylie, 2006; Iwaniuk et al., 2007, 2008, 2010b].
We measured the volume of all the nuclei comprising the two main visual pathways in birds (see Introduction), the tectofugal pathway (TeO, nRt and E) and the thalamofugal pathway (DLL and wulst). Additionally, we measured the relative size of three retinorecipient nuclei, LM, nBOR and GLv in order to assess whether differences in the relative size of visual areas between owl species apply to all retinorecipient areas or are independent for each pathway. We also tested for a correlation between the relative volume of all the visual nuclei measured in this study and the relative volume of auditory pathways for some of the same species, which were obtained from Gutiérrez-Ibáñez et al. [2011]. The total relative volume of auditory pathways is the sum of the relative volume of the nucleus angularis, the nucleus magnocellularis, the nucleus laminaris, the posterior part of the dorsal lateral lemnis-cus, the anterior part of the dorsal lateral lemniscus, the ventral part of the lateral lemniscus, the superior olive, inferior colliculus and the nucleus ovoidalis.
Activity Pattern We classified the nine different owl species measured in this
study into three different activity pattern categories following the same classification used in our previous work with the same spe-cies ( table 1 ) [for details see Lisney et al., 2012]. Briefly, species where classified as: (1) diurnal, meaning active during the dayin photopic conditions, (2) crepuscular, meaning active during dawn and dusk periods and (3) nocturnal, meaning active during the night in scotopic conditions. Within the crepuscular category there is some variation as some species can be classified as crepus-cular-nocturnal while others as crepuscular-diurnal [for details see Lisney et al., 2012]. It should also be noted that the short-eared owl is included in the crepuscular category even though it can be
BBE343810.indd 3BBE343810.indd 3 10.12.2012 14:49:3410.12.2012 14:49:34

Gutiérrez-Ibáñez /Iwaniuk /Lisney /Wylie
Brain Behav Evol4
considered crepuscular-cathemeral because some reports suggest that this species is most active around dawn and dusk [Clark, 1975; Voous, 1988; Reynolds and Gorman, 1999; König and Weick, 2008] whereas others have reported that this owl is active at various times of the day and night [Clark, 1975; del Hoyo et al., 1999].
Borders of Visual Nuclei The borders of the different nuclei were determined based on
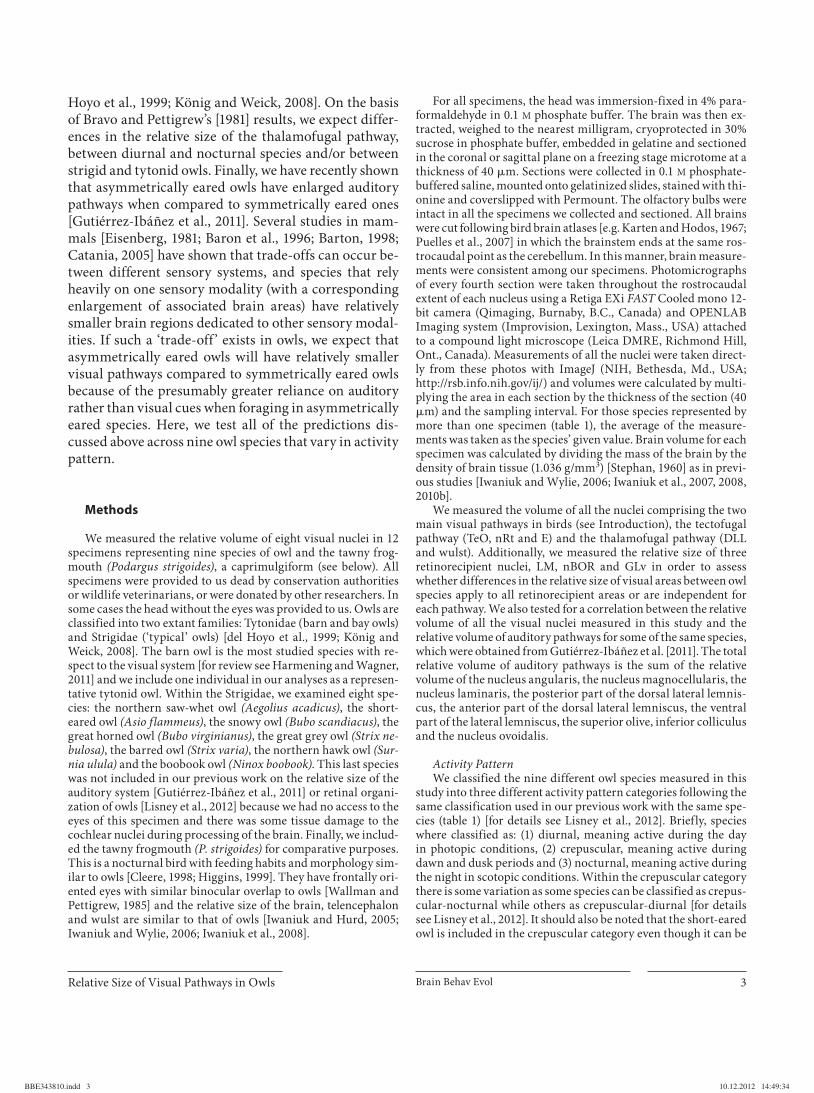
descriptions of the nuclei in the literature (see below) and several stereotaxic atlases [Karten and Hodos, 1967; Stokes et al., 1974; Matochik et al., 1991; Puelles et al., 2007] (www.bsos.umd.edu/psyc/Brauthlab/atlas.htm). Figure 1 shows examples of the visual nuclei in several owl species. Detailed descriptions of the borders of TeO, nRt, E, GLv, LM and nBOR can be found in previous works [Iwaniuk and Wylie, 2007; Iwaniuk et al., 2010b]. For the borders of the lateral part of the nucleus DLL, we measured the area distinguished by the presence of densely packed, darkly stained cells ( fig. 1 d). We chose this area because according to the results of Bagnoli et al. [1990], this corresponds to the retinore-cipient part of DLL in owls. This is in contrast to the more lateral and dorsal part of DLL, which shows less densely packed and less darkly stained cells, and does not receive retinal projections ( fig. 1 d) [Bagnoli et al., 1999]. For the borders of the wulst we fol-lowed Iwaniuk et al. [2008], which include the hyperpallium api-cale, the nucleus interstitialis hyperpallii apicalis and the hyper-pallium densocellulare ( fig. 1 e). It must be noted that this includes both the visual portions of the wulst as well as the rostral most part of it, which is not visual but rather receives somatosensory information [Karten et al., 1978; Manger et al., 2002; Wild et al., 2008]. Figure 1 e shows an example of the borders of the wulst in an owl.
RGC Distribution and Total Number We also compared the relative size of the different visual path-
ways to both the topographic distribution and total number of neurons in the RGC layer for the different species of owls, using data from Lisney et al. [2012]. To the best of our knowledge, sim-ilar data have not been published for the tawny frogmouth or the boobook owl and we had no access to retinas of either of these species, so we were not able to include them in this part of our analysis. Retinal topography is related to activity pattern in owls, with more diurnal species having a well-defined, elongated visual
streak, while more nocturnal species have a poorly defined visual streak and a more radially symmetrical arrangement [Lisney et al., 2012]. The pattern can be quantified using a ‘H:V ratio’; the ratio of the maximum horizontal (H) and vertical (V) extent of the area enclosed by an isodensity contour line [Stone and Keens, 1980; Fischer and Kirby, 1991]. In this sense, a perfectly circular distribution of RGCs would result in an H:V ratio of 1, whereas a visual streak results in an H:V ratio greater than 1. We also com-pared the relative size of visual pathways with the number of cells in the RGC layer reported by Lisney et al. [2012]. The RGC layer in the retina contains not only RGCs, but also displaced amacrine cells [Bravo and Pettigrew, 1981; Hayes, 1984; Chen and Naito, 1999], which account for about 50% of the cells in the ganglion cell layer in the barn owl [Wathey and Pettigrew, 1989]. In addi-tion, a population of displaced RGCs resides in the amacrine cell layer in birds [Karten et al., 1977; Reiner et al., 1979; Fite et al., 1981]. As detailed in Lisney et al. [2012], we were unable to reliably distinguish amacrine from RGCs within the RGC layer, so the total number of cells in the RGC layer is an overestimate of RGC number. Because the number of cells in the brain correlates posi-tively with the absolute size of the brain [reviewed in Herculano-Houzel, 2011] we divided the total number of cells in the RGC layer by the brain volume of each species as a way to account for the differences in cell numbers related to the size of each species.
Statistical Analyses In many comparative studies dealing with relative size of brain
structures, allometric effects are accounted for by comparing re-siduals from least-square linear regressions between the struc-tures and body mass or brain volume [e.g. Iwaniuk et al., 2005, 2006; Iwaniuk and Wylie, 2007]. With a relatively small number of species, such comparisons become problematic because a single data point can have a huge influence on the slope and intercept of an allometric line. Instead, we have taken a qualitative approach by examining the relative size of each nucleus as a percentage of overall brain volume. Also, in recent years comparative analyses have used phylogenetically corrected statistics [e.g. Garland et al., 1992, 2005] to account for possible phylogenetic effects. The small number of species examined herein has low statistical power that would be even further reduced with such a correction. The low sample size of each of our activity pattern subgroups further con-strains our statistical power, therefore making such phylogenetic corrections impractical. Instead, we compared the results of a hi-
Table 1. List of the owl species surveyed, sample sizes, volumes of the brain and all nuclei measured
Commonname
Species n Activitypattern
Brain volume mm3
TeOmm3
nRtmm3
Emm3
DLLmm
Wulstmm3
GLvmm3
nBOR mm3
LM mm3
Barn owl T. alba 1 Nocturnal 5,849.80 136.510 2.926 7.111 5.479 509.071 1.326 0.660 3.374Saw-whet owl A. acadicus 2 Nocturnal 2,999.93 68.542 2.618 6.769 6.884 783.317 2.313 0.737 2.748Short-eared owl A. flammeus 1 Crepuscular 6,221.04 99.163 3.860 12.583 8.345 795.418 1.593 0.779 3.138Great grey owl S. nebulosa 1 Crepuscular 13,433.39 161.304 6.250 26.655 16.421 1,880.845 3.921 1.431 5.537Barred owl S. varia 1 Nocturnal 12,727.12 166.642 7.248 24.206 13.908 2,036.382 3.719 1.562 5.783Great horned owl B. virginianus 3 Crepuscular 17,199.09 277.015 9.711 34.883 18.545 2,617.419 3.510 2.640 5.977Snowy owl B. scandiacus 3 Diurnal 17,345.97 286.041 12.158 58.802 26.475 3,561.186 2.540 1.830 8.369Hawk owl S. ulula 1 Diurnal 9,408.30 204.755 7.678 29.798 13.332 1,544.342 1.907 1.182 4.213Boobook owl N. boobook 1 Nocturnal 6,338.80 148.150 5.503 15.800 10.499 1,503.680 2.153 2.214 4.281Tawny frogmouth P. strigoides 1 Nocturnal 5,311 290.880 8.948 38.000 5.935 1,226.890 1.320 2.561 1.914
BBE343810.indd 4BBE343810.indd 4 10.12.2012 14:49:3410.12.2012 14:49:34

Relative Size of Visual Pathways in Owls Brain Behav Evol 5
erarchical cluster analysis to the most complete phylogenetic tree currently available for owls [Wink et al., 2008]. Using a similar approach to Iwaniuk and Hurd [2005], we performed a hierarchi-cal cluster analysis of the proportional size of all auditory nuclei measured, with JMP (Version 7, SAS Institute Inc., Cary, N.C., USA). Although the dendrograms produced by hierarchical clus-ter analyses are based on similarities among species, compar-ing the dendrogram with a phylogeny of the species of interestcan reveal whether interspecific differences have arisen largely through phylogenetic relatedness or independent evolution [Iwa-niuk and Hurd, 2005; Gutiérrez-Ibáñez et al., 2011]. Here, we show the results generated using an average linkage method, but the dendrograms arising from other linkage methods (e.g. Ward’s and UPGMA) shared the same topology.
Results
We found marked differences in the relative size of all visual brain structures among the species studied ( fig. 2 ). In the thalamofugal pathway, the boobook and the north-ern saw-whet owls have the largest DLL relative volume ( fig. 2 a), more than twice the size of that of the barn owl, the species with the smallest relative volume. The situa-tion is very similar regarding the wulst, which was largest in the boobook and the northern saw-whet owls and smallest in the barn owl ( fig. 2 b). In the case of the TeO the tawny frogmouth has the largest relative volume, al-
a b
c d
e f
Fig. 1. Photomicrographs of coronal sec-tions through the different components of the tectofugal pathway in owls. a The TeO of the northern hawk owl (S. ulula) . Scale bar = 800 � m. b The nRt of the great horned owl (B. virginianus) . Scale bar = 600 � m. c The E in the short-eared owl (A. flammeus) . Scale bar = 800 � m. d Thedotted lines show the portion of the nucle-us DLL measured (see Methods for details) in the northern hawk owl (S. ulula) . Scale bar = 400 � m. e The three components of the wulst, the hyperpallium apicale (HA), the nucleus interstitialis hyperpallii apica-lis (IHA) and the hyperpallium densocel-lulare (HD) also in the northern hawk owl. f The borders of the nBOR in the snowy owl (B. scandiacus) . Scale bar = 600 � m. DLAmc = Nucleus dorsolateralis anterior, pars magnocellularis; DLAlr = nucleus dorsolateralis anterior, pars lateralis ros-tralis; FPL = fasciculus prosencephali late-ralis; HV = hyperstriatum ventral; Ipc = parvocellular part of the nucleus isthmi; Imc = magnocellular part of the nucleus isthmi; IC = inferior colliculus; LM = nu-cleus lentiformis mesencephali; N = nido-pallium; Ru = nucleus ruber; Inf = infun-dibulum.
BBE343810.indd 5BBE343810.indd 5 10.12.2012 14:49:3410.12.2012 14:49:34

Gutiérrez-Ibáñez /Iwaniuk /Lisney /Wylie
Brain Behav Evol6
most twice that of the two closest owl species (the boo-book and the northern saw-whet owl; fig. 2 c), and more than four times larger than the owls with the smallest TeO, the great grey owl and the barn owl. The situation is similar for the Rt and E, the other components of the tec-tofugal pathway. The relative size of both of these struc-
tures is four to five times greater in the tawny frogmouth, compared to the owls ( fig. 2 d, e). Among owls, as with the TeO, the boobook and the northern saw-whet owls have the largest relative Rt volume ( fig. 2 d), but in the case of E, the owls with the largest relative volume are the snowy and northern hawk owls.
0 0.05 0.20
DLL
nRt
0.250.10% Brain volume % Brain volume % Brain volume
0.15
S.uB.sB.vS.nA.fS.v
N.bA.a
T.a
P.s
0 5 20
Wulst
25 3010 15
S.uB.sA.fS.nB.vS.v
N.bA.a
T.a
P.s
0 1 2 3 4 5 6
TeOS.uB.sA.fS.nB.vS.v
N.bA.a
T.a
P.s
0 0.04 0.160.08% Brain volume
0.12
S.uB.sB.vS.nA.fS.v
N.bA.a
T.a
P.s
E
0 0.1 0.2 0.3 0.4 0.5 0.6 0.7 0.8% Brain volume
S.uB.sB.vS.nA.fS.v
N.bA.a
T.a
P.s
LM
0 0.02 0.04 0.06 0.08 0.10 0.12% Brain volume
S.uB.sB.vS.n
A.fS.v
N.bA.aT.a
P.s
nBOR
0 0.010.1 0.2
log
10 te
ctof
ugal
pat
hway
% b
rain
vol
ume
log10 tectofugal pathway % brain volume
0.3 0.4 0.5 0.6 0.7 0.8 0.90.8
1.0
1.2
1.4
1.6
1.8
2.0
0.02 0.03 0.04 0.05 0.06% Brain volume
S.u
S.u
B.s
B.s
B.v
B.v
S.n S.n
A.f
A.f
S.vS.v
N.bN.bA.a A.a
T.a
T.a
P.s
P.s
GLv
0 0.040.02 0.100.06% Brain volume
0.08
S.uB.sB.vS.nA.fS.v
N.bA.a
T.a
P.s
a b c
d e f
g h i
Fig. 2. Bar graphs showing the relative size of visual nuclei in the tawny frogmouth (P. strigoides) and nine species of owls expressed as a percentage of total brain volume. a Nucleus DLL. b Wulst. c TeO. d nRt. e E. Bar graphs also show the relative size of three additional retinorecipient nuclei in the same species: nucleus GLv ( f ), nucleus LM ( g ) and nBOR ( h ). The shading of the bars shows the activity pattern of each species: black = nocturnal, grey = cre-puscular, white = diurnal. i A logarithmic scatter plot of the total volume of the thalamofugal pathway expressed as a percentage of total brain volume, plotted as a function of the total volume of the tectofugal pathway expressed as a percentage of total brain vol-
ume in the same species as above. The solid line indicates the least squares linear regression line for all species and the dotted lines are the 95% confidence interval around the regression line. The colour of the dot indicates the activity pattern of each species: black = nocturnal, grey = crepuscular, white = diurnal. T.a = Barn owl (T. alba) ; A.a = northern saw-whet owl (A. acadicus) ; A.f = short-eared owl (A. flammeus) ; S.n = great grey owl (S. nebulosa) ; S.v = barred owl (S. varia) ; B.v = great horned owl (B. virginianus) ; B.s = snowy owl (B. scandiacus) ; S.u = northern hawk owl (S. ulu-la) ; N.b = boobook owl (N. boobook) ; P.s = tawny frogmouth (P. strigoides) .
BBE343810.indd 6BBE343810.indd 6 10.12.2012 14:49:3410.12.2012 14:49:34

Relative Size of Visual Pathways in Owls Brain Behav Evol 7
We also found marked differences in the relative size of the other three visual nuclei we measured. In the case of GLv, the northern saw-whet owl has the largest relative volume, almost four times that of the great horned owl, the species with the smallest relative volume ( fig. 2 ). For LM ( fig. 2 f) the boobook and northern saw-whet owls have the largest relative volumes, about twice that of oth-er species. Finally, in the case of nBOR, the situation is more similar to the structures in the tectofugal pathway; the tawny frogmouth has the largest relative volume, fol-lowed by the boobook and northern saw-whet owls.
Figure 2 i shows a scatterplot of the logarithm of the total relative volume of the tectofugal pathway (TeO + Rt + E) versus the total relative volume of the thalamofugal pathway (DLL + wulst) among the species studied. We found a significant positive correlation between the rela-tive volume of these two pathways (R 2 = 0.472, F 1,8 = 7.148, p ! 0.05). This is also true when the tawny frog-mouth is excluded (R 2 = 0.619, F 1,7 = 11.391, p ! 0.05). The
barn owl appears as an outlier as it falls well below the confidence intervals with both the smallest tectofugal and thalamofugal pathways.
Visual Pathways and Neurons in the RGC Layer We found no correlation between H:V ratio and the
relative volume of any of the nuclei belonging to either the thalamofugal pathway or the tectofugal pathway ( table 2 ), nor with the total volume of the thalamofugal pathway ( table 2 ; fig. 3 a) or the tectofugal pathway ( table 2 ; fig. 3 b).
We found a significant positive correlation between the relative volume of all the visual nuclei measured (tec-tofugal pathway + thalamofugal pathway + GLv + LM + nBOR) and the total number of RGC layer neurons, rela-tive to brain volume (R 2 = 0.523, F 1,8 = 6.586, p ! 0.05; fig. 3 c). Finally, figure 3 d shows a scatterplot of the rela-tive size of all the visual brain structures measured plot-ted against the total volume of all auditory nuclei mea-sured in Gutiérrez-Ibáñez et al. [2011]. We found no cor-relation between the total volumes of the visual and auditory pathways (R 2 = 0.0449, F 1,7 = 0.282, p = 0.614). In this comparison, the northern saw-whet owl appears as an outlier with both enlarged visual and auditory ar-eas. When this owl is excluded, there is a significant, neg-ative correlation between the total volume of all auditory and visual areas among the remaining species (R 2 = 0.736, F 1,6 = 13.960, p ! 0.05).
Lastly, we compared a dendrogram resulting from a hierarchical cluster analysis with a molecular phylogeny of the owl species we examined. Figure 4 a depicts the phylogenetic relationships among the nine owl species used in this study [Wink et al., 2008] and figure 4 b il-lustrates the similarity among the nine species based on a cluster analysis of the relative size of all visual brain
Table 3. R GC numbers, average density and amount of RGCs relative to brain volume for some of the owl species surveyed
Common name Species n Total RGCs Average RGC density, cells/mm2
RGCs number/brain volume, cells/mm3
Barn owl T. alba 1 1,271,450 6,064 217.35Saw-whet owl A. acadicus 2 1,948,100 9,840 619.85Short-eared owl A. flammeus 1 2,451,200 9,682 394.02Great grey owl S. nebulosa 1 5,313,825 13,285 395.57Barred owl S. varia 1 6,915,200 12,105 543.34Great horned owl B. virginianus 3 6,858,000 7,410 398.74Snowy owl B. scandiacus 3 5,973,200 9,967 344.36Hawk owl S. ulula 1 5,920,425 13,855 629.28
R GC numbers and densities are from Lisney et al. [2012].
Table 2. R esults of linear regressions between H:V ratio and the relative volume of TeO, nRt, E, DLL, wulst, total volume of the tectofugal pathway (TeO + Rt + E) and thalamofugal pathway (DLL + wulst)
Nuclei R2 F1,8 p
GLv 0.0352 0.219 0.656Wulst 0.252 2.698 0.139TeO 0.0376 0.234 0.645nRt 0.00246 0.0148 0.907E 0.105 0.703 0.434Tectofugal pathway 0.0793 0.517 0.499Thalamofugal pathway 0.0000119 0.0000716 0.994
BBE343810.indd 7BBE343810.indd 7 10.12.2012 14:49:3510.12.2012 14:49:35

Gutiérrez-Ibáñez /Iwaniuk /Lisney /Wylie
Brain Behav Evol8
S.u
S.u
S.u
S.u
B.sB.s
B.s
B.s
B.v
B.vB.v
B.v
S.nS.n
S.nS.n
A.f
A.f
A.f
A.f
S.vS.v
S.v
S.v
A.a
A.aA.a
A.a
T.aT.a
T.a
T.a
00.9
a
1.0 1.1
log10 thalamofugal pathway % brain volume
log
10 to
tal R
GC
s/b
rain
vol
ume
log
10 a
udit
ory
pat
hway
s %
bra
in
1.2 1.3 1.4
H:V
rati
o
1.5 1.6
1.0 1.1log10 total visual pathway % brain volume
1.2 1.3 1.4 1.5 1.6 1.7
0.15 0.25 0.300.20 0.35 0.40 0.45
log10 tectofugal pathway % brain volume
1
2
3
4
5
0
H:V
rati
o
1
2
3
4
5
c
b
d
1.0 1.1log10 total visual pathway % brain volume
1.2 1.3 1.4 1.5 1.6 1.74.0
4.4
4.2
4.6
4.8
5.0
5.2
–1.2
–0.6
–0.8
–1.0
–0.4
–0.2
0
0.2
Fig. 3. Correlation between the relative volume of visual nuclei and retinal topography, RGC numbers and relative volume of auditory nuclei. a A scatter plot of H:V ratio plotted as a function of the logarithm of the total volume of the thalamofugal pathway expressed as a percentage of total brain volume for eight species of owl. b A scatter plot of H:V ratio plotted as a function of the logarithm of the total volume of the tectofugal pathway ex-pressed as a percentage of total brain volume for eight species of owl. c A scatter plot of the logarithm of the total number of neu-rons in the retinal ganglion cell layer divided by the brain vol-ume plotted as a function of the logarithm of the total volume of the visual pathway expressed as a percentage of total brain vol-ume for the same eight species of owl. d A scatter plot of the logarithm of the total volume of the auditory nuclei expressed as
a percentage of total brain (see Results) plotted as a function of the logarithm of the total volume of the visual pathway ex-pressed as a percentage of total brain volume (see Results) for the same eight species of owl. The solid lines indicate the least squares linear regression line for all species and the dotted lines are the 95% confidence interval around the regression line. The colour of the dot indicates the activity pattern of each species: black = nocturnal, grey = crepuscular, white = diurnal. T.a = Barn owl (T. alba) ; A.a = northern saw-whet owl (A. acadicus) ; A.f = short-eared owl (A. f lammeus) ; S.n = great grey owl (S. nebulosa) ; S.v = barred owl (S. varia) ; B.v = great horned owl (B. virginianus) ; B.s = snowy owl (B. scandiacus) ; S.u = northern hawk owl (S. ulula) ; N.b = boobook owl (N. boobook) ; P.s = taw-ny frogmouth (P. strigoides) .
BBE343810.indd 8BBE343810.indd 8 10.12.2012 14:49:3510.12.2012 14:49:35

Relative Size of Visual Pathways in Owls Brain Behav Evol 9
structures. This dendrogram has two main clusters and it is clear that the species are not separated by their ac-tivity pattern. In one cluster, the northern saw-whet owl and the boobook owl, both nocturnal species, are grouped with the northern hawk owl, a diurnal species, and the great horned owl, a crepuscular species. In the other cluster, the nocturnal barn owl appears as the root branch to a group that includes three crepuscular spe-cies and one diurnal, the snowy owl ( fig. 4 b). The den-drogram also does not resemble the phylogenetic rela-tionships among species and therefore the relative size of the entire visual system does not reflect activity pat-tern or phylogeny.
Discussion
Overall, our study shows that there are clear differ-ences in the relative size of the visual pathways among owl species. This is one of the few studies to evaluate re-lationships between retinal topography and RGC layer neuron numbers and the relative size of the brain visual pathways in any vertebrate. Previously, Kaskan et al. [2005] found that in mammals there is no correlation be-tween rod:cone ratios and the relative size of cortical vi-sual areas. Also, Collin and Pettigrew [1988a, b] suggest-ed that in reef teleosts RGC topography is related to the relative size of the TeO.
Thalamofugal Pathway On the basis of gross anatomy, Stingelin [1958] report-
ed that the barn owl visual wulst appears much smaller than the wulst of strigid owls, mostly in that it does not extend completely to the lateral edge of the telencephalon. In agreement with this, Bravo and Pettigrew [1981] found
that the peak density of RGCs projecting to the TeO was similar between the barn owl and the burrowing owl, but the peak density of RGCs projecting to the thalamofugal pathway was four times larger in the burrowing owl. Our findings that the barn owl has both the smallest DLL ( fig. 2 a) and wulst ( fig. 2 b) of all species sampled confirms the suggestion that the thalamofugal pathway is smaller in the barn owl compared to strigid owls.
In both mammals [Barton, 2004] and birds [Iwaniuk et al., 2008], the relative size of the thalamofugal pathway is positively correlated with the size of the binocular vi-sual field. Therefore, one may expect that because of the reduced thalamofugal pathway in the barn owl, there may also be differences in binocular overlap between the barn owl and other owl species, but this does not appear to be the case. The barn owl has neither less binocular overlap nor less convergent orbits than other owls [Iwaniuk et al., 2008]. We found that the barn owl also has a relatively small tectofugal pathway and, in fact, there is a positive correlation between the relative size of the thalamofugal and tectofugal pathway in all species ( fig. 2 f). This indi-cates that the barn owl does not have a specific reduction of the thalamofugal pathway, but an overall reduction of the visual pathways, which is most likely related to the relatively low number of RGCs in this species (see below; table 3 ). Why the barn owl is so different from strigid owls is not clear. The ecology and hunting behaviour of barn owls does not differ greatly from many strigid owls [König and Weick, 2008]. Tytonid owls do differ in several mor-phological aspects from strigid owls, such as the shape of the sternum and feet morphology [König and Weick, 2008], and several lines of evidence indicate a split be-tween the two families dating back to the Neogene (23 mya) [Brown and Mindell, 2009], so these neuroanatom-ical differences could reflect aspects of this ancient diver-
Strix varia
Strix nebulosa
Bubo scandiacus
Bubo virginianus
Asio flammeus
Surnia ulula
Ninox boobook
Tyto alba
Aegolius acadicus
Strix varia
Strix nebulosa
Bubo scandiacus
Bubo virginianus
Asio flammeus
Surnia ulula
Ninox boobook
Tyto alba
Aegolius acadicus
a b
Fig. 4. Comparison of owls phylogeny and cluster analysis of the relative volume of all visual brain structures. a Phylogenetic re-lationships among the nine species usedin this study based on Wink et al. [2009]. b The similarity between species based on a cluster analysis of the relative size of all visual brain structures. The coloured squares indicate the activity pattern of each species: black = nocturnal, grey = cre-puscular, white = diurnal.
BBE343810.indd 9BBE343810.indd 9 10.12.2012 14:49:3610.12.2012 14:49:36

Gutiérrez-Ibáñez /Iwaniuk /Lisney /Wylie
Brain Behav Evol10
gence. Given these apparent differences between strigid and tytonid owls, future studies should address whether the barn owl is typical of all tytonids and whether there are differences in the retinal and brain morphology be-tween Tyto and Phodilus , the two genera within the Ty-tonidae.
Our results confirm previous findings [Iwaniuk etal., 2006, 2008] that the tawny frogmouth has a relative wulst volume similar to that of owls ( fig. 2 b), and also show that this is true for DLL, which relays information from the retina to the visual wulst [Karten et al., 1973; Bagnoli et al., 1990]. We also found that the relative size of the tectofugal pathway is much larger in the tawny frogmouth than in any owls ( fig. 2 c–e). Because the taw-ny frogmouth has feeding habits and morphology very similar to owls [Cleere, 1998; Higgins, 1999], we expect-ed this species to be closer to owls with respect to the relative size of the tectofugal pathway. While some stud-ies have placed caprimulgiformes and the frogmouth as closely related to owls [Sibley and Ahlquist, 1990], sev-eral other studies place them as more closely related to hummingbirds and swifts [Cracraft et al., 2004; Davis, 2008; Hacket et al., 2008] and thus the common habits of owls and the frogmouths probably evolved indepen-dently and the difference in the relative size of the tec-tofugal pathway could reflect different evolutionary his-tories.
Auditory-Visual Trade-Off? Although our results show no significant correlation
between the relative size of visual and auditory pathways when all owl species are included, there is a significant negative correlation between these two sensory pathways when the northern saw-whet owl is excluded (see Results; fig. 3 d). Why the northern saw-whet owl escapes this trend of a trade-off between the relative size of auditory and visual regions is unclear. The northern saw-whet owl is peculiar among the asymmetrically eared species with enlarged auditory pathways because it is both strictly nocturnal and hunts mostly in woodlands. Other asym-metrically eared, nocturnal species (e.g. barn and short-eared owls) hunt primarily in open habitats [del Hoyo et al., 1999; König and Weick, 2008]. The northern saw-whet owl therefore hunts in an especially dim habitat that is full of obstacles and thus might require more visu-ally guided prey capture and navigation than other asymmetrically eared species. Although this life history is not unique amongst all owls, the saw-whet owl was the only species that had all of these traits in our analyses. This possible trade-off between sensory modalities
should be taken with caution as the inclusion of more species in the analysis, especially other nocturnal asym-metrically eared species that hunt primarily in wood-lands (e.g. the mottled owl, Ciccaba virgata , and the bo-real owl, Aegolius funereus ) [Norberg, 1977; König and Weick, 2008] may show that the northern saw-whet owl is not an exception and that there is no significant rela-tionship between the relative sizes of the auditory and visual pathways.
Despite the caveats in this analysis, similar sensory system trade-offs have been reported in mammals. For example, Baron et al. [1996] found that there is a trade-off between the relative sizes of auditory and visual structures in the mesencephalon in bats, and Eisenberg [1981] also suggested that a similar trade-off between vi-sual and auditory pathways may occur in tenrecs, which use echolocation and have small eyes. In owls, the pos-sible trade-off between the visual and auditory pathways is likely driven by the increased capability of asymmetri-cally eared owls to use auditory cues to locate prey. Spe-cies like the barn owl and the northern saw-whet owl can locate sounds within 2°, and some asymmetrically eared species can hunt in complete darkness [Payne, 1971; Konishi, 1973]. An improved ability to locate prey using auditory cues could loosen the selective pressure on maintaining a well-developed visual system for visually-guided prey capture and thus result in the reduction of the relative amount of RGCs and relative size of the vi-sual pathways.
Activity Pattern In birds, and vertebrates in general, one of the adap-
tations of the visual system to scotopic environmentsis to increase retinal summation, i.e. an increase in the amount of photoreceptors that converge onto one RGC [Warrant, 2004; Hall and Ross, 2007]. One consequence of this is a reduction in the number RGCs [Kay and Kirk, 2000, 2004; Hall et al., 2009]. In birds, there is evidence that this, in turn, results in a reduction of the tectofugal pathway [Martin et al., 2007; Iwaniuk et al., 2010b; Cor-field et al., 2011]. Surprisingly, our results show that in owls there is no correlation between the relative size of the tectofugal pathway and activity pattern. First, we found no correlation between the relative size of the tec-tofugal (or the thalamofugal) pathway and H:V ratio ( fig. 3 a, b), which are correlated with activity pattern in owls [Lisney et al., 2012]. Second, in our cluster analysis ( fig. 4 b), species do not appear to be grouped by activity pattern, indicating that the relative size of visual path-ways is not similar among species with similar activity
BBE343810.indd 10BBE343810.indd 10 10.12.2012 14:49:3610.12.2012 14:49:36

Relative Size of Visual Pathways in Owls Brain Behav Evol 11
patterns. Also, in the boobook owl, a nocturnal species for which we did not have an H:V ratio, the size of the tectofugal pathway is relatively large compared to other owls ( fig. 2 c–e), further indicating that nocturnal owls do not have a reduced tectofugal pathway. Instead, our results show that the relative sizes of the visual pathways are correlated with the relative number of RGC layer neurons ( fig. 3 c), which, in turn, appears to be indepen-dent of activity pattern in the species examined. This is well exemplified by the northern saw-whet and barn owls. Both of these species are strictly nocturnal, but the northern saw-whet owl has almost three times as many neurons in the RGC layer, relative to brain size, as the barn owl ( table 3 ). Previously, Hall et al. [2009] had found that there is no difference in the relative size of the optic foramen between diurnal and nocturnal owls, which also suggests that the number of RGCs is not correlated with activity pattern in owls. Thus, in owls, activity pat-terns are associated with differences in eye morphology [Lisney et al., 2012], rod:cone ratios and retinal topogra-phy [Oehme, 1961; Bravo and Pettigrew, 1981; Lisney et al., 2011, 2012], but not in the number of RGCs and the relative size of visual pathways. This is similar to what Kaskan et al. [2005] found in mammals where the rela-tive size of cortical visual areas between diurnal and noc-turnal species is not different despite a great variation in rod:cone ratios. One explanation for this lack of correla-tion between activity pattern and the relative size of vi-sual pathways is that the amount of variation in the pe-ripheral visual system related to changes in the activity pattern is enough to accommodate the changes in light available for vision resulting from a nocturnal to diurnal transition (or vice versa) and therefore changes in the number of RGCs or the relative size of visual pathways are not necessary. Alternatively, it is possible that the number of RGCs, and hence the relative size of visual pathways, is constrained by evolutionary history. Re-gardless of whether they are diurnal or nocturnal, all owls have relatively large eyes [Brooke et al., 1999], con-vergent orbits and a broad binocular visual field [Mar-tin, 1986; Iwaniuk et al., 2008] and a relatively smalloptic foramen [Hall et al., 2009] when compared to oth-er birds. All these characteristics strongly suggest that owls are descended from a nocturnal ancestor and more diurnal activity patterns have evolved independently several times. This would be similar to what has been proposed in the evolution of the visual system of mam-mals, where a nocturnal ‘bottleneck’ seems to define sev-eral of the characteristics of the mammalian visual sys-tem, even in diurnal species [Heesy and Hall, 2010].
Conclusion
Our results show that there is little correlation be-tween the relative size of visual pathways and activity pat-tern in owls, despite the fact that several characteristics of the peripheral visual system (e.g. eye shape and RGC distribution, see Introduction) do vary with the activity pattern of each species. Instead, our results strongly sug-gest that the relative size of all visual structures in the brain is related to the number of cells in the RGC layer relative to brain size. Interestingly, the relative sizes of the main visual pathways (tectofugal and thalamofugal) co-vary, even though they have different functions. This is similar to what we found in our study of the relative size of the auditory pathways of owls [Gutiérrez-Ibáñez et al., 2011] where the relative size of two distinct auditory path-ways, the intensity and time-delay pathways, are highly correlated. This is likely related to the hearing range of each species and therefore to the amount of sensory cells in the periphery [Gutiérrez-Ibáñez et al., 2011]. Further, several other studies in vertebrates suggest that the num-ber of sensory cells is the main driver of the relative size of sensory areas [e.g. Roth et al., 1992; Kotrschal et al., 1998]. Together, these points emphasize the need for fu-ture research in sensory ecology to study variation at all levels within a given sensory pathway.
Finally, we still need to consider why there is so much variation in the relative number of cells in the RGC layer (and therefore visual pathways) among owls. As stated before (see Discussion) a combination of both phyloge-netic history and particular aspects of the ecology of each species may help to explain these differences. Part of the difficulty in interpreting our findings derives from a lim-ited sampling of owl species. Even though this is the most extensive study of its kind in owls, several other groups are missing. For example, the study of other nocturnal and diurnal species of small owls in the tribe Surniinae [Wink et al., 2008] could help to clarify the uniqueness of the visual system of the northern saw-wet owl.
Acknowledgments
We wish to thank Catherine Carr, Healesville Sanctuary and the Alberta Institute for Wildlife Conservation for providing us with specimens for our study and David Graham for editorial help. Funding for this study was provided by grants from the Nat-ural Sciences and Engineering Council of Canada (NSERC) to A.N.I. and D.R.W.
BBE343810.indd 11BBE343810.indd 11 10.12.2012 14:49:3610.12.2012 14:49:36

Gutiérrez-Ibáñez /Iwaniuk /Lisney /Wylie
Brain Behav Evol12
References
Bagnoli P, Fontanesi G, Casini G, Porciatti V (1990): Binocularity in the little owl, Athene noctua . I. Anatomical investigation of the thalamo-Wulst pathway. Brain Behav Evol 35: 31–39.
Baron G, Stephan H, Frahm HD (1996): Com-parative Neurobiology in Chiroptera. Basel, Birkhäuser Verlag.
Baron J, Pinto L, Dias MO, Lima B, Neuen-schwander S (2007): Directional responses of visual wulst neurones to grating and plaid patterns in the awake owl. Europ J Neurosci 26: 1950–1968.
Barton RA (1998): Visual specialization and brain evolution in primates. Proc R Soc Lond B 265: 1933–1937.
Barton RA (2004): Binocularity and brain evolu-tion in primates. Proc Nat Acad Sci USA 101: 10113–10115.
Bischof HJ, Watanabe S (1997): On the structure and function of the tectofugal visual path-way in laterally eyed birds. Eur J Morph 35: 246–254.
Bravo H, Pettigrew JD (1981): The distributionof neurons projecting from the retina andvisual cortex to the thalamus and tectumopticum of the barn owl, Tyto alba , and bur-rowing owl, Speotyto cunicularia . J Comp Neurol 199: 419–441.
Brooke MDL, Hanley S, Laughlin SB (1999): The scaling of eye size with body mass in birds. Proc R Soc Lond B 266: 405–412.
Brown JW, Mindell DP (2009): Owls (Strigi-formes); in Hedges SB, Sumar S (eds): The Timetree of Life. Oxford, University Press, pp 451–453.
Budzynski CA, Bingman VP (2004): Participa-tion of the thalamofugal visual pathway in a coarse pattern discrimination task in an open arena. Behav Brain Res 153: 543–556.
Catania KC (2005): Evolution of sensory special-izations in insectivores. Anat Rec A 287A:1038–1050.
Chen Y, Naito J (1999): A quantitative analysis of the cells in the ganglion cell layer of the chick retina. Brain Behav Evol 53: 75–86.
Clark RJ (1975): A field study of the short-eared owl, Asio flammeus (Pontoppidan), in North America. Wildl Monogr 47: 1–67.
Cleere N (1998): Nightjars: A Guide to the Night-jars, Nighthawks, and Their Relatives. Yale University Press, New Haven.
Collin SP, Pettigrew JD (1988a): Retinal topogra-phy in reef teleosts. I. Some species withwell-developed areae but poorly-developed streaks. Brain Behav Evol 31: 269–282.
Collin SP, PettigrewJ D (1988b): Retinal topogra-phy in reef teleosts. II. Some species with prominent horizontal streaks and high-den-sity areae . Brain Behav Evol 31: 283–295.
Corfield JR, Gsell AC, Brunton D, Heesy CP, Hall MI, Acosta ML, Iwaniuk AI (2011): An-atomical specializations for nocturnality in a critically endangered parrot, the kakapo (Strigops habroptilus) . PLoS ONE 6:e22945.
Cracraft J, Barker FK, Braun M, Harshman J, Dyke GJ, et al. (2004): Phylogenetic relation-ships among modern birds (Neornithes):toward an avian tree of life; in Cracraft J, Donoghue MJ (eds): Assembling the Tree of Life. New York, Oxford University Press, pp 468–489.
Davis KE (2008): Reweaving the tapestry: a su-pertree of birds; PhD thesis, University of Glasgow.
del Hoyo J, Elliott A, Sargatal J (eds) (1999): Handbook of the Birds of the World, vol 5: Barn Owls to Hummingbirds. Barcelona, Lynx Editions.
Eisenberg JF (1981): The Mammalian Radia-tions: an Analysis of Trends of Evolution, Adaptation and Behavior. Chicago, Univer-sity of Chicago Press.
Fischer QS, Kirby MA (1991): Number and dis-tribution of retinal ganglion cells in anubis baboons (Papio anubis) . Brain Behav Evol 37: 189–203.
Fite KV, Reiner A, Hunt SP (1981): Optokinetic nystagmus and the accessory optic systems of pigeon and turtle. Brain Behav Evol 16: 192–202.
Gamlin PDR, Cohen DH (1988): Retinal projec-tions to the pretectum in the pigeon (Colum-ba livia) . J Comp Neurol 269: 1–17.
Gamlin PD, Reiner A, Erichsen JT, Karten HJ, Cohen DH (1984): The neural substrate for the pupillary light reflex in the pigeon (Co-lumba livia) . J Comp Neurol 226: 523–543.
Garland T Jr, Bennett AF, Rezende EL (2005): Phylogenetic approaches in comparative physiology. J Exp Biol 208: 3015–3035.
Garland T Jr, Harvey PH, Ives AR (1992): Proce-dures for the analysis of comparative data us-ing phylogenetically independent contrasts. Syst Biol 41: 18–32.
Gutiérrez-Ibáñez C, Iwaniuk AN, Wylie DR (2011): Relative size of auditory pathways in symmetrically and asymmetrically eared owls. Brain Behav Evol 87: 286–301.
Hackett SJ, Kimball RT, Reddy S, Bowie RCK, Braun EL, et al. (2008): A phylogenomic study of birds reveals their evolutionary his-tory. Science 320: 1763–1768.
Hall MI, Gutiérrez-Ibáñez C, Iwaniuk AN (2009): The morphology of the optic foramen and activity pattern in birds. Anat Rec 292: 1827–1845.
Hall MI, Ross CF (2007): Eye shape and activity pattern in birds. J Zool 271: 437–444.
Harmening WM, Wagner H (2011): From optics to attention: visual perception in barn owls. J Comp Physiol A 197: 1031–1042.
Hayes BP (1984): Cell populations of the gangli-on cell layer: displaced amacrine and match-ing cells in the pigeon retina. Exp Brain Res 56: 565–573.
Heesy CP, Hall MI (2010): The nocturnal bottle-neck and the evolution of mammalian vi-sion. Brain Behav Evol 75: 195–203.
Herculano-Houzel S (2011): Not all brains are made the same: new views on brain scaling in evolution. Brain Behav Evol 78: 22–36.
Higgins PJ (ed) (1999): Handbook of Australian, New Zealand and Antarctic Birds vol 4: Par-rots to Dollarbird. Melbourne, Oxford Uni-versity Press.
Husband S, Shimizu T (2001): Evolution of the avian visual system; in Cook RG (ed): Avian Visual Cognition. Available online. www.pi-geon.psy.tufts.edu/avc/husband/.
Iwaniuk AN, Clayton DH, Wylie DR (2006): Echo-location, vocal learning, auditory localization and the evolution of the avian inferior collicu-lus (MLd). Behav Brain Res 167: 305–317.
Iwaniuk AN, Dean KM, Nelson JE (2005): Inter-specific allometry of the brain and brain re-gions in parrots (Psittaciformes): compari-sons with other birds and primates. Brain Behav Evol 65: 40–59.
Iwaniuk AN, Gutiérrez-Ibáñez C, Pakan JMP, Wylie DR (2010b): Allometric scaling of the tectofugal pathway in birds. Brain Behav Evol 75: 122–137.
Iwaniuk AN, Hall MI, Heesy CP, Wylie DRW (2008): Neural correlates of orbit orientation in birds. J Comp Physiol A 194: 267–282.
Iwaniuk AN, Heesy CP, Hall MI (2010a): Mor-phometrics of the eyes and orbits of the noc-turnal swallow-tailed gull (Creagrus furca-tus) . Can J Zool 88: 855–865.
Iwaniuk AN, Hurd PL (2005): The evolution of cerebrotypes in birds. Brain Behav Evol 65: 215–230.
Iwaniuk AN, Wylie DRW (2006): The evolution of stereopsis and the Wulst in caprimulgi-form birds: a comparative analysis. J Comp Physiol A 192: 1313–1326.
Iwaniuk AN, Wylie DRW (2007): Comparative evidence of a neural specialization for hover-ing in hummingbirds: hypertrophy of the pretectal nucleus lentiformis mesencephali. J Comp Neurol 500: 211–221.
Karten HJ (1969): The organisation of the avian telencephalon and some speculations on the phylogeny of the amniote telencephalon. Ann NY Acad So 167: 167–179.
Karten HJ, Fite KV, Brecha N (1977): Specific projection of displaced retinal ganglion cells upon the accessory optic system in the pi-geon ( Columba livia ). Proc Natl Acad Sci USA 74: 1753–1756.
Karten H, Hodos W (1967): A Stereotaxic Atlas of the Brain of the Pigeon ( Columba livia ). Baltimore, Johns Hopkins University Press.
Karten HJ, Hodos W, Nauta WHJ, Revzin AM (1973): Neural connections of the ‘visual wulst’ of the avian telencephalon: experi-mental studies in the pigeon (Columba livia) and the owl (Speotyto cunicularia) . J Comp Neurol 150: 253–277.
Karten HJ, Konishi M, Pettigrew JD, (1978): So-matosensory representation in the anterior Wulst of the owl (Speotyto cunicularis) . Soc Neurosci Abstr 4: 554.
BBE343810.indd 12BBE343810.indd 12 10.12.2012 14:49:3610.12.2012 14:49:36

Relative Size of Visual Pathways in Owls Brain Behav Evol 13
Karten HJ, Nauta WHJ (1968): Organization of retinothalamic projections in the pigeon and the owl. Anat Rec 160: 373.
Kaskan P, Franco C, Yamada E, Silveira LCL, Darlington RB, Finlay BL (2005): Peripheral variability and central constancy in mam-malian visual system evolution. Proc R Soc Lond B 272: 91–100.
Kay RF, Kirk EC (2000): Osteological evidence for the evolution of activity pattern and vi-sual acuity in primates. Am J Physical An-thropol 113: 235–262.
Kirk EC, Kay RF (2004): The evolution of high visual acuity in the Anthropoidea; in Ross CF, Kay RF (eds): Anthropoid Origins: New Visions. New York, Kluwer Academic/Ple-num, pp 539–602.
König C, Weick F (2008): Owls of the World, ed 2. London, Christopher Helm.
Konishi M (1973): How the owl tracks its prey. Am Sci 61: 414–424.
Kotrschal K, van Straaden MJ, Huber R (1998): Fish brains: evolution and environmental re-lationships. Rev Fish Biol Fisheries 8: 373–408.
Lisney TJ, Iwaniuk AN, Bandet MV, Wylie DR (2012): Eye shape and retinal topography in owls (Aves: Strigiformes). Brain Behav Evol 79: 218–236.
Lisney TJ, Rubene D, Rózsa J, Løvlie H, Håstad O, Ödeen A (2011): Behavioural assessment of f licker fusion frequency in chicken Gallus gallus domesticus . Vision Res 51: 1324–1332.
Manger PR, Elston GN, Pettigrew JD (2002): Multiple maps and activity-dependent rep-resentational plasticity in the anterior Wulst of the adult barn owl (Tyto alba). Eur J Neu-rosci 16:743–750.
Martin GR (1986): Sensory capacities and the nocturnal habit of owls (Strigiformes). Ibis 128: 266–277.
Martin GR, Wilson KJ, Wild MJ, Parsons S, Kubke MF, Corfield J (2007): Kiwi forego vi-sion in the guidance of their nocturnal ac-tivities. PLoS One 2:e198.
Matochik JA, Reems CN, Wenzel BM (1991): A brain atlas of the northern fulmar (Fulmarus glacialis) in stereotaxic coordinates. Brain Behav Evol 37: 215–244.
Maturana HR, Varela FJ (1982): Color-opponent responses in the avian lateral geniculate: a study in the quail (Coturnix coturnix japo-nica) . Brain Res 247: 227–241.
McKenna O, Wallman J (1985): Accessory optic system and pretectum of birds: comparisons with those of other vertebrates. Brain Behav Evol 26: 91–116.
Nguyen AP, Spetch ML, Crowder NC, Winship IR, Hurd PL, Wylie DRW (2004): A dissocia-tion of motion and spatial-pattern vision in the avian telencephalon: implications for the evolution of ‘visual streams’. J Neurosci 24: 4962–4970.
Nieder A, Wagner H (1999): Perception and neu-ronal coding of subjective contours in the owl. Nat Neurosci 2: 660–663.
Nieder A, Wagner H (2001): Encoding of both vertical and horizontal disparity in random-dot stereograms by Wulst neurons of awake barn owls. Vis Neurosci 18: 541–547.
Norberg RA (1977): Occurrence and indepen-dent evolution of bilateral ear asymmetry in owls and implications on owl taxonomy. Phil Trans R Soc Lond B 280: 375–408.
Oehme H (1961): Vergleichend-histologische Untersuchungen an der Retina von Eulen. Zool Jb Anat 79: 439–478.
Payne RS (1971): Acoustic location of prey by barn owls (Tyto alba) . J Exp Biol 54: 535–573.
Pettigrew JD (1979): Binocular visual processing in the owl’s telencephalon. Proc R Soc Lond B Biol Sci 204: 435–454.
Pettigrew JD, Konishi M (1976): Neurons selec-tive for orientation and binocular disparity in the visual Wulst of the barn owl (Tyto alba) . Science 193: 675–678.
Puelles L, Martinez-de-la-Torre M, Paxinos G, Watson C, Martinez S (2007): The Chick Brain in Stereotaxic Coordinates: An Atlas Featuring Neuromeric Subdivisions and Mammalian Homologies. San Diego: Aca-demic Press.
Reiner A, Brecha N, Karten HJ (1979): A specific projection of retinal displaced ganglion cells to the nucleus of the basal optic root in the chicken. Neuroscience 4: 1679–1688.
Reiner A, Perkel DJ, Bruce LL, Butler AB, Csillag A, Kuenzel W, Medina L, Paxinos G, Shi-mizu T, Striedter G, Wild M, Ball GF, Du-rand S, Güntürkün O, Lee DW, Mello CV, Powers A, White SA, Hough G, Kubikova L, Smulders TV, Wada K, Dugas-Ford J, Hus-band S, Yamamoto K, Yu J, Siang C, Jarvis ED, Avian Brain Nomenclature Forum (2004): Revised nomenclature for avian tel-encephalon and some related brainstem nu-clei. J Comp Neurol 473: 377–414.
Reynolds P, Gorman ML (1999): The timing of hunting in short-eared owls (Asio flammeus) in relation to the activity patterns of Orkney voles (Microtus arvalis orcadensis) . J Zool 247: 371–379.
Rojas de Azuaje LM, Tai S, McNeil R (1993): Comparison of rod/cone ratio in three spe-cies of shorebirds having different nocturnal foraging strategies. Auk 110: 141–145.
Roth G, Dicke U, Nishikawa K (1992): How do ontogeny, morphology, and physiology of sensory systems constrain and direct the evolution in amphibians? Am Nat 139:S105–S124.
Sibley CG, Ahlquist JE (1990): Phylogeny and Classification of Birds. New Haven, Yale University Press.
Stephan H (1960): Methodische Studien über den quantitativen Vergleich architek-tonischer Struktureinheiten des Gehirns. Z Wiss Zool 164:143–172.
Stingelin W (1958): Vergleichend morpholo-gische Untersuchungen am Vorderhirn der Vögel auf cytologischer and cytoarchitek-tonischer Grundlage. Basel, Helbing andLichtenhahn.
Stokes TM, Leonard CM, Nottebohm F (1974): The telencephalon, diencephalon, and mes-encephalon of the canary, Serinus canaria , in stereotaxic coordinates. J Comp Neurol 156: 337–374.
Stone J, Keens J (1980): Distribution of small and medium-sized ganglion cells in the cat’s ret-ina. J Comp Neurol 192: 235–246.
Sun HJ, Frost BJ (1998): Computation of differ-ent optical variables of looming objects in pi-geon nucleus rotundus neurons. Nat Neuro-sci 1: 296–303.
Tansley K, Erichsen JT (1985): Vision; in Camp-bell B, Lack E (eds): A Dictionary of Birds Calton, B. Poyser, pp 623–629.
Vega-Zuniga T, Campos L, Severin D, Marin G, Letelier J, Mpodozis J (2011): The Avian Ven-tral Nucleus of the Lateral Geniculate (GLv) Has Key Role in the Generation of Visually Guided Gaze Orientation Movements. Washington, Society for Neuroscience.
Voous KH (1988): Owls of the Northern Hemi-sphere. Cambridge, MIT Press.
Wagner H, Frost B (1994): Binocular responses of neurons in the barn owl’s visual Wulst. J Comp Physiol A 174: 661–670.
Wakita M, Watanabe S, Shimizu T, Britto LR (1992): Visual discrimination performance after lesions of the ventral lateral geniculate nucleus in pigeons (Columba livia) . Behav Brain Res 51: 211–215.
Wallman J, Pettigrew JD (1985): Conjunctive and disjunctive saccades in two avian species with contrasting oculomotor strategies. J Neurosci 5: 1418–1428.
Wang YC, Jiang S, Frost BJ (1993): Visual pro-cessing in pigeon nucleus rotundus: lumi-nance, color, motion, and looming subdivi-sions. Vis Neurosci 10: 21–30.
Warrant E (2004): Vision in the dimmest habi-tats on Earth. J Comp Physiol A 190: 765–789.
Wathey JC, Pettigrew JD (1989): Quantitative analysis of the retinal ganglion cell layer and optic nerve of the barn owl Tyto alba . Brain Behav Evol 33: 279–292.
Wild JM, Kubke MF, Peña JL (2008): A pathway for predation in the brain of the barn owl (Tyto alba): projections of the gracile nucleus to the ‘claw area’ of the rostral wulst via the dorsal thalamus. J Comp Neurol 509: 156–166.
Wink M, Heidrich P, Sauer-Gurth H, Elsayed AA, Gonzalez J (2008): Molecular phylogeny and systematics of owls (Strigiformes); in Konig C, Weick F (eds): Owls of the World. London, Christopher Helm, pp 42–63.
BBE343810.indd 13BBE343810.indd 13 10.12.2012 14:49:3610.12.2012 14:49:36