Comparability of RF-based Indoor Localization Solutions SICS Swedish ICT Stockholm, Sweden +46 8 633...
23
1 Comparability of RF-based Indoor Localization Solutions in Heterogeneous Environments: An Experimental Study Tom Van Haute*, Eli De Poorter and Ingrid Moerman Department of Information Technology (INTEC) Ghent University - iMinds Gaston Crommenlaan 8, 9050 Ghent, Belgium +32 9 331 49 46 {tom.vanhaute, eli.depoorter, ingrid.moerman}@intec.ugent.be * Corresponding author Filip Lemic, Vlado Handziski and Adam Wolisz Telecommunication Networks Group (TKN) Technische Universit¨ at Berlin (TUB) Berlin, Germany +49 30 314 23818 {lemic, handziski, wolisz}@tkn.tu-berlin.de Niklas Wirstr¨ om and Thiemo Voigt SICS Swedish ICT Stockholm, Sweden +46 8 633 15 38 {niwi, thiemo}@sics.se Abstract: The growing popularity of indoor localization research has resulted in a significant amount of research papers describing and evaluating innovative localization solutions. Unfortunately, the results from most of these research papers can not easily be compared since they are evaluated in different environments, use different evaluation criteria and typically tailor their solutions towards a single testbed environment. To evaluate how these different conditions influence the localization performance, in this paper an exhaustive set of experiments has been performed in which three different localization solutions have been evaluated using multiple metrics in three different test environments: two types of office environments and an industry-like factory environment. None of the used localization solutions was previously optimized for any of these test environments and they were all evaluated under similar conditions, e.g. similar interference background and using the same evaluation points. The results reveal several weaknesses in the evaluation methods used in the majority of existing scientific literature of indoor localization solutions. More specifically, it is shown that (i) papers that use self- selected evaluation points can significantly influence their reported accuracy by artificially selecting specific evaluation points that outperform other locations, (ii) the reported accuracy can decrease significantly, up to a factor 10, when evaluating in an environment for which the localization solution is not specifically tweaked and (iii) many inherent trade-offs between different metrics, such as accuracy, energy consumption and response delay, are hidden by reporting only on the accuracy of the solutions. Keywords: Indoor localization; experimental comparison; benchmarking methodology; performance metrics; fingerprinting; Time of Arrival, RSSI-based localization; IEEE 802.11; IEEE 802.15.4; w-iLab.t testbed; TWIST testbed; particle filter; Spray
Transcript of Comparability of RF-based Indoor Localization Solutions SICS Swedish ICT Stockholm, Sweden +46 8 633...
1
Comparability of RF-based Indoor LocalizationSolutions in Heterogeneous Environments: AnExperimental Study
Tom Van Haute*, Eli De Poorter and IngridMoermanDepartment of Information Technology (INTEC)Ghent University - iMindsGaston Crommenlaan 8, 9050 Ghent, Belgium+32 9 331 49 46{tom.vanhaute, eli.depoorter, ingrid.moerman}@intec.ugent.be* Corresponding author
Filip Lemic, Vlado Handziski and Adam Wolisz
Telecommunication Networks Group (TKN)Technische Universitat Berlin (TUB)Berlin, Germany+49 30 314 23818{lemic, handziski, wolisz}@tkn.tu-berlin.de
Niklas Wirstrom and Thiemo Voigt
SICS Swedish ICTStockholm, Sweden+46 8 633 15 38{niwi, thiemo}@sics.se
Abstract: The growing popularity of indoor localization research has resulted in asignificant amount of research papers describing and evaluating innovative localizationsolutions. Unfortunately, the results from most of these research papers can not easilybe compared since they are evaluated in different environments, use different evaluationcriteria and typically tailor their solutions towards a single testbed environment. Toevaluate how these different conditions influence the localization performance, in thispaper an exhaustive set of experiments has been performed in which three differentlocalization solutions have been evaluated using multiple metrics in three different testenvironments: two types of office environments and an industry-like factory environment.None of the used localization solutions was previously optimized for any of thesetest environments and they were all evaluated under similar conditions, e.g. similarinterference background and using the same evaluation points. The results reveal severalweaknesses in the evaluation methods used in the majority of existing scientific literatureof indoor localization solutions. More specifically, it is shown that (i) papers that use self-selected evaluation points can significantly influence their reported accuracy by artificiallyselecting specific evaluation points that outperform other locations, (ii) the reportedaccuracy can decrease significantly, up to a factor 10, when evaluating in an environmentfor which the localization solution is not specifically tweaked and (iii) many inherenttrade-offs between different metrics, such as accuracy, energy consumption and responsedelay, are hidden by reporting only on the accuracy of the solutions.
Keywords: Indoor localization; experimental comparison; benchmarking methodology;performance metrics; fingerprinting; Time of Arrival, RSSI-based localization; IEEE802.11; IEEE 802.15.4; w-iLab.t testbed; TWIST testbed; particle filter; Spray

2 T. Van Haute et al.
1 Introduction
1.1 Why Indoor Localization
The emergence of satellite navigation systems - mainlyGPS [1] - has resulted in a significant increaseof personalized location-based services suitable forguidance, navigation, tracking, recreation, security, etc.However, the use of GPS is limited to outdoorenvironments, whereas many commercial applicationsare envisioned in indoor environments. Location-basedservices are envisioned in many different indoorenvironments: hospitals, airports, underground mines,detention houses, etc.A significant amount of work is available in scientificliterature describing and evaluating innovativetechniques or solutions for localization inside buildings.As a result a wide range of indoor localization solutionshas been proposed using a variety of different RFtechnologies (such as WiFi, RF, Bluetooth, 60GHz,etc.) and non-RF technologies (such as infrared andultrasonic). However, a major problem is the lack ofcomparability between indoor localization solutions.
• The majority of evaluations of indoor localizationsolutions [2, 3] focus mainly on the accuracy of theresults whilst ignoring crucial application-level metricssuch as scalability, delay, energy consumption, cost,simplicity, etc. Moreover, even the reported accuracyis typically calculated using different calculationstatistics (average, median, percentiles, etc.), therebymaking comparison of solutions is almost impossible.
• In addition, even though each of the targetedapplication domains has different environmentalcharacteristics, most of the existing solutions wereevaluated in one specific test environment. As aresult, it is impossible to gain insight in theoverall performance of these solutions under differentconditions.
Based on these observations, we argue that the currentstate of the art is lacking comprehensive comparativeanalysis of different localization approaches in multipledeployment enthronements. The main reason for thislack of comparability studies is the significant effort thatis currently required to perform localization experimentsin multiple experimentation facilities. The main goalof this paper is to identify to what extent theseshortcomings influence the comparability of results inexisting scientific literature and to provide suggestionsfor improvement. Therefore, we implemented threetypically used localization approaches and evaluatedtheir performance in multiple test environmentsusing the same evaluation methodology. Amongst theevaluated solutions, we include:
• Two popular RF technologies (IEEE 802.11 and IEEE802.15.4),
• Three localization approaches (ToA, fingerprinting,weighted RSSI),
• Four evaluation metrics (point accuracy, roomaccuracy, energy consumption, response time),
• Three different test environments: two officeenvironments and an industrial-like open environment.
To the best of our knowledge, we are the first to evaluatemultiple localization solutions (and not only differentparameterizations of the same localization solution class)in multiple environments using the same evaluationprocedures.The remainder of this paper is organized as follows.Section 2 discusses related work, including ongoingefforts to standardize the evaluation of indoorlocalization solutions. Next, Section 3 describes theevaluated localization solutions: (i) a ToA-based IEEE802.15.4 solution, (ii) a fingerprinting-based IEEE 802.11solution and (iii) an IEEE 802.15.4 RSSI-based solution.Section 4 discusses the used evaluation methodologyand evaluation metrics. Section 5 gives an overviewof characteristics of the used experimentation testbeds.Afterwards, the localization solutions are evaluated andthe performance results of the solutions are comparedand discussed in Section 6 for office environment withbrick walls (TWIST), in Section 7 for office environmentwith plywood walls (w-iLab.t I) and in Section 8 for openindustrial like environment (w-iLab.t II). This is followedby a general overview in Section 9 where several lessonslearned are discussed. Finally, Section 10 concludes thepaper.
2 Related Work
Recently, there has been a growing awareness thata more thorough way of comparing and evaluatinglocalization solutions is needed. This section gives anoverview of efforts related to evaluation procedures forindoor localization solutions.
2.1 Evaluation Procedures for Indoor Localization
The need for a systematic and objective evaluationmethodology has been recognized by several authors [4].Although no standardized methodologies are currentlyavailable, several efforts are being made towards thisgoal.
• The FP7 EVARILOS project a [5] focuses onthe EVAluation of RF-based Indoor LOcalizationSolutions. The project published a first draft of abenchmarking handbook [6, 7], describing methodsto calculate metrics, descriptive methods to describeevaluation environments and methods for decidingwhich evaluation points to use. The project isalso the first to point out that current scientificliterature lacks studies on the effect of interferenceon indoor localization solutions, although interference
aThe results described in this paper originate from the projectand have first been described in the public EVARILOS deliverableD2.2 “Report on experiments without interference” [8].

Comparability of RF-based Indoor Localization Solutions in Heterogeneous Environments 3
is expected to be present at most sites where thesesystems are installed b.
• In parallel, ISO (the International Organizationfor Standardization) and IEC (the InternationalElectrotechnical Commission) have established a jointtechnical committee, ISO/IEC JTC 1, to work on aISO/IEC 18305 standard on “Test and evaluation oflocalization and tracking systems” [10] c. The draftof the standard is not yet publicly available at thetime of writing of this paper, but it currently includesa taxonomy of localization solutions and describes awide range of evaluation scenarios and performancemetrics. In contrast to the EVARILOS project, whichmainly focuses on RF-based localization solutions,the ISO standard draft also considers other indoorlocalization solutions that use a wide range ofinput sensors such as inertial sensors, ultra-soundsensors, etc. In terms of the evaluation approach,the ISO standard focuses on evaluation of fixed setof metrics and specifies a concrete enumerated setof evaluation scenarios under which the solutionsshould be evaluated. The EVARILOS benchmarkingmethodology, in comparison, is more broad anddefines a basic ”vocabulary” for expressing differentevaluation scenarios, instead of constraining to a setof few particular ”instances”. It also goes beyondevaluation of simple performance metrics, and definesa subsequent phase in which they can be translatedinto use-case specific scores.
2.2 Evaluation Metrics for Indoor Localization
In more recent surveys, the importance of multiplemetrics becomes visible.
• Hui Lui et al. states in [4] that comprehensiveperformance comparison requires not only accuracy,but also needs to include precision, complexity,scalability, robustness and cost.
• In the EvAAL project (“Evaluating AAL Systemsthrough Competitive Benchmarking”) [11], acompetition is held that aims at establishingbenchmarks and evaluation metrics for comparingAmbient Assisted Living solutions. For thiscompetition, besides accuracy, also usability metricsare defined such as installation complexity, useracceptance, availability and interoperability withAAL systems [11].
• A significant number of additional metrics can befound in the aforementioned EVARILOS handbook [7]and ISO/IEC 18305 draft [10], both including
bThe outcome of initial studies on the influence of interferenceon the localization solutions evaluated in this paper can be foundin EVARILOS deliverable D2.3 “Report on experiments withinterference” [9].
cISO/IEC 18305 is being prepared by Joint TechnicalCommittee ISO/IEC JTC 1, Information technology,Subcommittee SC 31, Automatic identification and data capturetechniques, Working Group 5, Real time locating systems. Thecommittee is currently referred to as ISO/IEC JTC1/SC31/WG5.
additional functional metrics, such as response delays,and non-functional (deployment) metrics such as setuptime and required infrastructure.
The full list of potential metrics from these sourcesis very large, especially since many of these metricscan be calculated using multiple statistics (percentiles,averages, median, distributions, etc.). Some metricsare important mainly from a theoretical point ofview and as such are well-suited for analyzing andimproving algorithms of researchers [12], whereas otherfocus on the performance of end-systems and as suchare more important for the industry. Unfortunately,although the above sources strongly emphasize theneed for utilizing multiple criteria for evaluating indoorlocalization solutions, none of these sources mentionwhich of the metrics are considered most important fordifferent application domains, nor do they offer insighton the relation between different metrics (e.g. inherenttrade-offs).Therefore, in the evaluation section of this paper, wehave included four functional metrics: point accuracy,room accuracy, response delay and energy consumption.These are the performance metrics from the EVARILOShandbook [7], which can be found in Figure 1.
Figure 1: The EVARILOS metrics: a graphicaloverview
2.3 Evaluation Environments for IndoorLocalization
It is a well-known fact that environmental conditionssignificantly influence propagation characteristics.Table 1 gives an overview of a number of recent researchpapers evaluating localization solutions and describesthe environments they have been evaluated in.It is clear from Table 1 that most existing indoorlocalization solutions have been evaluated in officeenvironments, since these are the buildings whichare most readily available for researchers. Due tothe time-consuming nature of performing localizationexperiments, most localization solutions are evaluatedonly in a single environment. However, as will be shownin Section 5, office environments can have very differentcharacteristics. Based on existing literature, it is notclear how these differences in environment influencethe reported accuracy results. Therefore, this paperwill analyze the performance of multiple localizationsolutions in three different environments: an officeenvironment with brick walls, an office environmentwith plywooden walls and an industrial-like openenvironment.

4 T. Van Haute et al.
Table 1 Overview of a few existing indoor localization solutions with the related environment, testbed and metrics
Solution Environment Used testbed Used metrics
Energy efficient solution [12] Office building on campus Point acc. & energy cons.
GSM fingerprinting [13] Office / home university, research lab, house Point accuracy
WiFi Bayesian [14] Office Their own hallway Point accuracy
EZ localization [15] Office Office floor, Call Center Point accuracy
Smartphone localization [16] University Berkeley campus Point accuracy
WiFi in tunnel [17] Mining Tunnel in Guangzhou MTR Point accuracy
Fingerprinting [18] University Fourth floor of university building Point accuracy
UWB fingerprinting [19] Office / testroom Anechoic chamber, office floor # of multipath components
2.4 Evaluation Points for Indoor Localization
In terms of which points to use in an environmentto evaluate the performance of a localization solution,two main approaches are possible. For industry-relatedtesting, an evaluation track can be created that mimicstypical operations in a building. For example, the path ofa person can be recreated and only evaluation points onthis path can be used [12]. For more generic, application-independent testing, ideally the evaluation points shouldbe randomly chosen. Unfortunately, most researchpapers manually select a number of evaluation pointsbased on subjective criteria such as accessibility. Aswill be shown in Section 6, the accuracy of localizationsolutions can strongly depend on the used evaluationpoints, e.g. points near a wall versus open spaces. Asa result, the performance of localization solutions canartificially be “improved” by selecting mostly evaluationpoints which perform well for the evaluated solution.As such, it is clear that future evaluations of indoorlocalization solutions should use standardized evaluationmethods. To remedy this, future benchmarkingmethodologies such as EVARILOS and ISO/IEC 18305are creating standardized methods for generatingevaluation points. For this paper, all evaluatedlocalization solutions use the same evaluation points ineach testbed.
3 Evaluated Localization Solutions
To evaluate how different test environments influencetypical localization solutions, we selected threelocalization solutions that use different wirelesstechnologies and that use different processing approachesfor estimating positions. The following localizationsolutions were selected and implemented.
• An IEEE 802.15.4 based time-of-arrival solution.
• An IEEE 802.11 based fingerprinting solution.
• An IEEE 802.15.4 based RSSI triangulation solution.
Although more accurate solutions exist, these solutionsrepresent the most popular RF-based technologiesdescribed in literature.
3.1 Particle Filter using ToA and RSSIMeasurements
The first solution is designed by N. Wirstrom et al. [22].The basic concept behind this localization solution isthe following: measurements are performed by lettinga stationary node transmit packets to the anchors thatreply with a hardware ACK (acknowledgment). Theinitiating node measures both the time between thetransmission of the packet and the reception of the ACK,and stores the RSSI values associated with the ACK.These measurements are then processed using Spray [23],a particle filter based platform.The basic idea of the ToF ranging is to estimatethe distance between two nodes by measuring thepropagation time that is linearly correlated to thedistance between the nodes when they are in LoS.Two-way ToF ranging, as opposed to one-way, doesnot require tight time synchronization between senderand receiver. This is an advantage since tight timesynchronization is hard to achieve in wireless sensornetworks (WSNs) [20].The distance between nodes can be calculated accordingto Equation 1 where c is the speed of light, tToF is theround-trip-time measurements, and toff is an offset timeaccounting for all processing delays in the system. Thisincludes the time for the sender to transmit the packet,the time the receiver needs to process it, and send theacknowledgment.
d =c
2(tToF − toff ) (1)
The measurements tToF are computed as tToF =ncycles
ftimer,
were ncycles is the number of measured clock ticks,and ftimer is the frequency of the radio’s internalcrystal oscillator. In this case ftimer = 12 MHz. A singlemeasurement is not sufficient, however. The resolutionof a single clock allows for a spatial precision equal to∆d = c
2ftimer. For a 12 MHz clock, the resulting spatial
resolution is 12.5 m. To achieve higher resolution, onecan average over a series of measurements, as proposedby Mazomenos et al. [21]. This way, sub-clock precisioncan be achieved.

Comparability of RF-based Indoor Localization Solutions in Heterogeneous Environments 5
3.1.1 Range Computation Methods
Once the range measurements are collected, they haveto be transformed into actual distance measurements.For this, a wide range of computation methods areavailable. We have applied five different methods to themeasurements. Four of these use ToF measurements asinput, and one use RSSI measurements. The followingsubsections describe the methods.
Mazo: This model builds directly on Equation 1.This is the model used by Mazomenos et al. [21].The calibration step consists of estimating the constantoffset toff by averaging over various ToF measurementsaccording to equation 2.
toff =1
N
N∑i=1
tToF,i −2dic
(2)
k-sigma: This method was proposed by Pettinatoet al. [22]. It uses the variance between measurementstaken on different channels to improve range estimations.The idea is that when two nodes are in line-of-sight, mostpackets will travel the shortest path between the nodes,regardless of the channel being used.If the two nodes are not in the LoS, however, the differentfrequencies of the different channels will cause slightlydifferent propagation paths, and result in differentToF measurement values. The concept is captured inEquation 3, where σ is the inter-channel standarddeviation. Calibration consists of estimating toff and kusing linear regression.
d =tToF
2− toff − kσ (3)
Least Squares: For this method, the calibration phaseconsists simply of fitting data to the Equation 4, where aand b are estimated using linear regression. This methodis model-free in the sense that it does not rely on aphysical model.
d = a+ btToF (4)
Free Space RSSI: This method uses the free spacepropagation model in the Equation 5, to transform RSSImeasurements to range estimations. In the equation,Pr and Pt are the received and transmitted power,respectively. Gr and Gt are the receivers and thetransmitters antenna gains, respectively. λ is thewavelength and L is called the system loss factor.
Pr =PtGtGrλ
2
(4π)2d2L(5)
However, instead of determine these constantsindividually we combine them into on single constantK as in Equation 6, and estimate K using least squaresapproximation.
Pr = K1
d2(6)
3.1.2 Using Spray to Estimate Location
Once the raw range measurements are transformed todistance estimations, the final location estimations areobtained from Spray, a particle filter based localizationsystem that can be used to fuse multiple types ofmeasurements simultaneously.In this case, i.e. using a single range based modality,Spray generates particles that have both a position and aweight, in a ring-shaped cloud (an annulus) around eachtestbed node that has an associated range measurementto the node that is to be localized. The distancebetween each particle and its associated testbed node, isdetermined by the sum of the range measurement and azero-mean normally distributed random variable with agiven variance.Each particle is then evaluated using measurements fromall the other testbed nodes, on the basis of how theparticle’s position fits their measurements. This is doneby assigning a weight between 0 and 1 to the particle.The more coherent the particle’s position is with themeasurement, the higher the weight. A final weightfor each particle is then computed by multiplying theweights assigned in the evaluation phase.
3.2 Fingerprinting Based Localization using WiFiBeacon Packets RSSI Measurements
Another solution is provided by F. Lemic [24, 25] whichis based on WiFi fingerprinting. Fingerprinting methodsin the indoor localization are generally divided in twophases. The first phase is called the training or offlinephase. In this phase, the localization area is dividedin a certain number of cells. Each cell is scanned acertain number of times for different signal properties,and using a methodology for processing the receiveddata a fingerprint of each cell is created. By using theobtained training fingerprints the training database iscreated and stored on the localization server. In thesecond phase, known as the runtime or online phase, anumber of scans of the environment are created usingthe user’s device. From the scanned data, using thesame predefined data processing method, the runtimefingerprint is created and sent to the localization server.At the server’s side the runtime fingerprint is comparedwith the training dataset using the matching method.The training fingerprint with the most similarities tothe runtime fingerprint is reported as the estimatedposition. In the section below a general notion of theWiFi fingerprinting is given using beacon packets RSSIvalues.Let Kt and M be respectively the number of WiFi APsused for a localization procedure and the number oftraining points in a given localization area. Furthermore,let Nt be the number of scans of the area taken at atraining point m (m ∈ 1, ...,M). During each scan thevector of RSSI measurements from each visible AP usedfor localization is collected. This vector has at most Kt
elements, but it is possible that it will have less elements
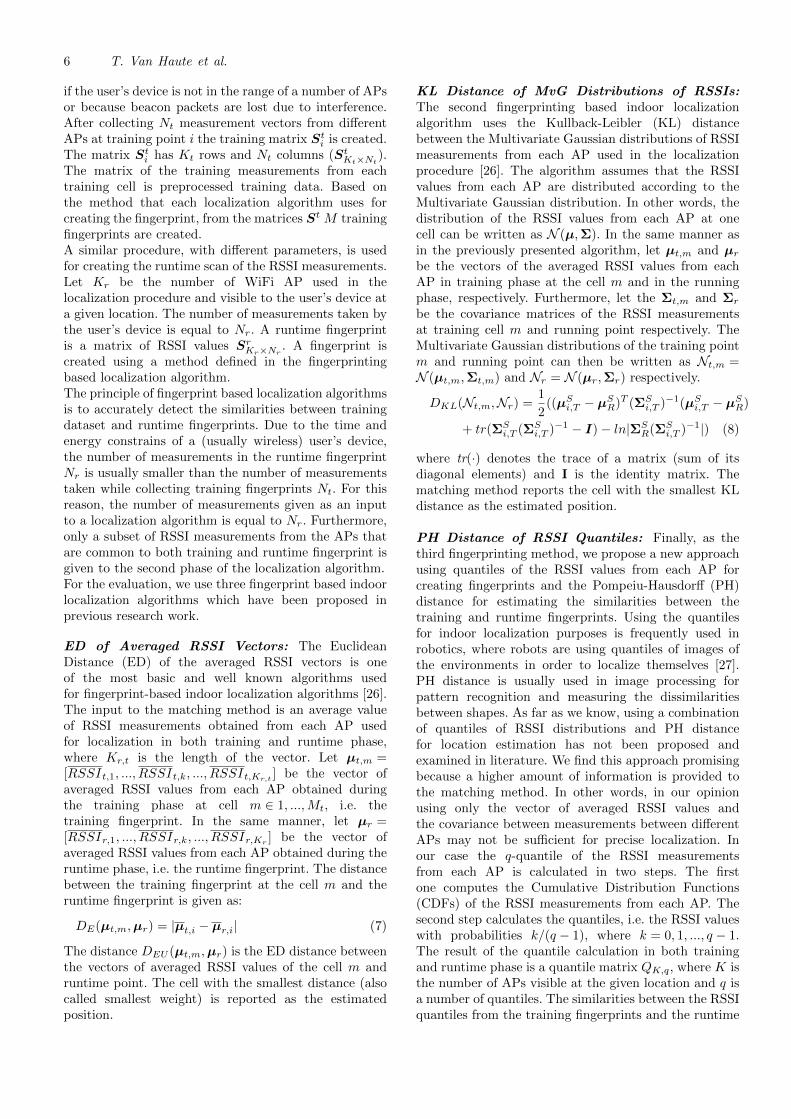
6 T. Van Haute et al.
if the user’s device is not in the range of a number of APsor because beacon packets are lost due to interference.After collecting Nt measurement vectors from differentAPs at training point i the training matrix St
i is created.The matrix St
i has Kt rows and Nt columns (StKt×Nt
).The matrix of the training measurements from eachtraining cell is preprocessed training data. Based onthe method that each localization algorithm uses forcreating the fingerprint, from the matrices St M trainingfingerprints are created.A similar procedure, with different parameters, is usedfor creating the runtime scan of the RSSI measurements.Let Kr be the number of WiFi AP used in thelocalization procedure and visible to the user’s device ata given location. The number of measurements taken bythe user’s device is equal to Nr. A runtime fingerprintis a matrix of RSSI values Sr
Kr×Nr. A fingerprint is
created using a method defined in the fingerprintingbased localization algorithm.The principle of fingerprint based localization algorithmsis to accurately detect the similarities between trainingdataset and runtime fingerprints. Due to the time andenergy constrains of a (usually wireless) user’s device,the number of measurements in the runtime fingerprintNr is usually smaller than the number of measurementstaken while collecting training fingerprints Nt. For thisreason, the number of measurements given as an inputto a localization algorithm is equal to Nr. Furthermore,only a subset of RSSI measurements from the APs thatare common to both training and runtime fingerprint isgiven to the second phase of the localization algorithm.For the evaluation, we use three fingerprint based indoorlocalization algorithms which have been proposed inprevious research work.
ED of Averaged RSSI Vectors: The EuclideanDistance (ED) of the averaged RSSI vectors is oneof the most basic and well known algorithms usedfor fingerprint-based indoor localization algorithms [26].The input to the matching method is an average valueof RSSI measurements obtained from each AP usedfor localization in both training and runtime phase,where Kr,t is the length of the vector. Let µt,m =[RSSIt,1, ..., RSSIt,k, ..., RSSIt,Kr,t
] be the vector ofaveraged RSSI values from each AP obtained duringthe training phase at cell m ∈ 1, ...,Mt, i.e. thetraining fingerprint. In the same manner, let µr =[RSSIr,1, ..., RSSIr,k, ..., RSSIr,Kr
] be the vector ofaveraged RSSI values from each AP obtained during theruntime phase, i.e. the runtime fingerprint. The distancebetween the training fingerprint at the cell m and theruntime fingerprint is given as:
DE(µt,m,µr) = |µt,i − µr,i| (7)
The distance DEU (µt,m,µr) is the ED distance betweenthe vectors of averaged RSSI values of the cell m andruntime point. The cell with the smallest distance (alsocalled smallest weight) is reported as the estimatedposition.
KL Distance of MvG Distributions of RSSIs:The second fingerprinting based indoor localizationalgorithm uses the Kullback-Leibler (KL) distancebetween the Multivariate Gaussian distributions of RSSImeasurements from each AP used in the localizationprocedure [26]. The algorithm assumes that the RSSIvalues from each AP are distributed according to theMultivariate Gaussian distribution. In other words, thedistribution of the RSSI values from each AP at onecell can be written as N (µ,Σ). In the same manner asin the previously presented algorithm, let µt,m and µr
be the vectors of the averaged RSSI values from eachAP in training phase at the cell m and in the runningphase, respectively. Furthermore, let the Σt,m and Σr
be the covariance matrices of the RSSI measurementsat training cell m and running point respectively. TheMultivariate Gaussian distributions of the training pointm and running point can then be written as Nt,m =N (µt,m,Σt,m) and Nr = N (µr,Σr) respectively.
DKL(Nt,m,Nr) =1
2((µS
i,T − µSR)T (ΣS
i,T )−1(µSi,T − µS
R)
+ tr(ΣSi,T (ΣS
i,T )−1 − I)− ln|ΣSR(ΣS
i,T )−1|) (8)
where tr(·) denotes the trace of a matrix (sum of itsdiagonal elements) and I is the identity matrix. Thematching method reports the cell with the smallest KLdistance as the estimated position.
PH Distance of RSSI Quantiles: Finally, as thethird fingerprinting method, we propose a new approachusing quantiles of the RSSI values from each AP forcreating fingerprints and the Pompeiu-Hausdorff (PH)distance for estimating the similarities between thetraining and runtime fingerprints. Using the quantilesfor indoor localization purposes is frequently used inrobotics, where robots are using quantiles of images ofthe environments in order to localize themselves [27].PH distance is usually used in image processing forpattern recognition and measuring the dissimilaritiesbetween shapes. As far as we know, using a combinationof quantiles of RSSI distributions and PH distancefor location estimation has not been proposed andexamined in literature. We find this approach promisingbecause a higher amount of information is provided tothe matching method. In other words, in our opinionusing only the vector of averaged RSSI values andthe covariance between measurements between differentAPs may not be sufficient for precise localization. Inour case the q-quantile of the RSSI measurementsfrom each AP is calculated in two steps. The firstone computes the Cumulative Distribution Functions(CDFs) of the RSSI measurements from each AP. Thesecond step calculates the quantiles, i.e. the RSSI valueswith probabilities k/(q − 1), where k = 0, 1, ..., q − 1.The result of the quantile calculation in both trainingand runtime phase is a quantile matrix QK,q, where K isthe number of APs visible at the given location and q isa number of quantiles. The similarities between the RSSIquantiles from the training fingerprints and the runtime

Comparability of RF-based Indoor Localization Solutions in Heterogeneous Environments 7
fingerprint are computed using the PH distance metric.The PH distance between two sets of quantiles is givenas follows:
DPH(Q1, Q2) = maxq1,k∈Q1
( minq2,k∈Q2
(d(q1,k, q2,k))) (9)
where d(q1,k, q2,k) is the Euclidean distance (ED)measurement. The training cell with the smallest PHdistance is reported as an estimated location.
3.3 Hybrid Model: Proximity & Weighted RSSI
A final localization solution [28] that has beenimplemented and evaluated is a hybrid combination ofa range-based and a range-free algorithm. It includes arange-based location estimator based on weighted RSSIvalues. The main idea of RSSI is that the transmissionpower PT directly affects the received power PR of asignal. Using the Friis transmission equation, the linearrelationship can be stated as follows.
PR = PT ∗GT ∗GR
(λ
4πd
)2
(10)
In the equation GT , GR are the gains of transmitter andreceiver, respectively. λ is the wavelength of the signaland d is the distance between sender and receiver. TheRSSI can be defined as the ratio of the received powerto the reference power PRef .
RSSI = 10 ∗ logPR
PRef(11)
Each RSSI value can be matched with a certain distance.The proposed algorithm in [28] not only uses the RSSIvalues to measure the distance between a fixed andmobile node, but also the distance between the fixednodes. These values function as weight factors for thedistance calculation between the fixed and mobile node.These weight factors are shown in Figure 2 as w12, w13
and w23. The distance from M to, for example, B1 canbe calculated as follows:
Distance(M,B1) =
RSSI(M,B1) ∗ w12 +RSSI(M,B1) ∗ w13
2(12)
whereby wij :
wij =Dist(Bi, Bj)
RSSI(Bi, Bj)(13)
Previous results prove that these weight factors addvalue to the accuracy. A drawback of the RSSI techniqueis that these measurements are very sensitive to theenvironment and any changes in it. The relationshipbetween the distance and RSSI is room dependent. Forexample, signals in a long corridor propagate muchfurther because they reverberate through the long walls.
Figure 2: Weighted algorithm: schema
In contrast to the technique above, range-free algorithmsdo not take RSSI-values into account. If a mobile sensornode has a range of 10 meters, then a fixed node canonly receive his messages if the mobile node is maximum10 meters away. This is the only information that isused to calculate the position of a mobile node. For thisapproach, it is important that the transmission power iswell configured. If the power is too low, the mobile nodecould be out of range between two anchors. On the otherhand, if the power is too high, too many fixed nodeswill receive the beacon and a wrong estimation could bemade.The latter problem can be solved by using a centroidalgorithm. This is only useful if there is a set of fixednodes with an overlapping coverage area. The beacon ofthe mobile node is received by multiple fixed nodes. Inorder to determine the position, the centroid of all thereceiving fixed nodes is calculated:
xM =
∑kn=0 xnk
yM =
∑kn=0 ynk
(14)
In theory, this algorithm would give a 100 % guaranteethat room-accuracy is possible. However, experimentshave shown that this is not always the case. If the wallsare small enough andor do not strongly attenuate thesignal, signals can go through and a fixed node in adifferent room can receive up the beacon. To preventincorrect location estimation, extra logic can be addedto the algorithm.The extra logic takes the form of additionalenvironmental metadata. Suppose we have the exactcoordinates of all the walls, doors and nodes insidea building. Knowing that every beacon has an indexnumber, the direct path could be checked between thetwo fixed nodes who received the consecutive beacons. Ifthe mobile node goes from one room to another, withoutusing a door, then the last beacon can be dismissed. Forexample (Figure 3) when node A2 receives a beacon and

8 T. Van Haute et al.
the next beacon is received by node B2. It is impossibleto move directly from A2 to B2 without passing nodesA1 and B1. So the message that was received by beaconB2 will be rejected.
Figure 3: Three neighboring offices
With this optimization room-accuracy can beguaranteed. Still, this solution has the drawback that alot of fixed infrastructure sensor nodes are necessary toretrieve good results. If the network is sparse distributed,then the algorithm would not work properly.Finally, for the evaluation of this solution, experimentswere performed using four different Tx power levels(Tx3, Tx7, Tx19 and Tx31), as shown in Table 2.
Table 2 Used Tx power levels for the weighted RSSIlocalization experiments
Tx power level Output power [dBm]
3 -25
7 -1519 -5
31 0
4 The Benchmarking Methodology
4.1 Introduction
One of the major problems of indoor localizationis the challenge of reproducing research results inreal life scenarios and the inability to compare theirperformance due to evaluation under individual, notcomparable and not repeatable conditions. Therefore,contrary to previous approaches, our benchmarkingapproach does not focus exclusively on the accuracy ofthe evaluated localization approach, but also considersother performance measures that are relevant from thepoint of view of practical deployment of localizationsolutions such as energy efficiency and response time.
Figure 4: Transform measurements to scores usingmetrics
Due to variation in the sensibility of different use-casescenarios on the individual metrics, the methodology
cleanly decouples between evaluating individual metricsand calculation of a final score used for ranking.As illustrated on Figure 4, after collecting a set ofmeasurements necessary for the calculation of theindividual metrics, the methodology envisions the use ofweighting factors and thresholding for the calculation ofthe final ranking score, reflecting the different impactof the individual metrics for the particular applicationscenario of interest.
4.2 Used Metrics
The metrics that will be used for the evaluation of thesolutions will have a critical impact on the final score.A classical mistake by other comparison and evaluationtools is only using the point accuracy as a reference for agood or bad working solution. In this paper, we will takeothers metrics into account as well, which are defined inthe EVARILOS Benchmarking Handbook [6].
4.3 Used Scenarios
Each solution is evaluated using a predefined scenarioin each testbed. These are based on the genericscenario descriptions of the EVARILOS BenchmarkingHandbook. In the next paragraphs, we will describe eachscenario of each testbed. A detailed overview of eachtestbed is given in Section 5.
4.3.1 TWIST Testbed
The scenario is instantiated on the 2nd floor ofthe TWIST testbed, and can be characterized as a“small office environment” according to the EVARILOSBenchmarking Handbook. The evaluation points used toevaluate the localization solutions are shown in Figure 5.These points were selected based on the Latin Hypercubeprinciple, taking into account that there are limitationsdue to unreachable places.
Figure 5: TWIST evaluation points utilized for thefirst benchmarking scenario
4.3.2 w-iLab.t I Testbed
At w-iLab.t I testbed, we use the third floor to executethe experiments. On this floor, 57 nodes are available forthe experiments. An overview of the third floor is givenin Figure 12. There is no actual difference between the

Comparability of RF-based Indoor Localization Solutions in Heterogeneous Environments 9
Figure 6: Measurement points in the w-iLab.t Itestbed
green and the blue dots, it is for reservation purposesonly.Unfortunately, not the whole floor can be considered asa test area. Some private offices, technical staff room,etc. are not available for measuring. The unreachablezones are marked with a red layer. In order to definethe measurement points, we used a grid (see Figure 6).The decision has to be taken without premeditation.Therefore, a randomizer is used. To avoid measurementpoints close to each other, making an unbalanceddistribution, the principle of the Latin Square is applied.
4.3.3 w-iLab.t II Testbed
In this testbed, the 26 measurement points are wellspread over the area. These are selected by randomnessin each sub-area. This is shown in Figure 7. Special inthis setup is that there is no physical person presentin the building. Everything is controlled remotely usingrobots. In this way, the repeatability of the measurementpoint is very high. On the other hand, this “openenvironment” is made of metal walls and contains a lotof metal objects, making it very challenging for accuratelocalization.
Figure 7: The measurement points of w-iLab.t IItestbed
5 Test Environments
5.1 TWIST Testbed in Berlin
The TKN Wireless Indoor Sensor Network Testbed(TWIST) is a multiplatform, hierarchical testbedarchitecture developed at the Technische Universitat
Berlin. The TWIST instance at the TKN office buildingis one of the first and most popular remotely accessibletestbeds [29]. It has 204 SUT sockets, currentlypopulated with 102 eyesIFX and 102 Tmote Sky nodes(Figure 8, with location of TMote Sky nodes indicatedwith red and locations of WiFi access points with purpledots.). Tmote Sky nodes use a Tiny OS developmentenvironment. They consist of a TI MSP430 processorrunning at 8 MHz, 10 KB of RAM, 1 Mbit of flashmemory and an IEEE 802.15.4 compliant ChipconCC2420 radio operating at 2.4 GHz with a maximumindoor range of approximately 100 m. Each nodeincludes sensors for light, temperature, and humidity.The hardware setup is extendibles with a large varietyof other radios (e.g Software Defined Radio, sensingengine), as long as the radio has a USB or RS232serial interfaces. The nodes are deployed in a 3D gridspanning 3 floors of an office building at the TUBcampus, resulting in more than 1500 m2 of instrumentedoffice space. In small rooms (∼14 m2), two nodes of eachplatform are deployed, while the larger ones (∼28 m2)have four nodes (Figure 9). This setup results in a fairlyregular grid deployment pattern with intra node distanceof 3 m. Within the rooms the sensor nodes are attachedto the ceiling.
Figure 8: TWIST testbed: nodes
Figure 9: TWIST testbed: map (2nd floor)
For specific purpose of benchmarking of RF-based indoorlocalization, in addition to the described sensor network,the TWIST infrastructure consists of multiple otherdevices, as described in [30, 31]. Deployed WiFi accesspoints are commercial of-the-shelf TL-WDR4300 routers(Figure 10). The WiFi routers can serve two functions.They can be used as a part of the localization solution, ifparticular solution requires WiFi anchor points. At thesame time, some routers can also be used for creatingdifferent types and amounts of IEEE 802.11 traffic inorder to generate controlled WiFi interference.

10 T. Van Haute et al.
Figure 10: TWIST testbed: hardware components
For supporting mobility and automation of thelocalization measurements multiple TWISTbot roboticplatforms (based on the TurtleBot design from WillowGarage), are used. Their function is to carry nodes thatneed to be localized through the measurement points andreport the ground truth position.Furthermore, the TWIST infrastructure iscomplemented by several WiSpy sensing devices: theseare low-cost spectrum scanners that monitor activityin the 868 MHz, 2.4 and 5 GHz spectrum, and outputthe measured RF energy and the quality of the receivedsignals. Also, for more precise sensing of the wirelessenvironment spectrum analyzers are used. Except for thebefore mentioned WiFi routers and TWIST platform,for generating interference Rohde & Schwarz signalgenerator is used. Signal generator can be used forgenerating arbitrary RF signals, and its usual usage isfor generating microwave interference.
5.2 w-iLab.t I Testbed at De Zuiderpoort
The w-iLab.t I testbed is located at “De Zuiderpoort”in Ghent, Belgium. The infrastructure is distributed onthree floors (18 x 90m) of the iMinds office (Figure 12).The network consists of 200 nodes. Every w-iLab.t nodeis generic and is equipped with one or more sensor nodes,an intermediate node with 2 WiFi 802.11 radios, theenvironment emulator and a Bluetooth interface. As inTSIT testbed, the sensor nodes are Tmote Sky motes.The intermediate nodes (called iNodes, Figure 11) areAlix 3C3 devices running Linux. These are mini PCsequipped with Ethernet, USB, serial, VGA, audio andtwo IEEE 802.11 a/b/g interfaces. All the iNodesare connected to the management backbone usingPower-over-Ethernet switches, making it possible topower up/down the iNodes as needed without physicalinteraction with the iNodes. The iNodes can become anactive member of the experiment as it is possible toadjust the kernel, the driver, to add click router code orto add java-based applications.Finally, the Environment Emulator (EE) is located inbetween the iNode and the sensor node. Using theEE, it is possible to emulate the behavior of anytype of sensor or actuator without the need for realsensoractuator hardware or the development of a full-blown sensor application. It is possible to emulate thebattery depletion, depending on the real life powerconsumption of the sensor node. When the node’sbattery is depleted or the node is destroyed (e.g., inan explosion), the node can be switched off. The EEcan be programmed to emulate a sensor event (e.g.,
temperature rise, motion detection), an actuator eventor to support voice streams. Further, the EE can be usedto monitor the energy consumption of each individualsensor. Altogether, this means that it is possible toassess the complete usability of a certain wireless sensorand actuator network application or protocol in a real-life environment. The initial core of w-iLab.t was basedon the widely used MoteLab testbed from HarvardUniversity. According to the EVARILOS BenchmarkingMethodology This building belongs to the category“Plywooden walls” and the size is “Big”.This is a classic office environment where multipledevices communicate wirelessly with each other. Laptopsusing WiFi and Bluetooth, smartphones using the 3Gnetwork. Here we consider typical office applications likeemail, file transfer, videoaudio conferencing and websurfing. The office environment is a live environment.Meaning the interference in this testbed is uncontrolled.During daytime several people are working in thesebuildings. So the w-iLab.t I is a testbed with veryrealistic office interference. The cost of this realistic officeenvironment is the uncontrollable interference.The w-iLab.t I testbed is centrally managed forcontrol and monitoring purposes. It supports easyconfiguration and deployment, including installation ofnew software, protocols and middleware components viaan intuitive web-based interface. Registered users canupload executables, associate those executables with thenodes (both sensor nodes and iNodes) to create a job,and schedule the job to be run on w-iLab.t I. During thejob all messages and other data are logged to a database,which is presented to the user upon job completion andthen can be used for processing and visualization.All the possibilities of the complete testbed, theenvironment emulator scenarios and events, avisualization and a graphical analysis tool, are accessiblethrough a web interface. The visualization too canvisualize any type of node status andor link informationon a map of the building, while the graphical analyzerplots out the data. The information for both tools isgathered from the database through the use of usercustomizable MySQL statements, making it extremelyflexible. External users can access the testbed over asecured OpenVPN connection.
Figure 11: iNode mounted to the ceiling of thew-iLab.t I wireless testbed

Comparability of RF-based Indoor Localization Solutions in Heterogeneous Environments 11
Figure 12: The w-iLab.t I wireless testbed: map
5.3 w-iLab.t II in Zwijnaarde
The w-iLab.t II testbed is located in “Zwijnaarde”,above a cleanroom. At this location, there is (almost) nointerference. It is one open space where 60 fixed nodes aredistributed over an area of 70 x 25 m (Figure 13). In thisenvironment there are also 20 mobile nodes. These nodesare based on a vacuum cleaning robot and are extendedwith a radio for remote control and accurate positioningalgorithms (with rasters on the floor). Due to the factthat the movement of these robots is controlled, mobilityis reproducible. The fixed nodes are marked with bluespots while the mobile nodes have orange spots on themap in Figure 13. Every node location contains (i) aZotac embedded PC, (ii) an environment emulator (seew-iLab.t I), (iii) an iMinds Rmoni sensor node, (iv) aBluetooth dongle and some of them have a web-camera.These nodes are remotely powered by Racktivity PDUs.
Figure 13: The w-iLab.t II wireless testbed: map
6 Results in TWIST Testbed
6.1 RSSI and ToA with Particle Filter
In this section we evaluate the particle filter localizationapproach outlined in Section 3.1. Table 3 presents thesummarized results. In this table, “Min.” stands forMinimum, “Max.” for Maximum and “RMS” for RootMean Square. These abbreviations are also used in theother tables.
Table 3 Statistical information about the performance ofthe particle filter algorithm in TWIST testbed
Metric RSSI ToA
Average error [m] 4.35 5.56
Min. error [m] 0.62 0.68
Max. error [m] 12.99 22.47
Median error [m] 3.22 3.91
RMS error [m] 5.28 7.11
Room accuracy [%] 45.00 30.00
Response time [ms] 14 285 14 282
Measurements are collected for over a minute at eachmeasurement point. Most of this time is spent tryingto reach nodes that are not within reach, and findingthe channel that a reachable testbed node currently isusing. The response time could be decreased significantlyby dedicating a single channel for communication tobe used before starting the ranging phase. Moreover,range estimations do not improve significantly after 1300measurements, as shown in Figure 14. Therefore weuse only the first 1300 collected values for our rangeestimations. This also helps limiting the response timebecause each measurement takes on average 4 ms. Weuse the same approach for the RSSI measurements,although the figure shows that 50 measurements arelikely to be enough. The figure also shows that afterapproximately 500 measurements the ToA based methodperforms better.
0 500 1000 1500 2000 2500 3000# Measurements
2.5
3.0
3.5
4.0
4.5
5.0
5.5
Abs.
Err
or (m
)
Abs. Range Error vs. Number of Measurements
rssitoa
Figure 14: The absolute range error for ToA decreaseswith the number of measurements until approximately1300 measurements. The RSSI error fluctuates about
the same value, and is not improved by additionalmeasurements
Figure 15 shows the CDFs for the absolute rangeerrors and the localization errors. The RSSI basedrange estimation performs better than the ToA basedestimation, although Figure 14 shows that ToA shouldgive better results for a high number of measurements.The reason for this is that only about 50% of the pair-wise ranging procedures result in 500 measurements or

12 T. Van Haute et al.
more, and only about 10% result in 1300 measurementsor more.
0 5 10 15 20 25Abs. Error (m)
0.0
0.2
0.4
0.6
0.8
1.0
Prob
abili
ty
Abs Range Error CDF (twist, reference_scenario)
rssitoa
0 5 10 15 20 25Error (m)
0.0
0.2
0.4
0.6
0.8
1.0
Prob
abili
ty
Localization Error CDF (Twist, reference_scenario)
rssitoa
Figure 15: CDFs for the absolute range error (top)and the localization error (bottom)
The power consumption of both the target node andthe testbed nodes is approximately 105 mW. It iscomputed as the mean of the transmission and receptionpower consumptions. The energy consumption per nodeis especially important when battery powered deviceswill be used, since it directly impacts the lifetimeof a battery-powered localization solution. The nodeenergy consumption can also be used to calculate theoverall energy consumption. The infrastructure nodesare always on, and a total of 68 testbed nodes are used.As a result, the continuous total power consumption canbe calculated to be 7.1 W for the infrastructure. Themobile node is only on during the response time, whichis in the order of 15 s, resulting in an average energyconsumption of 1.5 J per measurement.
6.2 Fingerprinting
This section evaluates the fingerprinting localizationapproach described in Section 3.2. The accuracy results
are shown in Table 4. The results show that the PHDistance of RSSI Quantiles give comparable results withthe ED Distance of Averaged RSSI Vectors in officescenarios (see also Figure 16). The results also show that,when more beacons are collected and thus the responsetime increases, the PH has a slightly better overallperformance in terms of accuracy. This improvementwill be more emphasized in the open space scenario(see results in Section 8). The minimum error of allsolutions equals zero, which is possible because some ofthe fingerprints taken during the training set are at thesame locations that were used for the evaluation of thealgorithm.
Table 4 Statistical information about the performance offingerprinting algorithms in TWIST testbed
Metric KL ED PH
Average error [m] 2.77 2.16 2.02
Min. error [m] 0.00 0.00 0.00
Max. error [m] 5.71 6.35 6.35
Median error [m] 2.98 2.48 2.52
RMS error [m] 3.39 2.95 2.79
Room accuracy [%] 50.00 80.00 85.00Response time [s] 35.67 35.11 35.12
Since a localization solution, in general, contains manyconfigurable parameters, we expect that they willtypically be offered to end users using predeterminedconfiguration setting. As such, it is important to beaware of the inherent trade-offs that are made by thedeveloper of the solution. This is especially importantwhen considering also additional metrics such as theresponse time. For this solution, the time during whichfingerprints are collected (e.g. the time needed beforea location estimate could be generated) was set to35 seconds (excluding the off-line time required forfingerprinting). Figure 17 and 18 show the trade-offsbetween response and point and room level accuraciesfor fingerprinting based solutions in TWIST testbed. Asmore fingerprints are collected, a better match can bemade in order to better estimate the position. Lowerresponse times are possible, at the cost of decreasedaccuracy. Especially more complex algorithms (such asthe PH distance) require more samples to estimatethe distributions of the RSSI values. As such, whencomparing different localization solutions, the targetedresponse time has an important influence on the selectionof the best algorithm.Finally, the energy consumption of the infrastructurenodes (TPLINK 4300 router) is on average 0.5 W,whereas the energy consumption of the used mobiledevices (MacBook Pro AirPort Extreme NIC) was onaverage 7 W.
6.3 Proximity & Weighted RSSI
This section evaluates the RSSI based localizationapproach described in Section 3.3. The obtainedaccuracy is summarized in Table 5 for differenttransmission powers. The average accuracy is relatively

Comparability of RF-based Indoor Localization Solutions in Heterogeneous Environments 13
Figure 16: CDF of the localization error offingerprinting based solutions in TWIST testbed
Figure 17: Fingerprint collection delay versus pointaccuracy
Figure 18: Fingerprint collection delay versus roomlevel accuracy
low: the concrete walls in the building causeunpredictable signal attenuation, resulting in lessaccurate estimations of the true location. Using lowertransmission powers causes less signals to propagate tomultiple rooms, hence the better performance of lowtransmission powers. A cumulative distribution functionof the errors is shown in Figure 19.
Table 5 Statistical information about the performance ofthe hybrid algorithm in TWIST testbed
Metric Tx3 Tx7 Tx19 Tx31
Average error [m] 4.63 7.08 6.93 8.31
Min. error [m] 0.75 0.83 0.80 0.82
Max. error [m] 10.20 17.52 18.93 19.31
Median error [m] 4.39 6.81 6.68 8.63
RMS error [m] 5.13 7.75 7.82 9.24
Room accuracy [%] 26.67 6.70 13.45 9.56
Response time [ms] 1503 1507 480 460
Figure 19: Distribution of the RMS localization errorin TWIST testbed
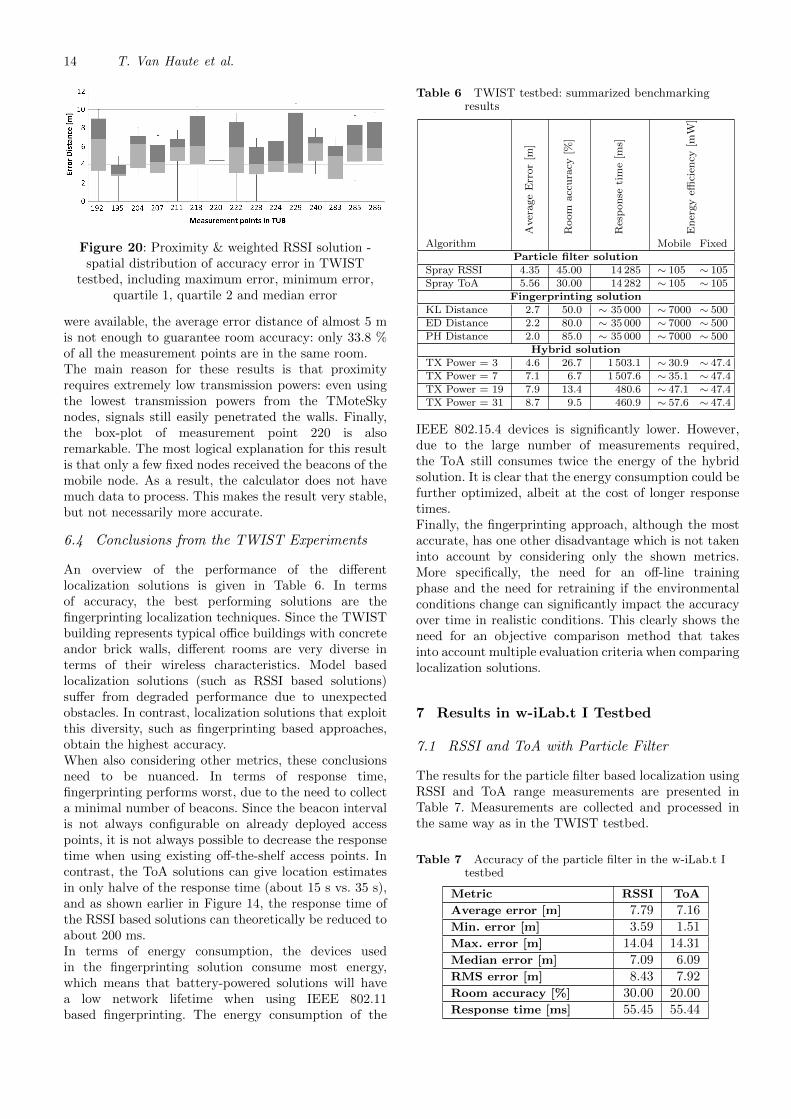
To estimate the position, the anchor points collect RSSIvalues from the beacons transmitted by the mobilenode. All these RSSI values are collected and merged inthe position calculator. There, a translation from RSSIvalues into coordinates is made. For low transmissionpowers, the corresponding response delay is about 1.5 s(exact values are given in Section 6.4), with an energyconsumption of about 31 mW for the mobile node.To analyze the spatial distribution of the errors, abox-plot of the accuracy per measurement point isshown in Figure 20. The overall performance is foreach measurement point the same, there are no obviousoutliers. Noticeable, the worst minimum values areobtained in the corridor (measurement points 283, 285and 286) and in the room where no LoS nodes areavailable (measurement point 240). If the results of theserooms are excluded in the room accuracy calculation,then the results are marginally better (e.g. for a Txpower = 7 the room accuracy increases to 21.3 % insteadof to 10.3 %), but even in the rooms where the nodes
14 T. Van Haute et al.
Figure 20: Proximity & weighted RSSI solution -spatial distribution of accuracy error in TWIST
testbed, including maximum error, minimum error,quartile 1, quartile 2 and median error
were available, the average error distance of almost 5 mis not enough to guarantee room accuracy: only 33.8 %of all the measurement points are in the same room.The main reason for these results is that proximityrequires extremely low transmission powers: even usingthe lowest transmission powers from the TMoteSkynodes, signals still easily penetrated the walls. Finally,the box-plot of measurement point 220 is alsoremarkable. The most logical explanation for this resultis that only a few fixed nodes received the beacons of themobile node. As a result, the calculator does not havemuch data to process. This makes the result very stable,but not necessarily more accurate.
6.4 Conclusions from the TWIST Experiments
An overview of the performance of the differentlocalization solutions is given in Table 6. In termsof accuracy, the best performing solutions are thefingerprinting localization techniques. Since the TWISTbuilding represents typical office buildings with concreteandor brick walls, different rooms are very diverse interms of their wireless characteristics. Model basedlocalization solutions (such as RSSI based solutions)suffer from degraded performance due to unexpectedobstacles. In contrast, localization solutions that exploitthis diversity, such as fingerprinting based approaches,obtain the highest accuracy.When also considering other metrics, these conclusionsneed to be nuanced. In terms of response time,fingerprinting performs worst, due to the need to collecta minimal number of beacons. Since the beacon intervalis not always configurable on already deployed accesspoints, it is not always possible to decrease the responsetime when using existing off-the-shelf access points. Incontrast, the ToA solutions can give location estimatesin only halve of the response time (about 15 s vs. 35 s),and as shown earlier in Figure 14, the response time ofthe RSSI based solutions can theoretically be reduced toabout 200 ms.In terms of energy consumption, the devices usedin the fingerprinting solution consume most energy,which means that battery-powered solutions will havea low network lifetime when using IEEE 802.11based fingerprinting. The energy consumption of the
Table 6 TWIST testbed: summarized benchmarkingresults
Aver
age
Err
or
[m]
Room
acc
ura
cy[%
]
Res
pon
seti
me
[ms]
En
ergy
effici
ency
[mW
]
Algorithm Mobile Fixed
Particle filter solutionSpray RSSI 4.35 45.00 14 285 ∼ 105 ∼ 105Spray ToA 5.56 30.00 14 282 ∼ 105 ∼ 105
Fingerprinting solution
KL Distance 2.7 50.0 ∼ 35 000 ∼ 7000 ∼ 500ED Distance 2.2 80.0 ∼ 35 000 ∼ 7000 ∼ 500PH Distance 2.0 85.0 ∼ 35 000 ∼ 7000 ∼ 500
Hybrid solutionTX Power = 3 4.6 26.7 1 503.1 ∼ 30.9 ∼ 47.4TX Power = 7 7.1 6.7 1 507.6 ∼ 35.1 ∼ 47.4
TX Power = 19 7.9 13.4 480.6 ∼ 47.1 ∼ 47.4TX Power = 31 8.7 9.5 460.9 ∼ 57.6 ∼ 47.4
IEEE 802.15.4 devices is significantly lower. However,due to the large number of measurements required,the ToA still consumes twice the energy of the hybridsolution. It is clear that the energy consumption could befurther optimized, albeit at the cost of longer responsetimes.Finally, the fingerprinting approach, although the mostaccurate, has one other disadvantage which is not takeninto account by considering only the shown metrics.More specifically, the need for an off-line trainingphase and the need for retraining if the environmentalconditions change can significantly impact the accuracyover time in realistic conditions. This clearly shows theneed for an objective comparison method that takesinto account multiple evaluation criteria when comparinglocalization solutions.
7 Results in w-iLab.t I Testbed
7.1 RSSI and ToA with Particle Filter
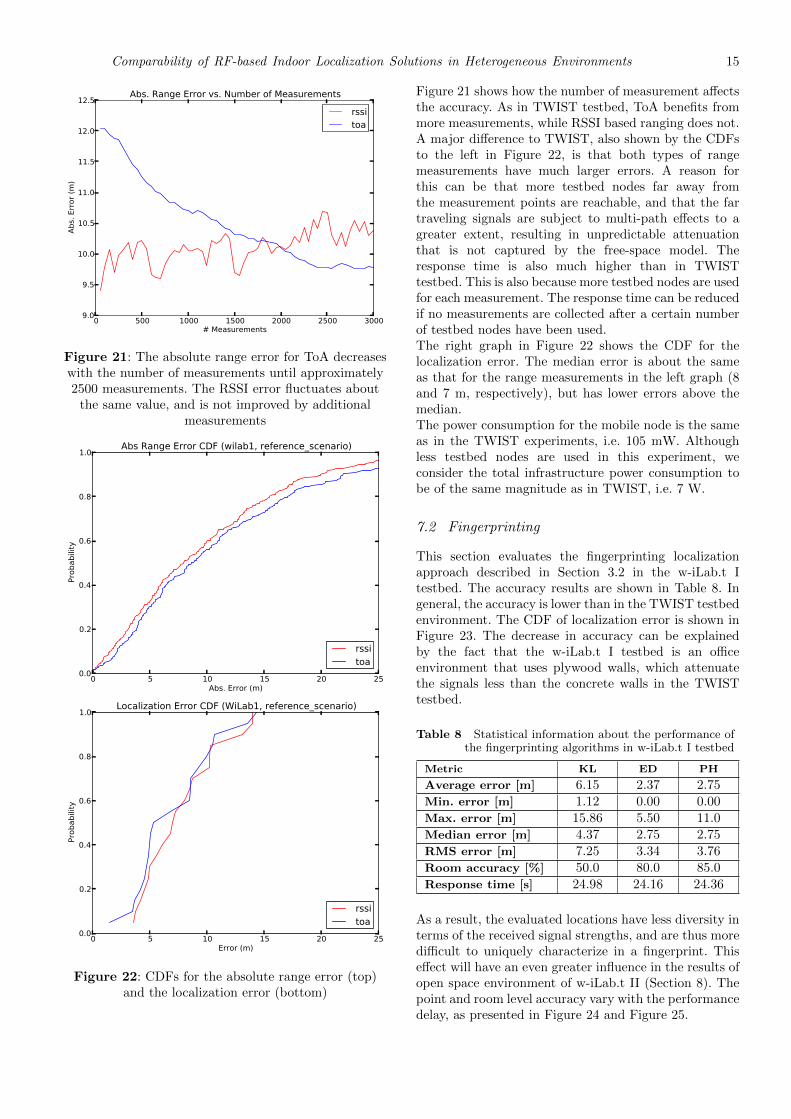
The results for the particle filter based localization usingRSSI and ToA range measurements are presented inTable 7. Measurements are collected and processed inthe same way as in the TWIST testbed.
Table 7 Accuracy of the particle filter in the w-iLab.t Itestbed
Metric RSSI ToA
Average error [m] 7.79 7.16
Min. error [m] 3.59 1.51
Max. error [m] 14.04 14.31
Median error [m] 7.09 6.09
RMS error [m] 8.43 7.92
Room accuracy [%] 30.00 20.00
Response time [ms] 55.45 55.44
Comparability of RF-based Indoor Localization Solutions in Heterogeneous Environments 15
0 500 1000 1500 2000 2500 3000# Measurements
9.0
9.5
10.0
10.5
11.0
11.5
12.0
12.5
Abs.
Err
or (m
)
Abs. Range Error vs. Number of Measurements
rssitoa
Figure 21: The absolute range error for ToA decreaseswith the number of measurements until approximately2500 measurements. The RSSI error fluctuates about
the same value, and is not improved by additionalmeasurements
0 5 10 15 20 25Abs. Error (m)
0.0
0.2
0.4
0.6
0.8
1.0
Prob
abili
ty
Abs Range Error CDF (wilab1, reference_scenario)
rssitoa
0 5 10 15 20 25Error (m)
0.0
0.2
0.4
0.6
0.8
1.0
Prob
abili
ty
Localization Error CDF (WiLab1, reference_scenario)
rssitoa
Figure 22: CDFs for the absolute range error (top)and the localization error (bottom)
Figure 21 shows how the number of measurement affectsthe accuracy. As in TWIST testbed, ToA benefits frommore measurements, while RSSI based ranging does not.A major difference to TWIST, also shown by the CDFsto the left in Figure 22, is that both types of rangemeasurements have much larger errors. A reason forthis can be that more testbed nodes far away fromthe measurement points are reachable, and that the fartraveling signals are subject to multi-path effects to agreater extent, resulting in unpredictable attenuationthat is not captured by the free-space model. Theresponse time is also much higher than in TWISTtestbed. This is also because more testbed nodes are usedfor each measurement. The response time can be reducedif no measurements are collected after a certain numberof testbed nodes have been used.The right graph in Figure 22 shows the CDF for thelocalization error. The median error is about the sameas that for the range measurements in the left graph (8and 7 m, respectively), but has lower errors above themedian.The power consumption for the mobile node is the sameas in the TWIST experiments, i.e. 105 mW. Althoughless testbed nodes are used in this experiment, weconsider the total infrastructure power consumption tobe of the same magnitude as in TWIST, i.e. 7 W.
7.2 Fingerprinting
This section evaluates the fingerprinting localizationapproach described in Section 3.2 in the w-iLab.t Itestbed. The accuracy results are shown in Table 8. Ingeneral, the accuracy is lower than in the TWIST testbedenvironment. The CDF of localization error is shown inFigure 23. The decrease in accuracy can be explainedby the fact that the w-iLab.t I testbed is an officeenvironment that uses plywood walls, which attenuatethe signals less than the concrete walls in the TWISTtestbed.
Table 8 Statistical information about the performance ofthe fingerprinting algorithms in w-iLab.t I testbed
Metric KL ED PH
Average error [m] 6.15 2.37 2.75
Min. error [m] 1.12 0.00 0.00
Max. error [m] 15.86 5.50 11.0
Median error [m] 4.37 2.75 2.75
RMS error [m] 7.25 3.34 3.76
Room accuracy [%] 50.0 80.0 85.0
Response time [s] 24.98 24.16 24.36
As a result, the evaluated locations have less diversity interms of the received signal strengths, and are thus moredifficult to uniquely characterize in a fingerprint. Thiseffect will have an even greater influence in the results ofopen space environment of w-iLab.t II (Section 8). Thepoint and room level accuracy vary with the performancedelay, as presented in Figure 24 and Figure 25.

16 T. Van Haute et al.
Figure 23: CDF of the localization error of thefingerprinting based solutions in w-iLab.t I testbed
Figure 24: Fingerprint collection delay versus pointaccuracy
Figure 25: Fingerprint collection delay versus roomlevel accuracy
7.3 Proximity & Weighted RSSI
The location accuracy of the weighted RSSI basedlocalization solution in w-iLab.t I testbed is shown inTable 9. The CDF of the localization error can be foundin Figure 26. Because the plywood walls do not attenuatethe signals significantly, locations need to be determinedbased on weighted RSSI values (rather than proximity)even when using low transmission powers. As a result,in contrast to the experiments in the TWIST testbed,where the localization accuracy depends strongly on thetransmission power, the results in w-iLab.t I testbed areless dependent on the transmission power.
Table 9 Statistical information about the performance ofthe hybrid algorithm in w-iLab.t I testbed
Metric Tx3 Tx7 Tx19 Tx31
Average error [m] 7.64 8.86 7.47 8.21
Min. error [m] 0.07 0.04 0.17 0.04
Max. error [m] 48.77 65.98 45.23 45.23
Median error [m] 5.87 7.63 6.18 7.21
RMS error [m] 9.35 10.15 8.83 9.44
Room accuracy [%] 18.62 16.27 12.60 9.46
Response time [ms] 2100 113 108 110
Figure 26: Distribution of the RMS localization errorin w-iLab.t I testbed
The spatial spread of the accuracy is shown in Figure 27using a box-plot. The measured points more in the centerof the testbed have a higher accuracy then those at theedges, because the edge evaluation points are outside thegrid of used anchor points. For example, in Figure 28a clear bias in the estimated locations can be observedcaused by the fact that all anchor nodes are located atthe same side of the evaluation point. This highlightsthe importance of using anchor nodes outside the areathat is evaluated, which is a requirement that is notfound for the fingerprinting solutions. Finally, Figure 29shows the room accuracy of location estimation. It isinteresting to note that it is not possible to predict theroom accuracy based only on the point accuracy, because

Comparability of RF-based Indoor Localization Solutions in Heterogeneous Environments 17
the room accuracy depends strongly on random factorssuch as the direction of the inaccuracies.
0,00
5,00
10,00
15,00
20,00
25,00
30,00
35,00
40,00
45,00
50,00
1 2 3 4 5 6 7 8 9 10
Erro
r d
ista
nce
[m
]
Measurement points in w.iLab-t I
Figure 27: Proximity & weighted RSSI solution -spatial distribution of accuracy error in w-iLab.t I,
including maximum error, minimum error, quartile 1,quartile 2 and median error
0
200
400
600
800
1000
1200
1400
1600
0 500 1000 1500 2000 2500 3000 3500
Measured points
True point
Figure 28: Biased spread of the location estimatesresulting from evaluating measurement locations
outside the grid of anchor nodes.
0
10
20
30
40
50
60
70
80
1 2 3 4 5 6 7 8 9 10 Total
Ro
om
acc
ura
cy (
%)
Measurement points in w-iLab.t I
TX 3
TX 7
TX 19
TX 31
Figure 29: The results of the room accuracy in eachmeasurement point in the w-iLab.t I testbed
7.4 Conclusions from w-iLab.t I Experiments
An overview of the performance of the differentlocalization solutions is given in Table 10. As arepresentative of a typical building with plywood walls,signals are less attenuated than in the TWIST testbed,resulting in less unique wireless features per room. Asa result, fingerprinting solutions perform worse thanin the TWIST environment. Also the ToA and RSSIbased solutions have significantly degraded performance.This can be explained by the fact that, due to testbedlimitations, anchor nodes are not installed on thecorner points, meaning that several evaluation pointsare outside the grid of anchor nodes. In addition,although the walls are made from plywood that havea very small attenuation factor, signal propagation stillbehaves very unpredictable due to the presence of large
metal cupboards and metal ceilings. This demonstratesthat the performance of localization solutions in typicalenvironments is influenced by many factors besides thebuilding construction materials, and highlights the factthat localization performances measured in a emptybuilding should not be considered representative for theperformance of said solutions when the buildings areactively used.
Table 10 w-iLab.t I testbed: summarized benchmarkingresults
Aver
age
Err
or
[m]
Room
acc
ura
cy[%
]
Res
ponse
tim
e[m
s]
Ener
gy
effici
ency
[mW
]
Algorithm Mobile Fixed
Particle filter solution
Spray RSSI 7.79 30.00 55 448 ∼ 105 ∼ 105
Spray ToA 7.16 20.00 55 444 ∼ 105 ∼ 105
Fingerprinting solution
KL Distance 6.15 50.00 ∼ 24000 ∼ 7000 ∼ 500
ED Distance 2.37 80.00 ∼ 24000 ∼ 7000 ∼ 500
PH Distance 2.75 85.00 ∼ 24000 ∼ 7000 ∼ 500
Hybrid solution
TX Power = 3 7.64 18.62 2100.74 ∼ 30.9 ∼ 47.4
TX Power = 7 8.86 16.27 113.15 ∼ 35.1 ∼ 47.4
TX Power = 19 7.47 12.60 107.99 ∼ 47.1 ∼ 47.4
TX Power = 31 8.21 9.46 110.17 ∼ 57.6 ∼ 47.4
8 Results in w-iLab.t II Testbed
8.1 RSSI and ToA with Particle Filter
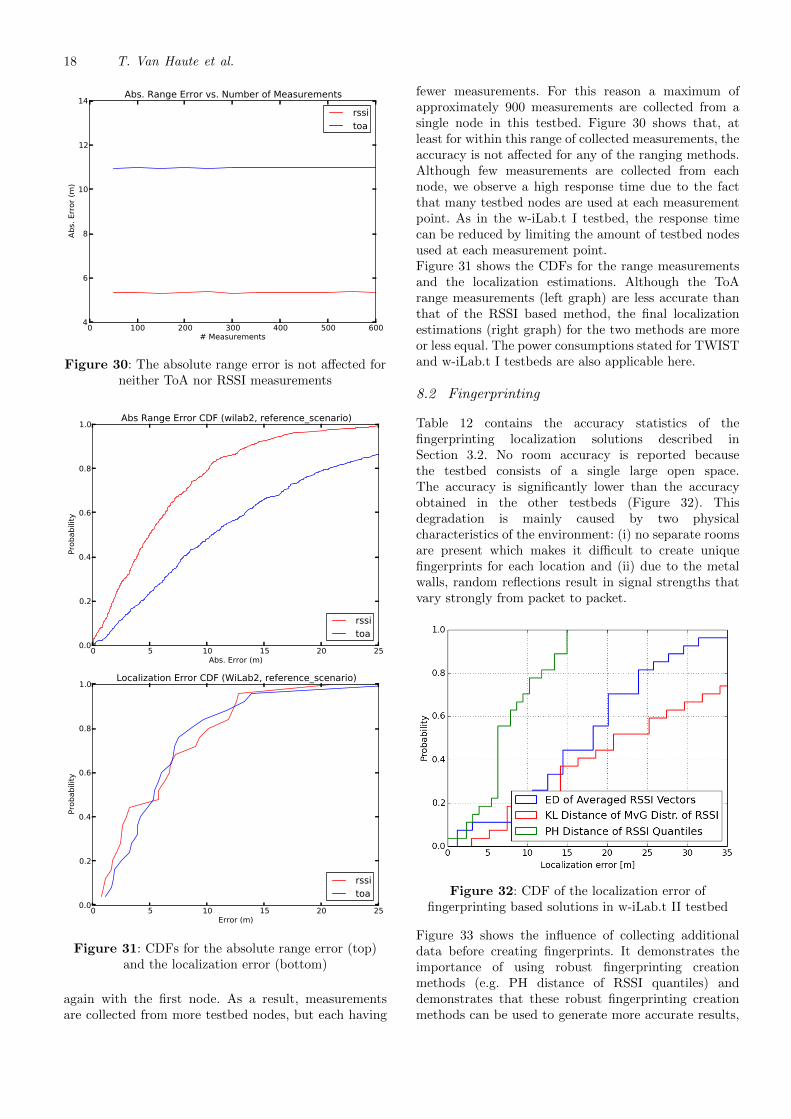
The results for the particle filter based localization usingRSSI and ToA range measurements are presented inTable 11.
Table 11 Statistical information about the performance ofthe particle filter algorithm in w-iLab.t II testbed
Metric RSSI ToA
Average error [m] 6.41 6.66
Min. error [m] 0.90 0.99
Max. error [m] 20.22 27.06
Median error [m] 5.68 5.50
RMS error [m] 8.05 8.59
Response time [ms] 59633 59620
In this testbed, the measurements are collected in aslightly different way than in TWIST and w-iLab.t Itestbeds. A single channel is used due to a limitationof the testbed nodes. Moreover, instead of collectingmultiple measurements from a specific testbed nodebefore switching to the next testbed node, a singlemessage is exchanged with each infrastructure node andwhen all nodes have been tried, the process starts over
18 T. Van Haute et al.
0 100 200 300 400 500 600# Measurements
4
6
8
10
12
14
Abs.
Err
or (m
)
Abs. Range Error vs. Number of Measurements
rssitoa
Figure 30: The absolute range error is not affected forneither ToA nor RSSI measurements
0 5 10 15 20 25Abs. Error (m)
0.0
0.2
0.4
0.6
0.8
1.0
Prob
abili
ty
Abs Range Error CDF (wilab2, reference_scenario)
rssitoa
0 5 10 15 20 25Error (m)
0.0
0.2
0.4
0.6
0.8
1.0
Prob
abili
ty
Localization Error CDF (WiLab2, reference_scenario)
rssitoa
Figure 31: CDFs for the absolute range error (top)and the localization error (bottom)
again with the first node. As a result, measurementsare collected from more testbed nodes, but each having
fewer measurements. For this reason a maximum ofapproximately 900 measurements are collected from asingle node in this testbed. Figure 30 shows that, atleast for within this range of collected measurements, theaccuracy is not affected for any of the ranging methods.Although few measurements are collected from eachnode, we observe a high response time due to the factthat many testbed nodes are used at each measurementpoint. As in the w-iLab.t I testbed, the response timecan be reduced by limiting the amount of testbed nodesused at each measurement point.Figure 31 shows the CDFs for the range measurementsand the localization estimations. Although the ToArange measurements (left graph) are less accurate thanthat of the RSSI based method, the final localizationestimations (right graph) for the two methods are moreor less equal. The power consumptions stated for TWISTand w-iLab.t I testbeds are also applicable here.
8.2 Fingerprinting
Table 12 contains the accuracy statistics of thefingerprinting localization solutions described inSection 3.2. No room accuracy is reported becausethe testbed consists of a single large open space.The accuracy is significantly lower than the accuracyobtained in the other testbeds (Figure 32). Thisdegradation is mainly caused by two physicalcharacteristics of the environment: (i) no separate roomsare present which makes it difficult to create uniquefingerprints for each location and (ii) due to the metalwalls, random reflections result in signal strengths thatvary strongly from packet to packet.
Figure 32: CDF of the localization error offingerprinting based solutions in w-iLab.t II testbed
Figure 33 shows the influence of collecting additionaldata before creating fingerprints. It demonstrates theimportance of using robust fingerprinting creationmethods (e.g. PH distance of RSSI quantiles) anddemonstrates that these robust fingerprinting creationmethods can be used to generate more accurate results,

Comparability of RF-based Indoor Localization Solutions in Heterogeneous Environments 19
on the condition that more data is collected (at the costof higher response delays).
Figure 33: Fingerprint collection delay versus pointaccuracy
Table 12 Statistical information about the performanceof fingerprinting algorithms in w-iLab.t II testbed
Metric KL ED PH
Average error [m] 24.76 19.08 8.13
Min. error [m] 3.00 3.00 0.00
Max. error [m] 47.43 39.00 15.10
Median error [m] 21.0 18.97 6.70
RMS error [m] 28.09 20.76 8.97
Response time [s] 24.78 24.37 24.12
8.3 Proximity & Weighted RSSI
The location accuracy of the weighted RSSI basedlocalization solution in w-iLab.t II testbed is shown inTable 13.
Figure 34: Distribution of the RMS localization errorin w-iLab.t II testbed
The CDF of the localization error can be found inFigure 34. The average accuracy is significantly lowerthan in the previous environments, mainly due to themany reflections in the environment thereby causing self-interference. The spatial spread of the accuracy is shownin Figure 35 using a box-plot.
0,00
5,00
10,00
15,00
20,00
25,00
30,00
35,00
1 2 3 4 5 6 7 8 9 10 11 12 13 14 15 16 17 18 19 20 21 22 23 24 25 26
Erro
r d
ista
nce
[m
]
Measurement points in w.iLab-t II
Figure 35: Proximity & weighted RSSI solution -spatial distribution of accuracy error in w-iLab.t II,
including maximum error, minimum error, quartile 1,quartile 2 and median error
Table 13 Accuracy of the hybrid localization algorithm inthe w-iLab.t II testbed (Tx = 31)
Average error [m] 17.16
Min. error [m] 1.57
Max. error [m] 52.15
Median error [m] 16.24
RMS error [m] 19.73
Response time [ms] 15.7
8.4 Conclusions from w-iLab.t II Experiments
The environment from w-iLab.t II testbeds exhibitscharacteristics which are typical for many large-sizeindustrial indoor environments, namely open spacessurrounded by metal obstacles, walls and ceilings.
Table 14 w-iLab.t II testbed: summarized benchmarkingresults
Aver
age
Err
or
[m]
Room
acc
ura
cy[%
]
Res
ponse
tim
e[m
s]
Ener
gy
effici
ency
[mW
]
Algorithm Mobile Fixed
Particle filter solution
Spray RSSI 6.41 - 59 633 ∼ 105 ∼ 105
Spray ToA 6.66 - 59 620 ∼ 105 ∼ 105
Fingerprinting solution
KL Distance 24.76 - ∼ 24 000 ∼ 7000 ∼ 500
ED Distance 19.08 - ∼ 24 000 ∼ 7000 ∼ 500
PH Distance 8.13 - ∼ 24 000 ∼ 7000 ∼ 500
Hybrid solution
TX Power = 31 17.16 - 15.7 ∼ 57.6 ∼ 47.4

20 T. Van Haute et al.
The results clearly indicate that all tested types of RF-based localization solutions degrade significantly in theseenvironments. All the signals have a lot of reflectionswith the metal construction, causing a lot of multipatheffects. This indicates that accurate indoor localizationin industrial open environments is a difficult task. Inthis industrial environment, the ToA and RSSI basedranging solutions using the particle filter contains thebest results. An average error distance of 6 - 7 m insteadof 11 m for fingerprinting and 17 m for the hybridtechnique.
9 Discussion
Over the course of the performed experiments, severallessons were learned. First of all, the experimentsclearly show the importance of choosing representativemeasurement locations. Several locations have consistentlower accuracy results. For example the hallways (whichare narrow and as such have very low room accuracy).As such, it is clear that the localization points shouldinclude a representative mix of “easy to locate positions”and more challenging ones. Ideally, a fine-grained grid-like approach should be used in which the positioningaccuracy is evaluated every X meter. All experiments inthis paper use the same evaluation points.Another lesson learned is that the location accuracydiffers strongly between different testbeds. Environmentspecifics (such as metal ceilings) strongly influencepropagation behavior. The highest accuracy wasobtained in more “traditional” brick-wall office scenarios,such as represented by the TWIST testbed. The w-iLab.t I testbed, which has plywood walls and metalceilings, has a lower accuracy. Finally, w-iLab.t II testbedconsists of a fully shielded environment, in which thewalls and ceilings are from metal, and contains anumber of metal obstructions. Performing localizationin this testbed, i.e. in a confined and strongly reflectingenvironment, proves to be very challenging.Thirdly, the experiments and benchmarking resultsthat are executed illustrate the need for evaluating abroad set of the metrics. Although the accuracy of thefingerprinting solutions in office environments is shownto be very good, these solutions require significantlymore time to collect beacons for fingerprinting, whichstrongly influences the response delay. Similarly, theWiFi based fingerprinting localization solutions performvery well, but have higher energy requirements than thesolutions using sensor nodes.Moreover, the experiments indicate that the performanceof localization solutions strongly depends on severalalgorithmic and deployment aspects, such as theused technology, the ranging approach, the locationestimation approach, post- and preprocessing, anchorpositions, etc. Making even minor changes to one ofthese aspects can have a profound influence on severalperformance metrics. It was also shown that the internalconfiguration of the algorithms, such as preprocessingthe data (such as removing the 10 % highest and lowest
outliers) or setting the minimum number of beaconsthat is collected for location estimation can significantlyinfluence the performance.As such, to allow objective comparison of localizationsolutions, it is clear that independent evaluationprocedures should be defined by an impartial third partyand that such evaluation procedures should include atleast the following aspects: (i) definition of a wide set ofevaluation metrics, (ii) clear definition of the evaluationenvironments in which the results are valid (iii) anobjective method for generating a representative set ofevaluation points.
10 Conclusion
Although many indoor localization solutions exist, thispaper pointed out that the scientific evaluation methodsand praxis for RF based solutions are currently limitedin scope. Localization solutions are evaluated mainlybased on location accuracy and are evaluated in a singletestbed environment. As a result, it is not clear to whichlevel the results from existing scientific literature can becompared to each other.To evaluate how these different conditions can influencethe localization performance, three localization solutionswere selected that represent typical approaches forindoor localization, including multiple technologies(IEEE 802.11 and IEEE 802.15.4), multiple localizationapproaches (fingerprinting, time-of-arrival and RSSI-based) and multiple processing methods. To allowobjective comparisons, the same evaluation methodologywas used to evaluate the performance of theselocalization solutions in three different environments:an office environment with brick walls, an officeenvironment with plywood walls and an openenvironment with metal walls and metal obstacles.The main conclusion of these experiments were thefollowing.
• Several inherent trade-offs between different metricshave been identified, which are typically ignored whenreporting only on the accuracy of the solutions. Morespecifically, the results show a very clear trade-offbetween the collected number of measurements (whichare directly translated into energy consumption andresponse delay) and the point-level accuracy.
• The accuracy of localization solutions dependsstrongly on the characteristics of the environment.Due to the presence of concrete and/or brick wallsin the office testbeds, different rooms are verydiverse in terms of their wireless characteristics.Localization solutions that exploit this diversity,such as fingerprinting based approaches, obtain thehighest accuracy. In contrast, in more industrial-like open environments time-of-arrival solutionsperformed better. These results show that futurescientific literature describing performance resultsof localization solutions should include detaileddescriptions of the used evaluation environment(s),

Comparability of RF-based Indoor Localization Solutions in Heterogeneous Environments 21
including information such as propagationcharacteristics, typical room sizes and a descriptionof the materials used in walls and ceilings.
• We have shown that the choice of evaluation pointsstrongly influence the reported accuracy. As such,papers that use self-selected evaluation points cansignificantly influence their reported accuracy byartificially selecting those evaluation points thatoutperform other locations.
• Due to testbed constraints, one evaluationenvironment contained evaluation points outside thegrid of anchor points. It was shown that this set-uphad a negative influence on some of the evaluatedsolutions (mainly the RSSI-based and ToA solutions)but not on the fingerprinting solution. As such, whenconsidering which is the best localization solution foran industrial deployment, building layout constraintsshould also be included.
• The accuracy can decrease significantly whenevaluating an environment for which the localizationsolution is not specifically tweaked. For example, alltested solutions suffered from degraded accuracy inthe open industrial-like environment, up to a factor10 lower. Since most existing solutions have beenoptimized for office environments, these results hintthat many existing localization solutions might notbe ready for use in industrial environments or otherchallenging environments, such as underground mines.
The above findings reveal several weaknesses inthe evaluation methods used in the majority ofexisting scientific literature of indoor localizationsolutions. As such, there is a clear need for astandardized evaluation methodology to objectivelycompare different localization solutions in multipleconditions, as developed within the EVARILOS projectand pursued by standardization agencies like ISO.
Acknowledgments
The research leading to these results has receivedfunding from the European Union’s Seventh FrameworkProgram (FP7/2007-2013) under grant agreement no317989 (STREP EVARILOS). The author Filip Lemicwas partially supported by DAAD (German AcademicExchange Service).
References
[1] Bulusu, N.; Heidemann, J.; Estrin, D., GPS-less LowCost Outdoor Localization For Very Small Devices
[2] Hightower, J. and Borriello, G. (2001) ‘Location systemsfor ubiquitous computing’, Computer, Vol. 34, No. 8
[3] Pahlavan, K., Li, X. and Makela, J. (2002) ‘Indoorgeolocation science and technology’, IEEE Commun.Mag., Vol. 40, No. 2, pp.112–118
[4] Liu, H., Darabi, H., Banerjee, P. (2007) ‘Survey ofwireless indoor positioning techniques and systems’,IEEE Transactions on systems, Vol. 37, No. 6
[5] ‘The EVARILOS project’, http://www.evarilos.eu
[6] Van Haute, T., De Poorter, E., Lemic, F., Wirstrom, N.,et al (2013) The EVARILOS Benchmarking Handbook:Evaluation of RF-based Indoor Localization Solutions,MERMAT workshop
[7] Van Haute, T., De Poorter, E., Lemic, F., Wirstrom, N.,et al (2013) D2.1: EVARILOS Benchmarking Handbook,The EVARILOS project
[8] Van Haute, T., De Poorter, E., Lemic, F., Wirstrom,N., et al (2013) D2.2: Report on experiments withoutinterference, The EVARILOS project
[9] Lemic, F., Wirstrom, N., Handziski, V., et al(2013) D2.3: Report on experiments with controlledinterference, The EVARILOS project
[10] ISO Standard - ISO/IEC CD 18305 - Informationtechnology – Real time locating systems – Test andevaluation of localization and tracking systems -http://www.iso.org/iso/home/store/catalogue_
htc/catalogue_detail.htm?csnumber=62090
[11] EvAAL - Evaluating AAL Systems through CompetitiveBenchmarking - http://evaal.aaloa.org/index.
php?option=com_content&view=article&id=187:
technical-annexes-localization2013&catid=15&
Itemid=261
[12] Dezhong Y., Chen Y., Anind K. D., Christian K.,Geyong M., Laurence T. Y., Hai J. (2014) ‘Energyefficient indoor tracking on smartphones’, FutureGeneration Computer Systems 39, pp 44–54
[13] Veljo Otsason, Alex Varshavsky, Anthony LaMarcaand Eyal de Lara, Accurate GSM Indoor Localization,UbiComp 2005: Ubiquitous Computing pp 141–158
[14] Andrew M. Ladd, Kostas E. Bekris, Algis P. Rudys, DanS. Wallach, and Lydia E. Kavraki, On the Feasibility ofUsing Wireless Ethernet for Indoor Localization, IEEETransactions on Robotics and Automation, VOL. 20,NO. 3, JUNE 2004, pp. 555–559
[15] Krishna Chintalapudi, Anand Padmanabha Iyerand Venkata N. Padmanabhan, ‘Indoor LocalizationWithout the Pain’, �Microsoft research
[16] Eladio Martin, Oriol Vinyals, Gerald Friedland andRuzena Bajcsy (2010), Precise Indoor Localization UsingSmart Phone, MM ’10 Proceedings of the internationalconference on Multimedia, pp. 787–790
[17] Sunkyu W., Seongsu J., Esmond M., Linyuan X.,Changsu C., Muwook P., Joon H. (2011) ‘Application ofWiFi-based indoor positioning system for labor trackingat construction sites: A case study in Guangzhou MTR’,Automation in Construction, pp 3–13
[18] Stella M., Russo M., Begusic D. (2014) ‘Fingerprintingbased localization in heterogeneous wireless networks’,Expert Systems with Applications, pp 6738–6747

22 T. Van Haute et al.
[19] Steiner C. and Wittneben A. (2011) ‘Efficient TrainingPhase for Ultrawideband-Based Location FingerprintingSystems’, IEEE Transactions on Signal Processing, vol.59, no. 12, pp 6021–6032
[20] Elson, J. and Romer, K. (2003) ‘Wireless sensornetworks: A new regime for time synchronization’, ACMSIGCOMM CCR, Vol. 33, No. 1, pp.149–154
[21] Mazomenos, E.,De Jager, D., Reeve, J. and White,N. (2011) ‘A two-way time of flight ranging schemefor wireless sensor networks’, European Conference onWireless Sensor Networks (EWSN)
[22] Pettinato, P., Wirstrom, N., Eriksson, J. and VoigtT. (2012) ‘Multi-channel two-way time of flight sensornetwork ranging’, Proceedings of the 9th Europeanconference on Wireless Sensor Networks (EWSN’12),978-3-642-28168-6, pp.163–178
[23] Wirstrom, N., Misra, P. and Voigt, T (2014) ‘Spray:A multi-modal localization system for stationary sensornetwork deployment’, Wireless On-demand NetworkSystems and Services (WONS), 2014 11th AnnualConference on, pp. 25–32
[24] Lemic, F. (2014) Benchmarking of Quantile-basedIndoor Fingerprinting Algorithm, TKN Technical ReportTKN-14-001
[25] Lemic, F., Behboodi, A., Handziski, V., Wolisz, A.(2014) ‘Experimental Decomposition of the Performanceof Fingerprinting-based Localization Algorithms’,International Conference on Indoor Positioning andIndoor Navigation, IPIN’14
[26] Milioris, Dimitris, et al (2011) ‘Low-dimensional Signal-Strength Fingerprint based Positioning in WirelessLANs’, Ad Hoc Networks
[27] Chambers, John M., et al (2006) ‘Monitoring NetworkedApplications with Incremental Quantile Estimation’,Statistical Science 21.4, pp.463–475
[28] Van Haute, T., Rossey, J., Becue, P., De Poorter,E., Moerman, I., Demeester, P. (2014) ‘A hybridindoor localization solution using a generic architecturalframework for sparse distributed wireless sensornetworks’, Federated Conference on Computer Scienceand Information Systems, WSN2014, pp.1015–1021
[29] Handziski, V., Kopke, A., Willig, A., Wolisz, A. (2006)‘TWIST: A Scalable and Reconfigurable Testbed forWireless Indoor Experiments with Sensor Network’,International Workshop on Multi-hop Ad Hoc Networks:from Theory to Reality, RealMAN06
[30] Lemic, F., Busch, J., Chwalisz, M., Handziski,V., Wolisz, A. (2014) ‘Demo Abstract: TestbedInfrastructure for Benchmarking RF-based IndoorLocalization Solutions under Controlled Interference’,European Conference on Wireless Sensor Networks,EWSN’14
[31] Lemic, F., Busch, J., Chwalisz, M., Handziski, V.,Wolisz, A. (2014) ‘Infrastructure for BenchmarkingRF-based Indoor Localization under ControlledInterference’, International Conference on Ubiquitous
Positioning, Indoor Navigation and Location-BasedServices, UPINLBS’14
Tom Van Haute is a doctoral researcher at GhentUniversity. He received his M. Sc. degree (cum laude)in Computer Science Engineering from Ghent University,Belgium, in 2012. In September 2012, he joined theDepartment of Information Technology (INTEC) at GhentUniversity. Within this department, he is working at theInternet Based Communication Networks and Servicesresearch group (IBCN). His research is focused on wirelesssensor networks combined with indoor localization andindoor navigation in particular. Additionally, he is providingguidance to Computer Science Engineering Master thesesand “Informatics” course.
Dr. Eli De Poorter is a postdoctoral researcher at GhentUniversity. He received his master degree in ComputerScience Engineering from Ghent University, Belgium, in2006. He received his Ph.D. degree in 2011 at the Departmentof Information Technology at Ghent University througha Ph.D scholarship from the Institute for Promotion ofInnovation through Science and Technology in Flanders(IWT-Vlaanderen). After obtaining his PhD, he received aFWO postdoctoral research grant and is now a post-doctoralfellow at the same research group, where he is currentlyinvolved in and/or research coordinator of several nationaland international projects. His main research interestsinclude wireless network protocols, network architectures,wireless sensor and ad hoc networks, future internet, self-learning networks and next-generation network architecture.He is part of the program committee of several conferencesand is the author or co-author of more than 50 paperspublished in international journals or in the proceedingsof international conferences. He is also the creator of thepatented IDRA architecture (http://idraproject.net),a flexible communication framework for heterogeneousnetworked devices.
Ingrid Moerman received her degree in ElectricalEngineering (1987) and the Ph.D degree (1992) fromthe Ghent University, where she became a part-timeprofessor in 2000. She is a staff member of the researchgroup on Internet-Based Communication Networks andServices, IBCN (www.ibcn.intec.ugent.be), where she isleading the research on mobile and wireless communicationnetworks. Since 2006 she joined iMinds, where she iscoordinating several interdisciplinary research projects.Her main research interests include: Sensor Networks,Cooperative and Cognitive Networks, Wireless Access, Self-Organizing Distributed Networks (Internet of Things) andExperimentally-supported research. Ingrid Moerman has alongstanding experience in running national and EU researchfunded projects. At the European level, Ingrid Moerman isin particular very active in the FP7 FIRE (Future InternetResearch and Experimentation) research area, where she iscoordinating the CREW project and further participatingin IP Fed4FIRE, STREP EVARILOS, STREP FORGE andIP FLEX. In the FP7 research area on Future Networks,she is involved in IP LEXNET and STREP SEMAFOUR.Ingrid Moerman is author or co-author of more than600 publications in international journals or conferenceproceedings. She is associate editor of the EURASIP Journalon Wireless Communications and Networking and vice-

Comparability of RF-based Indoor Localization Solutions in Heterogeneous Environments 23
president of the expert panel on Informatics and KnowledgeTechnology of the Research Foundation Flanders (FWO).
Filip Lemic is a junior researcher and a PhD candidate atthe Telecommunication Networks Group at the TechnicalUniversity of Berlin. He finished his bachelor and masterstudies at the Faculty of Electrical Engineering andComputing at the University of Zagreb. His main scientificinterests are in context awareness, with an emphasis on theindoor localization.
Dr.-Ing. Vlado Handziski is a senior researcher in theTelecommunication Networks Group at the TechnischeUniversitat Berlin, where he coordinates the activitiesin the areas of sensor networks, cyber-physical systemsand internet of things. He is currently also serving asinterim professor at the chair for Embedded Systems atTechnische Universitat Dresden. He received his doctoraldegree in Electrical Engineering from TU Berlin (summacum laude, 2011) and his M.Sc. degree from Ss. Cyril andMethodius University in Skopje (2002). Dr. Handziski’sresearch interests are mainly focused on testing and softwarearchitecture aspects of networked embedded systems. Hehas participated and led testbed infrastructure activitiesin several large European research projects like EmbeddedWiSeNts, CONET, EVARILOS and EIT ICT Labs. He iscore developer of TinyOS, a popular operating systems forsensor networks, and chief architect of the TWIST testbed.At TU Berlin, he teaches the master-level courses on“Ad Hocand Sensor Networks” and “Networked Embedded Systems”and he teaches the undergraduate course “Informatics 1” atTU Dresden. Dr. Handziski is member of IEEE and ACM.
Adam Wolisz received his degrees (Diploma 1972, Ph.D.1976, Habil. 1983) from Silesian University of Technology,Gliwice, Poland. He joined TU-Berlin in 1993, where heis a chaired professor in telecommunication networks andexecutive director of the Institute for TelecommunicationSystems. He is also an adjunct professor at the Departmentof Electrical Engineering and Computer Science, Universityof California, Berkeley. His research interests are inarchitectures and protocols of communication networks.Recently he has been focusing mainly on wireless/mobilenetworking and sensor networks.
Niklas Wirstrom is a researcher in the NetworkedEmbedded Systems (NES) group at SICS and a PhD studentat Uppsala Universitet, Sweden. His research focus is onMachine Learning techniques for localization in WSN andother resource constrained systems.
Thiemo Voigt is professor at Uppsala University. He alsoleads the Networked Embedded Systems group at SICSSwedish ICT. His main interests are networking and systemissues in wireless sensor networks and the Internet of Things.He has published papers at flagship sensor networkingconferences such as ACM SenSys and IEEE/ACM IPSN andreceived awards for several of these publications. He has alsobeen TPC co-chair for IEEE/ACM IPSN and EWSN, theEuropean Conference on Wireless Sensor Networks as wellas track chair for IEEE DCOSS, IEEE MASS and IEEEICDCS. He is on the editorial board for the ACM Transactionon Sensor Networks and the IEEE IoT Newsletter.