
Company Update: FPI
8
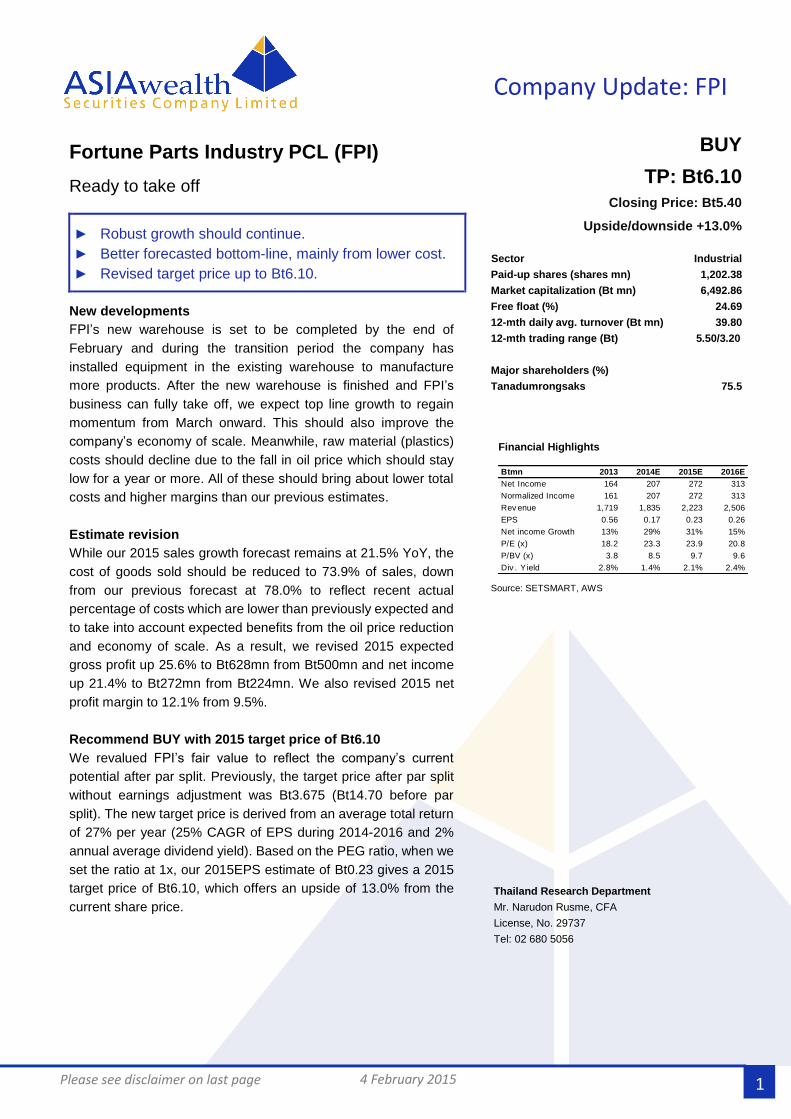
4 February 2015 Company Update: FPI 1 Please see disclaimer on last page Fortune Parts Industry PCL (FPI) Ready to take off ► Robust growth should continue. ► Better forecasted bottom-line, mainly from lower cost. ► Revised target price up to Bt6.10. New developments FPI’s new warehouse is set to be completed by the end of February and during the transition period the company has installed equipment in the existing warehouse to manufacture more products. After the new warehouse is finished and FPI’s business can fully take off, we expect top line growth to regain momentum from March onward. This should also improve the company’s economy of scale. Meanwhile, raw material (plastics) costs should decline due to the fall in oil price which should stay low for a year or more. All of these should bring about lower total costs and higher margins than our previous estimates. Estimate revision While our 2015 sales growth forecast remains at 21.5% YoY, the cost of goods sold should be reduced to 73.9% of sales, down from our previous forecast at 78.0% to reflect recent actual percentage of costs which are lower than previously expected and to take into account expected benefits from the oil price reduction and economy of scale. As a result, we revised 2015 expected gross profit up 25.6% to Bt628mn from Bt500mn and net income up 21.4% to Bt272mn from Bt224mn. We also revised 2015 net profit margin to 12.1% from 9.5%. Recommend BUY with 2015 target price of Bt6.10 We revalued FPI’s fair value to reflect the company’s current potential after par split. Previously, the target price after par split without earnings adjustment was Bt3.675 (Bt14.70 before par split). The new target price is derived from an average total return of 27% per year (25% CAGR of EPS during 2014-2016 and 2% annual average dividend yield). Based on the PEG ratio, when we set the ratio at 1x, our 2015EPS estimate of Bt0.23 gives a 2015 target price of Bt6.10, which offers an upside of 13.0% from the current share price. BUY TP: Bt6.10 Closing Price: Bt5.40 Upside/downside +13.0% Sector Industrial Paid-up shares (shares mn) 1,202.38 Market capitalization (Bt mn) 6,492.86 Free float (%) 24.69 12-mth daily avg. turnover (Bt mn) 39.80 12-mth trading range (Bt) 5.50/3.20 Major shareholders (%) Tanadumrongsaks 75.5 Financial Highlights Source: SETSMART, AWS Thailand Research Department Mr. Narudon Rusme, CFA License, No. 29737 Tel: 02 680 5056 Btmn 2013 2014E 2015E 2016E Net Income 164 207 272 313 Normalized Income 161 207 272 313 Rev enue 1,719 1,835 2,223 2,506 EPS 0.56 0.17 0.23 0.26 Net income Growth 13% 29% 31% 15% P/E (x) 18.2 23.3 23.9 20.8 P/BV (x) 3.8 8.5 9.7 9.6 Div. Yield 2.8% 1.4% 2.1% 2.4%
Transcript of Company Update: FPI
4 February 2015
Company Update: FPI
1
Please see disclaimer on last page
Fortune Parts Industry PCL (FPI)
Ready to take off
► Robust growth should continue.
► Better forecasted bottom-line, mainly from lower cost.
► Revised target price up to Bt6.10.
New developments
FPI’s new warehouse is set to be completed by the end of
February and during the transition period the company has
installed equipment in the existing warehouse to manufacture
more products. After the new warehouse is finished and FPI’s
business can fully take off, we expect top line growth to regain
momentum from March onward. This should also improve the
company’s economy of scale. Meanwhile, raw material (plastics)
costs should decline due to the fall in oil price which should stay
low for a year or more. All of these should bring about lower total
costs and higher margins than our previous estimates.
Estimate revision
While our 2015 sales growth forecast remains at 21.5% YoY, the
cost of goods sold should be reduced to 73.9% of sales, down
from our previous forecast at 78.0% to reflect recent actual
percentage of costs which are lower than previously expected and
to take into account expected benefits from the oil price reduction
and economy of scale. As a result, we revised 2015 expected
gross profit up 25.6% to Bt628mn from Bt500mn and net income
up 21.4% to Bt272mn from Bt224mn. We also revised 2015 net
profit margin to 12.1% from 9.5%.
Recommend BUY with 2015 target price of Bt6.10
We revalued FPI’s fair value to reflect the company’s current
potential after par split. Previously, the target price after par split
without earnings adjustment was Bt3.675 (Bt14.70 before par
split). The new target price is derived from an average total return
of 27% per year (25% CAGR of EPS during 2014-2016 and 2%
annual average dividend yield). Based on the PEG ratio, when we
set the ratio at 1x, our 2015EPS estimate of Bt0.23 gives a 2015
target price of Bt6.10, which offers an upside of 13.0% from the
current share price.
BUY
TP: Bt6.10
Closing Price: Bt5.40 Upside/downside +13.0%
Sector Industrial
Paid-up shares (shares mn) 1,202.38
Market capitalization (Bt mn) 6,492.86
Free float (%) 24.69
12-mth daily avg. turnover (Bt mn) 39.80
12-mth trading range (Bt) 5.50/3.20
Major shareholders (%)
Tanadumrongsaks 75.5
Financial Highlights
Source: SETSMART, AWS
Thailand Research Department
Mr. Narudon Rusme, CFA
License, No. 29737
Tel: 02 680 5056
Btmn 2013 2014E 2015E 2016E
Net Income 164 207 272 313
Normalized Income 161 207 272 313
Rev enue 1,719 1,835 2,223 2,506
EPS 0.56 0.17 0.23 0.26
Net income Growth 13% 29% 31% 15%
P/E (x) 18.2 23.3 23.9 20.8
P/BV (x) 3.8 8.5 9.7 9.6
Div . Y ield 2.8% 1.4% 2.1% 2.4%

4 February 2015
Company Update: FPI
2
Please see disclaimer on last page
Estimate revision
Our 2015 sales growth forecast remains at 21.5% YoY. We anticipate sales of
Bt2.18bn, down slightly from our previous forecast of Bt2.28bn due to a lower sales
forecast for 2014 based on actual 9-month data. What is more important is that the
cost of goods sold should decline to 73.9% of total revenue, which is revised down
from our previous forecast of 78.0% to reflect recent actual percentage of costs,
which have been lower than expected, and to take into account expected benefits
from the fall in oil price and improved economy of scale. FPI’s 2015 COGS would
decrease to Bt1.61bn from Bt1.77bn. As a result, 2015 expected gross profit was
revised up 25.6% to Bt628mn, from Bt500mn, and expected net income was
adjusted up 21.4% to Bt272mn, from Bt224mn. We also revised 2015 net profit
margin to 12.1% from 9.5%.
Robust growth should continue
Warehouse is crucial.
FPI’s new warehouse will be completed by the end of February. This is crucial since
the company’s strength is in the variety of goods available on its shelves and speed
of delivery. Its position as a one-stop service with the fastest delivery will be
supported by the adequate space in its warehouse. Therefore, we expect FPI’s top
line growth to regain momentum from March onward. Its bottom line should show
even more improvement thanks to innovation and branding as well as higher
capacity utilization that will widen its profit margin.
First step in expanding its production base abroad
FPI has diversified its trading portfolio of clients. The company expanded its business
to China, India, Turkey, Italy, Ecuador, Mexico, Brazil, US, North Africa and South
Africa.
Since logistic costs to some areas are quite high, the company is establishing joint
ventures to manufacture products in the destination countries, starting with Ecuador,
where it has a 45% stake in a joint venture. This will have several benefits:
1) Profit from sale of molds
2) Logistic cost savings.
3) Profit margin from sale of goods.
4 February 2015
Company Update: FPI
3
Please see disclaimer on last page
There are clients in other countries that have expressed interest in establishing joint
ventures similar to Ecuador. FPI sees the project in Ecuador as a pilot project since
it has never expanded manufacturing abroad. If it is successful, there will be a
significant number of other projects like it. The company also benefits from the fact
that Ecuador has free trade agreements with Columbia, Peru and Bolivia, so it can
use this Ecuadorian production base for all of these countries. FPI plans to establish
3-5 new production bases in five years.
Benefits from downtrend in fuel prices and recovery in global economy
A consequence of falling oil prices should be an increase in the use of vehicles,
which in turn should result in an increase in car maintenance and repairs leading to
demand for automotive parts, including those produced by FPI. In the longer term,
if the global economy recovers, it will encourage more demand.
Falling oil prices would not only benefit FPI on the demand side, it would also benefit
the company on the supply side. FPI’s raw materials consist of some plastics,
especially ABS (Acrylonitrile Butadiene Styrene) used to produce grilles and
headlight covers which are its key products (30% of total sales for 9M14). The price
of ABS is highly correlated to the price of oil, so the sharp drop in oil price will lead
to a lower cost ratio, meaning higher margin, which will improve the company’s
bottom line. FPI’s other key product, plastic bumpers, should not benefit as much
since the company uses off-grade polypropylene (PP) and it has a fixed price
agreement with its supplier. However, the margin on its bumpers should improve
from an increase in utilization leading to economy of scale.
First mover to niche markets
FPI loves to be the first to produce plastic automotive parts for new car models or
products that other players rarely provide, saying apparent excess demand in those
markets. How can FPI know? There is no need to invest heavily on marketing
research since FPI has key partners and sells its products in 134 countries
worldwide. The partners or clients will tell which type of goods are lacking in each
market and they want to import.

4 February 2015
Company Update: FPI
4
Please see disclaimer on last page
Re-emphasize advantages
A complete one-stop hypermarket for automotive businesses
Unlike traditional manufacturers, FPI not only produces its products, it also sells
trading goods and has 60,000-70,000 goods for customers to choose from. It can
be considered a complete one-stop hypermarket for auto-part downstream
businesses.
FPI has a strong network of suppliers with 500-600 auto-part manufacturer allies
since it has a director seat in the Thai Auto-Parts Manufacturers Association. Its
allies also benefit because they have better distribution channels, especially in the
global market where they have no experience. This connection allows FPI to have
more interesting goods on its shelves for its trading business.
Save on logistic costs and widen margin
Logistic costs are one of the key factors to enhance margin. FPI can save on logistic
costs (freight cost and other transportation-related costs) by operating its trading
business. Its logistic costs are primarily on a per-container basis and some of its
products (e.g. bumpers) are quite bulky, so their value per container is low, saying a
higher logistic cost as a percentage of sales. For example, if the logistic cost to some
countries is US$7,000, for bulky goods, the value of goods can amount to US$15,000
or 47% logistic cost. For other goods that are smaller but more expensive loading in
one container, the value per container can be as much as US$70,000 or down to
10%. Fortunately most foreign importers want a variety of goods rather than just one
product so all the space of a container can be utilized.
Focusing on higher margin business
FPI is positioning itself with brand and design aka “marketing firm”. It trades goods
under the name FPI. As customers believe in FPI’s brand and reputation which has
been built over many years, they feel comfortable in dealing with the company as a
one-stop contact point rather than taking the risk of dealing with each unfamiliar
manufacturer.
Provides one of the fastest deliveries in the world
The company’s lead time to delivery is only about 3 days, one of the fastest in the
world (40 days for China and 21-30 days for Taiwan and Malaysia) because of the
better storage capability from its spacious warehouses. This is why the company is
confident in its claim that it has the fastest average lead time.

4 February 2015
Company Update: FPI
5
Please see disclaimer on last page
Recommend BUY with 2015 target price of Bt6.10
We revalued FPI’s fair value to reflect the company’s current potential after par split.
Previously, the target price after par split without earnings adjustment was Bt3.675
(Bt14.70 before par split). The new target price is derived from an average total
return of 27% per year (25% CAGR of EPS during 2014-2016 and 2% annual
average dividend yield). Based on the PEG ratio, when we set the ratio at 1x, our
2015EPS estimate of Bt0.23 gives a 2015 target price of Bt6.10, which offers an
upside of 13.0% from the current share price.

4 February 2015
Company Update: FPI
6
Please see disclaimer on last page
Financial summary
Key Financial Ratios 2013 2014E 2015E 2016E
Sales Growth (%) 11.9% 7.8% 21.5% 13.0% Net Income Growth (%) 13.0% 28.8% 31.4% 14.9% EBITDA Margin (%) 7.9% 16.3% 19.2% 10.9% Net Profit Margin (%) 9.4% 11.3% 12.1% 12.2% Effective tax rate (%) 19.5% 20.0% 20.0% 20.0% ROA (%) 8.9% 10.3% 11.8% 12.1% ROE (%) 23.4% 24.4% 27.7% 27.4% Net Debt to Equity (x) 1.63 1.38 1.35 1.27 EPS (Bt) 0.55 0.17 0.23 0.26 BVPS (Bt) 0.61 0.73 0.74 0.79 DPS (Bt) 0.28 0.08 0.11 0.13 Net Dividend Payout Ratio 51.4% 45.0% 50.0% 50.0% P/E (x) 16.1 23.3 23.9 20.8 P/BV (x) 3.8 8.5 9.7 9.6 EV/EBITDA (x) 10.4 16.7 14.2 13.0 Div. Yield (%) 2.8% 1.4% 2.1% 2.4%
Income Statement
Unit: Btmn 2013 2014E 2015E 2016E
Sales 1,649 1,777 2,179 2,490 COGS 1,305 1,342 1,609 1,839 Gross Profit 344 435 570 651 SG&A 173 197 243 274 EBITDA 389 453 539 598 Tax 40 52 68 78 Interest Expenses 43 44 45 46 Net Income 164 207 272 313
EPS (Bt) 0.55 0.17 0.23 0.26
Balance Sheet
Unit: Btmn 2013 2014E 2015E 2016E
Cash 48 54 68 79 Account Receivable 528 586 669 756 Inventory 360 460 604 726 Total Current Assets 1,017 1,180 1,438 1,671 Net PP&E 752 783 809 847 Total Non-Current Assets 793 836 873 919 Total Assets 1,810 2,016 2,310 2,591
Short-Term Borrowings 618 622 691 732 Account Payable 258 284 345 390 Total Current Liabilities 1,011 1,058 1,215 1,324 Long-Term Borrowings 107 107 108 122 Total Non-Current Liabilities 111 110 112 127 Total Liabilities 1,122 1,169 1,327 1,451
Paid-up Capital 295 301 301 301 Capital Surplus 151 192 192 192 Retained Earnings 241 355 491 647 Total Equity 687 847 983 1,140
Total Liabilities and Equity 1,810 2,016 2,310 2,591
4 February 2015
CG Report
7
Please see disclaimer on last page
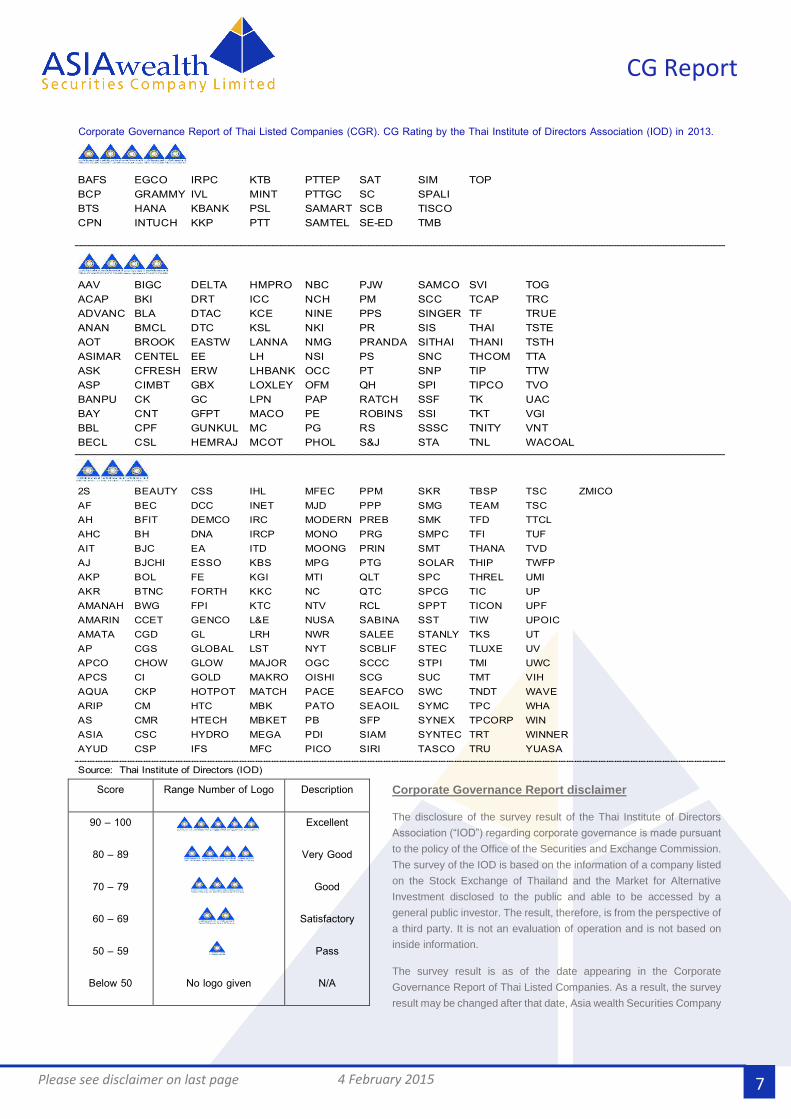
Corporate Governance Report of Thai Listed Companies (CGR). CG Rating by the Thai Institute of Directors Association (IOD) in 2013.
Corporate Governance Report disclaimer
The disclosure of the survey result of the Thai Institute of Directors
Association (“IOD”) regarding corporate governance is made pursuant
to the policy of the Office of the Securities and Exchange Commission.
The survey of the IOD is based on the information of a company listed
on the Stock Exchange of Thailand and the Market for Alternative
Investment disclosed to the public and able to be accessed by a
general public investor. The result, therefore, is from the perspective of
a third party. It is not an evaluation of operation and is not based on
inside information.
The survey result is as of the date appearing in the Corporate
Governance Report of Thai Listed Companies. As a result, the survey
result may be changed after that date, Asia wealth Securities Company
Limited does not conform nor certify the accuracy of such survey result.
Score Range Number of Logo Description
90 – 100
80 – 89
70 – 79
60 – 69
50 – 59
Below 50
No logo given
Excellent
Very Good
Good
Satisfactory
Pass
N/A
BAFS EGCO IRPC KTB PTTEP SAT SIM TOPBCP GRAMMY IVL MINT PTTGC SC SPALIBTS HANA KBANK PSL SAMART SCB TISCOCPN INTUCH KKP PTT SAMTEL SE-ED TMB
AAV BIGC DELTA HMPRO NBC PJW SAMCO SVI TOGACAP BKI DRT ICC NCH PM SCC TCAP TRCADVANC BLA DTAC KCE NINE PPS SINGER TF TRUEANAN BMCL DTC KSL NKI PR SIS THAI TSTEAOT BROOK EASTW LANNA NMG PRANDA SITHAI THANI TSTHASIMAR CENTEL EE LH NSI PS SNC THCOM TTAASK CFRESH ERW LHBANK OCC PT SNP TIP TTWASP CIMBT GBX LOXLEY OFM QH SPI TIPCO TVOBANPU CK GC LPN PAP RATCH SSF TK UACBAY CNT GFPT MACO PE ROBINS SSI TKT VGIBBL CPF GUNKUL MC PG RS SSSC TNITY VNTBECL CSL HEMRAJ MCOT PHOL S&J STA TNL WACOAL
2S BEAUTY CSS IHL MFEC PPM SKR TBSP TSC ZMICOAF BEC DCC INET MJD PPP SMG TEAM TSCAH BFIT DEMCO IRC MODERN PREB SMK TFD TTCLAHC BH DNA IRCP MONO PRG SMPC TFI TUFAIT BJC EA ITD MOONG PRIN SMT THANA TVDAJ BJCHI ESSO KBS MPG PTG SOLAR THIP TWFPAKP BOL FE KGI MTI QLT SPC THREL UMIAKR BTNC FORTH KKC NC QTC SPCG TIC UPAMANAH BWG FPI KTC NTV RCL SPPT TICON UPFAMARIN CCET GENCO L&E NUSA SABINA SST TIW UPOICAMATA CGD GL LRH NWR SALEE STANLY TKS UTAP CGS GLOBAL LST NYT SCBLIF STEC TLUXE UVAPCO CHOW GLOW MAJOR OGC SCCC STPI TMI UWCAPCS CI GOLD MAKRO OISHI SCG SUC TMT VIHAQUA CKP HOTPOT MATCH PACE SEAFCO SWC TNDT WAVEARIP CM HTC MBK PATO SEAOIL SYMC TPC WHAAS CMR HTECH MBKET PB SFP SYNEX TPCORP WINASIA CSC HYDRO MEGA PDI SIAM SYNTEC TRT WINNERAYUD CSP IFS MFC PICO SIRI TASCO TRU YUASA
Source: Thai Institute of Directors (IOD)
4 February 2015
Contact
8
Please see disclaimer on last page
This report has been prepared by Asia Wealth Securities Company Limited (“AWS”). The information herein has been obtained from sources believed to be reliable and accurate, but AWS makes no representation as to the accuracy and completeness of such information. AWS does not accept any liability for any loss or damage of any kind arising out of the use of such information or opinions in this report. Before making your own independent decision to invest or enter into transaction, investors should study this report carefully and should review information relating. All rights are reserved. This report may not be reproduced, distributed or published by any person in any manner for any purpose without permission of AWS. Investment in securities has risks. Investors are advised to consider carefully before making decisions.
Branch Address Phone Fax
Head Office 540 Floor 7,14,17 , Mercury Tower, Ploenchit Road, Lumphini,
Pathumwan Bangkok 10330
02-680-5000 02-680-5111
Silom 191 Silom Complex Building,21st Floor Room 2,3-1 Silom Rd.,
Silom, Bangrak, Bangkok, 10500 Thailand
02-630-3500 02-630-3530-1
Asok 159 Sermmitr Tower, 17th FL. Room No.1703, Sukhumvit 21
Road, Klong Toey Nua, Wattana, Bangkok 10110
02-261-1314-21 02-261-1328
Pinklao
7/3 Central Plaza Pinklao Office Building Tower B, 16th Flr., Room
No.1605-1606 Baromrajachonnanee Road, Arunamarin,
Bangkoknoi, Bangkok 10700
02-884-7333 02-884-7357,
02-884-7367
Chaengwattana
99/99 Moo 2 Central Plaza Chaengwattana Office Tower, 22nd Flr.,
Room 2204 Chaengwattana Road, Bang Talad, Pakkred,
Nonthaburi 11120
02-119-2300 02-8353014
Chaengwattana 2
9/99 Moo 2 Central Plaza Chaengwattana Office Tower, 22nd Flr.,
Room 2203 Chaengwattana Road, Bang Talad, Pakkred,
Nonthaburi 11120
02-119-2388 02-119-2399
Mega Bangna 39 Moo6 Megabangna, 1st Flr., Room 1632/7 Bangna-Trad Road,
Bangkaew Bangplee, Samutprakarn 10540
02-106-7345 02-105-2070
Rayong 356/18 Sukhumvit Road, Nuen-Phra Sub District, Muang District,
Rayong Province 21000
038-808200 038-807200
Khonkaen 26/9 Srijanmai Road, Tamboonnaimuang, Khon Khaen
40000
043-334-700 043-334-799
Chonburi 44 Vachiraprakarn Road, Bangplasoi, Muang Chonburi, Chonburi
20000
038-274-533 038-275-168
Chaseongsao 233-233/2 Moo2 1st Flr., Sukprayoon Road, Na Meung Sub-
District, Meung District, Chachoengsao 24000
038-981-587 038-981-591


![Investor Update [Company Update]](https://static.fdocuments.in/doc/165x107/577c7caa1a28abe0549b8763/investor-update-company-update-578043b3b5bc3.jpg)


![Earnings Update [Company Update]](https://static.fdocuments.in/doc/165x107/577c7f491a28abe054a3eab4/earnings-update-company-update.jpg)
![Performance Update [Company Update]](https://static.fdocuments.in/doc/165x107/577c7c411a28abe05499ee66/performance-update-company-update.jpg)