Company Information - Financials
32
Transcript of Company Information - Financials


LEGAL ADVISORSOrr Dignam & CoAdvocates,3-A, Street 32, Sector F-8/1,Islamabad, Pakistan
AUDITORSKPMG Taseer Hadi & CoChartered Accountants6th Floor, State Life Building,Jinnah Avenue, Islamabad.
SHARES REGISTRAR Corplink (Pvt) LimitedWings Arcade, 1-K, Commercial, Model Town, Lahore.Tel: (042) 35839182, 35887262 Fax: (042) 35869037
Company InformationDIRECTORS• LtGenKhalidNawazKhan,HI(M),Sitara-i-Esar,(Retd)
Chairman
• LtGenMuhammadHaroonAslam,HI(M),SBt,(Retd)Chief Executive & Managing Director
• LtGenShafqaatAhmed,HI(M),(Retd)
• MrQaiserJaved
• DrNadeemInayat
• MajGenSyedJamalShahid,HI(M),(Retd)
• MajGenNasirMahmood,HI(M),(Retd)
• MajGenMuhammadFarooqIqbal,HI(M),(Retd)
• BrigMuhammadSaeedKhan,(Retd)
• MrNavedA.Khan
• MrNasierA.Sheikh
• DrRashidBajwa
COMPANY SECRETARYBrigMuhammadAzam,SI(M),(Retd)
CFOSyedAamirAhsan
REGISTERED OFFICE73 Harley Street, Rawalpindi, PakistanTel: (051) 9272196-97, 9270923Fax: (051) 9272198-9E-mail: [email protected]: http://www.ffbl.com
PLANTSITEBin Qasim, Karachi, Pakistan

Directors’ ReviewFor the Quarter Ended March 31, 2015
The Board of Directors is pleased to present a brief overview of the operational and financial performance of the Company for the first quarter ended March 31, 2015.
By the grace of Almighty, the overall performance of the plants remained satisfactory during the period. Gas curtailment continued and affected the overall production of Ammonia, Urea and DAP in terms of installed capacity. However some improvement in gas curtailment was observed during the quarter. The average curtailment was 46% as compared with 54% in corresponding period. Ammonia, Urea and DAP plants remained closed for 40, 76 and 30 days respectively. Production of Ammonia at 39 thousand tonnes, DAP at 142 thousand tonnes was higher by 8% and 43% respectively, whereas Urea at 16 thousand tonnes was lower by 27% comparing with the corresponding period.
FFBL Urea (G) sales during Jan-Mar 2015 were 15 thousand tonnes, showing a decrease of 29% as compared to 21 thousand tonnes sales of corresponding period of 2014 due to low production. Sona DAP sales during the period were 85 thousand tonnes, 5% lower than 90 thousand tonnes sales of Jan-Mar 2014.
Urea industry sales during Jan-Mar 2015 are estimated at 1,504 thousand tonnes showing an increase of 6% as compared to 1,415 thousand tonnes sales during the same period of 2014. DAP industry sales during Jan-Mar 2015 are estimated at 179 thousand tonnes, 12% lower than 204 thousand tonnes sales of 2014. Urea imports during Jan-Mar 2015 were 223 thousand tonnes which are lower than the imports of 304 thousand tonnes during Jan-Mar 2014.
During Jan-Mar 2015 FFBL share in Urea and DAP market is estimated to be 1% and 48% respectively.
FFBL’s financial results for the first quarter 2015 have shown a gross profit of Rs. 710 million lower by 14% as compared with corresponding period. The main reasons are low production due to gas curtailment and increase in Gas Infrastructure Development Cess (GIDC) on fuel gas from Rs.100 per MMBTU to Rs.150 per MMBTU, which FFBL did not pass on to its customers.
Financial charges have been increased significantly due to utilization of long term loans. Other income mainly includes dividend from Askari Bank Limited and Fauji Cement Company Limited. Net profit after tax, as a result of the above stated factors stood at Rs. 98 million, decreased by Rs. 88 million against the corresponding period. Company’s earnings per share at March 31, 2015 stood at Rs. 0.11 against Rs. 0.20 in the corresponding period.
The overall PMP plant performance remained satisfactory for the year 2014. PMP produced 403 thousand tonnes of P2O5 out of which 323 thousand tonnes was exported to FFBL. PMP reported a net profit of MAD 65 million for the year ended December 31, 2014.
Consistent gas supply is still a challenge for fertilizer sector in the days to come. FFBL is in close coordination with Ministry of Petroleum and SSGCL for improvement of gas supply in the context of growing fertilizer demand in the country. We are optimistic that going forward we will have InshaAllah better gas supply and will cover up some of the lost production.
Rawalpindi27 April 2015
For and on behalf of the Board
Lt Gen Khalid Nawaz Khan, HI(M), Sitara-i-Esar, (Retd)Chairman


CONDENSED INTERIM BALANCE SHEETAS AT MARCH 31, 2015
Un - auditedMarch 31,
2015
AuditedDecember 31,
2014Note (Rupees ‘000)
EQUITY AND LIABILITIES
ISSUED SHARE CAPITAL AND RESERVESShare capital 9,341,100 9,341,100 Capital reserve 228,350 228,350 Accumulated profit 1,498,561 3,502,187
11,068,011 13,071,637 NON-CURRENT LIABILITIES
Long term loans 5 8,500,000 10,000,000 Deferred liabilities 7 3,200,616 3,276,805
11,700,616 13,276,805 CURRENT LIABILITIES
Trade and other payables 14,491,794 13,860,083 Mark - up accrued 256,165 233,141 Short term borrowings 8,253,599 3,087,407 Current portion of long term loans 5 1,500,000 - Current portion of deferred Government assistance 6 1,944,600 1,944,600 Provision for income tax - net 269,439 775,158
26,715,597 19,900,389
49,484,224 46,248,831
CONTINGENCIES AND COMMITMENTS 8
The annexed notes 1 to 14 form an integral part of this condensed interim financial information.

CHAIRMAN CHIEF EXECUTIVE DIRECTOR
Un - auditedMarch 31,
2015
AuditedDecember 31,
2014Note (Rupees ‘000)
ASSETS
NON-CURRENT ASSETS Property, plant and equipment 9 11,932,958 12,202,673 Long term investments 10 14,759,226 12,130,788 Long term deposits 78,643 78,643
26,770,827 24,412,104 CURRENT ASSETS
Stores and spares 2,276,137 2,337,205 Stock in trade 4,692,624 1,557,296 Trade debts 710,538 1,466,063 Advances 870,187 880,687 Trade deposits and short term prepayments 130,471 28,097 Interest accrued 26,962 17,633 Other receivables 1,228,119 514,226 Sales tax refundable 1,095,806 760,734 Short term investments 7,367,006 9,230,117 Cash and bank balances 4,315,547 5,044,669
22,713,397 21,836,727
49,484,224 46,248,831

CONDENSED INTERIM PROFIT AND LOSS ACCOUNT (UN-AUDITED)FOR THE QUARTER ENDED MARCH 31, 2015
CHAIRMAN CHIEF EXECUTIVE DIRECTOR
2015 2014 Note (Rupees ‘000)
Sales - net 5,798,941 6,040,576 Cost of sales 11 (5,088,508) (5,210,549)Gross profit 710,433 830,027 Selling and distribution expenses (492,113) (449,515)Administrative expenses (274,783) (262,766)
(56,463) 117,746 Finance costs (421,117) (42,139)Other operating expenses (4,973) (20,519)
(482,553) 55,088 Other income 569,908 186,618
Profit before taxation 87,355 241,706 Taxation 10,767 (55,391)Profit after taxation 98,122 186,315
Earnings per share - basic and diluted (Rupees) 0.11 0.20
The annexed notes 1 to 14 form an integral part of this condensed interim financial information.

CONDENSED INTERIM STATEMENT OF COMPREHENSIVE INCOME (UN-AUDITED)FOR THE QUARTER ENDED MARCH 31, 2015
CHAIRMAN CHIEF EXECUTIVE DIRECTOR
2015 2014 (Rupees ‘000)
Profit after taxation 98,122 186,315
Other comprehensive income - -
Total comprehensive income 98,122 186,315
The annexed notes 1 to 14 form an integral part of this condensed interim financial information.
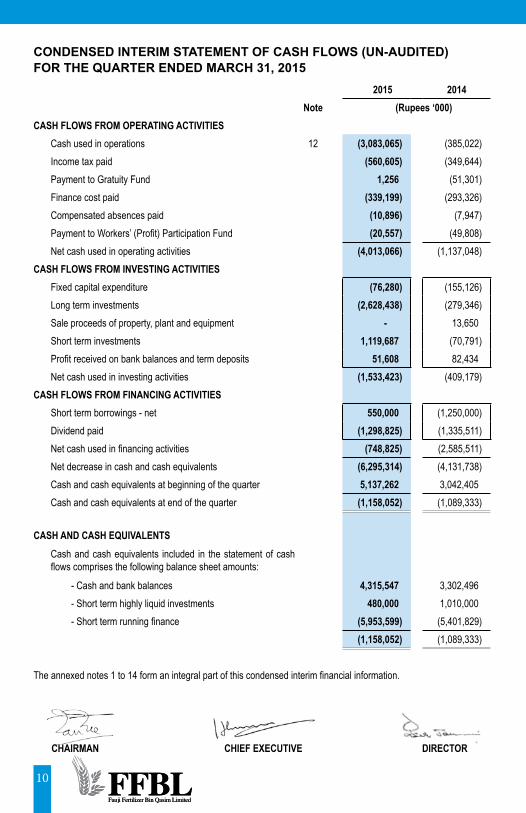
CONDENSED INTERIM STATEMENT OF CASH FLOWS (UN-AUDITED)FOR THE QUARTER ENDED MARCH 31, 2015
2015 2014Note (Rupees ‘000)
CASH FLOWS FROM OPERATING ACTIVITIESCash used in operations 12 (3,083,065) (385,022)Income tax paid (560,605) (349,644)Payment to Gratuity Fund 1,256 (51,301)Finance cost paid (339,199) (293,326)Compensated absences paid (10,896) (7,947)Payment to Workers’ (Profit) Participation Fund (20,557) (49,808)Net cash used in operating activities (4,013,066) (1,137,048)
CASH FLOWS FROM INVESTING ACTIVITIESFixed capital expenditure (76,280) (155,126)Long term investments (2,628,438) (279,346)Sale proceeds of property, plant and equipment - 13,650 Short term investments 1,119,687 (70,791)Profit received on bank balances and term deposits 51,608 82,434 Net cash used in investing activities (1,533,423) (409,179)
CASH FLOWS FROM FINANCING ACTIVITIESShort term borrowings - net 550,000 (1,250,000)Dividend paid (1,298,825) (1,335,511)Net cash used in financing activities (748,825) (2,585,511)Net decrease in cash and cash equivalents (6,295,314) (4,131,738)Cash and cash equivalents at beginning of the quarter 5,137,262 3,042,405 Cash and cash equivalents at end of the quarter (1,158,052) (1,089,333)
CASH AND CASH EQUIVALENTSCash and cash equivalents included in the statement of cash flows comprises the following balance sheet amounts:
- Cash and bank balances 4,315,547 3,302,496 - Short term highly liquid investments 480,000 1,010,000 - Short term running finance (5,953,599) (5,401,829)
(1,158,052) (1,089,333)
The annexed notes 1 to 14 form an integral part of this condensed interim financial information.
CHAIRMAN CHIEF EXECUTIVE DIRECTOR

CONDENSED INTERIM STATEMENT OF CHANGES IN EQUITY (UN-AUDITED)FOR THE QUARTER ENDED MARCH 31, 2015
Share capital
Capital reserve
Accumulated profit
Total
( R u p e e s ‘ 0 0 0 ) Balance as at January 01, 2014 9,341,100 228,350 3,273,456 12,842,906 Total comprehensive income Profit for the period after taxation - - 186,315 186,315 Other comprehensive income for the period - - - - Total comprehensive income for the period - - 186,315 186,315
Transactions with owners, recorded directly in equity
Distributions to owners Final dividend 2013 (Rs. 2.25 per ordinary share) - - (2,101,748) (2,101,748) Total transactions with owners - - (2,101,748) (2,101,748) Balance as at March 31, 2014 9,341,100 228,350 1,358,023 10,927,473
Balance as at January 01, 2015 9,341,100 228,350 3,502,187 13,071,637 Total comprehensive income Profit for the period after taxation - - 98,122 98,122 Other comprehensive income for the period - - - - Total comprehensive income for the period - - 98,122 98,122
Transactions with owners, recorded directly in equity Distributions to owners Final dividend 2014 (Rs. 2.25 per ordinary share) - - (2,101,748) (2,101,748) Total transactions with owners - - (2,101,748) (2,101,748) Balance as at March 31, 2015 9,341,100 228,350 1,498,561 11,068,011
The annexed notes 1 to 14 form an integral part of this condensed interim financial information.
CHAIRMAN CHIEF EXECUTIVE DIRECTOR

1. Fauji Fertilizer Bin Qasim Limited (“the Company”) is a public limited company incorporated in Pakistan under the Companies Ordinance,1984, and its shares are quoted on the Karachi, Lahore and Islamabad stock exchanges in Pakistan. The registered office of the Company is situated at Rawalpindi, Pakistan. The Company is domiciled in Rawalpindi, Pakistan. The principal objective of the Company is manufacturing, purchasing and marketing of fertilizers. The Company commenced its commercial production effective January 1, 2000.
2. This condensed interim financial information of the Company for the quarter ended March 31, 2015 has been prepared in accordance with the requirements of International Accounting Standard 34 - Interim Financial Reporting and provisions of and directives issued under the Companies Ordinance, 1984. In case where requirements differ, the provisions of or directives issued under the Companies Ordinance, 1984 have been followed. The disclosures in this condensed interim financial information do not include the information reported for full annual financial statements and should therefore be read in conjunction with the financial statements for the year ended December 31, 2014. Comparative balance sheet is extracted from annual financial statements as of December 31, 2014 whereas comparative profit and loss account, statement of comprehensive income, statement of cash flows and statement of changes in equity are extracted from unaudited condensed interim financial information for the quarter ended March 31, 2014. The condensed interim financial information is unaudited and is being submitted to the members as required under Section 245 of the Companies Ordinance, 1984 and the listing regulations of the Islamabad, Karachi and Lahore Stock Exchanges.
3. The accounting policies and method of computation adopted for the preparation of this condensed interim financial information is same as those applied in preparation of financial statements for the preceding year ended December 31, 2014.
4. Status of significant shareholding as at March 31, 2015 is given below:
Shares PercentageFauji Fertilizer Company Limited 465,891,896 49.88 Fauji Foundation 170,842,385 18.29
Un - auditedMarch 31,
2015
AuditedDecember 31,
2014
(Rupees ‘000)
5. LONG TERM LOANS
Loans from banking companies - secured 10,000,000 10,000,000
Less: Current portion shown under current liabilities 1,500,000 -
8,500,000 10,000,000
6. DEFERRED GOVERNMENT ASSISTANCEDeferred Government assistance from Government of Pakistan (GoP) 1,944,600 1,925,179 Less: Current portion shown under current liabilities 1,944,600 1,944,600
- (19,421)Deferred Government assistance - 19,421
- -
NOTES TO THE CONDENSED INTERIM FINANCIAL INFORMATION (UN-AUDITED)FOR THE QUARTER ENDED MARCH 31, 2015

Un - audited March 31,
2015
Audited December 31,
2014
Note (Rupees ‘000) 7. DEFERRED LIABILITIES
Compensated leave absences 383,317 393,853 Deferred tax 7.1 2,817,299 2,882,952
3,200,616 3,276,805 7.1 The balance of deferred tax is in respect of the following major
temporary differences:
Accelerated depreciation 2,875,241 2,940,894 Provision for inventory obsolescence (57,942) (57,942)
2,817,299 2,882,952
8. CONTINGENCIES AND COMMITMENTSContingenciesi) Indemnity bonds and undertakings given to the customs authorities for
the machinery imported by the Company for installation at plant site. 119,650 119,650
ii) Guarantees issued by banks on behalf of the Company. 34,372 60,692 iii) Company’s share of contingent liabilities of Fauji Cement Company
Limited as at December 31, 2014. 22,250 22,250
iv) Company’s share of contingent liabilities of Foundation Wind Energy - I Limited as at December 31, 2014. 61,648 62,873
v) Company’s share of contingent liabilities of Foundation Wind Energy - II (Pvt) Limited as at December 31, 2014. 61,648 62,873
vi) Company’s share of contingent liabilities of Askari Bank Limited as at December 31, 2014. 31,511,278 34,965,631
Commitments i) Capital expenditures - contracted. 1,425,124 909,849 ii) Letters of credit for purchase of stores, spares and raw materials. 849,599 1,079,418 iii) Commitments with Fauji Foundation for investment in wind power
projects. 187,580 865,078 iv) Company’s share of commitments of PMP as at December 31, 2014. 4,472 4,623 v) Commitments on behalf of Fauji Meat Limited. 77,107 69,916 vi) Commitments on behalf of FFBL Power Company Limited. 4,739,605 5,390,538 vii) Commitments on behalf of Fauji Cement Company Limited. 8,935 10,785
9. PROPERTY, PLANT AND EQUIPMENTOpening written down value 12,202,673 13,059,509 Additions 76,280 530,995 Disposals - (48,994)Depreciation (345,995) (1,381,801)Depreciation on disposed off items - 42,964 Closing written down value 11,932,958 12,202,673
Un - auditedMarch 31,
2015
Audited December 31,
2014Note (Rupees ‘000)
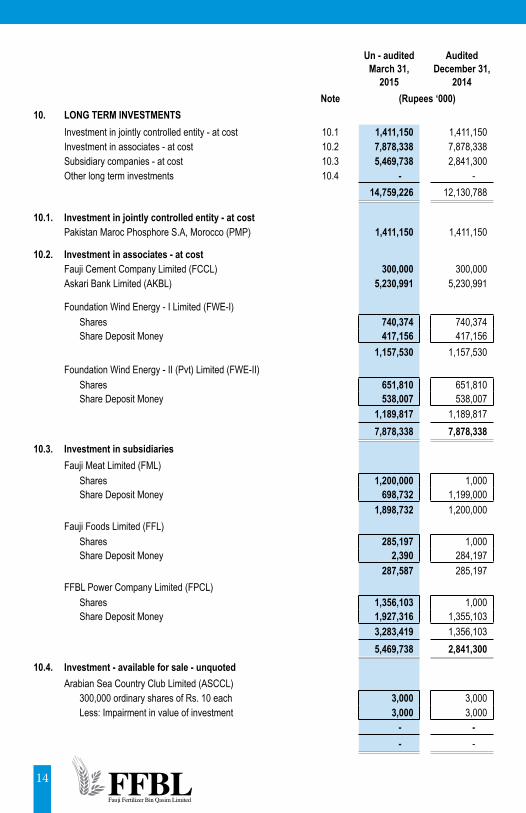
10. LONG TERM INVESTMENTSInvestment in jointly controlled entity - at cost 10.1 1,411,150 1,411,150 Investment in associates - at cost 10.2 7,878,338 7,878,338 Subsidiary companies - at cost 10.3 5,469,738 2,841,300 Other long term investments 10.4 - -
14,759,226 12,130,788
10.1. Investment in jointly controlled entity - at costPakistan Maroc Phosphore S.A, Morocco (PMP) 1,411,150 1,411,150
10.2. Investment in associates - at costFauji Cement Company Limited (FCCL) 300,000 300,000 Askari Bank Limited (AKBL) 5,230,991 5,230,991
Foundation Wind Energy - I Limited (FWE-I)Shares 740,374 740,374 Share Deposit Money 417,156 417,156
1,157,530 1,157,530 Foundation Wind Energy - II (Pvt) Limited (FWE-II)
Shares 651,810 651,810 Share Deposit Money 538,007 538,007
1,189,817 1,189,817 7,878,338 7,878,338
10.3. Investment in subsidiaries Fauji Meat Limited (FML)
Shares 1,200,000 1,000 Share Deposit Money 698,732 1,199,000
1,898,732 1,200,000 Fauji Foods Limited (FFL)
Shares 285,197 1,000 Share Deposit Money 2,390 284,197
287,587 285,197 FFBL Power Company Limited (FPCL)
Shares 1,356,103 1,000 Share Deposit Money 1,927,316 1,355,103
3,283,419 1,356,103 5,469,738 2,841,300
10.4. Investment - available for sale - unquotedArabian Sea Country Club Limited (ASCCL)
300,000 ordinary shares of Rs. 10 each 3,000 3,000 Less: Impairment in value of investment 3,000 3,000
- - - -

For the quarter ended March 31, 2015 2014
(Rupees ‘000)11. COST OF SALES
Raw materials consumed 5,917,673 3,978,737 Packing materials consumed 90,002 75,207 Fuel and power 568,104 446,498 Chemicals and supplies consumed 48,724 41,465 Salaries, wages and benefits 270,696 388,737 Rent, rates and taxes 6,352 5,673 Insurance 24,905 24,725 Travel and conveyance 24,972 37,534 Repairs and maintenance 408,003 347,254 Communication, establishment and others 20,502 31,362 Depreciation 332,224 335,094 Opening stock - work in process 103,341 26,936 Closing stock - work in process (41,642) (81,039)Cost of goods manufactured 7,773,856 5,658,183 Opening stock - finished goods 277,952 547,596 Closing stock - finished goods (2,963,300) (995,230)Cost of sales 5,088,508 5,210,549
12. CASH USED IN OPERATIONSProfit before taxation from ordinary activities 87,355 241,706 Adjustment for:
Provision for gratuity 20,452 17,950 Exchange losses / (gains) 58,741 (183,327)Provision for compensated absences 361 36,364 Provision for Workers’ (Profit) Participation Fund 4,598 13,095 Provision for Workers’ Welfare Fund - 7,095 Depreciation 345,995 343,777 Finance cost 362,377 225,466 Profit on bank balances and term deposits (60,937) (81,057)Dividend income (290,634) (14,063)Gain on sale of investments (206,575) (75,310)Gain on sale of property, plant and equipment - (12,258)
Operating profit before working capital changes 321,733 519,438
Changes in working capital Stores and spares 61,068 48,477 Stock in trade (3,135,328) (1,677,880)Trade debts 755,525 1,074,844 Advances 10,501 46,265 Trade deposits and short term prepayments (102,374) (70,143)Other receivables (423,260) (147,852)Sales tax receivable (335,073) (253,794)Trade and other payables (235,857) 75,623
(3,404,798) (904,460)Cash used in operations (3,083,065) (385,022)

For the quarter ended March 31, 2015 2014
(Rupees ‘000) 13. RELATED PARTY TRANSACTIONS
Transactions with subsidiary companiesServices provided 362,457 99,839 Investment in Fauji Meat Limited (FML) 50,000 100,000 Investment in FFBL Power Company Limited (FPCL) 1,620,000 -
Transactions with associated undertakings due to common directorshipServices and material acquired 93,688 106,196 Services and material provided 559 - Commission charged to the Company 2,015 2,217 Dividend paid 1,432,652 1,432,652 Rent charged to the Company 350 324 Profit on bank balances (AKBL) 7,823 5,601 Balance receivable -unsecured 897,735 173,420 *Balance payable -unsecured 933 583 *Balances at bank (AKBL) 1,291,614 1,342,645 *Investments - 180,345
Transactions with jointly controlled entityPurchase of raw materials 5,008,832 4,351,800 Expenses incurred on behalf of jointly controlled entity 2,191 4,340 Balance payable - secured 4,691,472 5,745,925 *Balance receivable - unsecured 25,644 37,526 *
Other related partiesContribution to Provident Fund 13,445 14,519 Contribution to Gratuity Fund 20,452 17,951 Remuneration including benefits and perquisites of Chief Executive Officer and executives - No of persons 2015 : 1 and 16. ( 2014 : 1 and 18 ) 64,524 79,748 Payment to Workers’ (Profit) Participation Fund 20,557 49,808 Balance payable (WWF+WPPF) - unsecured 1,075,671 1,096,074 *Payable to Gratuity Fund 219,936 198,228 *
*Balance of accounts appearing as comparatives are as at December 31, 2014
14. GENERAL14.1 Figures have been rounded off to the nearest thousand rupees.14.2 Corresponding figures have been re-arranged / restated, wherever necessary, for the purpose of comparison.14.3 This condensed interim financial information was authorized for issue by the Board of Directors of the Company
in their meeting held on April 27, 2015.
CHAIRMAN CHIEF EXECUTIVE DIRECTOR


CONDENSED INTERIM CONSOLIDATED BALANCE SHEETAS AT MARCH 31, 2015
Un - audited March 31,
2015
Audited December 31,
2014Note (Rupees ‘000)
EQUITY AND LIABILITIES
ISSUED SHARE CAPITAL AND RESERVESShare capital 9,341,100 9,341,100 Capital reserve 228,350 228,350 Statutory reserve 6,380 6,380 Translation reserve 796,579 904,466 Accumulated profit 1,786,126 3,773,055
12,158,535 14,253,351 NON-CURRENT LIABILITIES
Long term loan 5 8,500,000 10,000,000 Deferred liabilities 7 3,259,033 3,317,192
11,759,033 13,317,192 CURRENT LIABILITIES
Trade and other payables 14,501,080 13,873,336 Mark - up accrued 256,165 233,142 Short term borrowings 8,253,599 3,087,408 Current portion of long term loans 5 1,500,000 - Current portion of deferred Government assistance 6 1,944,600 1,944,600 Provision for income tax - net 205,555 769,102
26,660,999 19,907,588
50,578,567 47,478,131
CONTINGENCIES AND COMMITMENTS 8
The annexed notes 1 to 14 form an integral part of this condensed interim consolidated financial information.
Un - audited March 31,
2015
Audited December 31,
2014Note (Rupees ‘000)
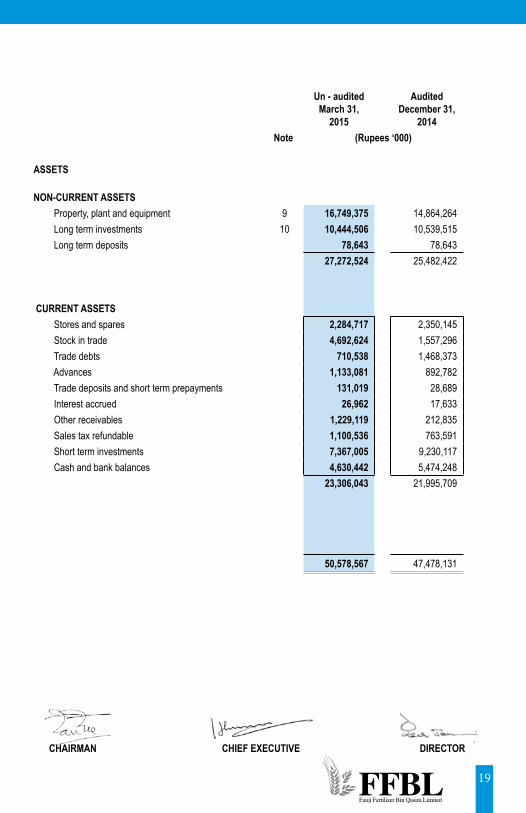
ASSETS
NON-CURRENT ASSETS Property, plant and equipment 9 16,749,375 14,864,264 Long term investments 10 10,444,506 10,539,515 Long term deposits 78,643 78,643
27,272,524 25,482,422
CURRENT ASSETS Stores and spares 2,284,717 2,350,145 Stock in trade 4,692,624 1,557,296 Trade debts 710,538 1,468,373 Advances 1,133,081 892,782 Trade deposits and short term prepayments 131,019 28,689 Interest accrued 26,962 17,633 Other receivables 1,229,119 212,835 Sales tax refundable 1,100,536 763,591 Short term investments 7,367,005 9,230,117 Cash and bank balances 4,630,442 5,474,248
23,306,043 21,995,709
50,578,567 47,478,131
CHAIRMAN CHIEF EXECUTIVE DIRECTOR
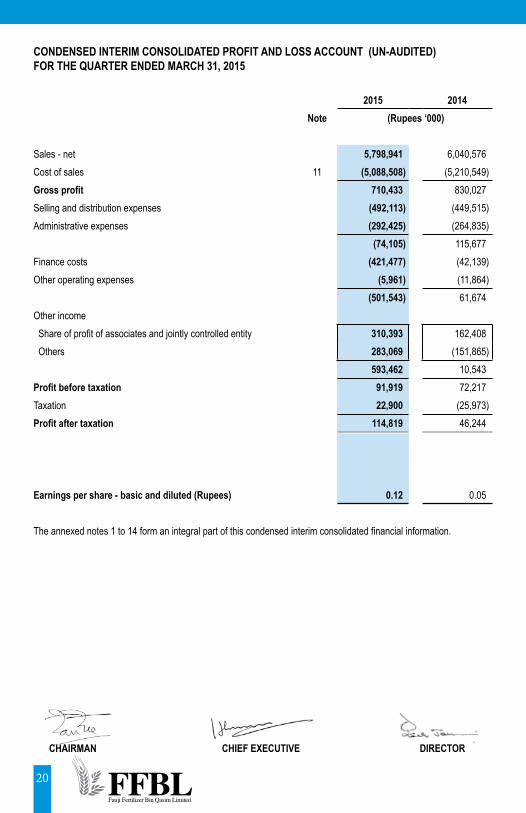
CONDENSED INTERIM CONSOLIDATED PROFIT AND LOSS ACCOUNT (UN-AUDITED)FOR THE QUARTER ENDED MARCH 31, 2015
2015 2014 Note (Rupees ‘000)
Sales - net 5,798,941 6,040,576 Cost of sales 11 (5,088,508) (5,210,549)Gross profit 710,433 830,027 Selling and distribution expenses (492,113) (449,515)Administrative expenses (292,425) (264,835)
(74,105) 115,677 Finance costs (421,477) (42,139)Other operating expenses (5,961) (11,864)
(501,543) 61,674 Other income Share of profit of associates and jointly controlled entity 310,393 162,408 Others 283,069 (151,865)
593,462 10,543 Profit before taxation 91,919 72,217 Taxation 22,900 (25,973)Profit after taxation 114,819 46,244
Earnings per share - basic and diluted (Rupees) 0.12 0.05
The annexed notes 1 to 14 form an integral part of this condensed interim consolidated financial information.
CHAIRMAN CHIEF EXECUTIVE DIRECTOR

CONDENSED INTERIM CONSOLIDATED STATEMENT OF COMPREHENSIVE INCOME (UN-AUDITED)FOR THE QUARTER ENDED MARCH 31, 2015
2015 2014
(Rupees ‘000)
Profit after taxation 114,819 46,244
Other comprehensive income
Exchange difference on translating a jointly controlled entity (106,960) 97,588
Effect of translation - share of Askari Bank Limited under equity method (927) (318)
Total comprehensive income 6,932 143,514
The annexed notes 1 to 14 form an integral part of this condensed interim consolidated financial information.
CHAIRMAN CHIEF EXECUTIVE DIRECTOR

CONDENSED INTERIM CONSOLIDATED STATEMENT OF CASH FLOWS (UN-AUDITED)FOR THE QUARTER ENDED MARCH 31, 2015
2015 2014Note (Rupees ‘000)
CASH FLOWS FROM OPERATING ACTIVITIESCash used in operations 12 (3,643,486) (286,076)Income tax paid (598,984) (349,646)Payment to Gratuity Fund 1,256 (51,301)Finance cost paid (339,559) (293,326)Compensated absences paid (10,897) (7,947)Payment to Workers Welfare Fund (180) - Payment to Workers’ (Profit) Participation Fund (11,218) (49,808)Net cash used in operating activities (4,603,068) (1,038,104)
CASH FLOWS FROM INVESTING ACTIVITIESFixed capital expenditure (2,233,147) (254,110)Long term investments - (179,346)Sale proceeds of property, plant and equipment - 13,650 Short term investments 1,119,687 (70,413)Profit received on bank balances and term deposits 55,354 82,452 Net cash used in investing activities (1,058,106) (407,767)
CASH FLOWS FROM FINANCING ACTIVITIESShort term borrowings - net 550,000 (1,250,000)Dividend paid (1,298,825) (1,335,511)Net cash used in financing activities (748,825) (2,585,511)Net decrease in cash and cash equivalents (6,409,999) (4,031,382)Cash and cash equivalents at beginning of the quarter 5,566,842 3,044,431 Cash and cash equivalents at end of the quarter (843,157) (986,951)
CASH AND CASH EQUIVALENTSCash and cash equivalents included in the statement of cash flows comprises the following balance sheet amounts:
- Cash and bank balances 4,630,442 3,404,878 - Short term highly liquid investments 480,000 1,010,000 - Short term running finance (5,953,599) (5,401,829)
(843,157) (986,951)
The annexed notes 1 to 14 form an integral part of this condensed interim consolidated financial information.
CHAIRMAN CHIEF EXECUTIVE DIRECTOR
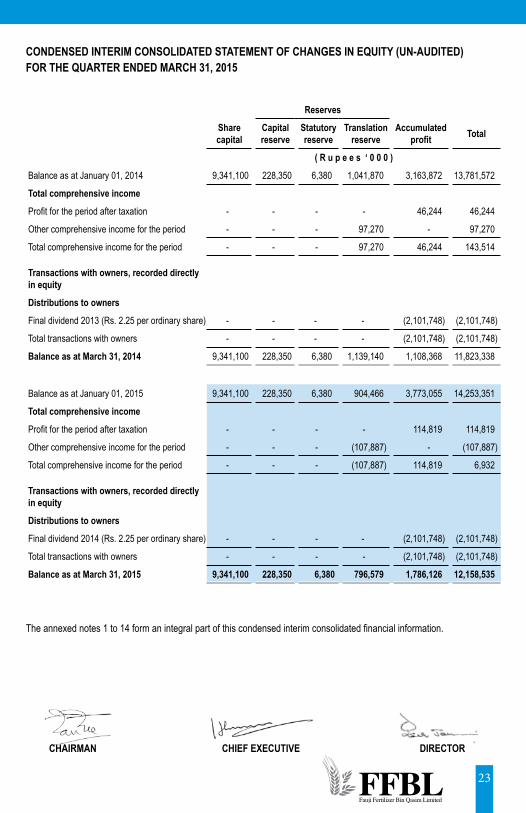
CONDENSED INTERIM CONSOLIDATED STATEMENT OF CHANGES IN EQUITY (UN-AUDITED)FOR THE QUARTER ENDED MARCH 31, 2015
Reserves
Share capital
Capital reserve
Statutory reserve
Translation reserve
Accumulated profit Total
( R u p e e s ‘ 0 0 0 )
Balance as at January 01, 2014 9,341,100 228,350 6,380 1,041,870 3,163,872 13,781,572
Total comprehensive income
Profit for the period after taxation - - - - 46,244 46,244
Other comprehensive income for the period - - - 97,270 - 97,270
Total comprehensive income for the period - - - 97,270 46,244 143,514
Transactions with owners, recorded directly in equity
Distributions to owners
Final dividend 2013 (Rs. 2.25 per ordinary share) - - - - (2,101,748) (2,101,748)
Total transactions with owners - - - - (2,101,748) (2,101,748)
Balance as at March 31, 2014 9,341,100 228,350 6,380 1,139,140 1,108,368 11,823,338
Balance as at January 01, 2015 9,341,100 228,350 6,380 904,466 3,773,055 14,253,351
Total comprehensive income
Profit for the period after taxation - - - - 114,819 114,819
Other comprehensive income for the period - - - (107,887) - (107,887)
Total comprehensive income for the period - - - (107,887) 114,819 6,932
Transactions with owners, recorded directly in equity
Distributions to owners
Final dividend 2014 (Rs. 2.25 per ordinary share) - - - - (2,101,748) (2,101,748)
Total transactions with owners - - - - (2,101,748) (2,101,748)
Balance as at March 31, 2015 9,341,100 228,350 6,380 796,579 1,786,126 12,158,535
The annexed notes 1 to 14 form an integral part of this condensed interim consolidated financial information.
CHAIRMAN CHIEF EXECUTIVE DIRECTOR

NOTES TO THE CONDENSED INTERIM CONSOLIDATED FINANCIAL INFORMATION (UN-AUDITED)FOR THE QUARTER ENDED MARCH 31, 2015
1. Fauji Fertilizer Bin Qasim Limited group comprises of Fauji Fertilizer Bin Qasim Limited (FFBL / parent company) and its fully owned subsidiaries, Fauji Meat Limited (FML), Fauji Foods limited (FFL) and FFBL Power Company Limited (FPCL), collectively referred as (“Group”).
FFBL is a public limited company incorporated in Pakistan under the Companies Ordinance,1984, and its shares are quoted on the Karachi, Lahore and Islamabad stock exchanges in Pakistan. The registered office of FFBL is situated at Rawalpindi, Pakistan. FFBL is domiciled in Rawalpindi, Pakistan. The principal objective of FFBL is manufacturing, purchasing and marketing of fertilizers. FFBL commenced its commercial production effective January 1, 2000.
FML is a public limited company incorporated on September 05, 2013 in Pakistan under the Companies Ordinance, 1984. The principal objectives of FML are to establish a meat abattoir unit for halal slaughtering of animals to obtain meat for local and export sale purposes. FFL is a public limited company incorporated on July 04, 2013 in Pakistan under the Companies Ordinance, 1984. The principal objectives of FFL are to produce multi brand dairy products. FFBL Power Company Limited is a public limited company incorporated on June 27, 2014 in Pakistan under the Companies Ordinance, 1984. The principal activity is generation and supply of electricity and all other forms of energy.
2. This condensed interim consolidated financial information is un-audited and is being submitted to the shareholders in accordance with the requirements of Section 245 of the Companies Ordinance, 1984. This condensed interim consolidated financial information of the Company for the quarter ended March 31, 2015 has been prepared in accordance with the requirements of International Accounting Standard 34 - Interim Financial Reporting and provisions of and directives issued under the Companies Ordinance, 1984. In case where requirements differ, the provisions of or directives issued under the Companies Ordinance, 1984 have been followed.
The disclosures in this condensed interim consolidated financial information do not include the information reported for full annual financial statements and should therefore be read in conjunction with the financial statements for the year ended December 31, 2014. Comparative condensed balance sheet is extracted from annual financial statements as of December 31, 2014 whereas comparative condensed profit and loss account, condensed statement of comprehensive income, condensed statement of cash flows and condensed statement of changes in equity are extracted from unaudited condensed interim consolidated financial information of FFBL and its subsidiaries for the quarter ended March 31, 2014.
The condensed interim consolidated financial information is unaudited and is being submitted to the members as required under Section 245 of the Companies Ordinance, 1984 and the listing regulations of the Islamabad, Karachi and Lahore Stock Exchanges.
3. The accounting policies and method of computation adopted for the preparation of this condensed interim consolidated financial information is same as those applied in preparation of financial statements for the preceding year ended December 31, 2014.
4. Status of significant shareholding as at March 31, 2015 is given below:
Shares Percentage
Fauji Fertilizer Company Limited 465,891,896 49.88
Fauji Foundation 170,842,385 18.29
Un - audited March 31,
2015
Audited December 31,
2014
(Rupees ‘000)
5. LONG TERM LOANS
Loans from banking companies - secured 10,000,000 10,000,000
Less: Current portion shown under current liabilities 1,500,000 -
8,500,000 10,000,000

Un - audited March 31,
2015
AuditedDecember 31,
2014Note (Rupees ‘000)
6. DEFERRED GOVERNMENT ASSISTANCEDeferred Government assistance from Government of Pakistan (GoP) 1,944,600 1,925,179 Less: Current portion shown under current liabilities 1,944,600 1,944,600
- (19,421)Deferred Government assistance - 19,421
- - 7. DEFERRED LIABILITIES
Compensated leave absences 383,317 393,853 Deferred tax 7.1 2,875,716 2,923,339
3,259,033 3,317,192 7.1 The balance of deferred tax is in respect of the following major temporary
differences:Accelerated depreciation 2,874,730 2,940,894 Share of profit of associates 58,928 40,387 Provision for inventory obsolescence (57,942) (57,942)
2,875,716 2,923,339 8. CONTINGENCIES AND COMMITMENTS
Contingenciesi) Indemnity bonds and undertakings given to the customs authorities for the
machinery imported by the Company for installation at plant site. 119,650 119,650 ii) Guarantees issued by banks on behalf of the Company. 34,372 60,692 iii) Company’s share of contingent liabilities of Fauji Cement Company Limited as
at December 31, 2014. 22,250 22,250 iv) Company’s share of contingent liabilities of Foundation Wind Energy - I
Limited as at December 31, 2014. 61,648 62,873 v) Company’s share of contingent liabilities of Foundation Wind Energy - II (Pvt)
Limited as at December 31, 2014. 61,648 62,873 vi) Company’s share of contingent liabilities of Askari Bank Limited as at
December 31, 2014. 31,511,278 34,965,631
Commitments i) Capital expenditures - contracted. 1,425,124 3,603,502 ii) Letters of credit for purchase of stores, spares and raw materials. 849,599 1,079,418 iii) Commitments with Fauji Foundation for investment in wind power projects. 187,580 865,078 iv) Company’s share of commitments of PMP as at December 31, 2014. 4,472 4,623 v) Group’s share of commitments of Fauji Meat Limited. 2,443,884 69,916 vi) Group’s share of commitments of FFBL Power Company Limited. 5,919,367 5,390,538 vii) Group’s share of commitments of Fauji Cement Company Limited as at
December 31, 2014. 8,935 10,785
9. PROPERTY, PLANT AND EQUIPMENTOpening written down value 14,864,264 13,059,509 Additions 2,233,139 3,194,633 Disposals - (48,994)Depreciation (348,028) (1,383,849)Depreciation on disposed off items - 42,965 Closing written down value 16,749,375 14,864,264

Un - audited March 31,
2015
Audited December 31,
2014(Rupees ‘000)
10. LONG TERM INVESTMENTS Investment in jointly controlled entity - equity methodPakistan Maroc Phosphore S.A, Morocco (PMP)Balance brought forward 2,579,774 2,346,725 Share of profit 124,970 368,974 Loss during the year on translation of net assets (113,841) (135,925)Closing balance 2,590,903 2,579,774
Investment in associates - equity methodFauji Cement Company Limited (FCCL)Balance brought forward 364,800 358,313 Share of profit 14,155 34,612 Dividend (18,750) (28,125)Closing balance 360,205 364,800
Foundation Wind Energy - I Limited (FWE-I)Opening balance 1,102,352 923,941 Advance paid during the year against issue of shares - 189,042 Share of loss (5,350) (10,631)Closing balance 1,097,002 1,102,352
Foundation Wind Energy - II (Pvt) Limited (FWE-II)Opening balance 1,149,908 971,100 Advance paid during the year against issue of shares - 180,461 Share of loss (22,704) (1,653)Closing balance 1,127,204 1,149,908
Askari Bank Limited (AKBL)Opening balance 5,342,681 5,262,054 Share of profit 199,322 353,990 Dividend (271,884) (271,884)Effect of translation (927) (1,479)Closing balance 5,269,192 5,342,681
Investment - available for sale - unquotedArabian Sea Country Club Limited (ASCCL)
300,000 ordinary shares of Rs. 10 each 3,000 3,000 Less: Impairment in value of investment 3,000 3,000
- - 10,444,506 10,539,515

For the quarter ended March 31, 2015 2014
(Rupees ‘000)11. COST OF SALES
Raw materials consumed 5,917,673 3,978,737 Packing materials consumed 90,002 75,207 Fuel and power 568,104 446,498 Chemicals and supplies consumed 48,724 41,465 Salaries, wages and benefits 270,696 388,737 Rent, rates and taxes 6,352 5,673 Insurance 24,905 24,725 Travel and conveyance 24,972 37,534 Repairs and maintenance 408,003 347,254 Communication, establishment and others 20,502 31,362 Depreciation 332,224 335,094 Opening stock - work in process 103,341 26,936 Closing stock - work in process (41,642) (81,039)Cost of goods manufactured 7,773,856 5,658,183 Opening stock - finished goods 277,952 547,596 Closing stock - finished goods (2,963,300) (995,230)Cost of sales 5,088,508 5,210,549
12. CASH USED IN OPERATIONSProfit before taxation from ordinary activities 91,919 72,217 Adjustment for:
Provision for gratuity 20,452 17,950 Exchange loss / (gain) 58,741 (183,327)Provision for compensated absences 361 36,364 Provision for Workers’ (Profit) Participation Fund 5,586 4,271 Provision for Workers’ Welfare Fund - 7,264 Depreciation 348,029 343,777 Finance cost 362,737 225,466 Profit on bank balances and term deposits (64,683) (81,453)(Profit) / loss from associates (310,393) 162,408 Gain on sale of investments (206,575) (75,310)Gain on sale of property, plant and equipment - (12,258)
Operating profit before working capital changes 306,175 517,370
Changes in working capital Stores and spares 65,428 48,477 Stock in trade (3,135,328) (1,677,880)Trade debts 755,525 1,074,844 Advances (240,281) 47,479 Trade deposits and short term prepayments (102,347) (70,143)Other receivables (421,950) (147,890)Sales tax receivable (341,118) (253,794)Trade and other payables (529,589) 175,462
(3,949,660) (803,445)Cash used in operations (3,643,486) (286,076)

For the quarter ended March 31, 2015 2014
(Rupees ‘000) 13. RELATED PARTY TRANSACTIONS
Transactions with associated undertakings due to common directorshipServices and material acquired 93,688 106,196 Services and material provided 559 - Commission charged to the Company 2,015 2,217 Dividend paid 1,432,652 1,432,652 Rent charged to the Company 350 324 Profit on bank balances (AKBL) 7,823 5,601 Balance receivable - unsecured 897,735 173,420 *Balance payable - unsecured 933 583 *Balances at bank (AKBL) 1,291,614 1,342,645 *Investments - 279,345
Transactions with jointly controlled entityPurchase of raw materials 5,008,832 4,351,800 Expenses incurred on behalf of jointly controlled entity 2,191 4,340 Balance payable - secured 4,691,472 5,745,925 *Balance receivable - unsecured 25,644 37,526 *
Other related partiesContribution to Provident Fund 13,445 14,519 Contribution to Gratuity Fund 20,452 17,951 Remuneration including benefits and perquisites of Chief Executive Officer and executives - No of persons 2015 : 1 and 16. ( 2014 : 1 and 18 ) 64,524 79,748 Payment to Workers’ (Profit) Participation Fund 20,557 49,808 Balance payable (WWF+WPPF) - unsecured 1,075,671 1,096,074 *Payable to Gratuity Fund 219,936 198,228 *
*Balance of accounts appearing as comparatives are as at December 31, 2014
14. GENERAL14.1 Figures have been rounded off to the nearest thousand rupees.14.2 Corresponding figures have been re-arranged / restated, wherever necessary, for the purpose of comparison.14.3 This condensed interim consolidated financial information was authorized for issue by the Board of Directors of
the Company in their meeting held on April 27, 2015.
CHAIRMAN CHIEF EXECUTIVE DIRECTOR