Company Presentation: Financials SP12.pdf · Company Presentation: Financials . Agenda 2. ......
50
Rahul Choudhry, Xiangyuan Li, Jiachen Wang, Shunxian Zou Company Presentation: Financials Company Presentation: Financials
Transcript of Company Presentation: Financials SP12.pdf · Company Presentation: Financials . Agenda 2. ......

Rahul Choudhry, Xiangyuan Li,
Jiachen Wang, Shunxian Zou
Company Presentation: Financials Company Presentation: Financials
Agenda
2. Lincoln Financial
J.P. Morgan Chase
1. Overview &
Recommendation
4. Summary
3. Wells Fargo
Bank of America

Sector Overview
www.themegallery.com Company name
Recall Sector Recommendation: HOLD

Company Holdings Recommendations
Company Current SIM Allocation
Buy/Sell Recommendation
Recommended SIM Allocation
2.63% Hold 2.63%
3.85% Sell 50 bps 3.35%
4.00% Hold 4.00%
2.40% Buy 50 bps 2.90%
Total 12.88% Hold 12.88%
www.themegallery.com Company name

Lincoln Financial Group

Business Overview
Stock information:
Current Stock Price: 20.56
Sector: Financial
Industry: Life Insurance
Market Cap: 5.87B
Shares outstanding: 301.67M
Average Daily Volume: 3.79M
Div yield: 1.50%
Beta: 2.42
Analyst recommendation:
Analyst rating: Hold
Target price: 24.37
Current weight:2.63%
Recommended Weight:2.63%

Lincoln Financial Group
Retirement Solutions
Annuities
Defined Contributions
Insurance solutions
Group Protection
Life Insurance
Business Overview

27%
10%
45%
18%
Sales Distribution By Segment (2011)
Annuities
Defined Contribution
Life Insurance
Group Protection
41%
11%
41%
7%
Earnings Distribution By Segment (2011)
Annuities
Defined Contribution
Life Insurance
Group Protection

Data Source: Bloomberg Terminal

• Strong operating fundamentals
• Significant capital flexibility
• Diversified products
Company strength
• High earnings exposure to interest rate sensitive products
• Sales are likely to remaining weak in 2012
Concerns

Stock Valuation
Relative to
Industry
High Low Median Current
P/Trailing E 1.3 0.42 0.89 0.73
P/Forward E 0.99 0.40 0.87 .79
P/B 1.1 0.4 0.8 0.6
P/S 1.7 0.5 1.2 0.9
P/CF 1.5 0.4 0.9 0.8
Valuation Analysis – Multiples,
industry
Data Source: Thomson Reuters Baseline
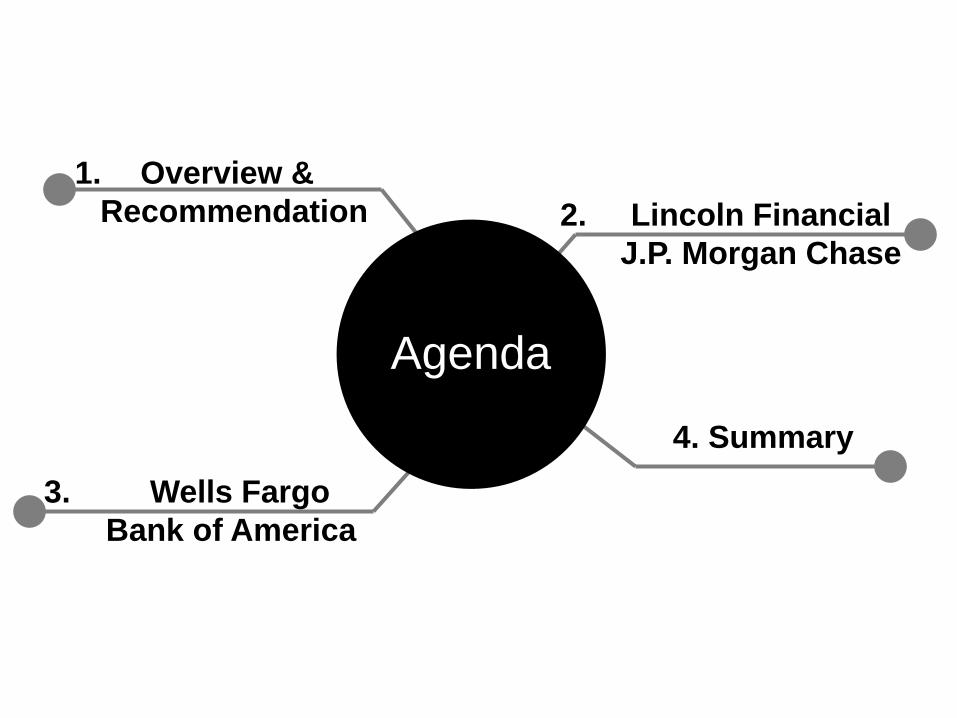
Valuation Analysis - Multiples
Data Source: Bloomberg Terminal

Relative to S&P
500
High Low Median Current
P/Trailing E 0.86 0.17 0.65 0.42
P/Forward E 0.83 0.14 0.61 0.43
P/B 0.6 0.2 0.4 0.2
P/S 1.4 0.2 1.0 0.5
P/CF 1.2 0.2 0.9 0.6
Valuation Analysis – Multiples, S&P 500
Data Source: Thomson Reuters Baseline

Multiples 70% weight =0.7*21.429 = $15 Current Price: $20.56
DCF Valuation 30% weight=0.3*31.24 = $9.37 Upside/Downside%: 18.53%
Final Target Price = $24.37 Recommendation: HOLD
Final Valuation
Data Source: Thomson Reuters Baseline
Your
Target
Price
WeightWeighted
Price
(F x G)
P/Forward
E13.2 1.8 10.4 5.8 6.9 4.21 29.05 0.1 2.905
P/S 2.2 0.2 1.3 0.6 0.8 36 28.8 0.1 2.88
P/B 1.8 0.2 1.2 0.5 0.7 45 31.5 0.4 12.6
P/EBITDA 35.1 1.66 6.59 2.55 5 5.78 28.9 0 0
P/CF 13.6 2 9.5 5.7 8.5 3.54 30.44 0.1 3.044
21.429
*Your
Target
E, S, B,
etc/Shar
e
Weighted Average Stock Price
Absolute
ValuationHigh Low Median Current
#Your
Target
Multiple

J.P. Morgan Chase
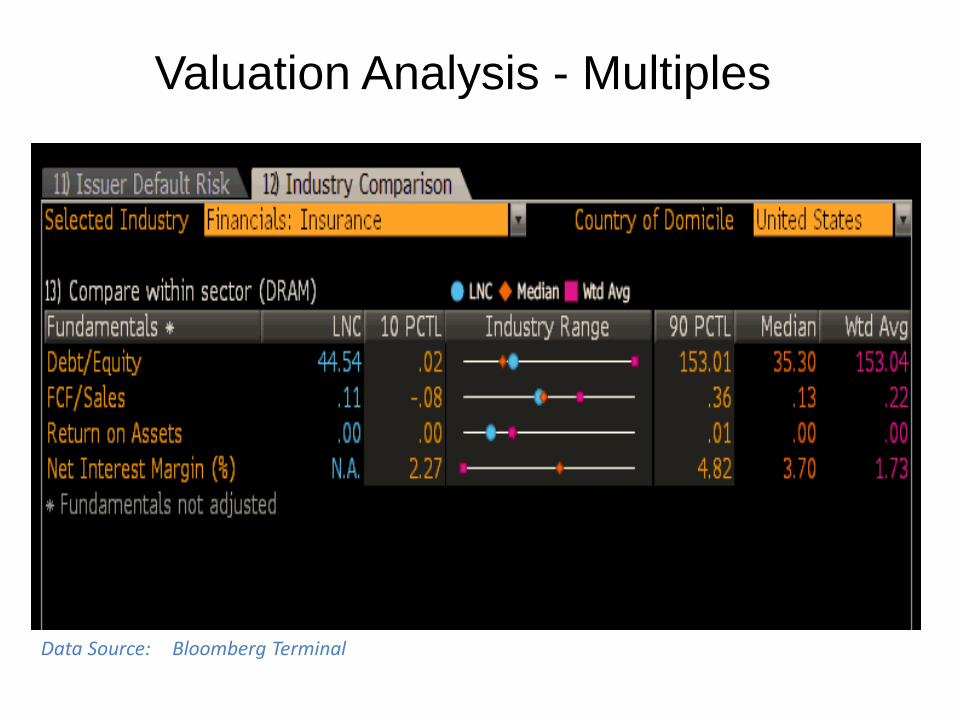
On May 10, 2012 JPM declared that the firm’s Chief Investment Office suffered $2B in trading losses.
Stock declined 20.2% ($40.74 $32.51) till date.
Significant attention from regulators. ‘Black Eye’ for JPM’s reputation in Risk
Management.


JPMorgan Chase & Co is a leading global financial services firm and one of the largest banking institutions in the United States, with operations worldwide.
2.3T in assets and $127.49 billion in stockholders’ equity.
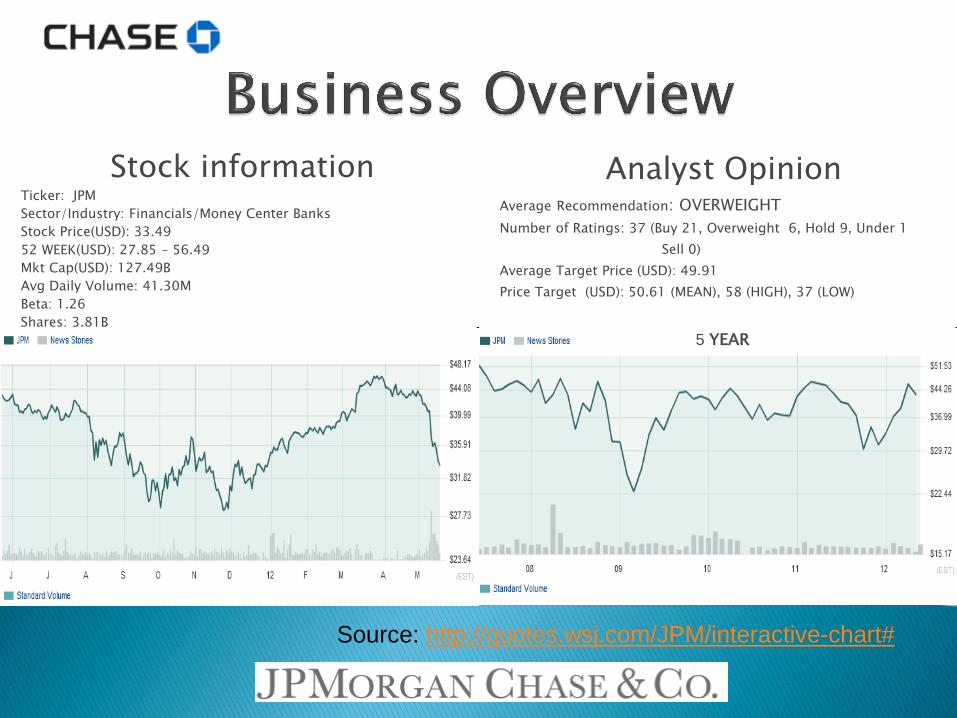
Stock information Ticker: JPM
Sector/Industry: Financials/Money Center Banks
Stock Price(USD): 33.49
52 WEEK(USD): 27.85 – 56.49
Mkt Cap(USD): 127.49B
Avg Daily Volume: 41.30M
Beta: 1.26
Shares: 3.81B
1 YEAR
Analyst Opinion Average Recommendation: OVERWEIGHT
Number of Ratings: 37 (Buy 21, Overweight 6, Hold 9, Under 1
Sell 0)
Average Target Price (USD): 49.91
Price Target (USD): 50.61 (MEAN), 58 (HIGH), 37 (LOW)
5 YEAR
Source: http://quotes.wsj.com/JPM/interactive-chart#

-
20,000
40,000
60,000
80,000
100,000
120,000
2007 2008 2009 2010 2011
Corporate/Private
Equity
Asset management
Treasury and Security
Services
Commercial Banking
Card Services & Auto
Retail Financial Services
Investment Banking (10,000)
-
10,000
20,000
30,000
40,000
50,000
60,000
2007 2008 2009 2010 2011

26%
27% 19%
6%
8%
10%
4%
Managed Entity Sales (% of
Total) for 2011 Investment Banking
Retail Financial
Services
Card Services & Auto
Commercial Banking
Treasury and Security
Services
Asset management
Corporate/Private
Equity
28%
19% 30%
11%
5% 7%
0%
Managed Entity Earnings (% of
Total) 2011 Investment Banking
Retail Financial
Services
Card Services & Auto
Commercial Banking
Treasury and Security
Services
Asset management
Corporate/Private
Equity

Source: http://quotes.wsj.com/JPM/interactive-chart#

Fortress balance sheet with $2.3T in assetts. Largest among all the banks worldwide. Consistently passed the regulators stress tests.
Increased regulations that would limit the banks activities and hurt earnings.(Basel, Dodd Frank, Volcker). JPM’s gold standard image in risk mgmt tarnished after $2B trading losses.
Credit card sales volume increased by 11% in 2011. Total deposits of $1.1 T, an increment of 21% over 2010.
Euro-zone crisis. Exposure of $ 15B to the distressed nations in the Eurozone. Decline in M&A activity within Europe since mid 2011 due to uncertainty.
Highly diversified portfolio with variety of products and services under several lines of business.
High litigation costs. WaMu one of the largest subprime loans issuer. Bear Stearns was also heavily involved in MBS.
#1 ranked in Global Investment banking fees for 2011.
Operation Twist – Flattening of yield curve.
Global Player. Operates in 60 countries worldwide. Mitigates the risk.
Occupy Wall Street movement against bank bailouts, CEO compensation, poor economy & home foreclosures. JPM also in category of “Too Big to Fail” banks.

Terminal Discount Rate and FCF


Recommendation: Sell 50 basis points.

Wells Fargo

Business Overview
• American multinational diversified financial
services company
• Fourth largest bank by assets
• Largest bank by market capitalization
• Three business segments: Community Banking;
Wholesales Banking; Wealth, Brokerage and
Retirement

Stock Overview
Stock Information: (As of 5/20/2012)
Ticker: WFC
Sector: Financial
Industry: Money Center Bank
Market Cap: 164.41B
Current Stock price: 31.4
Current SIM Weight: 4.00%
Beta: 1.25
52 Week range: $22.58-$34.59
Source:
finance.yahoo.com

Pros and Cons
Positive signs:
• Strong performance on profit
• Acquisition of BNP Paribas
• Agreement to acquire Merlin Securities, LLC
• Good reputation on local community
Risks:
• possibly violating anti-discrimination laws in homeowner financing
• highly sensitive to interest rates
• The increased regulation and continuing litigation
• Poor economic growth or even recession
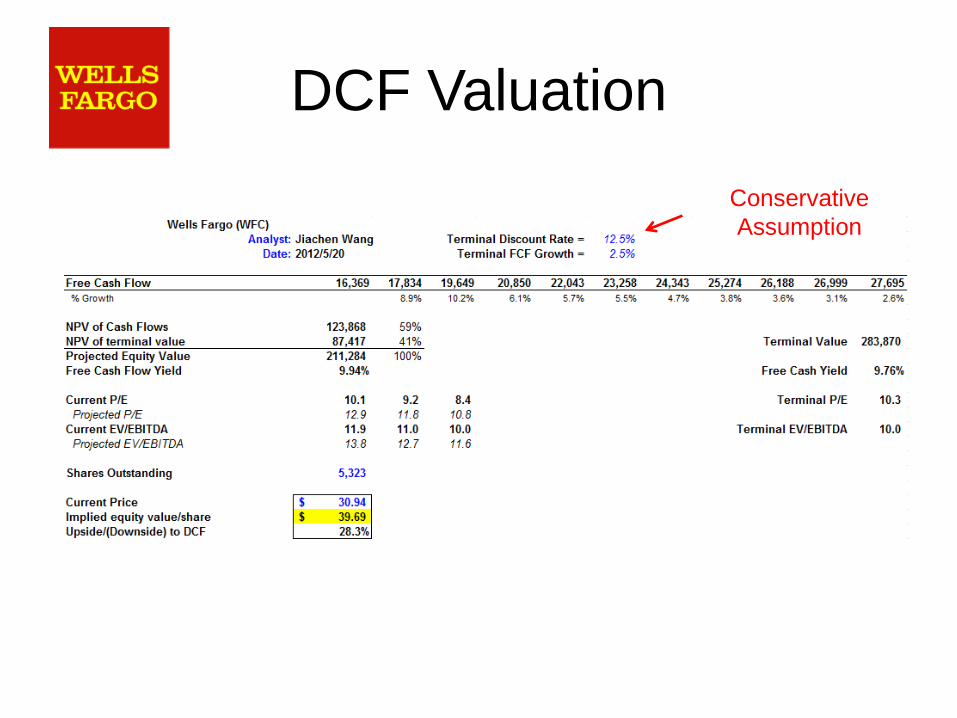
DCF Valuation
Conservative
Assumption

Relative Valuation
Relative to Industry High Low Median Current
P/Trailing E 1.3 0.16 1.1 0.96
P/Forward E 1.2 0.71 1.1 0.92
P/B 1.9 0.8 1.3 0.9
P/S 1.4 0.8 1 0.9
P/CF 1.2 0.4 1 1
Relative to S&P 500 High Low Median Current
P/Trailing E 1.2 0.58 0.82 0.85
P/Forward E 1.6 0.66 0.81 0.73
P/B 1.3 0.5 0.9 0.6
P/S 3.4 1.2 2.2 1.7
P/CF 1.7 0.7 0.9 1.1
Absolute Valuation High Low Median Current Target Multiple Target E, S, B,
etc/Share
Target
Price
(F x G)
P/Forward E 24.1 8.1 13.1 9.8 10 3.08 30.8
P/S 4.4 0.9 3.3 2.1 2.74 15.4 42.2
P/B 3.3 0.8 2.6 1.3 1.5 24.64 36.96
P/EBITDA 10.92 4.13 5.93 5.95 5.9 4.5 26.55
P/CF 13.1 5.1 10 9.9 10.5 3.08 32.34

Overall Valuation
Valuation Methods Current Target Weight
P/Forward E 30.8 0.1
P/S 42.2 0.1
P/B 36.96 0.4
P/EBITDA 26.55 0.1
P/CF 32.34 0.1
DCF 39.69 0.2
Weighted Target 35.91

Analyst Consensus
My Target: 35.91
Current Price: 31.4
Upside Potential:
14.36%
Price Target Summary
Mean Target: 38.18
Median Target: 38
High Target: 43
Low Target: 32
Source: 4-
traders.com
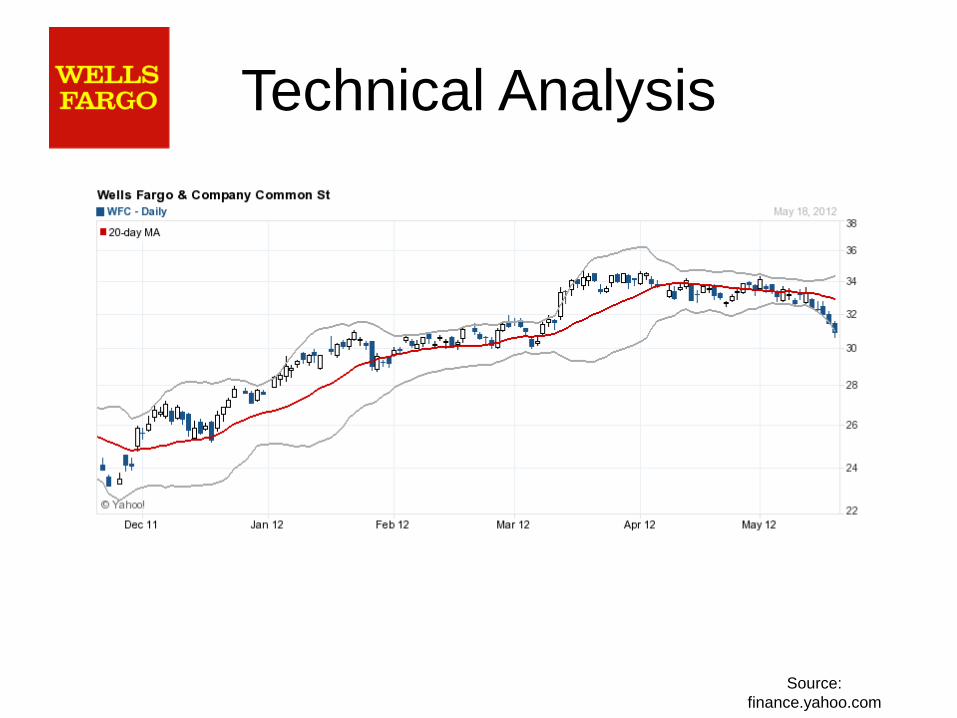
Technical Analysis
Source:
finance.yahoo.com

Recommendation
• Unit Cost: $29.49
• Current Price: $31.4
• Target Price: $35.91
• % of SIM: 4.00%
Bank of America

Stock Overview
General Information
• Ticker: BAC
• Industry: Div. Financial Services
• Market Cap: 76 Billion
• Beta: 1.96
• Current Price: $7.02
Analyst Opinion
• Highest Target: $14.50
• Lowest Target: $6.20
• Median Target: $10.00

Stock Overview
-20
-10
0
10
20
30
Consumer &BusinessBanking
ConsumerReal Estate
Services
GlobalBanking
GlobalMarkets
GlobalWealth &
InvestmentManagement
All Other
2011 Segment Revenue & Net Income (in billions)
Revenue Net Income
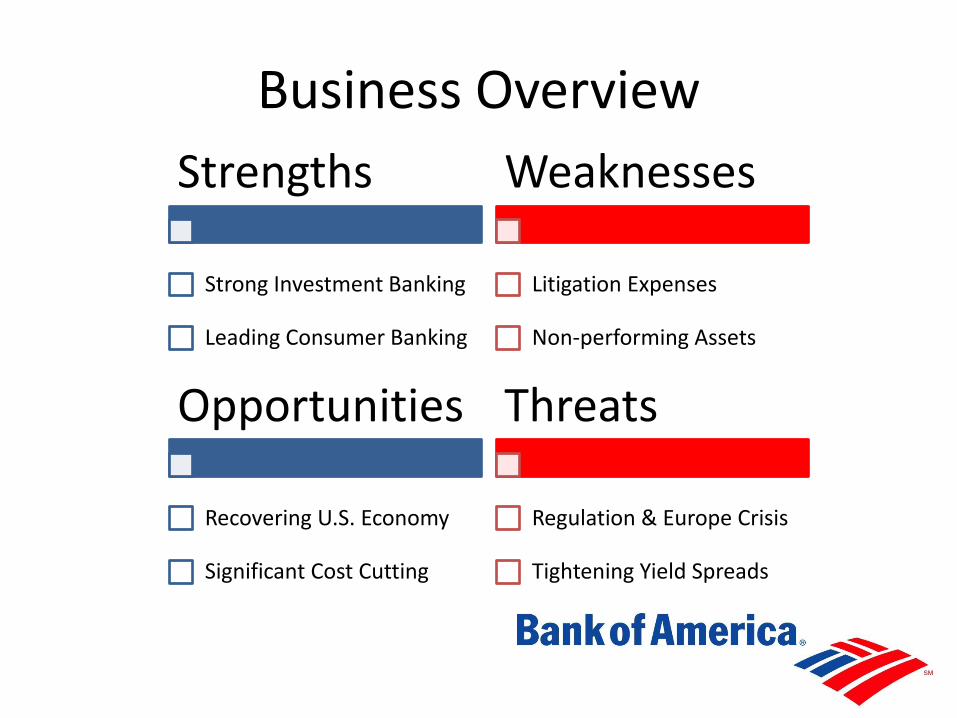
Business Overview
Strengths
Strong Investment Banking
Leading Consumer Banking
Weaknesses
Litigation Expenses
Non-performing Assets
Opportunities
Recovering U.S. Economy
Significant Cost Cutting
Threats
Regulation & Europe Crisis
Tightening Yield Spreads

Fundamentals Growth Estimates
Financial Analysis
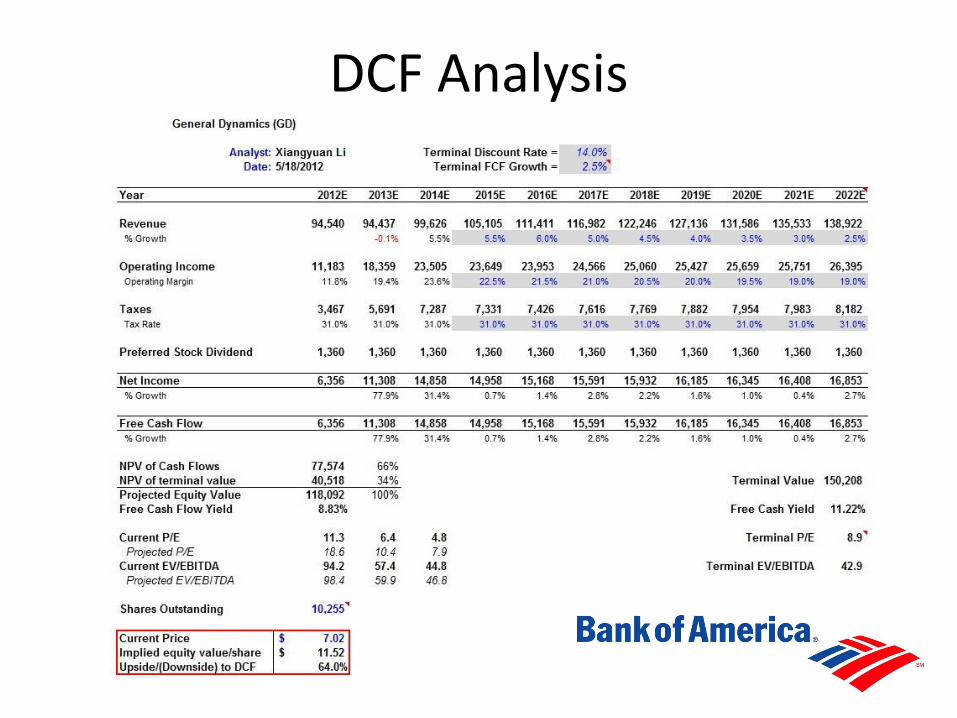
DCF Analysis

Multiple Analysis
Multiples High Low Median Current Target Price
P/Forward E 83.0 6.0 11.0 8.6 10 6.71
P/S 3.8 0.3 2.9 0.8 1.6 14.58
P/B 2.8 0.1 1.7 0.35 0.6 11.90
P/CF 43.5 2.7 10.3 5.0 7.5 10.53
Measure Weight
DCF 15%
P/Forward E 15%
P/S 15%
P/B 40%
P/CF 15%
Target Price $11.26
Upside Potential: 60.41%

Comparable Analysis
Multiples Bank of America
Wells Fargo
J.P. Morgan
Industry Sector
P/Trailing E 6.4 10.7 7.4 7.2 10.6
P/Forward E 8.6 9.2 7.3 7.2 10.0
P/B 0.35 1.2 0.7 0.5 0.9
P/S 0.8 2.0 1.3 1.0 1.4
P/CF 5.0 9.2 5.7 5.5 8.5
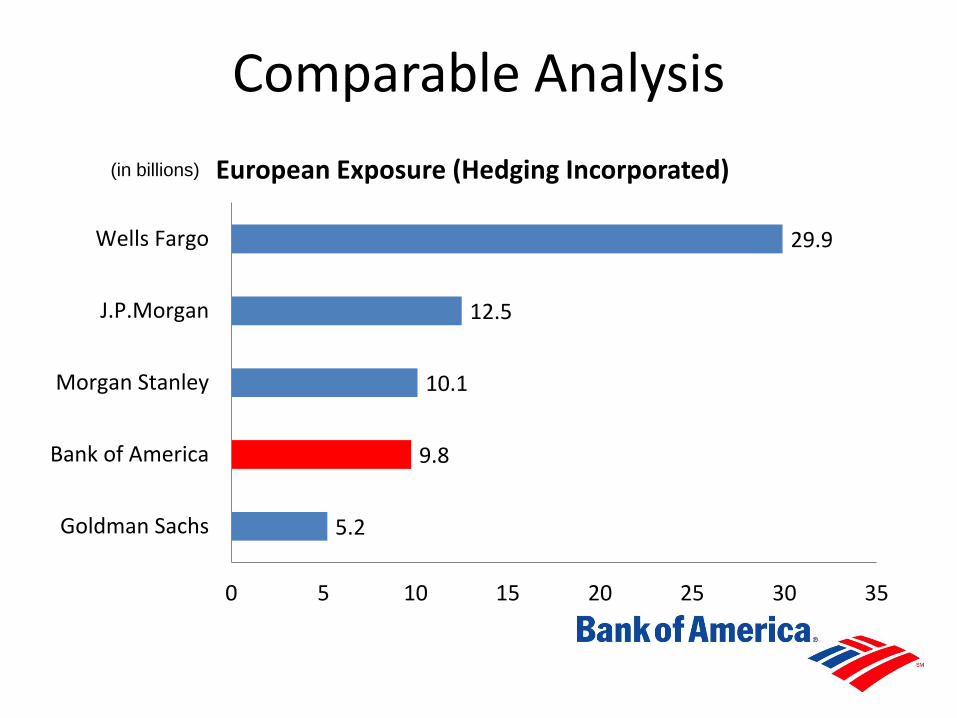
Comparable Analysis
5.2
9.8
10.1
12.5
29.9
0 5 10 15 20 25 30 35
Goldman Sachs
Bank of America
Morgan Stanley
J.P.Morgan
Wells Fargo
European Exposure (Hedging Incorporated) (in billions)

Comparable Analysis
15.13%
15.60%
17.10% 17.40% 17.49%
14%
15%
16%
17%
18%
Wells Fargo J.P.Morgan Goldman Sachs Morgan Stanley Bank ofAmerica
Total Capital Ratio

Econ. & Tech. Analysis

Recommendation
Recommendation:
Buy 50 basis points
Increase weight from 2.40% to 2.90%
Catalyst
Recovering U.S. Economy
Significant Cost Cutting
Risks
Regulation & Europe Crisis
Tightening Yield Spreads

Company Holdings Recommendations
Company Current SIM Allocation
Buy/Sell Recommendation
Recommended SIM Allocation
2.63% Hold 2.63%
3.85% Sell 50 bps 3.35%
4.00% Hold 4.00%
2.40% Buy 50 bps 2.90%
Total 12.88% Sell 40 bps 12.88%
www.themegallery.com Company name

Q & A
Any Questions?