Rates of Soil Compaction and Compaction Recovery in Areas ...
Upload
sairam-lsrCategory
view
207download
1
SOIL
MECHANICS
PROJECT
MECHANICAL
STABILISATION OF
SOIL
PROJECT DESCRIPTION
We are doing the mechanical stabilization of soil. For
this we have decided to do the compaction test. In
compaction we will determine the saturation at which
the max. dry density can be reached in the lab in a
practical scenario.
We know from phase relation that dry density is a
function of G, ρ, S, w. Therefore, if we are to plot
saturation curves for different dry densities we fist have
to determine the value of G.
Therefore, we have the following three main
objectives.
1. We first determine the relative density of soil
solids by the pyconometer method, thus we get
the value of G.
2. Next we perform the compaction test and draw
the compaction curve for different water content
by taking ‘w’ on the x-axis and dry density on the
y-axis.
3. Once we have obtained the compaction curve we
plot the 100% saturation line, we also plot 90%
and 80% saturation lines and so on to see at what
% saturation the soil attains maximum dry density
practically in the lab.
METHODOLOGY OF PROJECT
The following steps are carried out in order to
carry out the project.
1) About 6 to 7 kg of soil is taken from the field and
put into a hot air oven maintained at (105-110 )°C
for at least 24 hours.
2) The moisture less soil is passed through is passed
through a 4.75mm sieve and collected in a steel
plate. The weight of the tray before and after the
addition of soil is noted.
3) Exactly three kgs of soil is separated for the
compaction test(explained later).
4) From the remaining soil the pyconometer test for
determination of relative density is carried out.

PROCEDURE
First we notice that the soil sample that
we have selected is coarse grained soil
since more than 50% of the soil passing
through the 4.75 mm sieve is retained on
the 0.075 mm sieve. Therefore, we carry
out the proctor test as follows :

STANDARD PROCTOR TEST
The compaction test going to be done is the
standard proctor test.
This test has been devoloped by R.R.Proctor in
1933 and is named after him.
This method describes the procedure for
determining the relationship between the moisture
and density of fine-grained or coarse-grained soils.
Equipment Required
A cylindrical metal mould with a nominal capacity
of 944 cm³ and internal diameter of 100 mm and a
height of 127.3 mm.
Rammer: A metal rammer having a 50 mm
diameter circular face with a 2.7 kg weight which
will drop freely for a distance of 310mm.
Straight-edge: A steel straight-edge approximately
300 mm in length.
Oil and oil brush : This is required for lubricating
the ends of the mold where the collar and base
plate are fixed. It is also applied along the insides
of the curved surface of the mold so that the soil
does not stick to its surface.
Electronic weighing machine : This is required to
weigh the mold with and without the soil.
Shovel : This is required to help in mixing the
water in the soil to attain a desired water content.
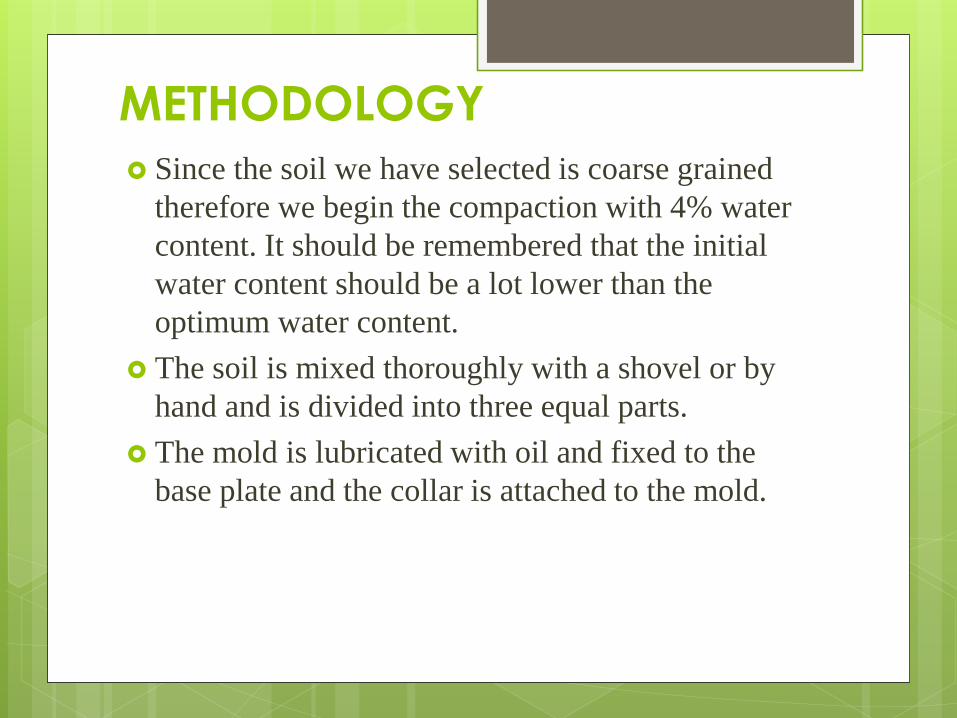
METHODOLOGY
Since the soil we have selected is coarse grained
therefore we begin the compaction with 4% water
content. It should be remembered that the initial
water content should be a lot lower than the
optimum water content.
The soil is mixed thoroughly with a shovel or by
hand and is divided into three equal parts.
The mold is lubricated with oil and fixed to the
base plate and the collar is attached to the mold.
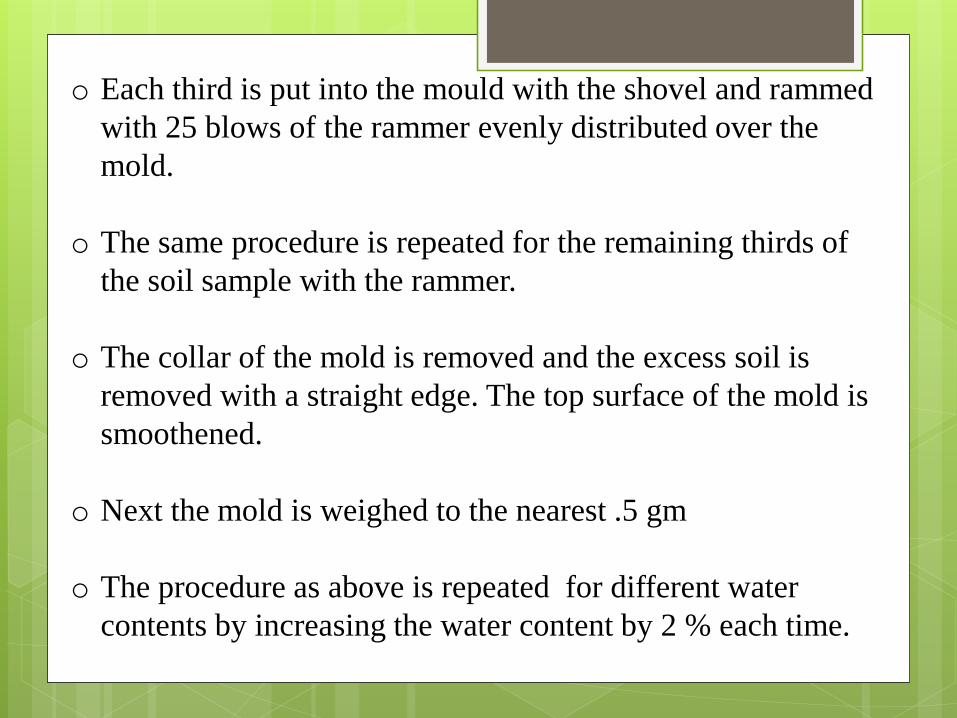
o Each third is put into the mould with the shovel and rammed
with 25 blows of the rammer evenly distributed over the
mold.
o The same procedure is repeated for the remaining thirds of
the soil sample with the rammer.
o The collar of the mold is removed and the excess soil is
removed with a straight edge. The top surface of the mold is
smoothened.
o Next the mold is weighed to the nearest .5 gm
o The procedure as above is repeated for different water
contents by increasing the water content by 2 % each time.
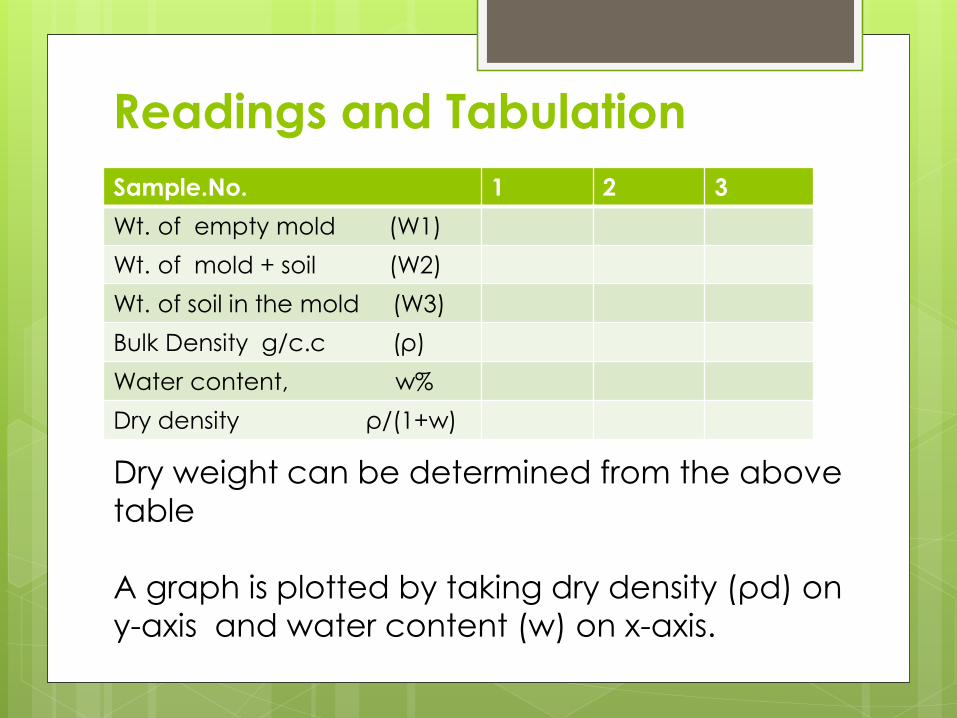
Readings and Tabulation
Sample.No. 1 2 3
Wt. of empty mold (W1)
Wt. of mold + soil (W2)
Wt. of soil in the mold (W3)
Bulk Density g/c.c (ρ)
Water content, w%
Dry density ρ/(1+w)
Dry weight can be determined from the above
table
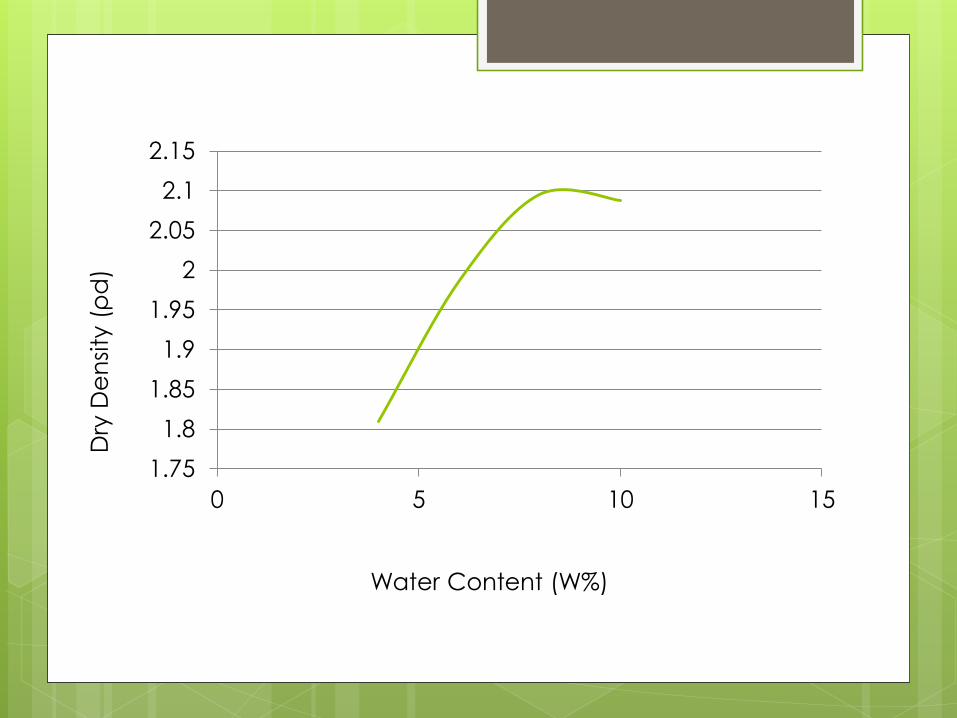
A graph is plotted by taking dry density (ρd) on
y-axis and water content (w) on x-axis.

Wt. of the
mould
(w1)
Wt. of
mould+
soil
(w2)
Wt. of soil
(w3)
w3= w2-
w1
Bulk
density
ρ =
W3/V
Water
content
W%
Dry density
ρd=ρ/1+w
4727.5 6505 1777.5 1.882 4 1.8096
4727.5 6716 1988.5 2.106 6 1.9867
4727.5 6864.5 2137 2.263 8 2.0953
4727.5 6896.5 2169 2.297 10 2.0881
4727.5 6862 2134.5 2.261 12 2.0188
Volume of the mould = 944ml
*Weights are in grams
1.75
1.8
1.85
1.9
1.95
2
2.05
2.1
2.15
0 5 10 15
Water Content (W%)
Dry
De
nsi
ty (ρ
d)
DETERMINATION OF RELATIVE
DENSITY OF SOIL SOLIDS.

After the compaction test is over we determine the relative
density of Soil solids by pyconometer method . In this
method we follow the following methodology:
o The weight of the empty pyconometer is taken (W1).
o Next about 200 grams of soil passing through the 4.75
mm sieve is taken and its weight is recorded (W2).
o Water is added to the pyconometer till the soil sample is
completely submerged in water and pyconometer is left
undisturbed for about half an hour.
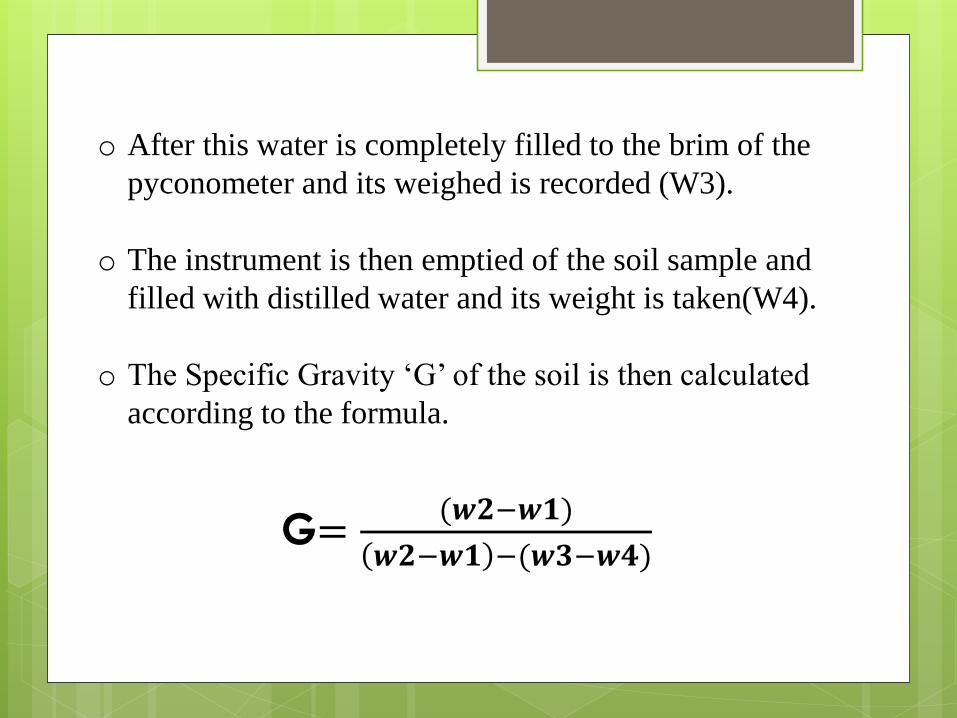
o After this water is completely filled to the brim of the
pyconometer and its weighed is recorded (W3).
o The instrument is then emptied of the soil sample and
filled with distilled water and its weight is taken(W4).
o The Specific Gravity ‘G’ of the soil is then calculated
according to the formula.
G=(𝒘𝟐−𝒘𝟏)
𝒘𝟐−𝒘𝟏 −(𝒘𝟑−𝒘𝟒)

1 2 3
Wt. of empty
pyconometer (w1)
595 595 595
Wt. of
pyconometer+soil
(w2)
844.5 793.5 798.5
Wt. of
pyconometer+soil
+water (w3)
1637.5 1603.5 1607.5
Wt. of
pyconometer +
distilled water (w4)
1492.5 1492.5 1492.5
*Weights are in grams
SPECIFIC GRAVITY DETERMINATION
SPECIFIC GRAVITY (G) = 2.313
o Next, the graph for the dry density and the water content
is plotted by taking water content on the x-axis and dry
density on the y-axis.
o On this graph, we plot the saturation lines corresponding
to 100% saturation, 90%, 80% and so on and so forth till
a saturation line coincides with the maximum dry density
of the soil. This gives us the maximum achievable dry
density and saturation in an ordinary practical laboratory
session.
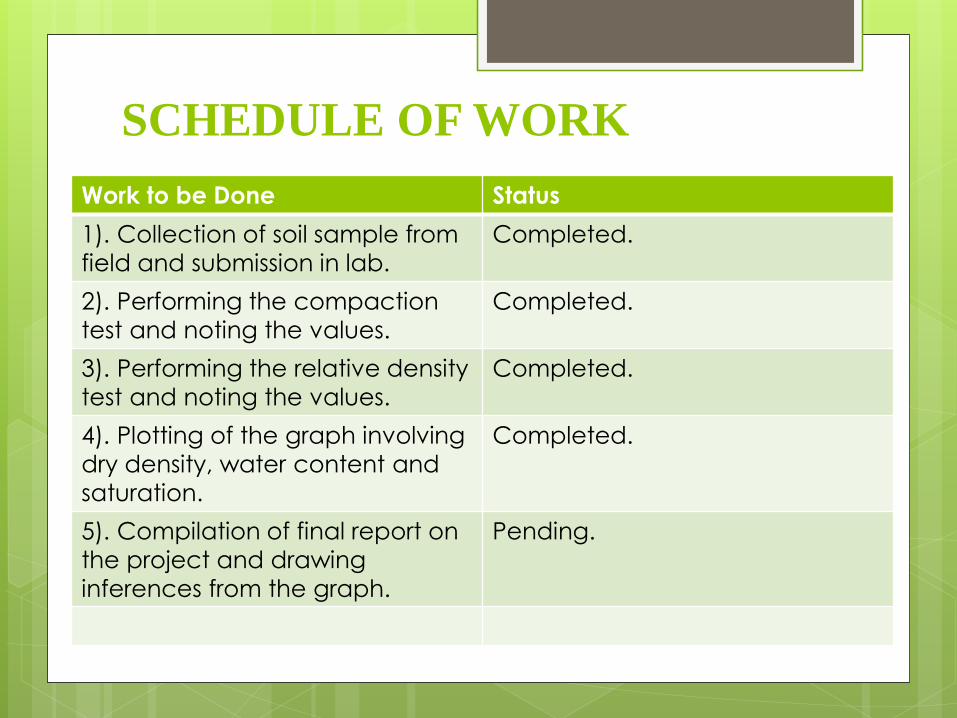
SCHEDULE OF WORK
Work to be Done Status
1). Collection of soil sample from
field and submission in lab.
Completed.
2). Performing the compaction
test and noting the values.
Completed.
3). Performing the relative density
test and noting the values.
Completed.
4). Plotting of the graph involving
dry density, water content and
saturation.
Completed.
5). Compilation of final report on
the project and drawing
inferences from the graph.
Pending.