Community Solar - Department of Energy Community... · including grid resiliency,...
30
Produced By SEPA in conjunction with Solar Market Pathways Community Solar PROGRAM DESIGN MODELS
-
Upload
truongtram -
Category
Documents
-
view
216 -
download
1
Transcript of Community Solar - Department of Energy Community... · including grid resiliency,...
Produced By SEPA in conjunction with Solar Market Pathways
Community SolarPROGRAM DESIGN MODELS
2
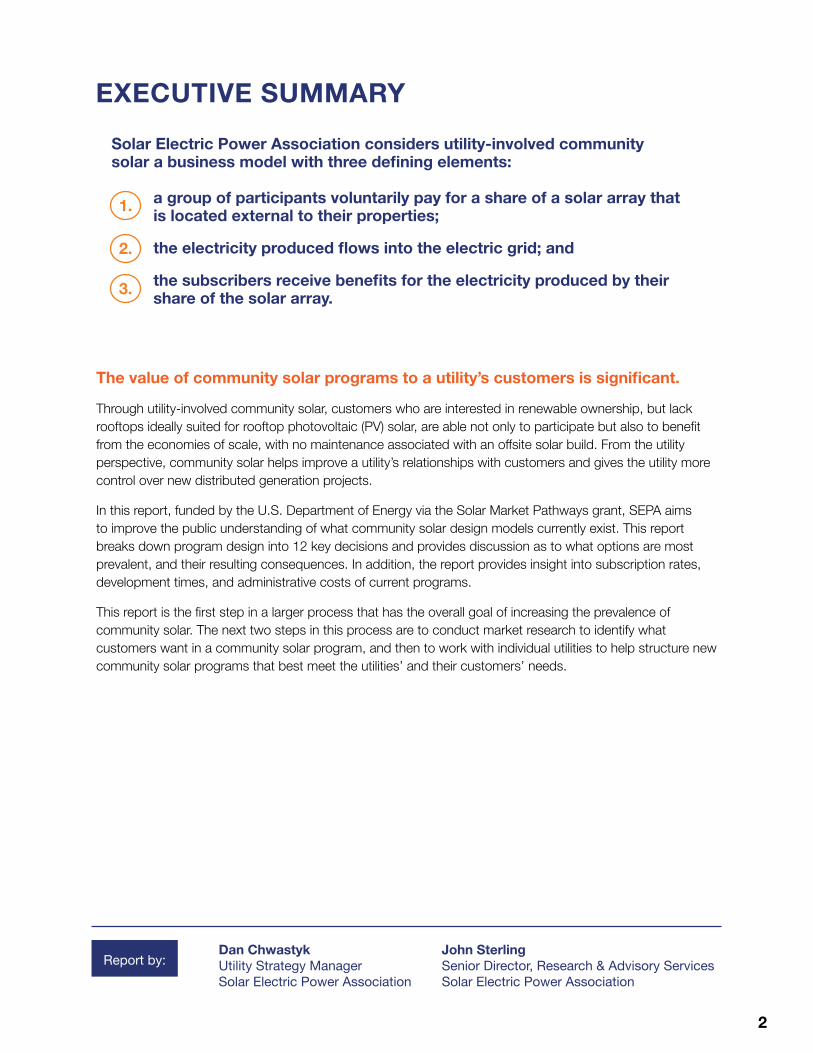
The value of community solar programs to a utility’s customers is significant.
Through utility-involved community solar, customers who are interested in renewable ownership, but lack rooftops ideally suited for rooftop photovoltaic (PV) solar, are able not only to participate but also to benefit from the economies of scale, with no maintenance associated with an offsite solar build. From the utility perspective, community solar helps improve a utility’s relationships with customers and gives the utility more control over new distributed generation projects.
In this report, funded by the U.S. Department of Energy via the Solar Market Pathways grant, SEPA aims to improve the public understanding of what community solar design models currently exist. This report breaks down program design into 12 key decisions and provides discussion as to what options are most prevalent, and their resulting consequences. In addition, the report provides insight into subscription rates, development times, and administrative costs of current programs.
This report is the first step in a larger process that has the overall goal of increasing the prevalence of community solar. The next two steps in this process are to conduct market research to identify what customers want in a community solar program, and then to work with individual utilities to help structure new community solar programs that best meet the utilities’ and their customers’ needs.
Solar Electric Power Association considers utility-involved community solar a business model with three defining elements:
a group of participants voluntarily pay for a share of a solar array that is located external to their properties;
the electricity produced flows into the electric grid; and
the subscribers receive benefits for the electricity produced by their share of the solar array.
EXECUTIVE SUMMARY
3.
2.
1.
Dan Chwastyk Utility Strategy Manager Solar Electric Power Association
John Sterling Senior Director, Research & Advisory Services Solar Electric Power Association
Report by:
3
Solar Market Pathways
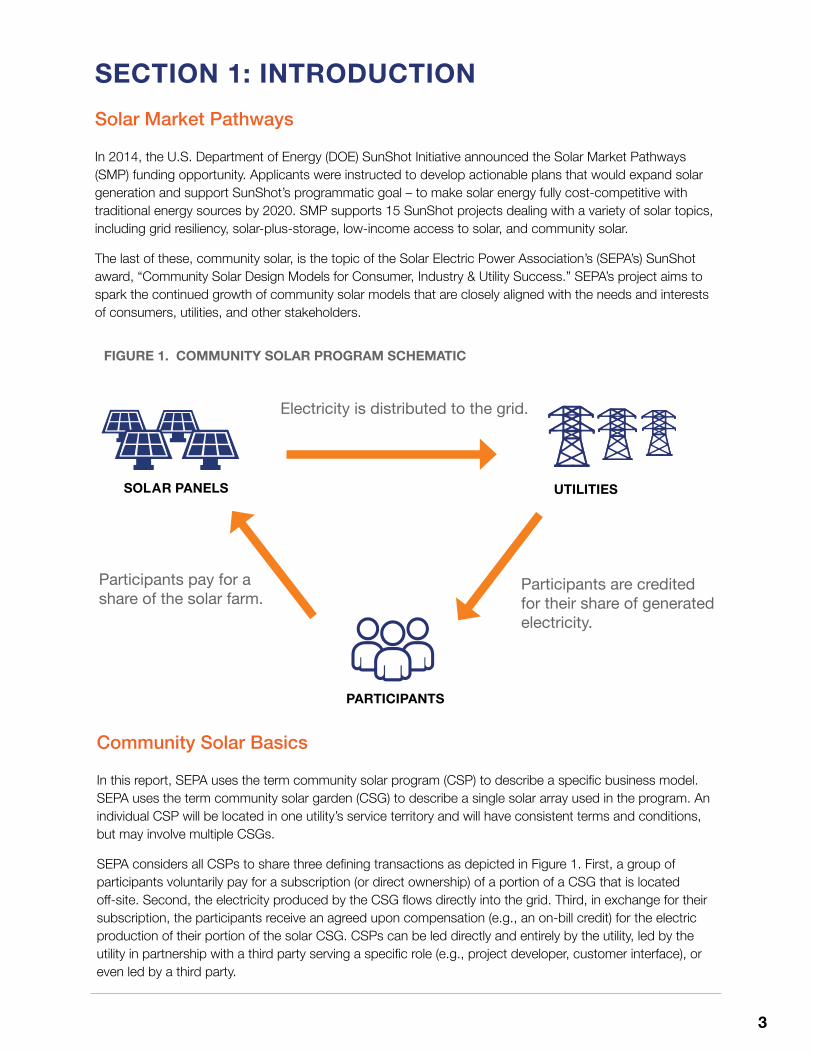
In 2014, the U.S. Department of Energy (DOE) SunShot Initiative announced the Solar Market Pathways (SMP) funding opportunity. Applicants were instructed to develop actionable plans that would expand solar generation and support SunShot’s programmatic goal – to make solar energy fully cost-competitive with traditional energy sources by 2020. SMP supports 15 SunShot projects dealing with a variety of solar topics, including grid resiliency, solar-plus-storage, low-income access to solar, and community solar.
The last of these, community solar, is the topic of the Solar Electric Power Association’s (SEPA’s) SunShot award, “Community Solar Design Models for Consumer, Industry & Utility Success.” SEPA’s project aims to spark the continued growth of community solar models that are closely aligned with the needs and interests of consumers, utilities, and other stakeholders.
Electricity is distributed to the grid.
Participants are credited for their share of generated electricity.
Participants pay for a share of the solar farm.
PARTICIPANTS
SOLAR PANELS UTILITIES
FIGURE 1. COMMUNITY SOLAR PROGRAM SCHEMATIC
Community Solar Basics
In this report, SEPA uses the term community solar program (CSP) to describe a specific business model. SEPA uses the term community solar garden (CSG) to describe a single solar array used in the program. An individual CSP will be located in one utility’s service territory and will have consistent terms and conditions, but may involve multiple CSGs.
SEPA considers all CSPs to share three defining transactions as depicted in Figure 1. First, a group of participants voluntarily pay for a subscription (or direct ownership) of a portion of a CSG that is located off-site. Second, the electricity produced by the CSG flows directly into the grid. Third, in exchange for their subscription, the participants receive an agreed upon compensation (e.g., an on-bill credit) for the electric production of their portion of the solar CSG. CSPs can be led directly and entirely by the utility, led by the utility in partnership with a third party serving a specific role (e.g., project developer, customer interface), or even led by a third party.
SECTION 1: INTRODUCTION
4
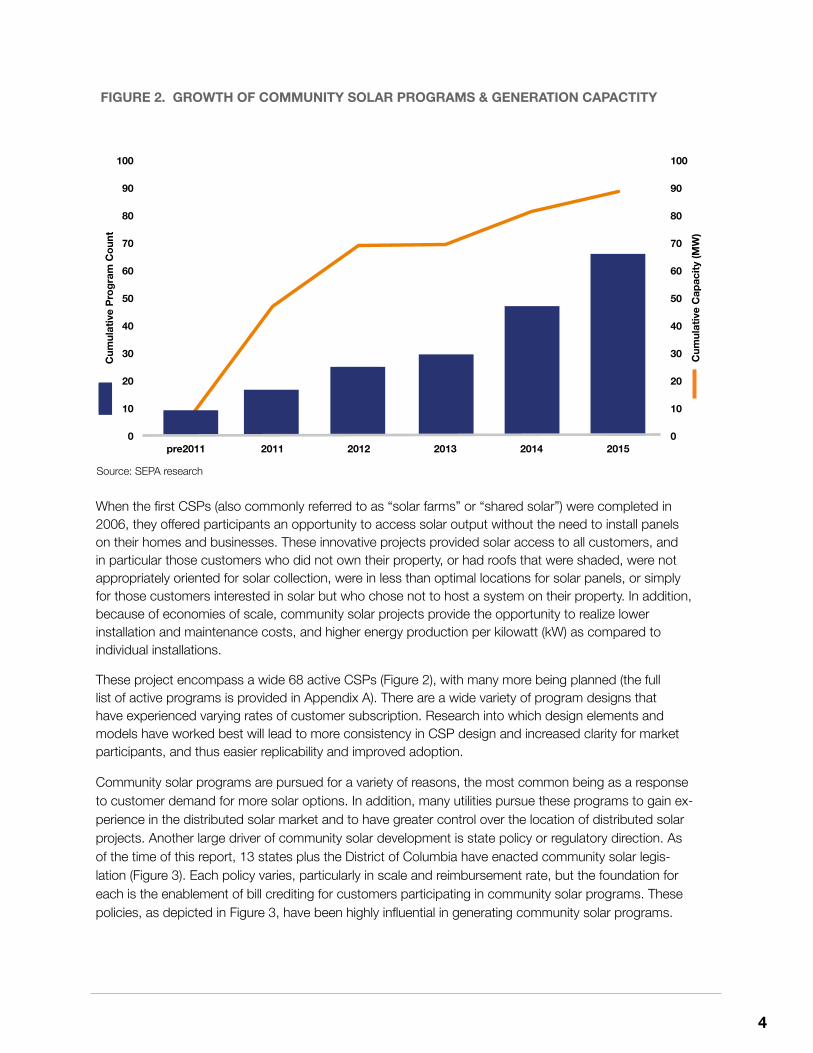
When the first CSPs (also commonly referred to as “solar farms” or “shared solar”) were completed in 2006, they offered participants an opportunity to access solar output without the need to install panels on their homes and businesses. These innovative projects provided solar access to all customers, and in particular those customers who did not own their property, or had roofs that were shaded, were not appropriately oriented for solar collection, were in less than optimal locations for solar panels, or simply for those customers interested in solar but who chose not to host a system on their property. In addition, because of economies of scale, community solar projects provide the opportunity to realize lower installation and maintenance costs, and higher energy production per kilowatt (kW) as compared to individual installations.
These project encompass a wide 68 active CSPs (Figure 2), with many more being planned (the full list of active programs is provided in Appendix A). There are a wide variety of program designs that have experienced varying rates of customer subscription. Research into which design elements and models have worked best will lead to more consistency in CSP design and increased clarity for market participants, and thus easier replicability and improved adoption.
Community solar programs are pursued for a variety of reasons, the most common being as a response to customer demand for more solar options. In addition, many utilities pursue these programs to gain ex-perience in the distributed solar market and to have greater control over the location of distributed solar projects. Another large driver of community solar development is state policy or regulatory direction. As of the time of this report, 13 states plus the District of Columbia have enacted community solar legis-lation (Figure 3). Each policy varies, particularly in scale and reimbursement rate, but the foundation for each is the enablement of bill crediting for customers participating in community solar programs. These policies, as depicted in Figure 3, have been highly influential in generating community solar programs.
0
10
20
30
40
50
60
70
80
90
100
0
10
20
30
40
50
60
70
80
90
100
pre2011 2011 2012 2013 2014 2015
Cum
ulat
ive
Cap
acity
(MW
)
Cum
ulat
ive
Prog
ram
Cou
nt
Community Solar Program Growth
FIGURE 2. GROWTH OF COMMUNITY SOLAR PROGRAMS & GENERATION CAPACTITY
Source: SEPA research
5
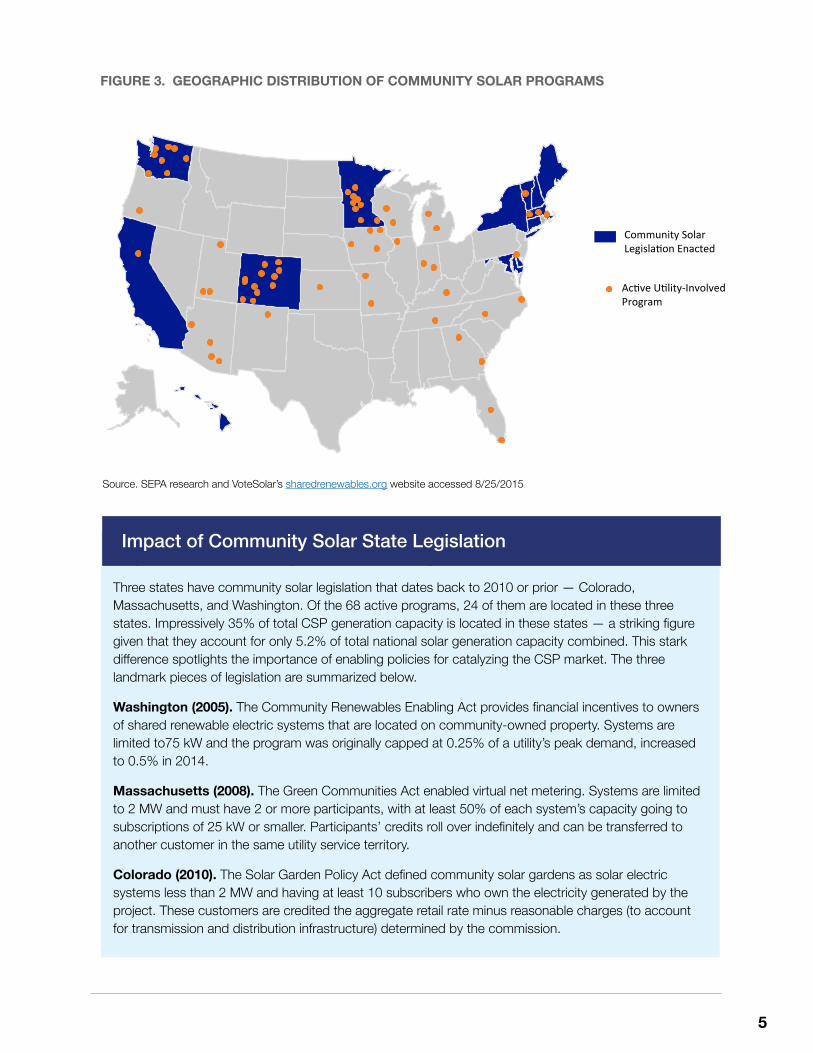
Impact of Community Solar State LegislationThree states have community solar legislation that dates back to 2010 or prior — Colorado, Massachusetts, and Washington. Of the 68 active programs, 24 of them are located in these three states. Impressively 35% of total CSP generation capacity is located in these states — a striking figure given that they account for only 5.2% of total national solar generation capacity combined. This stark difference spotlights the importance of enabling policies for catalyzing the CSP market. The three landmark pieces of legislation are summarized below.
Washington (2005). The Community Renewables Enabling Act provides financial incentives to owners of shared renewable electric systems that are located on community-owned property. Systems are limited to75 kW and the program was originally capped at 0.25% of a utility’s peak demand, increased to 0.5% in 2014.
Massachusetts (2008). The Green Communities Act enabled virtual net metering. Systems are limited to 2 MW and must have 2 or more participants, with at least 50% of each system’s capacity going to subscriptions of 25 kW or smaller. Participants’ credits roll over indefinitely and can be transferred to another customer in the same utility service territory.
Colorado (2010). The Solar Garden Policy Act defined community solar gardens as solar electric systems less than 2 MW and having at least 10 subscribers who own the electricity generated by the project. These customers are credited the aggregate retail rate minus reasonable charges (to account for transmission and distribution infrastructure) determined by the commission.
FIGURE 3. GEOGRAPHIC DISTRIBUTION OF COMMUNITY SOLAR PROGRAMS
Source. SEPA research and VoteSolar’s sharedrenewables.org website accessed 8/25/2015
Impact of Community Solar State Legislation
Ac$ve U$lity-‐Involved Program
Community Solar Legisla$on Enacted
6
SEPA’s Community Solar ResearchSEPA kicked off work on the SMP grant in early 2015. Joining SEPA on this project is the Shelton Group, a leading marketing communications firm focused exclusively on energy and the environment.1 A working group of 20 organizations including utilities, solar developers, program implementation companies, state governments, nongovernmental organizations, and consumer advocacy organizations supports the project and provides strategic direction and input (Figure 4). By researching and comparing models, conducting market research and disseminating results to the industry, SEPA and this working group are producing a range of standardized, streamlined, and cost-effective CSP business models that can be easily localized for different regions across the country.
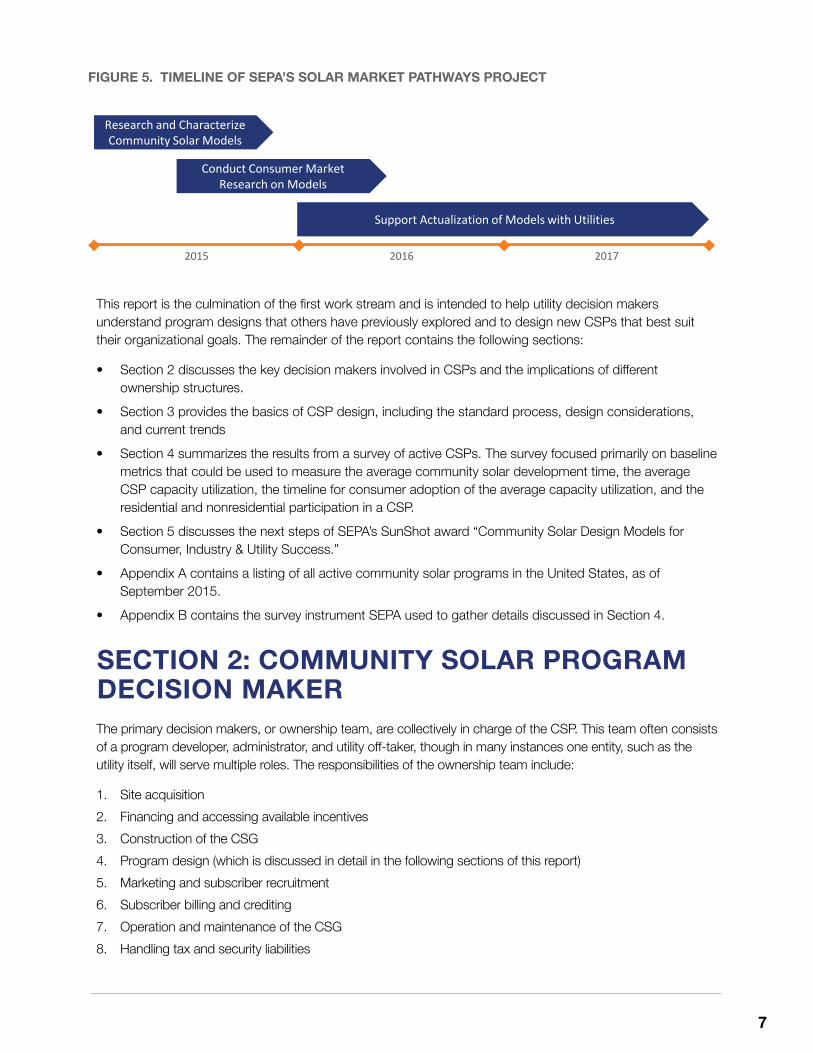
As depicted in Figure 5, the project has three work streams that will be conducted over three years. Firstly, research has been conducted to characterize existing community solar models and analyze design elements that affect the uptake of the CSP. This research has been informed with input from the working group members. In addition, part of this research concerns how CSP models and transactions could be designed to meet different customer and utility value propositions.
Secondly, SEPA, together with the Shelton Group, will conduct consumer market outreach to gain insights on how consumers view CSPs, and vet the most promising models. This market research will cover multiple geographic regions, customer demographics, utility types, and market structures so that the results can be broadly applicable across the country. Based on the results of these focus groups and national surveys, SEPA and the Shelton Group will highlight best practices in identifying and marketing to target participants from various demographic groups.
Lastly, SEPA will provide technical assistance to organizations interested in modifying their existing CSP or implementing a new CSP. These organizations will be selected through two open solicitation processes in 2016. The ultimate goal of these technical assistance engagements is to facilitate the installation of at least 4 megawatts (MW) of community solar, leveraging the models and research developed during this process. More information on the final two work streams are provided in Section 5 of this report.
FIGURE 4. SOLAR MARKET PATHWAY WORKING GROUP
1 More information on the Shelton Group can be found at: http://sheltongrp.com/
7
This report is the culmination of the first work stream and is intended to help utility decision makers understand program designs that others have previously explored and to design new CSPs that best suit their organizational goals. The remainder of the report contains the following sections:
• Section 2 discusses the key decision makers involved in CSPs and the implications of different ownership structures.
• Section 3 provides the basics of CSP design, including the standard process, design considerations, and current trends
• Section 4 summarizes the results from a survey of active CSPs. The survey focused primarily on baseline metrics that could be used to measure the average community solar development time, the average CSP capacity utilization, the timeline for consumer adoption of the average capacity utilization, and the residential and nonresidential participation in a CSP.
• Section 5 discusses the next steps of SEPA’s SunShot award “Community Solar Design Models for Consumer, Industry & Utility Success.”
• Appendix A contains a listing of all active community solar programs in the United States, as of September 2015.
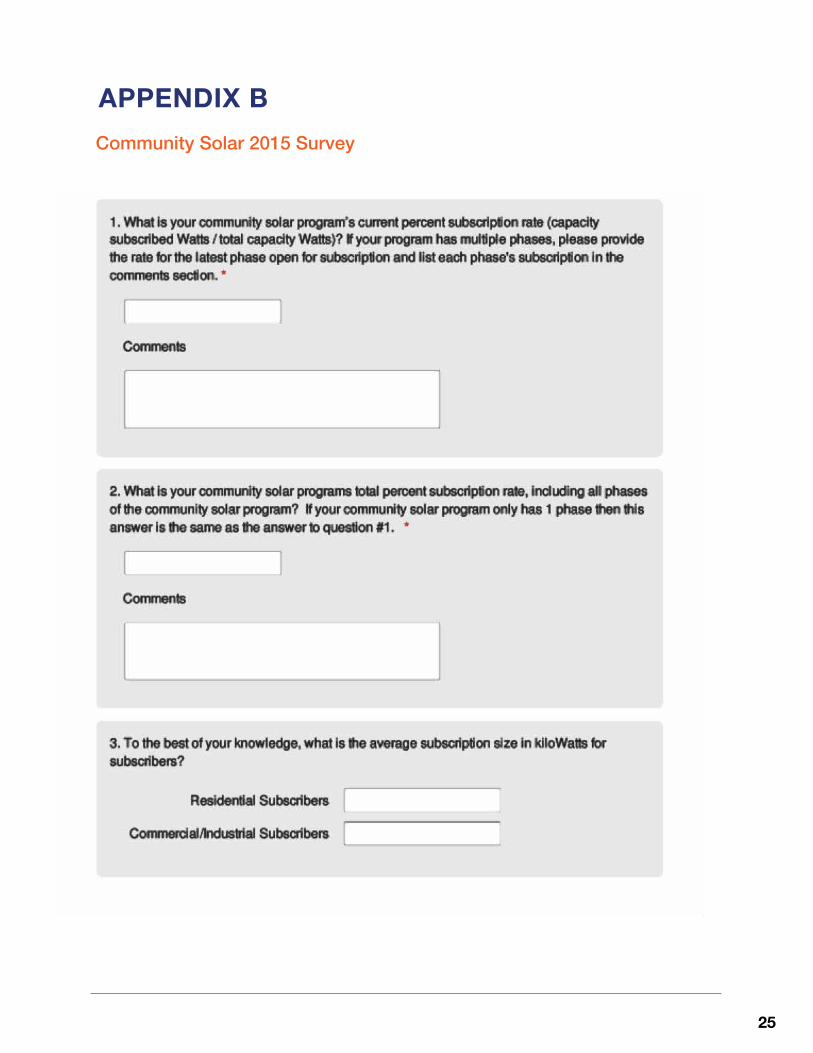
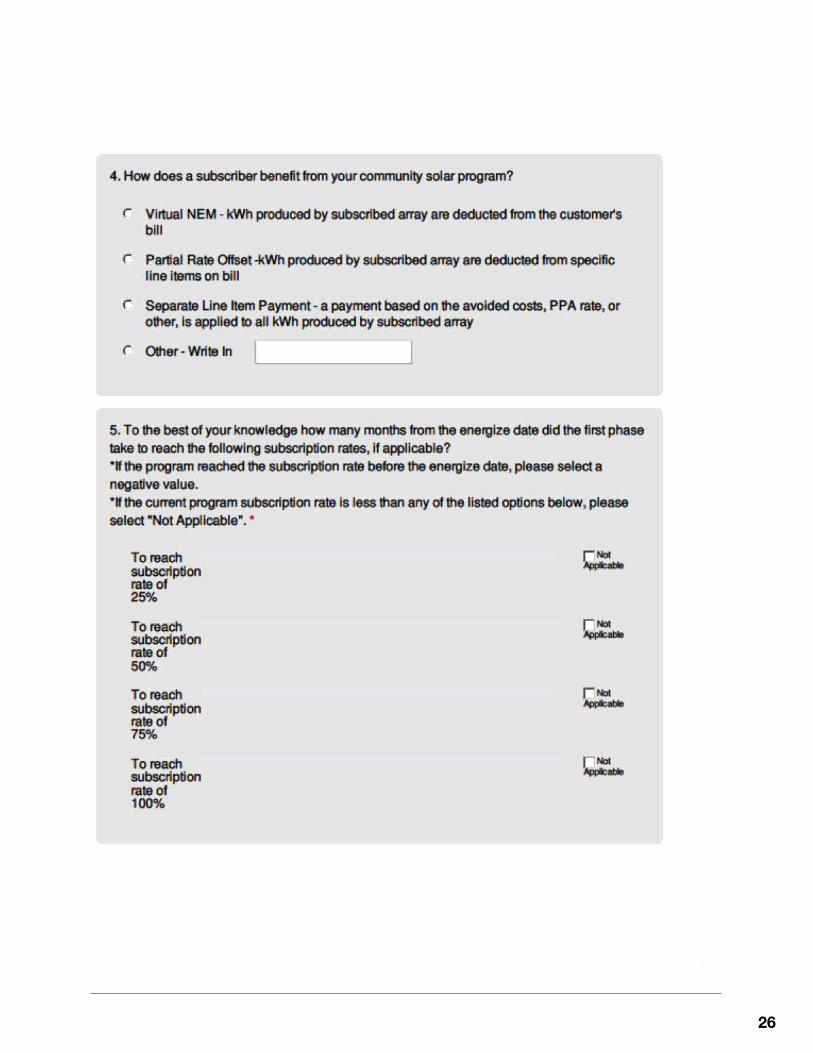
• Appendix B contains the survey instrument SEPA used to gather details discussed in Section 4.
The primary decision makers, or ownership team, are collectively in charge of the CSP. This team often consists of a program developer, administrator, and utility off-taker, though in many instances one entity, such as the utility itself, will serve multiple roles. The responsibilities of the ownership team include:
1. Site acquisition2. Financing and accessing available incentives3. Construction of the CSG4. Program design (which is discussed in detail in the following sections of this report)5. Marketing and subscriber recruitment6. Subscriber billing and crediting7. Operation and maintenance of the CSG8. Handling tax and security liabilities
Research and Characterize Community Solar Models
Conduct Consumer Market Research on Models
Support Actualization of Models with Utilities
2015 2016 2017
FIGURE 5. TIMELINE OF SEPA’S SOLAR MARKET PATHWAYS PROJECT
SECTION 2: COMMUNITY SOLAR PROGRAM DECISION MAKER
8
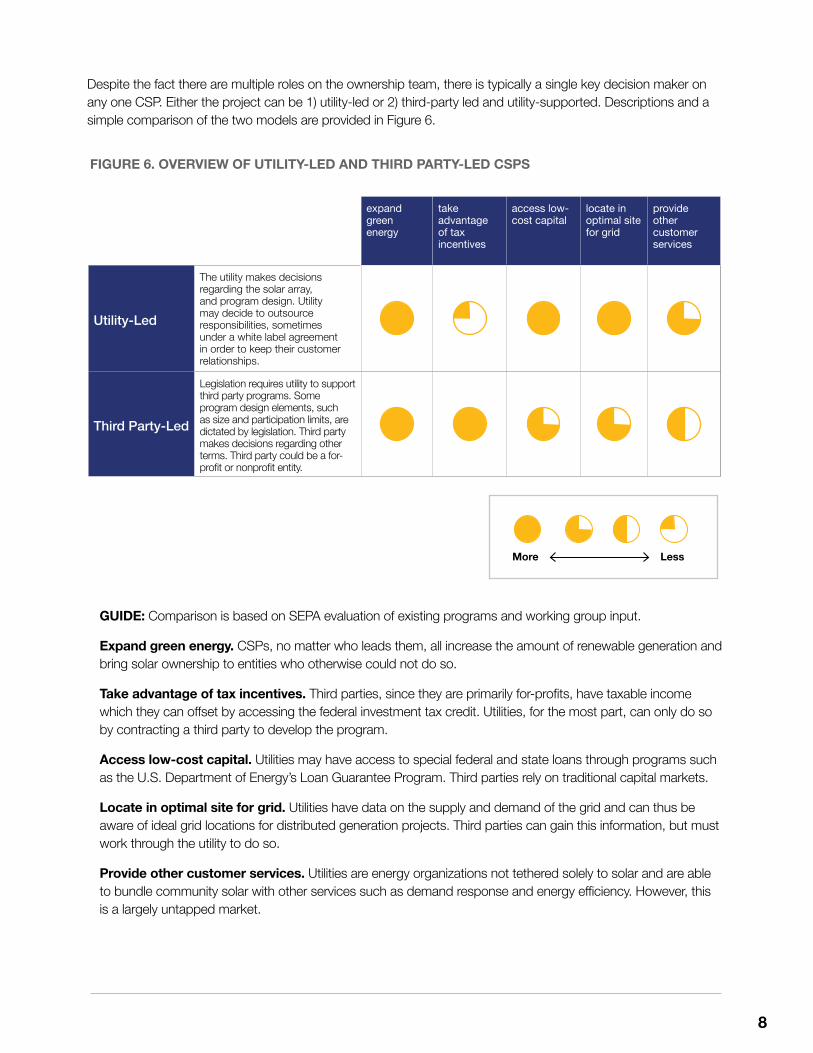
GUIDE: Comparison is based on SEPA evaluation of existing programs and working group input.
Expand green energy. CSPs, no matter who leads them, all increase the amount of renewable generation and bring solar ownership to entities who otherwise could not do so.
Take advantage of tax incentives. Third parties, since they are primarily for-profits, have taxable income which they can offset by accessing the federal investment tax credit. Utilities, for the most part, can only do so by contracting a third party to develop the program.
Access low-cost capital. Utilities may have access to special federal and state loans through programs such as the U.S. Department of Energy’s Loan Guarantee Program. Third parties rely on traditional capital markets.
Locate in optimal site for grid. Utilities have data on the supply and demand of the grid and can thus be aware of ideal grid locations for distributed generation projects. Third parties can gain this information, but must work through the utility to do so.
Provide other customer services. Utilities are energy organizations not tethered solely to solar and are able to bundle community solar with other services such as demand response and energy efficiency. However, this is a largely untapped market.
expand green energy
take advantage of tax incentives
access low-cost capital
locate in optimal site for grid
provide other customer services
Utility-Led
The utility makes decisions regarding the solar array, and program design. Utility may decide to outsource responsibilities, sometimes under a white label agreement in order to keep their customer relationships.
Third Party-Led
Legislation requires utility to support third party programs. Some program design elements, such as size and participation limits, are dictated by legislation. Third party makes decisions regarding other terms. Third party could be a for-profit or nonprofit entity.
More Less
FIGURE 6. OVERVIEW OF UTILITY-LED AND THIRD PARTY-LED CSPS
Despite the fact there are multiple roles on the ownership team, there is typically a single key decision maker on any one CSP. Either the project can be 1) utility-led or 2) third-party led and utility-supported. Descriptions and a simple comparison of the two models are provided in Figure 6.

9
Most readers are interested in how to design a community solar program that meets objectives, responds to local or regional desires, and delivers successful results for all stakeholders. This section presents our method to design a successful program based on an understanding and comparison of existing programs across the nation.
Each community solar program is designed differently, making it a challenge to compare success across programs on an apples-to-apples basis. To create a methodology to define success, SEPA suggests considering whether three criteria are met. They are:
• Is the program fully subscribed?• Does the program return value to all rate-payers in an economically balanced and equitable manner?• Are subscribers satisfied with the program?
Based on this evaluation, community solar programs experience highly varying levels of success. For example, the Orlando Utilities Commission(OUC) has, what many consider to be one of the most successful programs. Launched in 2012, OUC was able to fully subscribe its 400 kilowatt (kW) program in under a week. Based on continued demand and positive feedback – there was more than 1 MW of demand on the waiting list in the summer of 2015 – they are currently in the process of expanding their program. In contrast, Florida Keys Electric Cooperative’s (FKEC’s) Simple Solar program, launched in 2010, struggled in its early stages to get participation, and had less than 10% of the available panels leased as late as 2014.
So the big question is, of the two programs based in Florida why did OUC succeed while FKEC struggled? Though many factors are at play, including the widely different economic conditions in 2010 versus 2012, SEPA has identified a four-step process for program design, which can help utilities ensure the best chance of community solar program success.
Four Steps to Community Solar Program Success
Identify clear program goals and conduct due diligence on your local market to ascertain whether these goals are feasible.
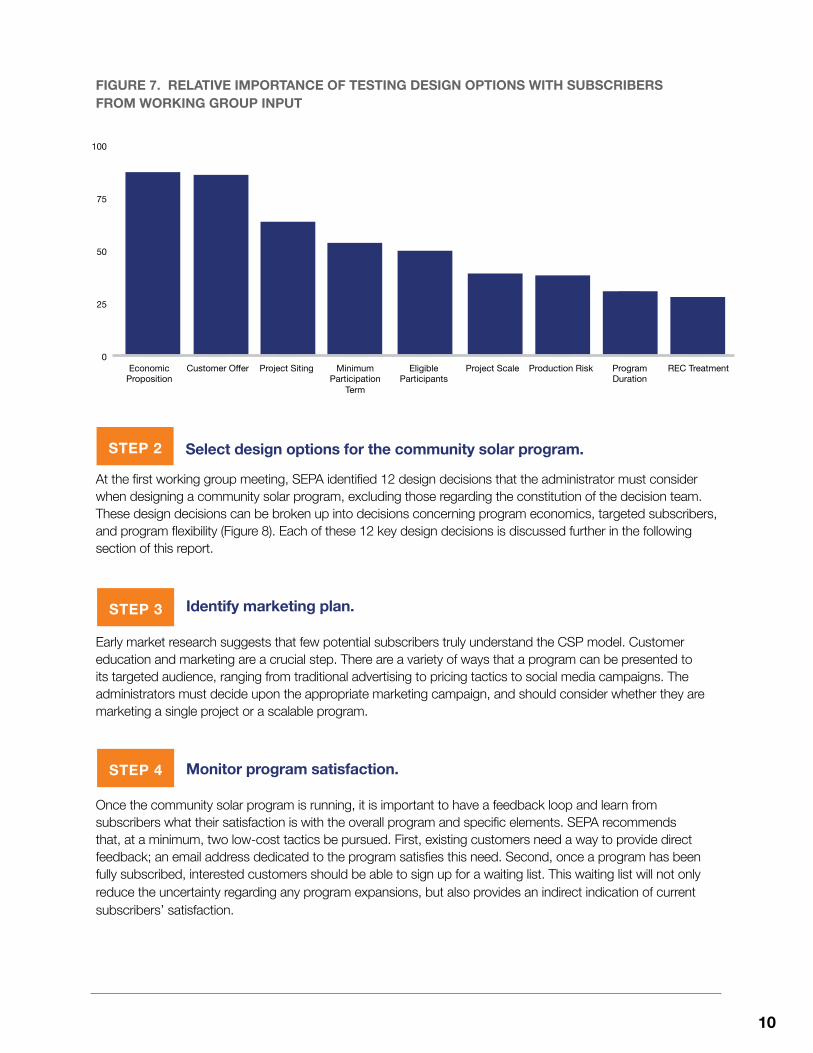
Commonly cited goals for community solar programs include providing increased renewable energy options for all customers, responding to the expressed needs of a select set of customers highly interested in solar, creating options for customers that compare equitably to rooftop solar, and educating consumers about solar power basics. The goal has an influence on program design. The administrator should look into ways other programs have been designed and speak with other administrators about their design processes. Additionally, it is highly recommended that the administrators hears the customer’s voices through focus groups, customer surveys, or open meetings, in an effort to better understand their customers’ needs and areas where a program can and cannot make design tradeoffs (e.g., siting in a remote location in order to reduce costs). It is important to frame these discussions in a way that will help indicate actual behavior of the customers or members rather than simply finding out if they like the concept of community solar or of a particular design. The working group identified the elements depicted in Figure 7 as those most in need of customer input. The design options in the horizontal axis are defined and discussed in detail in the following section.
STEP 1
SECTION 3: COMMUNITY SOLAR PROGRAM DESIGN
10
Economic Proposition
87
Customer Offer
86
Project Siting
63
Minimum Participation Term
53
Eligible Participants
49
Project Scale
39
Production Risk
38
Program Duration
31
REC Treatment
28
0
25
50
75
100
Economic Proposition
Customer Offer Project Siting Minimum Participation
Term
Eligible Participants
Project Scale Production Risk Program Duration
REC Treatment
Select design options for the community solar program.
At the first working group meeting, SEPA identified 12 design decisions that the administrator must consider when designing a community solar program, excluding those regarding the constitution of the decision team. These design decisions can be broken up into decisions concerning program economics, targeted subscribers, and program flexibility (Figure 8). Each of these 12 key design decisions is discussed further in the following section of this report.
Identify marketing plan.
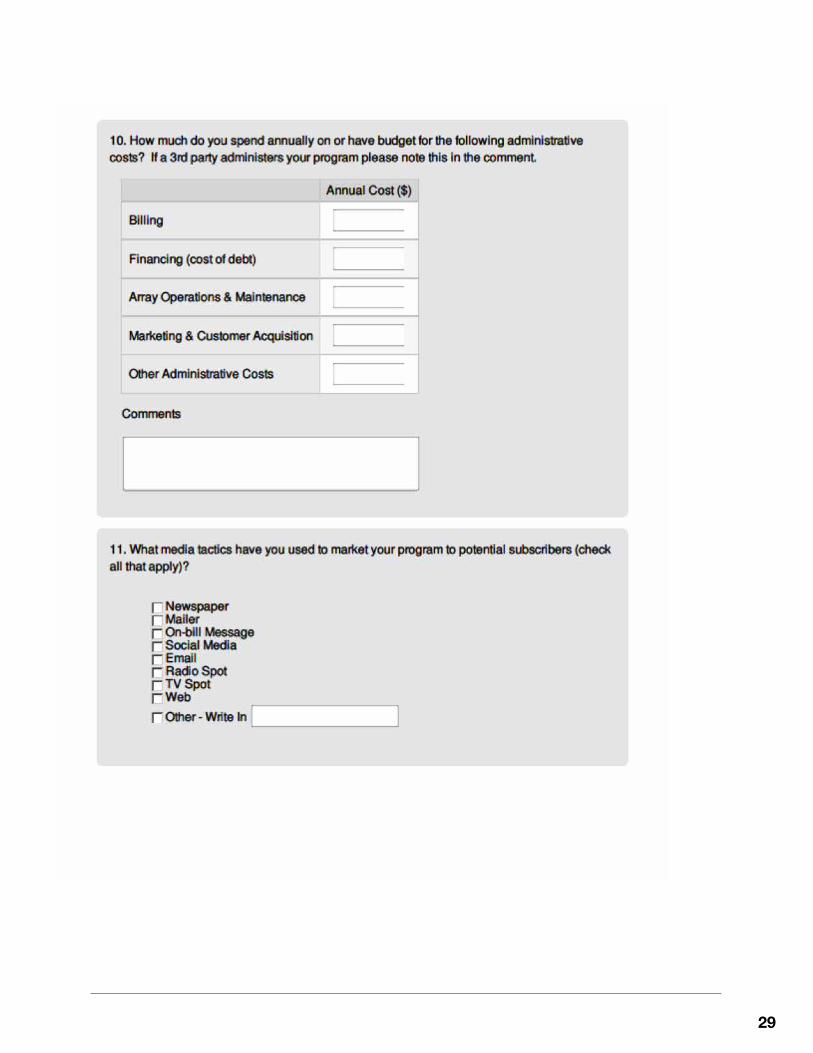
Early market research suggests that few potential subscribers truly understand the CSP model. Customer education and marketing are a crucial step. There are a variety of ways that a program can be presented to its targeted audience, ranging from traditional advertising to pricing tactics to social media campaigns. The administrators must decide upon the appropriate marketing campaign, and should consider whether they are marketing a single project or a scalable program.
Monitor program satisfaction.
Once the community solar program is running, it is important to have a feedback loop and learn from subscribers what their satisfaction is with the overall program and specific elements. SEPA recommends that, at a minimum, two low-cost tactics be pursued. First, existing customers need a way to provide direct feedback; an email address dedicated to the program satisfies this need. Second, once a program has been fully subscribed, interested customers should be able to sign up for a waiting list. This waiting list will not only reduce the uncertainty regarding any program expansions, but also provides an indirect indication of current subscribers’ satisfaction.
FIGURE 7. RELATIVE IMPORTANCE OF TESTING DESIGN OPTIONS WITH SUBSCRIBERS FROM WORKING GROUP INPUT
STEP 3
STEP 4
STEP 2
11 2 The common options included in this table are not meant to be all-inclusive, but to serve as indicators of typical decisions seen in programs today.3 These percentages are based on number of programs and are not weighted by MW or other factors.
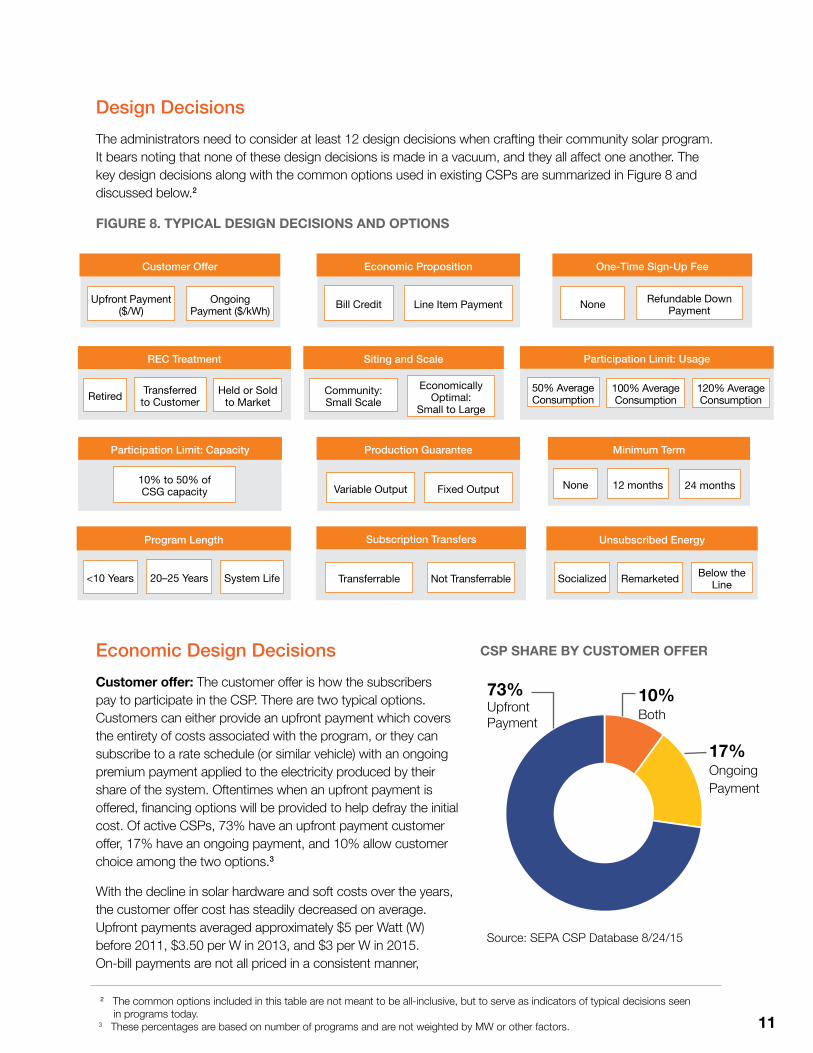
Design DecisionsThe administrators need to consider at least 12 design decisions when crafting their community solar program. It bears noting that none of these design decisions is made in a vacuum, and they all affect one another. The key design decisions along with the common options used in existing CSPs are summarized in Figure 8 and discussed below.2
Economic Design DecisionsCustomer offer: The customer offer is how the subscribers pay to participate in the CSP. There are two typical options. Customers can either provide an upfront payment which covers the entirety of costs associated with the program, or they can subscribe to a rate schedule (or similar vehicle) with an ongoing premium payment applied to the electricity produced by their share of the system. Oftentimes when an upfront payment is offered, financing options will be provided to help defray the initial cost. Of active CSPs, 73% have an upfront payment customer offer, 17% have an ongoing payment, and 10% allow customer choice among the two options.3
With the decline in solar hardware and soft costs over the years, the customer offer cost has steadily decreased on average. Upfront payments averaged approximately $5 per Watt (W) before 2011, $3.50 per W in 2013, and $3 per W in 2015. On-bill payments are not all priced in a consistent manner,
FIGURE 8. TYPICAL DESIGN DECISIONS AND OPTIONS
CSP SHARE BY CUSTOMER OFFER
Source: SEPA CSP Database 8/24/15
17% Ongoing Payment
10% Both
73% Upfront Payment
Customer Offer
Upfront Payment ($/W)
Ongoing Payment ($/kWh)
Economic Proposition
Bill Credit Line Item Payment
One-Time Sign-Up Fee
None Refundable Down Payment
REC Treatment
Retired Transferred to Customer
Siting and Scale
Community: Small Scale
Economically Optimal:
Small to Large
Participation Limit: Usage
50% Average Consumption
100% Average Consumption
Participation Limit: Capacity
10% to 50% of CSG capacity
Production Guarantee
Variable Output Fixed Output
Minimum Term
None 12 months
120% Average Consumption
Held or Sold to Market
24 months
Program Length Subscription Transfers
Transferrable Not Transferrable
Unsubscribed Energy
Socialized Remarketed Below the Line<10 Years 20–25 Years System Life
12
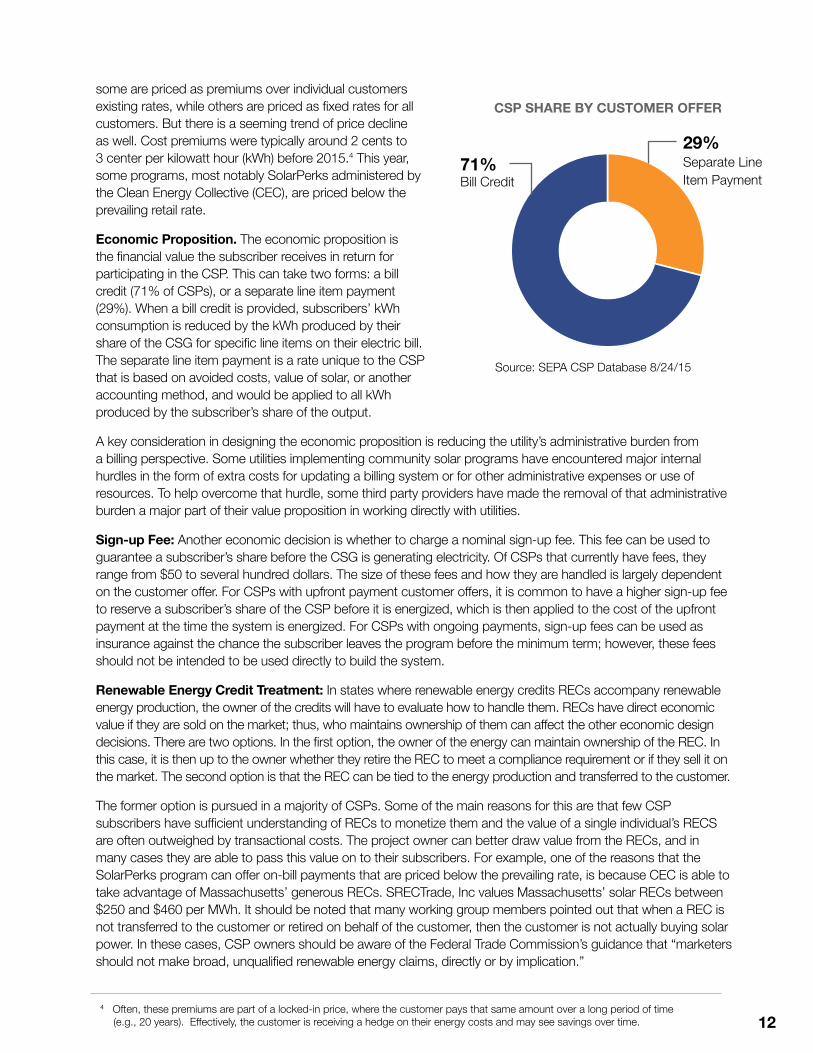
some are priced as premiums over individual customers existing rates, while others are priced as fixed rates for all customers. But there is a seeming trend of price decline as well. Cost premiums were typically around 2 cents to 3 center per kilowatt hour (kWh) before 2015.4 This year, some programs, most notably SolarPerks administered by the Clean Energy Collective (CEC), are priced below the prevailing retail rate.
Economic Proposition. The economic proposition is the financial value the subscriber receives in return for participating in the CSP. This can take two forms: a bill credit (71% of CSPs), or a separate line item payment (29%). When a bill credit is provided, subscribers’ kWh consumption is reduced by the kWh produced by their share of the CSG for specific line items on their electric bill. The separate line item payment is a rate unique to the CSP that is based on avoided costs, value of solar, or another accounting method, and would be applied to all kWh produced by the subscriber’s share of the output.
A key consideration in designing the economic proposition is reducing the utility’s administrative burden from a billing perspective. Some utilities implementing community solar programs have encountered major internal hurdles in the form of extra costs for updating a billing system or for other administrative expenses or use of resources. To help overcome that hurdle, some third party providers have made the removal of that administrative burden a major part of their value proposition in working directly with utilities.
Sign-up Fee: Another economic decision is whether to charge a nominal sign-up fee. This fee can be used to guarantee a subscriber’s share before the CSG is generating electricity. Of CSPs that currently have fees, they range from $50 to several hundred dollars. The size of these fees and how they are handled is largely dependent on the customer offer. For CSPs with upfront payment customer offers, it is common to have a higher sign-up fee to reserve a subscriber’s share of the CSP before it is energized, which is then applied to the cost of the upfront payment at the time the system is energized. For CSPs with ongoing payments, sign-up fees can be used as insurance against the chance the subscriber leaves the program before the minimum term; however, these fees should not be intended to be used directly to build the system.
Renewable Energy Credit Treatment: In states where renewable energy credits RECs accompany renewable energy production, the owner of the credits will have to evaluate how to handle them. RECs have direct economic value if they are sold on the market; thus, who maintains ownership of them can affect the other economic design decisions. There are two options. In the first option, the owner of the energy can maintain ownership of the REC. In this case, it is then up to the owner whether they retire the REC to meet a compliance requirement or if they sell it on the market. The second option is that the REC can be tied to the energy production and transferred to the customer.
The former option is pursued in a majority of CSPs. Some of the main reasons for this are that few CSP subscribers have sufficient understanding of RECs to monetize them and the value of a single individual’s RECS are often outweighed by transactional costs. The project owner can better draw value from the RECs, and in many cases they are able to pass this value on to their subscribers. For example, one of the reasons that the SolarPerks program can offer on-bill payments that are priced below the prevailing rate, is because CEC is able to take advantage of Massachusetts’ generous RECs. SRECTrade, Inc values Massachusetts’ solar RECs between $250 and $460 per MWh. It should be noted that many working group members pointed out that when a REC is not transferred to the customer or retired on behalf of the customer, then the customer is not actually buying solar power. In these cases, CSP owners should be aware of the Federal Trade Commission’s guidance that “marketers should not make broad, unqualified renewable energy claims, directly or by implication.”
29% Separate Line Item Payment
71% Bill Credit
CSP SHARE BY CUSTOMER OFFER
Source: SEPA CSP Database 8/24/15
4 Often, these premiums are part of a locked-in price, where the customer pays that same amount over a long period of time (e.g., 20 years). Effectively, the customer is receiving a hedge on their energy costs and may see savings over time.
13
5 For purposes of clarity, “community-based,” from a location perspective, is meant to imply physically located inside a specific geographic area and intended (in whole or in part) for participants that reside near the facility. 6 Please note, it is assumed that the project owner will make best efforts from an O&M perspective to maintain system availability and maximize production. This category simply suggests that customers can be offered a product that is guaranteed from an output perspective (either over a month, season, or year), or receive the variable output that is common with these types of resources.
Targeted Subscriber DecisionsSite and Scale: The design decisions of siting and the scale of individual CSGs are intricately linked. Initially, SEPA expected that there may be large demand from customers for siting the program within their community, in a visible location.5 This would most emulate the prestige effect of rooftop solar as an indicator of customer values, including environmental and social values. In contradiction to this belief, recent customer feedback suggests that siting in a visible location is not as high of a priority as siting in locations that provide the lowest cost. During focus groups held by the Shelton Group, in August of 2015, a majority of customers voiced a strong desire for siting and scale that provide the lowest costs. It is perhaps in response to this demand that a majority of existing CSGs are located at sites, such as brownfields and utility owned property, which may provide more economic value and convenience to the grid.
Project siting can intrinsically impact the size of each installation. Developing community-based systems may result in smaller projects, as they may be more land constrained. Conversely, siting in more remote locations can allow for much larger projects that take advantage of economies of scale. A third alternative under consideration is locational deployment. This concept is to identify places on the distribution system that could benefit from the addition of local generation. While the systems may be smaller in size (akin to community-based installations), the added benefits from strategic siting could be monetized and passed on to subscribers, making the program more economic.
Participation Limits: Participation limits are implemented to ensure that multiple subscribers can benefit from the CSP. A majority of existing CSPs have at least one of two typical types of participation limits: usage limits and capacity limits. A usage limits caps subscription levels to a certain percentage of the subscriber’s average consumption. The cap ranges between 50% and 120% of consumption in existing programs. One of the reasons why these caps are enacted is that allowing subscriptions far beyond an individual’s demand makes it more closely resemble an investment security than an electric contract. CSPs with usage limits at the lower end of this range allow for more subscribers to participate in the program; however, the tradeoff to this benefit is that there is also a greater risk of under-subscription.
A capacity limit caps subscription levels to a number of panels or kWs, and there are often varying limits for residential and nonresidential subscribers. Capacity limits are often targeted at commercial and industrial subscribers, and are enacted so that these subscribers are unable to take all of a single project.
Program Flexibility DecisionsProduction Guarantee: Solar is an intermittent generation resource. The actual output of the community solar system is uncertain and will vary based on time of year and weather factors, and will change over time due to system degradation. This uncertainty is a risk. Administrators need to decide whether they will bear this risk by guaranteeing subscribers a fixed number of kWh output, or if they will pass the risk along to the participant by offering a variable output that is tied to the actual production of the system.6 It is important for design purposes to note that a CSP with a guaranteed, fixed number of kWh can never be fully subscribed — a portion of the program’s capacity needs to be available in the case that actual production is less than guaranteed production. For a variety of reasons, over 90% of current CSPs provide a variable output tied to actual production.
Many utilities have expressed that without providing a variable output, a CSP would fail to serve one of its chief goals, educating customers about solar power. The flip side of this argument is that providing some guarantee makes the CSP more attractive to risk-averse subscribers.
14
Minimum Term: This design decision is only applicable to programs with an on-bill payment customer offer, though not all programs with an on-bill payment need to have a minimum term. Minimum terms are predominantly 12 or 24 months long in existing CSPs. This safeguards against subscribers joining the program during the summer months, when the solar output is highest, and leaving in the winter. You can either enforce a minimum term by having a sign-up fee that is refundable after the term is complete, or by having a penalty for leaving before the end of the term. Because penalties can be difficult to collect, particularly if the subscriber moves from the service territory, the former option is recommended.
Program Length: The program length is the amount of time a subscriber can receive benefits from the CSP. The program length is a commitment by the CSP administrator to the subscriber, not the reverse. Early customer research has shown that it is very important to clearly communicate this. Potential subscribers who misinterpret long program lengths as being their commitment can be quickly scared off from participating in the CSP. The program lengths of existing CSPs vary, but many guarantee the benefits of the transaction for up to 20 to 25 years. Since solar panels have longer lives, this means how the panels will be used after the program length will need to be addressed, although this only needs to be addressed during the CSP design stage if the program length is short. It is highly encouraged that the administrator considers the expected payback period of the program, and design a greater program length so that customers receive a lifetime benefit.
One state that provides some notable exceptions to the typical 20- to 25-year program length is Washington. Washington’s Renewable Energy Credit program can provide CSP subscribers up to $1.08 per kWh produced by their share of a community solar project. These credits are scheduled to last through 2020. For this reason, some of the CSPs in WA, including a program administered by Seattle City Light (SCL), have programs that end in 2020. This corresponds to an eight-year program length for the earliest of SCL’s subscribers. Since 2020 is in the near term from a utility resource planning perspective, SCL has already decided that ownership of the solar panels will revert to the host sites after that point.
Subscription Transfers: The subscription transfer design decision addresses when subscribers are eligible to pass their subscription to another party and how such transfers are transacted. Allowing subscribers to transfer their subscription at any point provides full flexibility but can cause higher administrative fees. The less-costly option, chosen in most CSPs, is to only allow transfers when a subscriber moves out of the service territory. In the event of a transfer, the burden of finding a new participant can fall on the subscriber or the CSP administrator.
An example of a program that provides maximum flexibility to subscribers seeking to transfer their share is Heartland Power Cooperative’s Community Solar Project. Subscribers pay an upfront fee of $700 at the start of the program, which provides them a 20-year lease to the output of a 315-W solar panel. When they wish to transfer their subscription, Heartland guarantees to buy it back at a prorated price that is provided in the customer agreement. The price declines 5% per year, corresponding to a 20-year linear depreciation of the asset.
Additionally, a tangential consideration is subscription portability. That is, whether a participant can remain on the program if they move residences within the same territory. Allowing for portability provides value to the customer and to the CSP owner, and best practices would suggest that all CSPs address and allow this option.
Unsubscribed Energy: The final design decision is how the costs of any unsubscribed portion of the CSP will be handled. There are three typical ways that CSP owners plan for unsubscribed energy. The utility can “socialize” it, meaning cost recovery for the unsubscribed portion of the system is spread out across all other ratepayers. The energy can be “remarketed,” either from the utility to a separate buyer, or for third party-led programs, back to the utility at an avoided cost-rate. Finally, the utility can handle the costs below the line, meaning the costs are effectively unrecovered from a traditional ratemaking perspective.
15
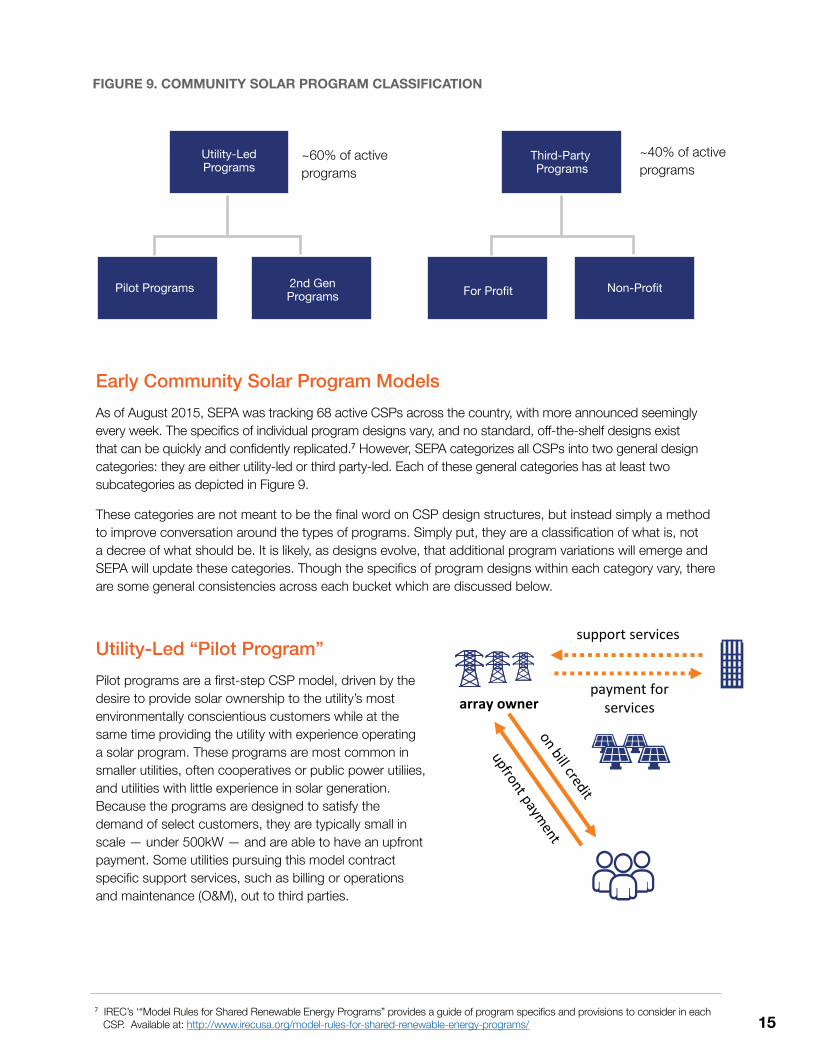
Early Community Solar Program ModelsAs of August 2015, SEPA was tracking 68 active CSPs across the country, with more announced seemingly every week. The specifics of individual program designs vary, and no standard, off-the-shelf designs exist that can be quickly and confidently replicated.7 However, SEPA categorizes all CSPs into two general design categories: they are either utility-led or third party-led. Each of these general categories has at least two subcategories as depicted in Figure 9.
These categories are not meant to be the final word on CSP design structures, but instead simply a method to improve conversation around the types of programs. Simply put, they are a classification of what is, not a decree of what should be. It is likely, as designs evolve, that additional program variations will emerge and SEPA will update these categories. Though the specifics of program designs within each category vary, there are some general consistencies across each bucket which are discussed below.
Utility-Led “Pilot Program”Pilot programs are a first-step CSP model, driven by the desire to provide solar ownership to the utility’s most environmentally conscientious customers while at the same time providing the utility with experience operating a solar program. These programs are most common in smaller utilities, often cooperatives or public power utiliies, and utilities with little experience in solar generation. Because the programs are designed to satisfy the demand of select customers, they are typically small in scale — under 500kW — and are able to have an upfront payment. Some utilities pursuing this model contract specific support services, such as billing or operations and maintenance (O&M), out to third parties.
Pilot Programs 2nd Gen Programs For Profit Non-Profit
Utility-Led Programs
Third-Party Programs
FIGURE 9. COMMUNITY SOLAR PROGRAM CLASSIFICATION
payment for servicesarray owner
support services
~60% of active programs
~40% of active programs
7 IREC’s ‘“Model Rules for Shared Renewable Energy Programs” provides a guide of program specifics and provisions to consider in each CSP. Available at: http://www.irecusa.org/model-rules-for-shared-renewable-energy-programs/
16
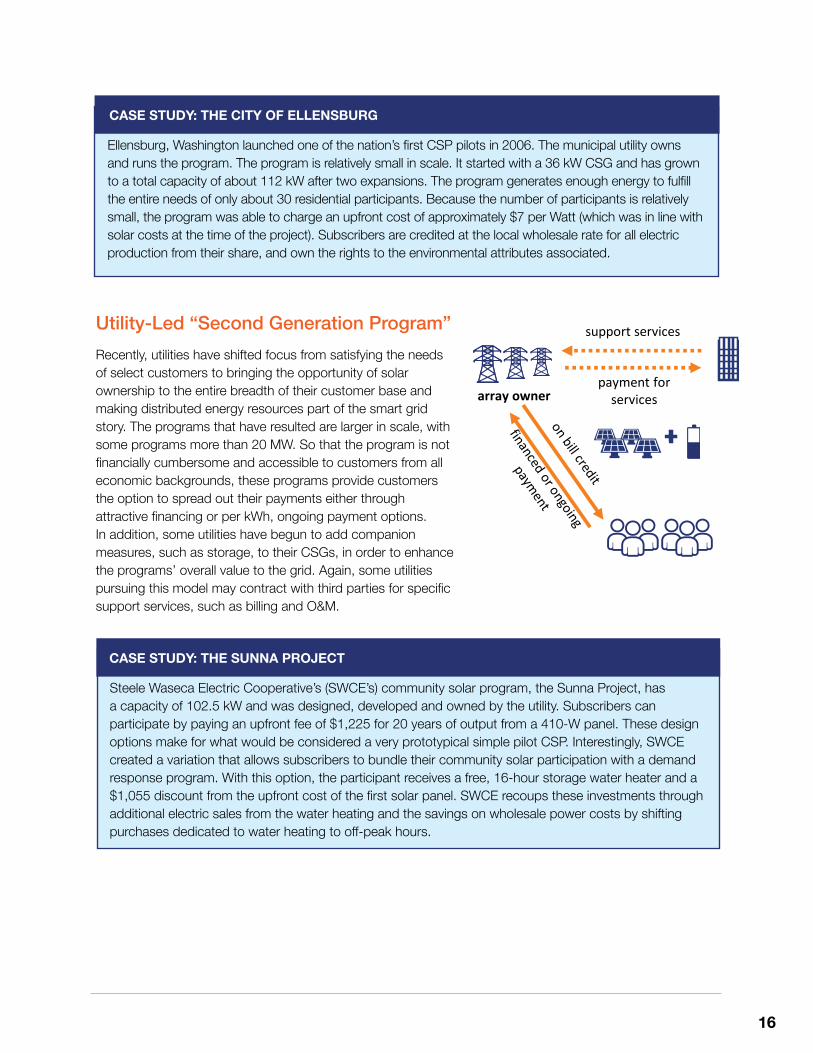
Utility-Led “Second Generation Program”Recently, utilities have shifted focus from satisfying the needs of select customers to bringing the opportunity of solar ownership to the entire breadth of their customer base and making distributed energy resources part of the smart grid story. The programs that have resulted are larger in scale, with some programs more than 20 MW. So that the program is not financially cumbersome and accessible to customers from all economic backgrounds, these programs provide customers the option to spread out their payments either through attractive financing or per kWh, ongoing payment options. In addition, some utilities have begun to add companion measures, such as storage, to their CSGs, in order to enhance the programs’ overall value to the grid. Again, some utilities pursuing this model may contract with third parties for specific support services, such as billing and O&M.
CASE STUDY: THE SUNNA PROJECT Steele Waseca Electric Cooperative’s (SWCE’s) community solar program, the Sunna Project, has a capacity of 102.5 kW and was designed, developed and owned by the utility. Subscribers can participate by paying an upfront fee of $1,225 for 20 years of output from a 410-W panel. These design options make for what would be considered a very prototypical simple pilot CSP. Interestingly, SWCE created a variation that allows subscribers to bundle their community solar participation with a demand response program. With this option, the participant receives a free, 16-hour storage water heater and a $1,055 discount from the upfront cost of the first solar panel. SWCE recoups these investments through additional electric sales from the water heating and the savings on wholesale power costs by shifting purchases dedicated to water heating to off-peak hours.
CASE STUDY: THE CITY OF ELLENSBURG Ellensburg, Washington launched one of the nation’s first CSP pilots in 2006. The municipal utility owns and runs the program. The program is relatively small in scale. It started with a 36 kW CSG and has grown to a total capacity of about 112 kW after two expansions. The program generates enough energy to fulfill the entire needs of only about 30 residential participants. Because the number of participants is relatively small, the program was able to charge an upfront cost of approximately $7 per Watt (which was in line with solar costs at the time of the project). Subscribers are credited at the local wholesale rate for all electric production from their share, and own the rights to the environmental attributes associated.
payment for servicesarray owner
support services
CASE STUDY: THE SUNNA PROJECT
CASE STUDY: THE CITY OF ELLENSBURG
17
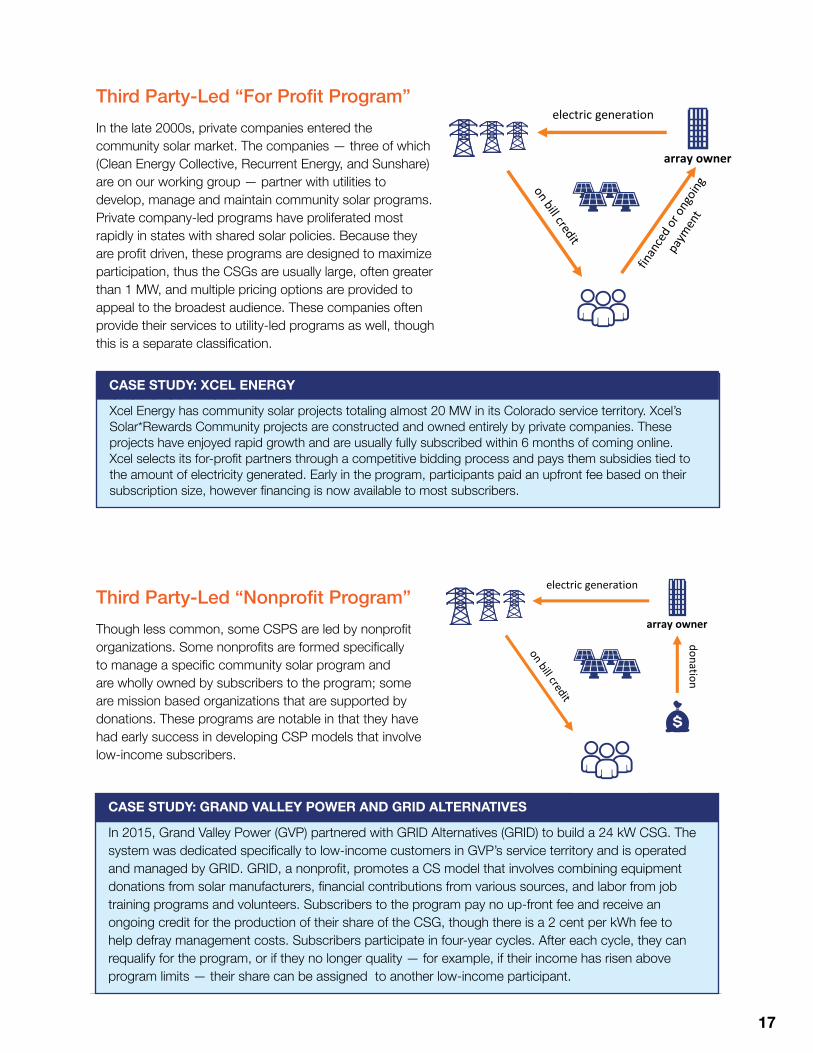
Third Party-Led “For Profit Program”In the late 2000s, private companies entered the community solar market. The companies — three of which (Clean Energy Collective, Recurrent Energy, and Sunshare) are on our working group — partner with utilities to develop, manage and maintain community solar programs. Private company-led programs have proliferated most rapidly in states with shared solar policies. Because they are profit driven, these programs are designed to maximize participation, thus the CSGs are usually large, often greater than 1 MW, and multiple pricing options are provided to appeal to the broadest audience. These companies often provide their services to utility-led programs as well, though this is a separate classification.
Third Party-Led “Nonprofit Program” Though less common, some CSPS are led by nonprofit organizations. Some nonprofits are formed specifically to manage a specific community solar program and are wholly owned by subscribers to the program; some are mission based organizations that are supported by donations. These programs are notable in that they have had early success in developing CSP models that involve low-income subscribers.
CASE STUDY: XCEL ENERGY Xcel Energy has community solar projects totaling almost 20 MW in its Colorado service territory. Xcel’s Solar*Rewards Community projects are constructed and owned entirely by private companies. These projects have enjoyed rapid growth and are usually fully subscribed within 6 months of coming online. Xcel selects its for-profit partners through a competitive bidding process and pays them subsidies tied to the amount of electricity generated. Early in the program, participants paid an upfront fee based on their subscription size, however financing is now available to most subscribers.
CASE STUDY: GRAND VALLEY POWER & GRID ALTERNATIVES In 2015, Grand Valley Power (GVP) partnered with GRID Alternatives (GRID) to build a 24 kW CSG. The system was dedicated specifically to low-income customers in GVP’s service territory and is operated and managed by GRID. GRID, a nonprofit, promotes a CS model that involves combining equipment donations from solar manufacturers, financial contributions from various sources, and labor from job training programs and volunteers. Subscribers to the program pay no up-front fee and receive an ongoing credit for the production of their share of the CSG, though there is a 2 cent per kWh fee to help defray management costs. Subscribers participate in four-year cycles. After each cycle, they can requalify for the program, or if they no longer quality — for example, if their income has risen above program limits — their share can be assigned to another low-income participant.
array owner
electric generation
electric generation
array owner
donation
CASE STUDY: GRAND VALLEY POWER AND GRID ALTERNATIVES
CASE STUDY: XCEL ENERGY
18
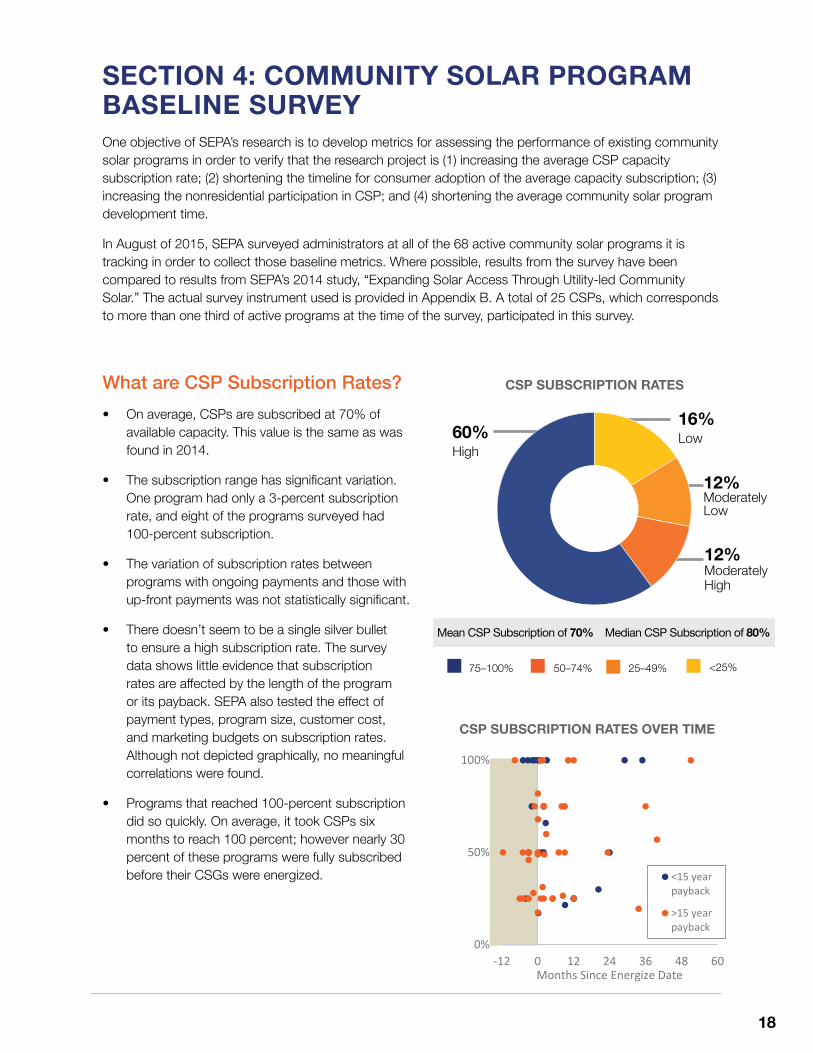
One objective of SEPA’s research is to develop metrics for assessing the performance of existing community solar programs in order to verify that the research project is (1) increasing the average CSP capacity subscription rate; (2) shortening the timeline for consumer adoption of the average capacity subscription; (3) increasing the nonresidential participation in CSP; and (4) shortening the average community solar program development time.
In August of 2015, SEPA surveyed administrators at all of the 68 active community solar programs it is tracking in order to collect those baseline metrics. Where possible, results from the survey have been compared to results from SEPA’s 2014 study, “Expanding Solar Access Through Utility-led Community Solar.” The actual survey instrument used is provided in Appendix B. A total of 25 CSPs, which corresponds to more than one third of active programs at the time of the survey, participated in this survey.
What are CSP Subscription Rates?• On average, CSPs are subscribed at 70% of
available capacity. This value is the same as was found in 2014.
• The subscription range has significant variation. One program had only a 3-percent subscription rate, and eight of the programs surveyed had 100-percent subscription.
• The variation of subscription rates between programs with ongoing payments and those with up-front payments was not statistically significant.
• There doesn’t seem to be a single silver bullet to ensure a high subscription rate. The survey data shows little evidence that subscription rates are affected by the length of the program or its payback. SEPA also tested the effect of payment types, program size, customer cost, and marketing budgets on subscription rates. Although not depicted graphically, no meaningful correlations were found.
• Programs that reached 100-percent subscription did so quickly. On average, it took CSPs six months to reach 100 percent; however nearly 30 percent of these programs were fully subscribed before their CSGs were energized.
0%
50%
100%
-12 0 12 24 36 48 60Months Since Energize Date
<15 yearpayback
>15 yearpayback
SECTION 4: COMMUNITY SOLAR PROGRAM BASELINE SURVEY
CSP SUBSCRIPTION RATES
CSP SUBSCRIPTION RATES OVER TIME
16% Low
12% Moderately Low
60% High
12% Moderately High
75–100% <25% 25–49%50–74%
Mean CSP Subscription of 70% Median CSP Subscription of 80%
19
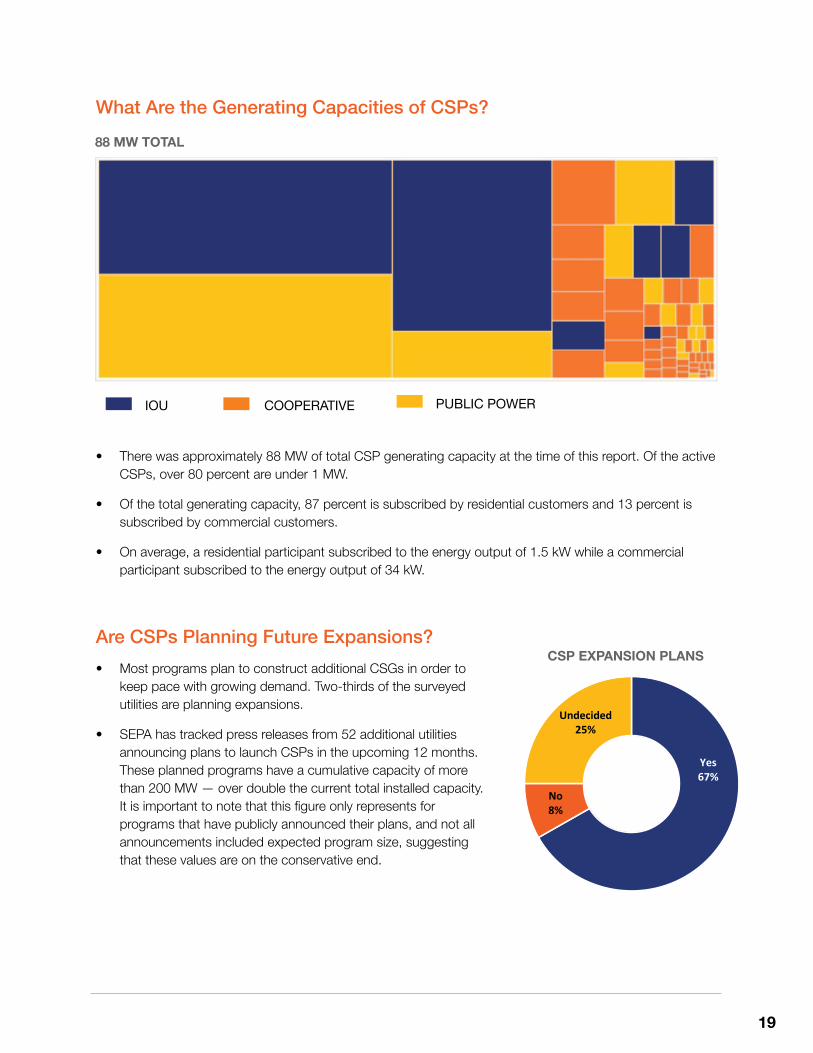
What Are the Generating Capacities of CSPs?
• There was approximately 88 MW of total CSP generating capacity at the time of this report. Of the active CSPs, over 80 percent are under 1 MW.
• Of the total generating capacity, 87 percent is subscribed by residential customers and 13 percent is subscribed by commercial customers.
• On average, a residential participant subscribed to the energy output of 1.5 kW while a commercial participant subscribed to the energy output of 34 kW.
Are CSPs Planning Future Expansions?• Most programs plan to construct additional CSGs in order to
keep pace with growing demand. Two-thirds of the surveyed utilities are planning expansions.
• SEPA has tracked press releases from 52 additional utilities announcing plans to launch CSPs in the upcoming 12 months. These planned programs have a cumulative capacity of more than 200 MW — over double the current total installed capacity. It is important to note that this figure only represents for programs that have publicly announced their plans, and not all announcements included expected program size, suggesting that these values are on the conservative end.
IOU COOPERATIVE PUBLIC POWER
88 MW TOTAL
Yes67%
Undecided25%
No8%
CSP EXPANSION PLANS
20
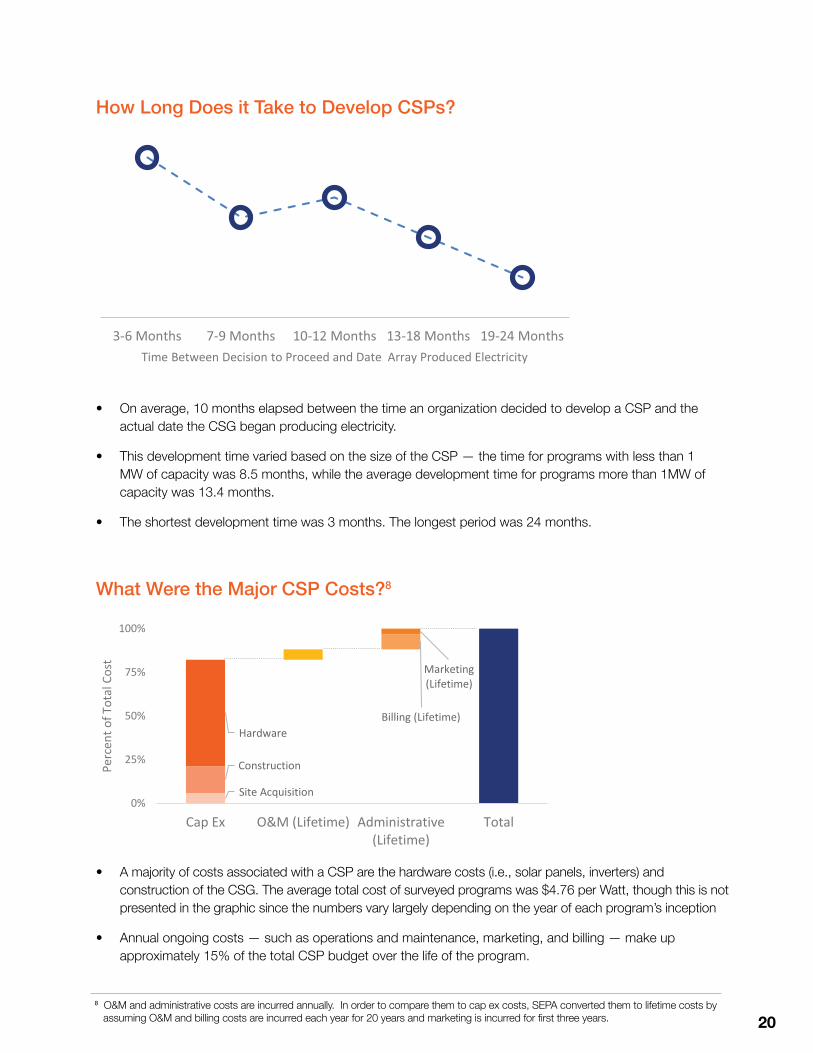
How Long Does it Take to Develop CSPs?
• On average, 10 months elapsed between the time an organization decided to develop a CSP and the actual date the CSG began producing electricity.
• This development time varied based on the size of the CSP — the time for programs with less than 1 MW of capacity was 8.5 months, while the average development time for programs more than 1MW of capacity was 13.4 months.
• The shortest development time was 3 months. The longest period was 24 months.
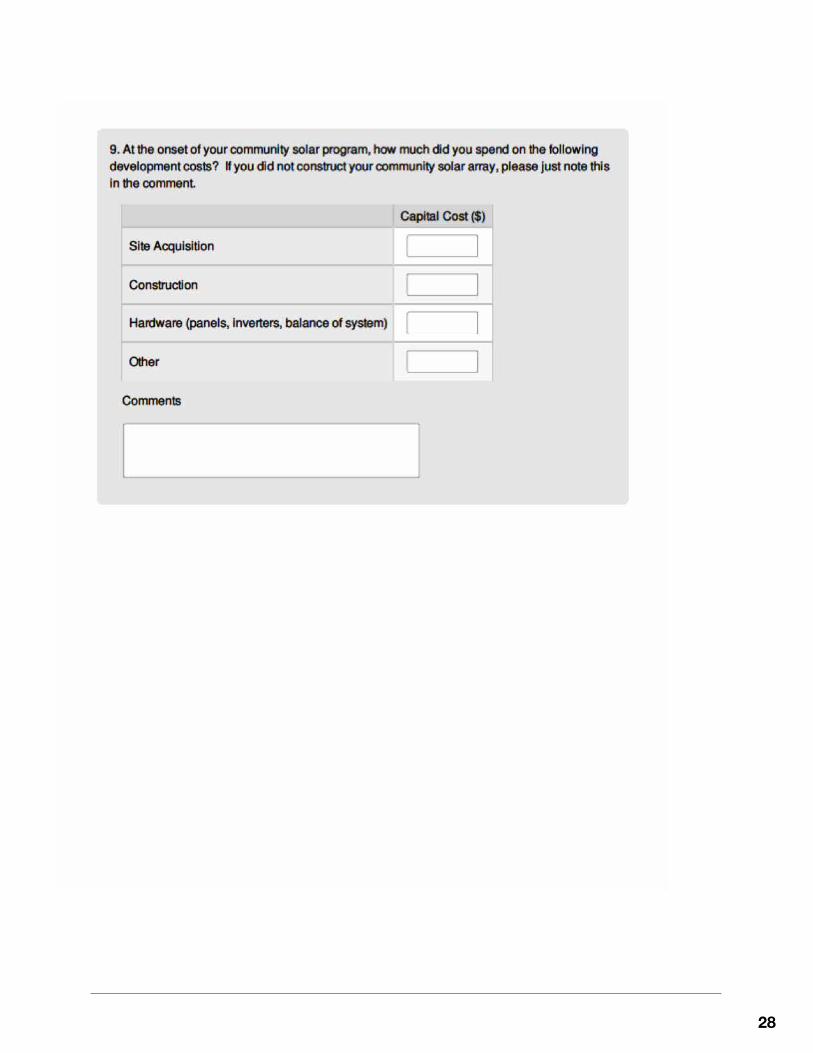
What Were the Major CSP Costs?8
• A majority of costs associated with a CSP are the hardware costs (i.e., solar panels, inverters) and construction of the CSG. The average total cost of surveyed programs was $4.76 per Watt, though this is not presented in the graphic since the numbers vary largely depending on the year of each program’s inception
• Annual ongoing costs — such as operations and maintenance, marketing, and billing — make up approximately 15% of the total CSP budget over the life of the program.
Time Between Decision to Proceed and Date Array Produced Electricity
Site Acquisition
Construction
HardwareBilling (Lifetime)
Marketing (Lifetime)
0%
25%
50%
75%
100%
Cap Ex O&M (Lifetime) Administrative(Lifetime)
Total
Perc
ent o
f Tot
al C
ost
8 O&M and administrative costs are incurred annually. In order to compare them to cap ex costs, SEPA converted them to lifetime costs by assuming O&M and billing costs are incurred each year for 20 years and marketing is incurred for first three years.
21
SECTION 5: NEXT STEPSAs discussed in Section 1, this project is comprised of three distinct work streams. This report is the completion of the first work stream, which involved researching existing CSPs and identifying design trends and standard design models. The next steps for this project are to conduct customer research to determine potential subscriber preferences, and to assist utilities with design and implementation of new CSPs.
In August of 2015, SEPA and the Shelton Group kicked off the second work stream by conducting focus group sessions with home owners, renters, and small business owners in four markets: New Jersey, Colorado, Illinois, and Georgia. Though the full focus group report will not be released until 2016, a few interesting findings can be mentioned at this point:
• Economics are No. 1 – Customers said that they would only participate if there was a clear economic case for them. The voice of the advocate who puts “being green” above all else was nonexistent.
• Greater effort is needed to educate the public – Very few focus group participants knew what community solar was prior to the meeting. This was not due to screening. As the business model was explained, preferences shifted quickly from doubt to interest.
• Length of commitment must be short – Customers were not interested in making a long-term contractual commitment. They gravitated toward the models that had shorter terms, provided transferability of subscriptions, or gave flexibility to drop out. Note that the design option for program length, which is typically 20-25 years, is not a customer commitment, but instead a length of time that benefits can be received.
• Location is important, but in an unexpected way – There was consensus that customers did not want to see the solar panels and would prefer them to be sited at remote locations. One residential focus group participant likened solar panels to other utility equipment such as substations, which were seen as unattractive, as a reason for preferring remotely located projects to those within their community.
A broader survey, distributed to more than 5,000 individuals across the U.S. is being planned for late 2015. The findings of this survey will be tested against these earlier findings and delve deeper into what trade-offs subscribers are most willing to make, and what design elements are deal breakers. A final report summarizing all findings from this work stream will be provided in early 2016.
At that point, SEPA will begin the third and final work stream, during which technical assistance will be provided to eight utilities seeking to develop CSPs. This work stream will commence in 2016 and run through the end of 2017. The effort will be concentrated on applying the lessons learned in the first two work streams to real world installations.
22
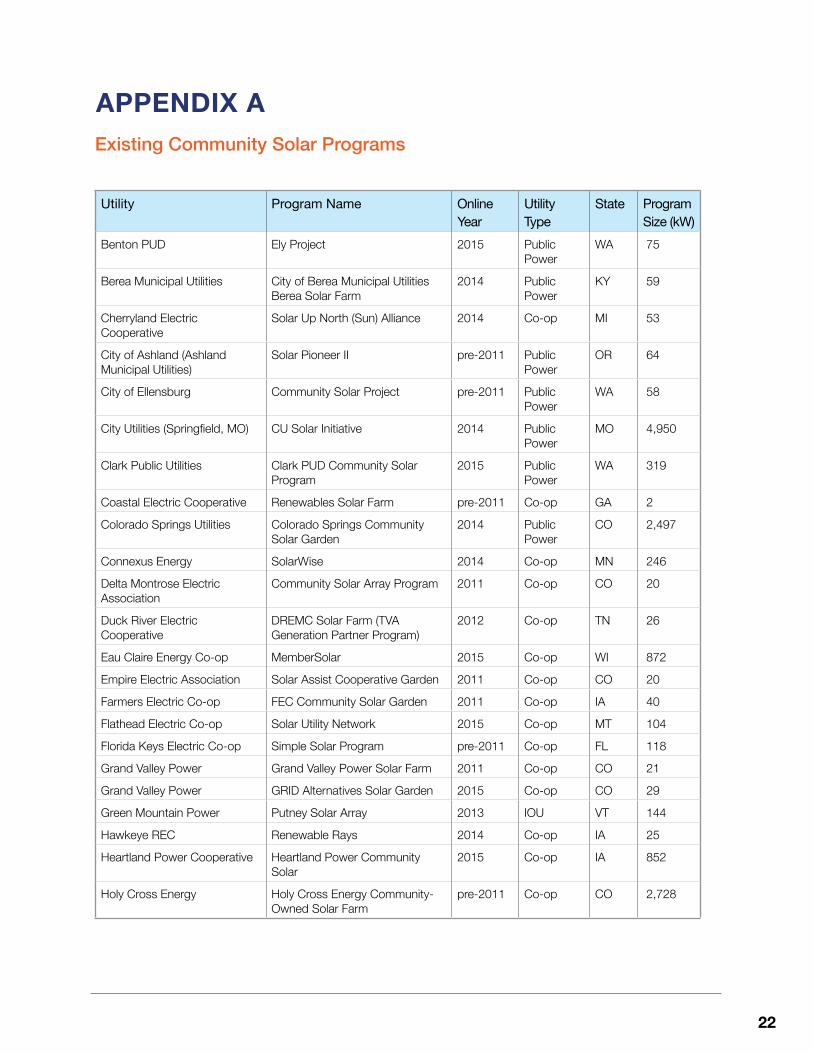
APPENDIX AExisting Community Solar Programs
Utility Program Name Online Year
Utility Type
State Program Size (kW)
Benton PUD Ely Project 2015 Public Power
WA 75
Berea Municipal Utilities City of Berea Municipal Utilities Berea Solar Farm
2014 Public Power
KY 59
Cherryland Electric Cooperative
Solar Up North (Sun) Alliance 2014 Co-op MI 53
City of Ashland (Ashland Municipal Utilities)
Solar Pioneer II pre-2011 Public Power
OR 64
City of Ellensburg Community Solar Project pre-2011 Public Power
WA 58
City Utilities (Springfield, MO) CU Solar Initiative 2014 Public Power
MO 4,950
Clark Public Utilities Clark PUD Community Solar Program
2015 Public Power
WA 319
Coastal Electric Cooperative Renewables Solar Farm pre-2011 Co-op GA 2
Colorado Springs Utilities Colorado Springs Community Solar Garden
2014 Public Power
CO 2,497
Connexus Energy SolarWise 2014 Co-op MN 246
Delta Montrose Electric Association
Community Solar Array Program 2011 Co-op CO 20
Duck River Electric Cooperative
DREMC Solar Farm (TVA Generation Partner Program)
2012 Co-op TN 26
Eau Claire Energy Co-op MemberSolar 2015 Co-op WI 872
Empire Electric Association Solar Assist Cooperative Garden 2011 Co-op CO 20
Farmers Electric Co-op FEC Community Solar Garden 2011 Co-op IA 40
Flathead Electric Co-op Solar Utility Network 2015 Co-op MT 104
Florida Keys Electric Co-op Simple Solar Program pre-2011 Co-op FL 118
Grand Valley Power Grand Valley Power Solar Farm 2011 Co-op CO 21
Grand Valley Power GRID Alternatives Solar Garden 2015 Co-op CO 29
Green Mountain Power Putney Solar Array 2013 IOU VT 144
Hawkeye REC Renewable Rays 2014 Co-op IA 25
Heartland Power Cooperative Heartland Power Community Solar
2015 Co-op IA 852
Holy Cross Energy Holy Cross Energy Community-Owned Solar Farm
pre-2011 Co-op CO 2,728
23
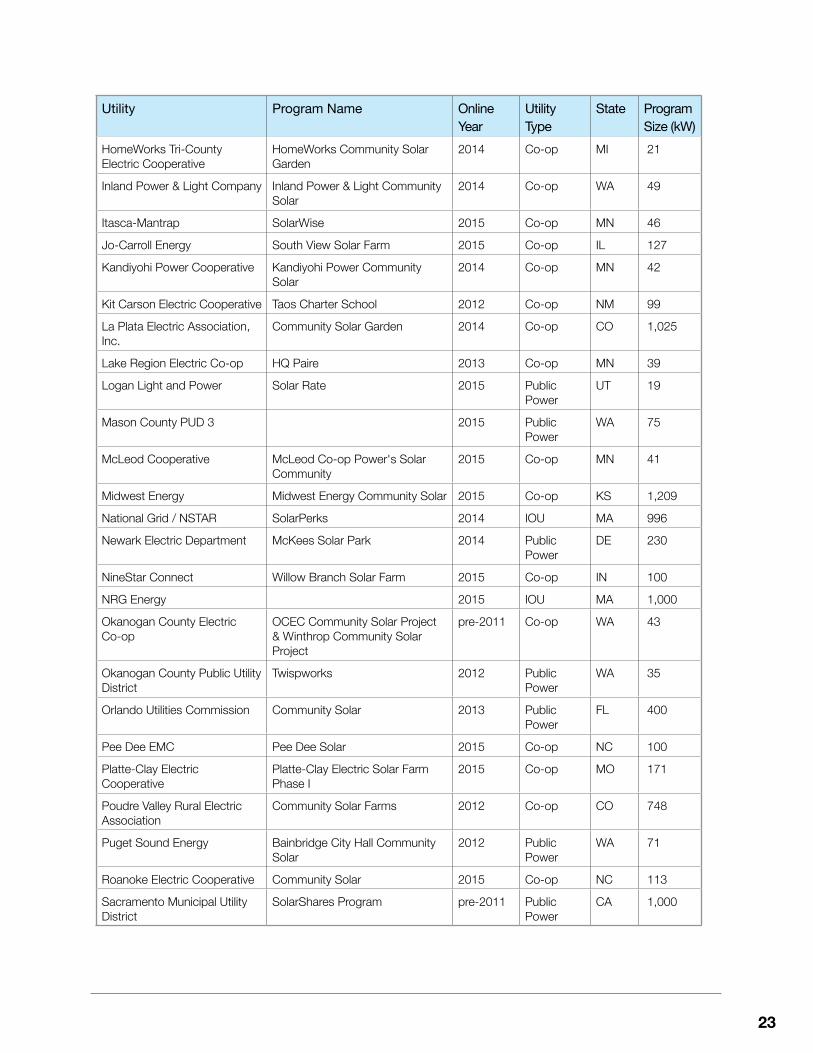
Utility Program Name Online Year
Utility Type
State Program Size (kW)
HomeWorks Tri-County Electric Cooperative
HomeWorks Community Solar Garden
2014 Co-op MI 21
Inland Power & Light Company Inland Power & Light Community Solar
2014 Co-op WA 49
Itasca-Mantrap SolarWise 2015 Co-op MN 46
Jo-Carroll Energy South View Solar Farm 2015 Co-op IL 127
Kandiyohi Power Cooperative Kandiyohi Power Community Solar
2014 Co-op MN 42
Kit Carson Electric Cooperative Taos Charter School 2012 Co-op NM 99
La Plata Electric Association, Inc.
Community Solar Garden 2014 Co-op CO 1,025
Lake Region Electric Co-op HQ Paire 2013 Co-op MN 39
Logan Light and Power Solar Rate 2015 Public Power
UT 19
Mason County PUD 3 2015 Public Power
WA 75
McLeod Cooperative McLeod Co-op Power's Solar Community
2015 Co-op MN 41
Midwest Energy Midwest Energy Community Solar 2015 Co-op KS 1,209
National Grid / NSTAR SolarPerks 2014 IOU MA 996
Newark Electric Department McKees Solar Park 2014 Public Power
DE 230
NineStar Connect Willow Branch Solar Farm 2015 Co-op IN 100
NRG Energy 2015 IOU MA 1,000
Okanogan County Electric Co-op
OCEC Community Solar Project & Winthrop Community Solar Project
pre-2011 Co-op WA 43
Okanogan County Public Utility District
Twispworks 2012 Public Power
WA 35
Orlando Utilities Commission Community Solar 2013 Public Power
FL 400
Pee Dee EMC Pee Dee Solar 2015 Co-op NC 100
Platte-Clay Electric Cooperative
Platte-Clay Electric Solar Farm Phase I
2015 Co-op MO 171
Poudre Valley Rural Electric Association
Community Solar Farms 2012 Co-op CO 748
Puget Sound Energy Bainbridge City Hall Community Solar
2012 Public Power
WA 71
Roanoke Electric Cooperative Community Solar 2015 Co-op NC 113
Sacramento Municipal Utility District
SolarShares Program pre-2011 Public Power
CA 1,000
24
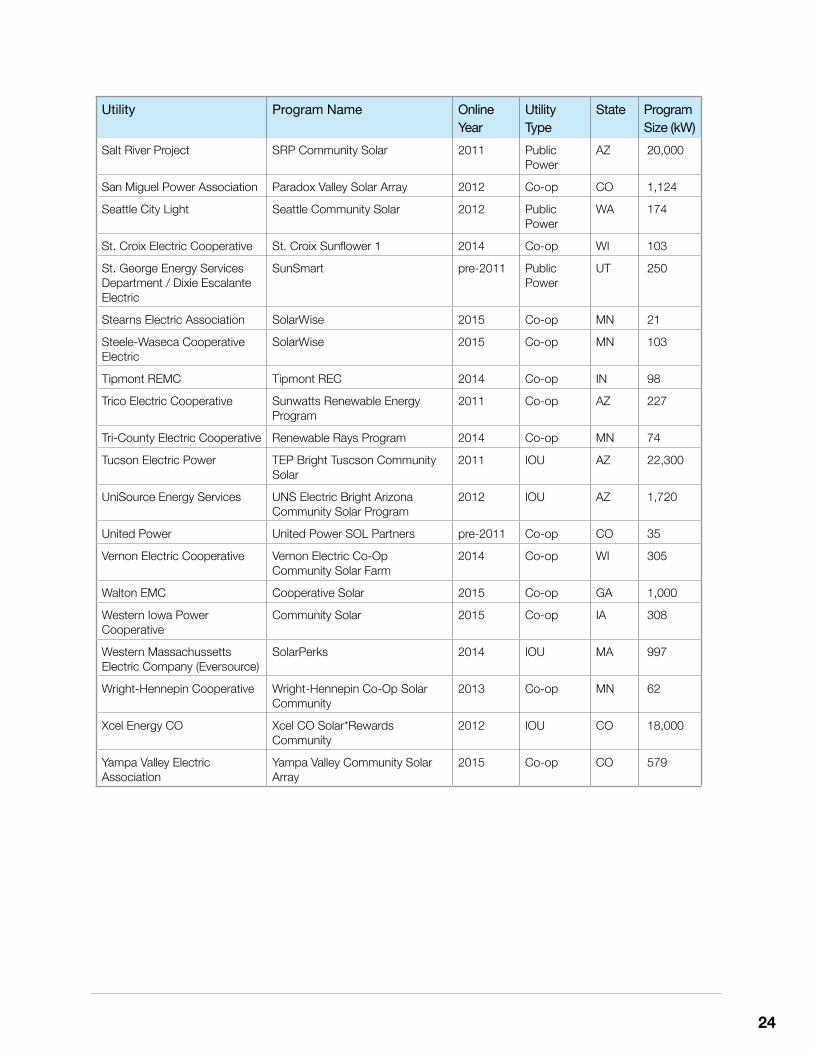
Utility Program Name Online Year
Utility Type
State Program Size (kW)
Salt River Project SRP Community Solar 2011 Public Power
AZ 20,000
San Miguel Power Association Paradox Valley Solar Array 2012 Co-op CO 1,124
Seattle City Light Seattle Community Solar 2012 Public Power
WA 174
St. Croix Electric Cooperative St. Croix Sunflower 1 2014 Co-op WI 103
St. George Energy Services Department / Dixie Escalante Electric
SunSmart pre-2011 Public Power
UT 250
Stearns Electric Association SolarWise 2015 Co-op MN 21
Steele-Waseca Cooperative Electric
SolarWise 2015 Co-op MN 103
Tipmont REMC Tipmont REC 2014 Co-op IN 98
Trico Electric Cooperative Sunwatts Renewable Energy Program
2011 Co-op AZ 227
Tri-County Electric Cooperative Renewable Rays Program 2014 Co-op MN 74
Tucson Electric Power TEP Bright Tuscson Community Solar
2011 IOU AZ 22,300
UniSource Energy Services UNS Electric Bright Arizona Community Solar Program
2012 IOU AZ 1,720
United Power United Power SOL Partners pre-2011 Co-op CO 35
Vernon Electric Cooperative Vernon Electric Co-Op Community Solar Farm
2014 Co-op WI 305
Walton EMC Cooperative Solar 2015 Co-op GA 1,000
Western Iowa Power Cooperative
Community Solar 2015 Co-op IA 308
Western Massachussetts Electric Company (Eversource)
SolarPerks 2014 IOU MA 997
Wright-Hennepin Cooperative Wright-Hennepin Co-Op Solar Community
2013 Co-op MN 62
Xcel Energy CO Xcel CO Solar*Rewards Community
2012 IOU CO 18,000
Yampa Valley Electric Association
Yampa Valley Community Solar Array
2015 Co-op CO 579
25
APPENDIX BCommunity Solar 2015 Survey
26

27
28
29
30