Community Response Program (CRP) Pilot Initiative · Community Response Program (CRP) Pilot ......
35
1 Community Response Program (CRP) Pilot Initiative Final Implementation Report to the Wisconsin Children’s Trust Fund March 27, 2012 Institute for Research on Poverty (IRP) University of Wisconsin-Madison Kristen Shook Slack, Ph.D. Lawrence M. Berger, Ph.D. Kathryn Maguire Jack, M.P.A., M.S.W.
Transcript of Community Response Program (CRP) Pilot Initiative · Community Response Program (CRP) Pilot ......

1
Community Response Program (CRP)
Pilot Initiative
Final Implementation Report to the
Wisconsin Children’s Trust Fund
March 27, 2012
Institute for Research on Poverty (IRP)
University of Wisconsin-Madison
Kristen Shook Slack, Ph.D.
Lawrence M. Berger, Ph.D.
Kathryn Maguire Jack, M.P.A., M.S.W.

2
Table of Contents:
Background ..................................................................................................................................... 3
Recommendations ........................................................................................................................... 6 The CRP Models ............................................................................................................................. 6 Case Intake Patterns ........................................................................................................................ 9 Enrollment and Progress in CRP .................................................................................................. 14 Service Goals and Progress ........................................................................................................... 18
Program Satisfaction ..................................................................................................................... 21
Summary of Main Findings .......................................................................................................... 21
Conclusion .................................................................................................................................... 22 Appendix A: Service Forms.......................................................................................................... 24
INTAKE FORM ....................................................................................................................... 24 ENROLLMENT AND PROGRESS FORMS .......................................................................... 26
CONTACT LOG ...................................................................................................................... 27 PRIMARY CAREGIVER SELF-ASSESSMENT OF STRENGTHS ..................................... 28 INCOME AND BENEFITS INVENTORY ............................................................................. 29
COMMUNITY RESPONSE PROGRAM FEEDBACK FORM ............................................. 30 Appendix B: Implementation Questionnaire ................................................................................ 31
Tables: Table 1 Characteristics of referrals .............................................................................................. 13 Table 2 CPS access – all accepted referrals from CPS (N=486) .................................................. 15 Table 3 Percent of enrolled participants with each type of contact (for those with completed
contact forms, N=433) .................................................................................................................. 16 Table 4 Mean number of contacts by type (for those with completed contact forms, N=433) .... 17 Table 5 Income and benefits receipt at enrollment (for participants with completed income and
benefits inventories; N=317)......................................................................................................... 17 Table 6 Service goals (N=435) ..................................................................................................... 18 Table 7 Service goals and related referral reasons (N=435) ......................................................... 19 Table 8 Service goals level of need (N=435) ............................................................................... 19 Table 9. Service factors associated with goal progress and attainment (N=435) ......................... 20 Table 10. Goal progress and attainment related to receiving CRP in the family’s home ............. 20

3
Background
Differential response (also called “alternative response”) reforms in child protective
service (CPS) systems have proliferated in the U.S. over the past 15 years.1 Such reforms entail
changes to the way in which CPS systems assess and serve families reported for maltreatment
according to the severity of their presenting risks. Higher risk families are assigned to more
traditional “investigatory” tracks designed to ascertain evidence of abuse or neglect; when
evidence is identified, these families are required to participate in CPS. Low to moderate risk
families are assigned to an alternative track, in which workers assess family-identified service
needs and encourage, but do not require, service participation. Although models vary, most of
these “assessment” tracks are maintained within CPS systems. Regardless of which track a
family is assigned to, however, those with lower levels of risk may still be screened out of CPS
altogether at the maltreatment report or investigation stage.2 In the State of Wisconsin, data
show that 51% of the referrals of alleged maltreatment are screened out by CPS agencies.3
Furthermore, the majority (85%) of assessments conducted on families who are screened in
following a child maltreatment referral result in decisions that the children in the home are safe.4
CPS is not required to offer services to families screened out of the system, and most often the
CPS case is closed at this point.
Community Response Programs reach out to families who traditionally have been
brought to the attention of CPS but are ultimately not served by that system. The program is
intended to partner with CPS to reach out to families earlier when they are facing stress in an
effort to reduce future referrals to CPS and ultimately to prevent child abuse and neglect.
Community response differs from differential/alternative response programs in that the
population of interest is families that have been referred to CPS but screened out or closed after
an investigation with no identified safety risks.
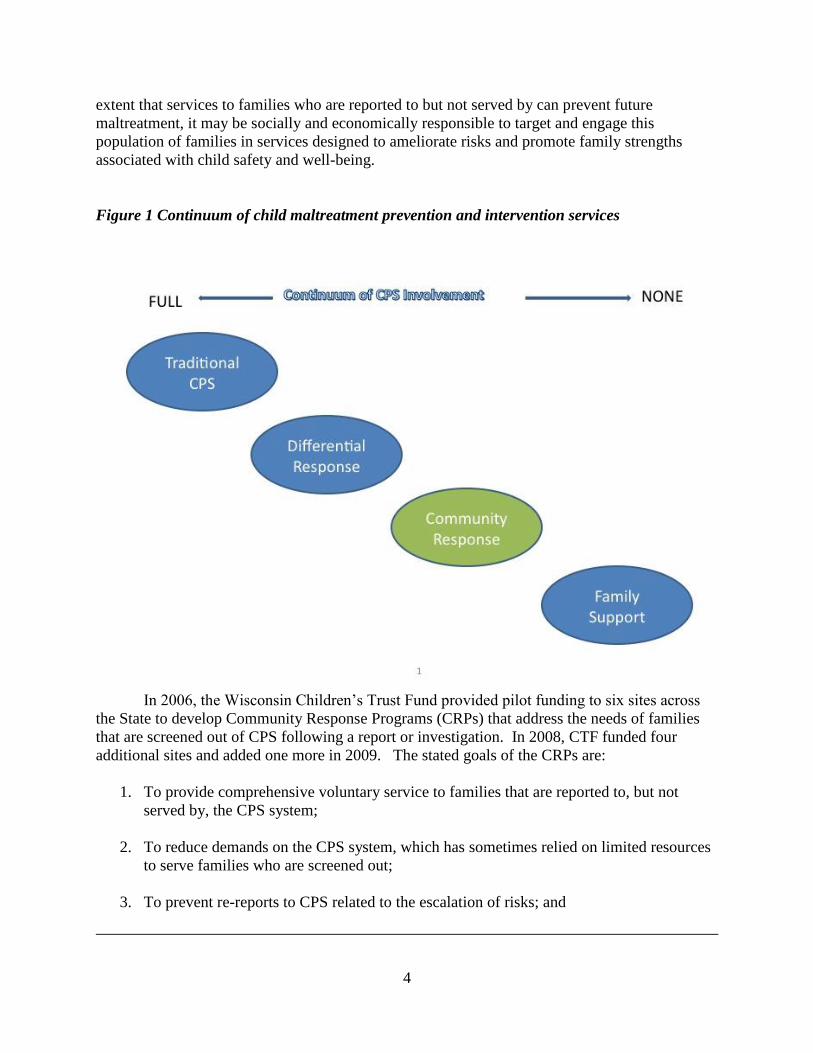
As indicated in Figure 1, community response lies on a continuum of child maltreatment
prevention and intervention services. Families screened out following a maltreatment report or
investigation still may have need for services, and if so, can be considered potential targets for
early intervention. Efforts to systematically engage this population are scarce, despite research
evidence that such families have a significant risk of being re-reported to CPS over time.5 To the
1 See, e.g., the U.S. Department of Health and Human Services literature review (2009), “Differential Response in
Child Protective Services: a Literature Review”; the American Humane Association’s Protecting Children (2005),
special issue (volume 20, Numbers 2 and 3) devoted to “Differential Response in Child Welfare”; Waldfogel, Jane.
(2008) “The Future of Child Protection Revisited,” pp. 235-241 in Duncan Lindsey and Aron Shlonsky (Eds.). Child
Welfare Research: Advances for Practice and Policy. Oxford: Oxford University Press. 2 In Wisconsin, when maltreatment reports are screened-in, an “initial assessment” is conducted to determine what
safety factors and protective capacities are in place, and to make further decisions about whether and how to serve
families reported for maltreatment. In many other states, this phase of CPS intervention is referred to as the
“investigation.” 3 Office of Program Evaluation and Planning, Division of Children and Family Services, Wisconsin Department of
Health and Family Services. (2006). Wisconsin Child Abuse and Neglect Report: 2006 Data. Madison, WI: 4 Wisconsin Department of Children and Families, http://dcf.wisconsin.gov/children/CPS/PDF/2007CAN
Report.pdf 5 See Drake, B., Jonson-Reid, M., Way, I., & Chung, S. (2003). Substantiation and recidivism. Child Maltreatment,
8(4), 248; Hindley, N., Ramchandani, P., & Jones, D. (2006). Risk factors for recurrence of maltreatment: a
systematic review. Archives of Disease in Childhood, 91(9), 744-752.
4
extent that services to families who are reported to but not served by can prevent future
maltreatment, it may be socially and economically responsible to target and engage this
population of families in services designed to ameliorate risks and promote family strengths
associated with child safety and well-being.
Figure 1 Continuum of child maltreatment prevention and intervention services
In 2006, the Wisconsin Children’s Trust Fund provided pilot funding to six sites across
the State to develop Community Response Programs (CRPs) that address the needs of families
that are screened out of CPS following a report or investigation. In 2008, CTF funded four
additional sites and added one more in 2009. The stated goals of the CRPs are:
1. To provide comprehensive voluntary service to families that are reported to, but not
served by, the CPS system;
2. To reduce demands on the CPS system, which has sometimes relied on limited resources
to serve families who are screened out;
3. To prevent re-reports to CPS related to the escalation of risks; and

5
4. To build a more comprehensive, community-based service continuum for families at risk
for maltreatment.
While the eleven funded sites all shared similar target populations (i.e., families who
were reported to but not served by CPS and voluntarily engaged in CRP), the programs were
locally adapted to meet the needs of individual community contexts. The sites varied in their
CRP service models in terms of the duration of service, the nature of the service intervention,
and whether the CRP service track was delivered by CPS workers or by a community-based
private agency. In terms of the target population, sites varied on whether they served families
who were screened out of CPS at the Access6 or report stage, families who had an initial
assessment (i.e., investigation) from CPS but subsequently had their case closed, or families who
had received a services intake7 report from CPS. The variation in the duration of service and
nature of service intervention were related. Specifically, sites that were located in relatively
resource rich areas are able to provide more referrals to other services, thus allowing for a shorter
time period of intervention, while sites that were located in more remote areas tended to provide
more intensive services.
The Children’s Trust Fund contracted with the Institute for Research on Poverty (IRP) at
the University of Wisconsin-Madison to conduct an implementation evaluation of the original
CRPs funded in 2006, and beginning in 2008, the additional five sites funded by the Trust Fund.
Consistent data collection protocols were used across sites to document characteristics of the
families referred to the program, the referral concerns, outreach efforts, service plan and
progress, case closure, and follow-up (see Appendix A for program forms). The implementation
evaluation involved the following tasks:
1) An assessment of the extent to which CRPs were implemented according to the original
service models proposed by sites;
2) Identification of the factors that predicted family engagement with and attrition from
CRP;
3) Identification of the characteristics of families that participated in CRP, and the nature of
their service needs;
4) Identification of the factors that predicted progress toward and attainment of service
goals; and
5) An assessment of whether the CRP services were positively experienced by families, and
whether families had suggestions for improving the program models.
An interim implementation report was developed for CTF and delivered on November 18,
2008, and a final report was delivered on April 11, 2010. This report reflects the content in both
the interim and the final reports to CTF. Because this phase of the evaluation was not designed
to assess program impact, information on the relative efficacy of different CRP models is not
6 In Wisconsin, “Access” refers to the part of the CPS system focused on taking and processing child maltreatment
reports. 7 Services intake is a category of CPS reports that is distinct from protective services reports, and more likely to
involve needs related to community resource linkages or material resources. Services intake reports may result in an
open “child welfare” case involving voluntary service delivery, but no other traditional CPS service interventions.

6
known. However, this evaluation generated important findings that inform best practices in
designing and implementing CRP models.
Recommendations
Community Response Programs should exclusively target families who were screened
out or had their cases closed after an initial assessment by the CPS following a report of
child maltreatment;
Services should be truly voluntary in nature and delivered by staff operating outside of
the formal CPS system; families should be free to decline services as well as disengage
from services at any point;
A pre-established protocol between the CRP service agency and the local CPS agency
needs to be in place, including objective guidelines for referring families from CPS to
CRP, ideally with very few criteria (e.g. every family who is screened out and has
reasonable contact information);
Goal setting should be a collaborative process between the CRP worker and the primary
caregiver(s) in each family.
The program should be delivered in the family’s home or in a convenient location, as
determined by the family;
Comprehensive assessment of each family’s economic situation should occur prior to
goal setting, to allow families to reflect on whether they need assistance accessing
economic resources, making short-term financial decisions, or addressing emergent
economic needs.
The intervention period should be relatively short (e.g., 1-6 months), and not serve as a
substitute for other community resources that offer long-term interventions; clear criteria
for case closure should be developed.
The CRP Models
The six original CRP pilot sites funded by the Children’s Trust Fund include Columbia
County (Family Resource Center, Renewal Unlimited), Green Lake/Marquette (combined county
site; CPS), La Crosse County (Family Resource Center of La Crosse), Pierce County (CPS),
Rock County (Exchange Family Resource Center), and Washburn County (Lakeland Family
Resource Center). The Children’s Trust Fund added four additional sites in 2008:
Ashland/Bayfield (combined county site; Ashland/Bayfield Family Resource Center), Dane
County (Joining Forces for Families), Manitowoc County (Lakeshore Family Resource Center),
and Marathon County (CPS); and added Racine County (United Way of Racine
County/Children’s Service Society) in 2009. As noted, three of the eleven sites are internal to
the local CPS office, and involve dedicated staff for the CRP. The remaining eight CRPs are
housed in private, not-for-profit organizations. One of the sites (La Crosse) is co-located with the
county CPS agency. Thus, the models varied according to whether they were internal or external
to CPS and whether they were co-located with CPS agencies.

7
Regular meetings and conference calls with the pilot sites shed light on a number of
implementation issues related to these model differences. Workers in sites with CRP models
internal to the local CPS agency sometimes struggled with maintaining role separation from
other CPS staff. CPS staff sometimes presumed or expected that certain CPS functions would be
performed by the CRP worker. CRP models located in the community had very different
implementation issues. For several of these sites, lack of formal lines of communication with
CPS staff hindered the referral process to the CRP agency in the early stages of the initiative.
CPS staff persons were sometimes reluctant to refer families to CRP because they were not
familiar with the CRP model, or because formal protocols for referral were not in place or were
viewed as cumbersome. Time for building relationships between CPS and CRP staff and
developing a shared understanding of the CRP largely resolved such issues.
One key evaluation question in the implementation period was whether sites adhered to
the model of service proposed in their initial grant applications. Most sites included general
descriptions of “service flow” in the initial grant proposal to the Children’s Trust Fund.
However, these descriptions often lacked specificity at the proposal stage. Lack of detail on the
intended service flow made it difficult to assess the extent to which sites maintained model
fidelity. This lack of clarity was partially unavoidable at the onset, given the shortage of
literature on similar models at the time the Children’s Trust Fund announced the pilot funding.8
Furthermore, the Children’s Trust Fund’s Request for Proposals articulated a commitment to
allowing model variation as a means of generating information on a variety of community-based
prevention approaches. Thus, little prescriptive guidance was provided to sites at the onset of
this pilot initiative.
Given the initial lack of detail on program models, significant efforts by the Children’s
Trust Fund and the evaluators were put forth in the initial implementation phase in order to help
sites more clearly articulate their service models. This process involved surveying sites on
specific questions related to their intended target population, their referral and intake procedures,
and the nature of their service intervention (See Appendix B). The results from this exercise
helped clarify the differences among the CRP pilot models.
Although all sites focused on families who were reported to by not served by CPS
following a report of child maltreatment, the sites varied according to whether they primarily or
exclusively focused on families screened out at CPS Access (i.e., the report stage) or families
that had their cases closed after Initial Assessment (i.e., the “investigation” stage). In the initial
phase of implementation five sites offered services only to families who were screened out at
Access. Screen-outs occurred because the report lacked sufficient evidence to further assess the
claim, the report was not related to safety concerns, or the report was believed to be otherwise
unfounded. One site offered services only to those families who had their cases closed after an
initial assessment. Case closure after Initial Assessment occurred when there were no present
safety concerns or immediate risks to the children in the home.
8 A more recent volume of the American Humane Association’s Protecting Children (2008)—special issue (volume
23, Numbers 1 and 2) devoted to “Exploring Differential Response: One Pathway toward Reforming Child
Welfare”—includes articles on California’s and Minnesota’s differential response models, which both include a path
of service that is community-based and external to CPS.

8
An unexpected finding in the latter stages of implementation was that all of the original
CRP sites began receiving referrals for families whose reports to CPS resulted in a “services
intake” rather than a “protective services” report.9 The originally proposed CRP models did not
include reference to services intake reports as a potential source of referrals. This change
highlights the importance of revisiting the service model periodically to identify changes in
practice. All CRP sites accepted referrals only if child safety concerns were absent; CRP staff
persons referred families back to CPS if safety concerns were (or became) evident. However,
across sites, CRP staff members felt the need to refer only 4% of families back to CPS.
The nature of services across CRP sites varied from linkages and referrals to multiple visits
to the family’s home (note: this is not the same as an evidence-based home visiting model) and
family team meetings. After the initial referral to the CRP and outreach attempts by CRP
workers, families were free to accept or decline services without consequence. CRP staff also
referred the family to other existing programs or services at any point of contact, when these
alternatives were deemed more appropriate. CRPs were not intended to duplicate services
already available; rather they were intended to serve as a resource broker whenever possible.
Families who engaged in CRP received tailored services that could include community resource
referrals, family team meetings, emergency funds, parent education, mental health consultation,
assistance with public benefits linkages, and transportation assistance, depending on the site
model.
The duration of service also varied across sites. In one site, services were time-limited and
cases closed after three months, regardless of whether the family achieved their goals prior to
that time. In all other sites, services were not time-limited, and therefore ended only when the
family achieved their goals, disengaged in the program, or when there were safety concerns that
required a referral back to CPS. Duration of service did not necessarily relate to the intensity of
the service array. For a small number of sites, however, open-ended service delivery became
problematic, because it resulted in relatively few numbers of families being served during the
implementation phase. For this reason, CTF recommends limiting service delivery time frames
according to set criteria and clear case closure guidelines.
Discussions in multi-site meetings generated agreement that one key outcome of the CRP
models was to prevent the recurrence of CPS referrals. Indeed, the main argument for serving
lower-risk families is to prevent the escalation of risks and promote family strengths in order to
avoid future incidents of child maltreatment. Although the present evaluation was not intended
as an outcome evaluation (i.e., designed to assess program impact on participants), the
Children’s Trust Fund did expect information on how sites would be able to demonstrate
“success.”
Through a collaborative process involving CTF, the evaluators, and the original CRP sites,
it was decided that an assessment of program success would be accomplished in three ways: the
adherence to the intended model of service delivery; positive changes in a pre-post measure of
family strengths completed by the primary caregiver in each family served; and positive
feedback from participating families at the point of case closure. Another set of intermediate
9 Services intake reports are typically considered low-risk, and do not meet the statutory criteria for abuse or neglect.
However, these cases typically involve some degree of service need, often at the request of the family.
9
outcomes related to the successful implementation of the program (e.g., rate of engagement, rate
of program form completion, attainment of service goals) was also tracked. Additional measures
of success monitored by the Children’s Trust Fund included feedback from the sites on how their
practice with families changed in positive ways, the extent to which new community partnerships
were generated by the CRP, and feedback from families and workers on their views of the CRP
captured in anecdotal success stories.
In summary, sites’ CRP models varied across several dimensions, including their physical
and organizational relationship to the county CPS agency, their outreach and engagement
strategies, and their mix and duration of services. No one model emerged as the “ideal” structure
for CRP, but several findings from the implementation evaluation lend weight to the
recommendations outlined above. Furthermore, important findings (presented below) related to
the characteristics of the families referred to CRP sites, their service needs, and the predictors of
engagement and goal attainment will assist other localities in planning and launching CRP
models that target families with lower-level risks for child maltreatment—families not
previously served by CPS systems.
Case Intake Patterns
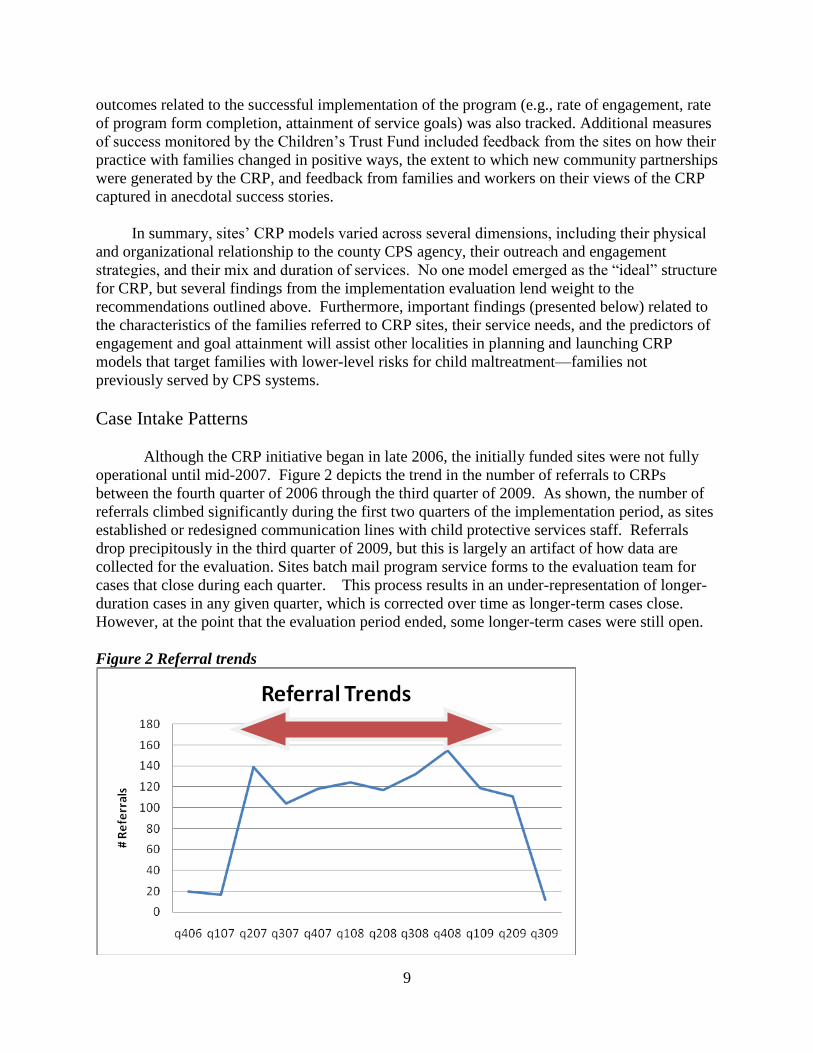
Although the CRP initiative began in late 2006, the initially funded sites were not fully
operational until mid-2007. Figure 2 depicts the trend in the number of referrals to CRPs
between the fourth quarter of 2006 through the third quarter of 2009. As shown, the number of
referrals climbed significantly during the first two quarters of the implementation period, as sites
established or redesigned communication lines with child protective services staff. Referrals
drop precipitously in the third quarter of 2009, but this is largely an artifact of how data are
collected for the evaluation. Sites batch mail program service forms to the evaluation team for
cases that close during each quarter. This process results in an under-representation of longer-
duration cases in any given quarter, which is corrected over time as longer-term cases close.
However, at the point that the evaluation period ended, some longer-term cases were still open.
Figure 2 Referral trends

10
The final report analyses involved data on cases that were opened between July 1, 2007 and
June 30, 2009 and for which program forms were received before October 15, 2009 (to afford an
adequate time lag for capturing longer duration cases).
Overall, there were 869 initial referrals made to ten CRP sites10
from July 1, 2007 through
June 30, 2009. An additional 125 re-referrals (i.e., CRP referrals for families subsequent to an
initial CRP referral) also occurred during this time period, the majority of which were from CPS
(76%), followed by self-referrals (21%), and other agencies or community members (3%). Of
the families that were re-referred through CPS, 4% of them had been re-referred to CPS by the
CRP worker and 57% of them had previously engaged in CRP services.
54% of initial referrals resulted in a family’s acceptance of CRP services; this acceptance
rate ranged from 28% to 83% across sites. The most common reason that referred families did
not accept services was that CRP staff persons were unable to contact them (23%). Additionally,
15% of families declined services, 4% were referred by CRP staff to other agencies at the time of
the initial contact, and 4% were referred back to CPS by the CRP worker.
Sites varied according to the segment of the CPS population targeted for CRP services.
Data from the 2007 Wisconsin Child Abuse and Neglect Report11
show CPS referral pools that
are significantly larger than the number of actual referrals to CRPs. Numbers of families
referred to CRP from CPS over the period of a year ranged from 14 to 216 across sites, with an
average of 64 families being served per site. From the available pool of potential referrals (i.e.
the number of families that were in their target population from CPS), the referral rates ranged
from 3% of potential families to 28%, with an average of 12% of potential families actually
being referred to CRP from CPS.
Although several sites did not articulate specific criteria for prioritizing or selectively
accepting referrals, anecdotal comments from CRP staff suggested that in most sites, CPS staff
first screened cases for “appropriate” CRP candidates, and referred only this subset to the CRPs.
Sometimes this screening process occurred in collaboration with CRP staff. As a result of the
interim evaluation report from the fall of 2008, CTF clarified the referral process to encourage
sites to ask CPS staff to use objective criteria for referrals. In replicating these CRP models
elsewhere, application of objective criteria for CPS referrals is essential for learning whether
particular characteristics of referred families are related to successful program outcomes.12
10
Dane County is one of the five sites added to the CTF initiative in 2008. However, at the time that this report was
written, no program service data had been submitted by this site. 11
Wisconsin Department of Children and Families, http://dcf.wisconsin.gov/children/CPS/PDF/2007CAN
Report.pdf 12
Some sites may have been operating at capacity, and thus unable to handle a higher number of referrals.
Regardless of capacity issues, however, clear and objective criteria should be in place to determine which referrals
are ultimately made.

11
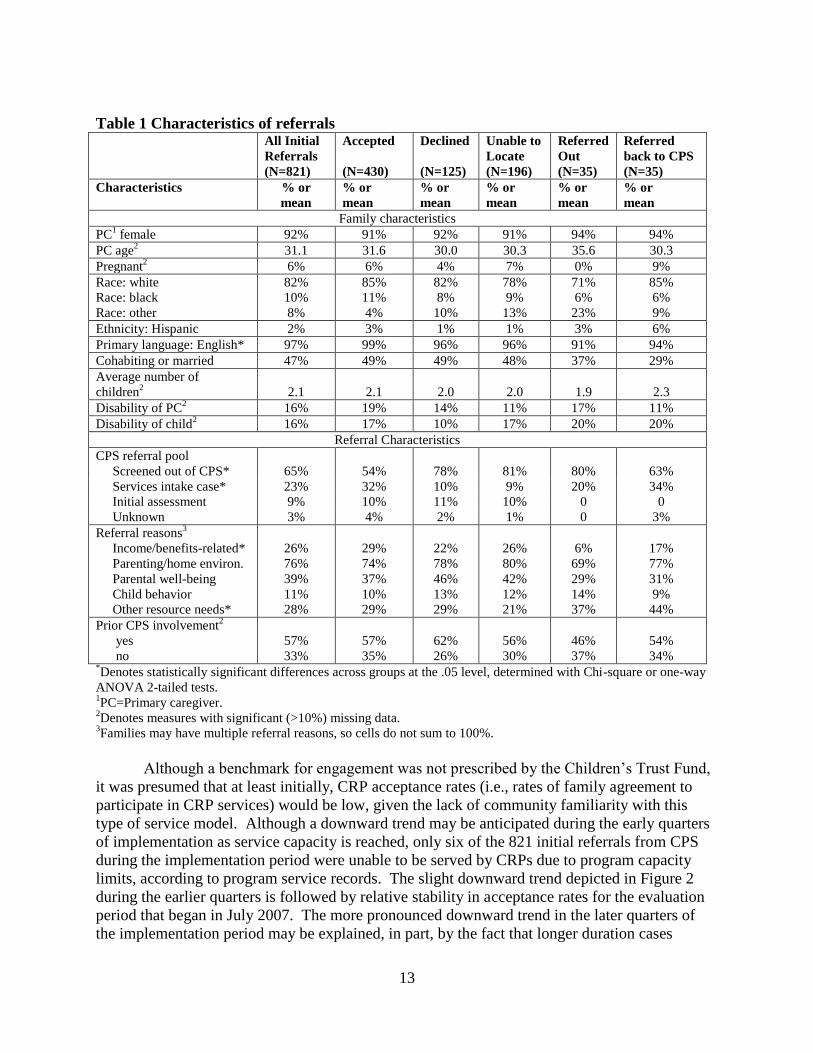
In Table 1, the characteristics of all initial referrals from CPS (N=821) are presented.13
Sites were required to document available family demographic information on each referral, as
well as characteristics related to the referrals (e.g., reason for referral to CRP, as determined by
the CPS worker). Not all referrals from CPS contained information on family demographics;
thus, certain estimates in Table 1 may not accurately reflect the percentage or average value for a
particular characteristic. Characteristics for which there were significant missing data (i.e., >
10% but < 30% of the sample) are identified with a table footnote. Some characteristics, such as
employment and education status, were omitted from the table because data were missing for
30% or more of the sample.
The vast majority of CRP families referred by CPS identified the primary caregiver as a
white female whose primary language was English. Primary caregivers had an average age of 31
and an average of 2.1 children in the home. A small percentage of caregivers were pregnant at
the point of the referral (6%), only 2% identified themselves as Hispanic or Latina, and 10%
identified their race as black. Approximately 16% reported a personal disability, and 16%
reported having a child with a disability. Half of referred caregivers were married or cohabiting
with a partner. The only statistically significant difference in family characteristics across
referral outcome status was primary language; nearly all (99%) families who accepted CRP
services reported English as the primary language in the home. Those referred out to other
services in the community or back to CPS were less likely to identify English as their primary
language.
With respect to the case referral characteristics, the majority (62%) of initial referrals
from CPS were from the screened-out pool. Referral outcomes varied greatly by the referral
pool. Of the families that were screened out, 29% were unable to be located, 18% declined
services, and 43% accepted services. In contrast, of the families that were from the services
intake pool (22% of all referrals from CPS), 9% were unable to be located, 6% declined services,
and 74% accepted services. Finally, of the families who received an initial assessment from
CPS14
(9% of all referrals from CPS), 25% were unable to be located, 19% declined services,
and 56% accepted services. This suggests that sites most commonly received referrals from the
screened out pool, but were less successful at engaging these families compared to families
referred from the services intake or initial assessment pool.
When CPS made a referral to a CRP site, CRP staff collected information on the reasons
for the referral to CRP, as identified by the CPS worker.15
The most common reasons reflected
parenting or home environment problems (76%), followed by reasons related to the well-being of
the primary caregiver (i.e., health or mental health needs, alcohol or drug abuse issues, domestic
violence; 39%), assistance with linking to other community resources (28%), income or
13
Approximately 6% of all initial referrals from Table 1 are excluded because the referral source was not CPS. As
prescribed by the Children’s Trust Fund, CRP sites were expected to limit their referral pool to families referred by
CPS. However, in the earliest stages of implementation, this criterion had not yet been established, and a small
number of initial referrals came from other sources (e.g., Early Head Start, schools, self-reports). 14
Nearly all families referred from the initial assessment pool involve cases that are assessed and then closed at this
stage; however, a few families are referred from an open initial assessment case. 15
This referral reason is not necessarily associated with the allegations that initiated the maltreatment report. Rather,
these reasons are based on the CPS worker’s assessment of what the family may need or benefit from.
12
benefits-related needs (i.e., benefits linkage, employment needs, housing problems, food
shortages, utility shut-offs; 26%), and behavioral and emotional health needs related to one or
more children in the home (11%).16
Multiple referral reasons were often provided for a family.
Across referral outcome categories, statistically significant differences in referral reasons
emerged for the income-benefits and other community resources categories. Families referred
for income-benefits related needs were more likely to accept CRP services than they were to
decline services or be referred elsewhere. Families needing linkages to other community
resources were more likely to be referred elsewhere (including back to CPS) than they were to
accept or decline services.
16
Several other referral reasons reflected in the CRP service intake form have a very low incidence; these reasons
are not included in Table 3.
13
Table 1 Characteristics of referrals All Initial
Referrals
(N=821)
Accepted
(N=430)
Declined
(N=125)
Unable to
Locate
(N=196)
Referred
Out
(N=35)
Referred
back to CPS
(N=35)
Characteristics % or
mean
% or
mean
% or
mean
% or
mean
% or
mean
% or
mean
Family characteristics
PC1 female 92% 91% 92% 91% 94% 94%
PC age2 31.1 31.6 30.0 30.3 35.6 30.3
Pregnant2 6% 6% 4% 7% 0% 9%
Race: white
Race: black
Race: other
82%
10%
8%
85%
11%
4%
82%
8%
10%
78%
9%
13%
71%
6%
23%
85%
6%
9%
Ethnicity: Hispanic 2% 3% 1% 1% 3% 6%
Primary language: English* 97% 99% 96% 96% 91% 94%
Cohabiting or married 47% 49% 49% 48% 37% 29%
Average number of
children2
2.1
2.1
2.0
2.0
1.9
2.3
Disability of PC2 16% 19% 14% 11% 17% 11%
Disability of child2 16% 17% 10% 17% 20% 20%
Referral Characteristics
CPS referral pool
Screened out of CPS*
65%
54%
78%
81%
80%
63%
Services intake case* 23% 32% 10% 9% 20% 34%
Initial assessment 9% 10% 11% 10% 0 0
Unknown 3% 4% 2% 1% 0 3%
Referral reasons3
Income/benefits-related*
Parenting/home environ.
Parental well-being
Child behavior
Other resource needs*
26%
76%
39%
11%
28%
29%
74%
37%
10%
29%
22%
78%
46%
13%
29%
26%
80%
42%
12%
21%
6%
69%
29%
14%
37%
17%
77%
31%
9%
44%
Prior CPS involvement2
yes
no
57%
33%
57%
35%
62%
26%
56%
30%
46%
37%
54%
34% *Denotes statistically significant differences across groups at the .05 level, determined with Chi-square or one-way
ANOVA 2-tailed tests. 1PC=Primary caregiver.
2Denotes measures with significant (>10%) missing data.
3Families may have multiple referral reasons, so cells do not sum to 100%.
Although a benchmark for engagement was not prescribed by the Children’s Trust Fund,
it was presumed that at least initially, CRP acceptance rates (i.e., rates of family agreement to
participate in CRP services) would be low, given the lack of community familiarity with this
type of service model. Although a downward trend may be anticipated during the early quarters
of implementation as service capacity is reached, only six of the 821 initial referrals from CPS
during the implementation period were unable to be served by CRPs due to program capacity
limits, according to program service records. The slight downward trend depicted in Figure 2
during the earlier quarters is followed by relative stability in acceptance rates for the evaluation
period that began in July 2007. The more pronounced downward trend in the later quarters of
the implementation period may be explained, in part, by the fact that longer duration cases
14
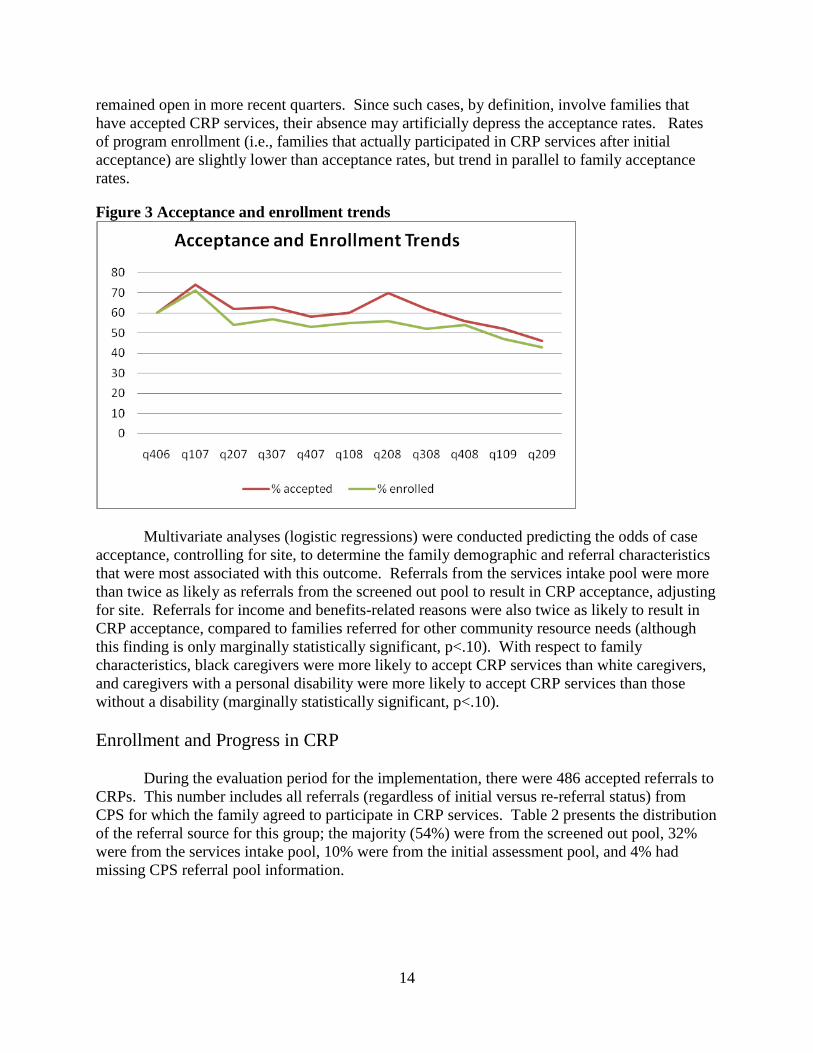
remained open in more recent quarters. Since such cases, by definition, involve families that
have accepted CRP services, their absence may artificially depress the acceptance rates. Rates
of program enrollment (i.e., families that actually participated in CRP services after initial
acceptance) are slightly lower than acceptance rates, but trend in parallel to family acceptance
rates.
Figure 3 Acceptance and enrollment trends
Multivariate analyses (logistic regressions) were conducted predicting the odds of case
acceptance, controlling for site, to determine the family demographic and referral characteristics
that were most associated with this outcome. Referrals from the services intake pool were more
than twice as likely as referrals from the screened out pool to result in CRP acceptance, adjusting
for site. Referrals for income and benefits-related reasons were also twice as likely to result in
CRP acceptance, compared to families referred for other community resource needs (although
this finding is only marginally statistically significant, p<.10). With respect to family
characteristics, black caregivers were more likely to accept CRP services than white caregivers,
and caregivers with a personal disability were more likely to accept CRP services than those
without a disability (marginally statistically significant, p<.10).
Enrollment and Progress in CRP
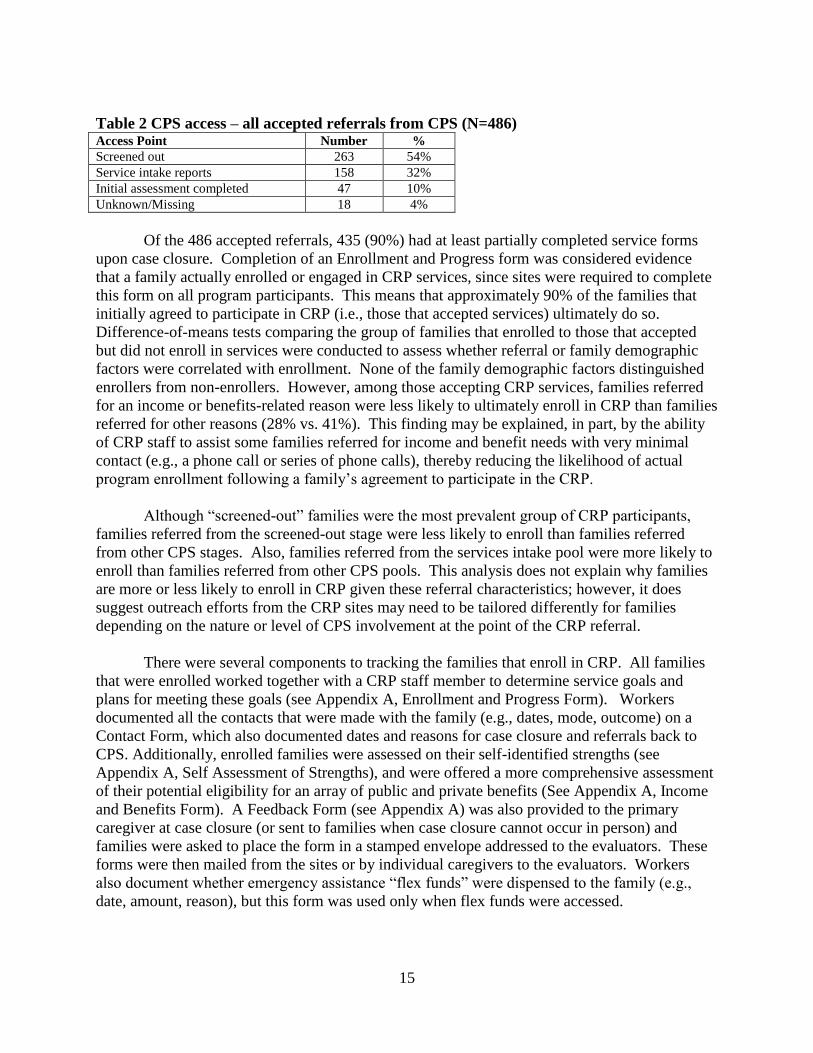
During the evaluation period for the implementation, there were 486 accepted referrals to
CRPs. This number includes all referrals (regardless of initial versus re-referral status) from
CPS for which the family agreed to participate in CRP services. Table 2 presents the distribution
of the referral source for this group; the majority (54%) were from the screened out pool, 32%
were from the services intake pool, 10% were from the initial assessment pool, and 4% had
missing CPS referral pool information.
15
Table 2 CPS access – all accepted referrals from CPS (N=486) Access Point Number %
Screened out 263 54%
Service intake reports 158 32%
Initial assessment completed 47 10%
Unknown/Missing 18 4%
Of the 486 accepted referrals, 435 (90%) had at least partially completed service forms
upon case closure. Completion of an Enrollment and Progress form was considered evidence
that a family actually enrolled or engaged in CRP services, since sites were required to complete
this form on all program participants. This means that approximately 90% of the families that
initially agreed to participate in CRP (i.e., those that accepted services) ultimately do so.
Difference-of-means tests comparing the group of families that enrolled to those that accepted
but did not enroll in services were conducted to assess whether referral or family demographic
factors were correlated with enrollment. None of the family demographic factors distinguished
enrollers from non-enrollers. However, among those accepting CRP services, families referred
for an income or benefits-related reason were less likely to ultimately enroll in CRP than families
referred for other reasons (28% vs. 41%). This finding may be explained, in part, by the ability
of CRP staff to assist some families referred for income and benefit needs with very minimal
contact (e.g., a phone call or series of phone calls), thereby reducing the likelihood of actual
program enrollment following a family’s agreement to participate in the CRP.
Although “screened-out” families were the most prevalent group of CRP participants,
families referred from the screened-out stage were less likely to enroll than families referred
from other CPS stages. Also, families referred from the services intake pool were more likely to
enroll than families referred from other CPS pools. This analysis does not explain why families
are more or less likely to enroll in CRP given these referral characteristics; however, it does
suggest outreach efforts from the CRP sites may need to be tailored differently for families
depending on the nature or level of CPS involvement at the point of the CRP referral.
There were several components to tracking the families that enroll in CRP. All families
that were enrolled worked together with a CRP staff member to determine service goals and
plans for meeting these goals (see Appendix A, Enrollment and Progress Form). Workers
documented all the contacts that were made with the family (e.g., dates, mode, outcome) on a
Contact Form, which also documented dates and reasons for case closure and referrals back to
CPS. Additionally, enrolled families were assessed on their self-identified strengths (see
Appendix A, Self Assessment of Strengths), and were offered a more comprehensive assessment
of their potential eligibility for an array of public and private benefits (See Appendix A, Income
and Benefits Form). A Feedback Form (see Appendix A) was also provided to the primary
caregiver at case closure (or sent to families when case closure cannot occur in person) and
families were asked to place the form in a stamped envelope addressed to the evaluators. These
forms were then mailed from the sites or by individual caregivers to the evaluators. Workers
also document whether emergency assistance “flex funds” were dispensed to the family (e.g.,
date, amount, reason), but this form was used only when flex funds were accessed.

16
Among the forms to be completed by CRP staff, the income and benefits form had the
lowest completion rate (73%). In order to be counted as “complete,” participants had to provide
at least some information on income and benefits receipt. Sites varied in terms of their success
in collecting income and benefits information, but why such variation exists is unclear.
Each enrolled participant in the CRP was also asked to complete a Program Feedback
form at the point of case closure. However, given low initial response rates for the Program
Feedback form, the Children’s Trust Fund changed the procedures for administering this form
midway through the implementation period. These changes involved providing sites with extra
funds to offer incentives ($10) to program participants to complete the form at the case closure
stage. Participants who agreed to complete the form were provided with a stamped, addressed
envelope to mail to the evaluators, which participants could choose to mail from the CRP site or
from home. Provision of feedback incentives was significantly associated with increased
completion of feedback forms (51% among those who received the incentive vs. 17% among
those who did not).
In the context of the CRP service intervention, contacts with families ranged from
telephone and written contacts to more service intensive contacts such as visits to the family’s
home and family team meetings (see Table 3). Overall, telephone and home contacts were quite
prevalent; over 80% of CRP participants were visited in their homes at least once, and nearly
90% were contacted at least once by telephone. Written contacts occurred with 39% of families
enrolled in CRP; and approximately the same proportion of participants met with CRP staff at
the program site (14%) and at other community locations (15%). Only 3% (N=12) participants
were involved in a family team meeting during the final report evaluation period. See tables 3
and 4 for information on type and number of contacts and family success in CRP.
Table 3 Percent of enrolled participants with each type of contact (for those with completed
contact forms, N=433) Type Number %
Telephone 384 88.7%
Family home 363 82.9%
Program office 62 14.3%
Other community location 66 15.2%
Written communication 169 39.0%
Family team meeting 12 2.8%
As shown in Table 4, visits to the families’ homes also occurred relatively frequently,
with an average of three home contacts overall. There was considerable variation in the number
of visits to family homes by site, ranging from an average of about 2 visits per family to almost
14 visits per family. With the exception of telephone contacts (mean = 4), all other forms of
contact were relatively infrequent. There was also significant variation in the number of
telephone contacts by site, ranging from 0 to an average of 20 telephone contacts per family.

17
Table 4 Mean number of contacts by type (for those with completed contact forms, N=433)
Type Mean Standard
Deviation
Range
Telephone 4.3 5.3 0-51
Family home 3.0 4.2 0-43
Program office .4 1.5 0-15
Other community location .31 1.1 0-12
Written communication .6 1.1 0-13
Family team meeting .04 .3 0-3
As noted above, 73% of CRP participants completed an Income and Benefits Inventory
during their service period. Table 5 provides the prevalence of benefit receipt for a range of
benefits, most of which are income-tested. Within this subset of participants, approximately
64% reported currently receiving FoodShare ( the Supplemental Nutrition Assistance Program
(SNAP; formerly called Food Stamps), nearly 82% reported having some form of health
insurance (Medicaid, Badger Care, Badger Care Plus, or some other form of insurance), close to
40% reported receipt of Women, Infant, and Children’s (WIC) Program benefits, and a similar
percentage report receiving some form of child support payments or alimony (37%). One
quarter of participants reported that they receive disability benefits for someone in their family,
and 30% had received the Earned Income Tax Credit (EITC). Relatively few participants
reported receipt of unemployment insurance benefits (8%), housing assistance (15%), child care
subsidies (13%), and Temporary Assistance for Needy Families (TANF, or “Wisconsin-
Works/W-2”; 7%).
Table 5 Income and benefits receipt at enrollment (for participants with completed income
and benefits inventories; N=317) Income Source %
Temporary Assistance to Needy Families/Wisconsin Works 6.8%
FoodShare/FoodStamps/Supplemental Nutrition Assistance
Program
63.8%
Medicaid/Badgercare/Badgercare Plus or other insurance 81.8%
Medicaid Mileage Reimbursement 10.0%
Child support/alimony 37.0%
Child care subsidies 13.1%
Disability benefits 25.5%
Housing assistance 15.2%
Women, Infants, and Children 40.8%
Earned Income Tax Credit 29.4%
Unemployment benefits 8.3%
Social security benefits 4.5%
Worker’s compensation 0%
Foster care/adoption assistance 1.9%
Financial support from ex-partner 4.5%
Homestead tax credit 10.9%
Utility assistance 32.0%
Crisis assistance 9.9%
Other 7.1%
18
A smaller subgroup (N=144, 33% of enrolled participants) answered information on
questions pertaining to their monthly income amounts, and amount needed to “get by” each
month. The average monthly income reported by this subgroup was $1,134 (range $0 - $5,000),
while the reported needed income averaged $1,500 (range $300 - $8,500). These findings
suggest that participants had income levels that may meet eligibility criteria for a range of public
benefits, but also that monthly incomes were, on average, $369 short of being adequate to meet
monthly expenses.
Service Goals and Progress
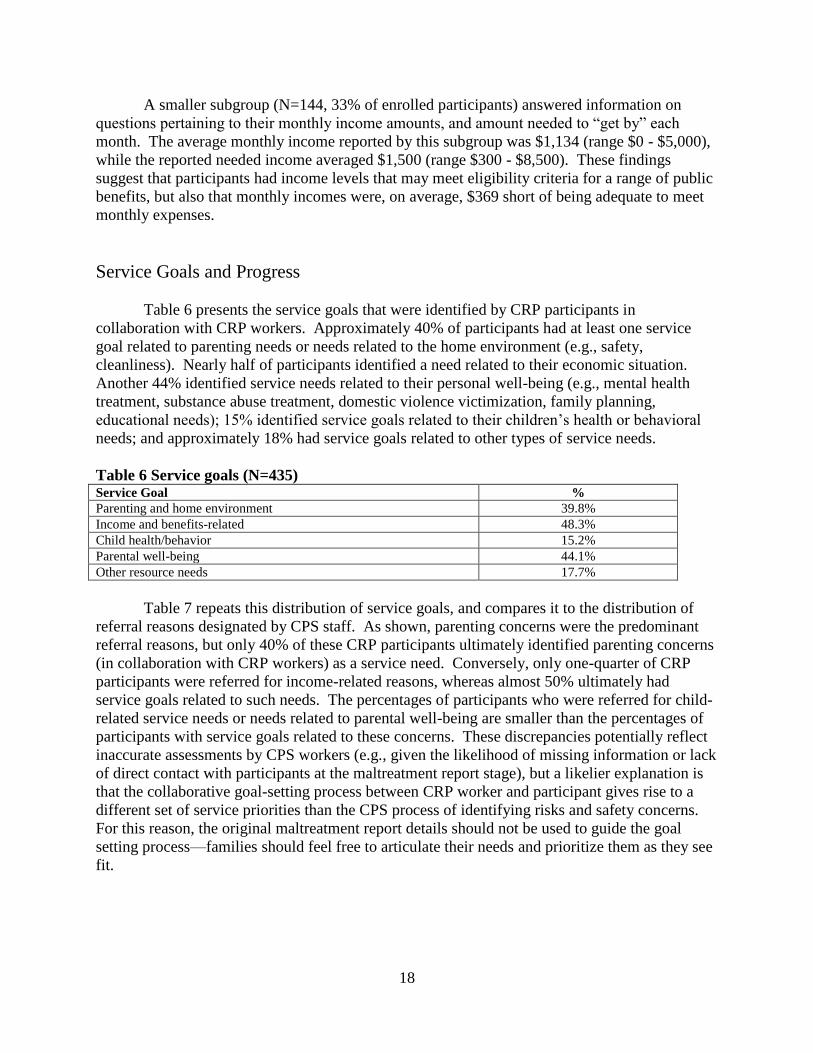
Table 6 presents the service goals that were identified by CRP participants in
collaboration with CRP workers. Approximately 40% of participants had at least one service
goal related to parenting needs or needs related to the home environment (e.g., safety,
cleanliness). Nearly half of participants identified a need related to their economic situation.
Another 44% identified service needs related to their personal well-being (e.g., mental health
treatment, substance abuse treatment, domestic violence victimization, family planning,
educational needs); 15% identified service goals related to their children’s health or behavioral
needs; and approximately 18% had service goals related to other types of service needs.
Table 6 Service goals (N=435) Service Goal %
Parenting and home environment 39.8%
Income and benefits-related 48.3%
Child health/behavior 15.2%
Parental well-being 44.1%
Other resource needs 17.7%
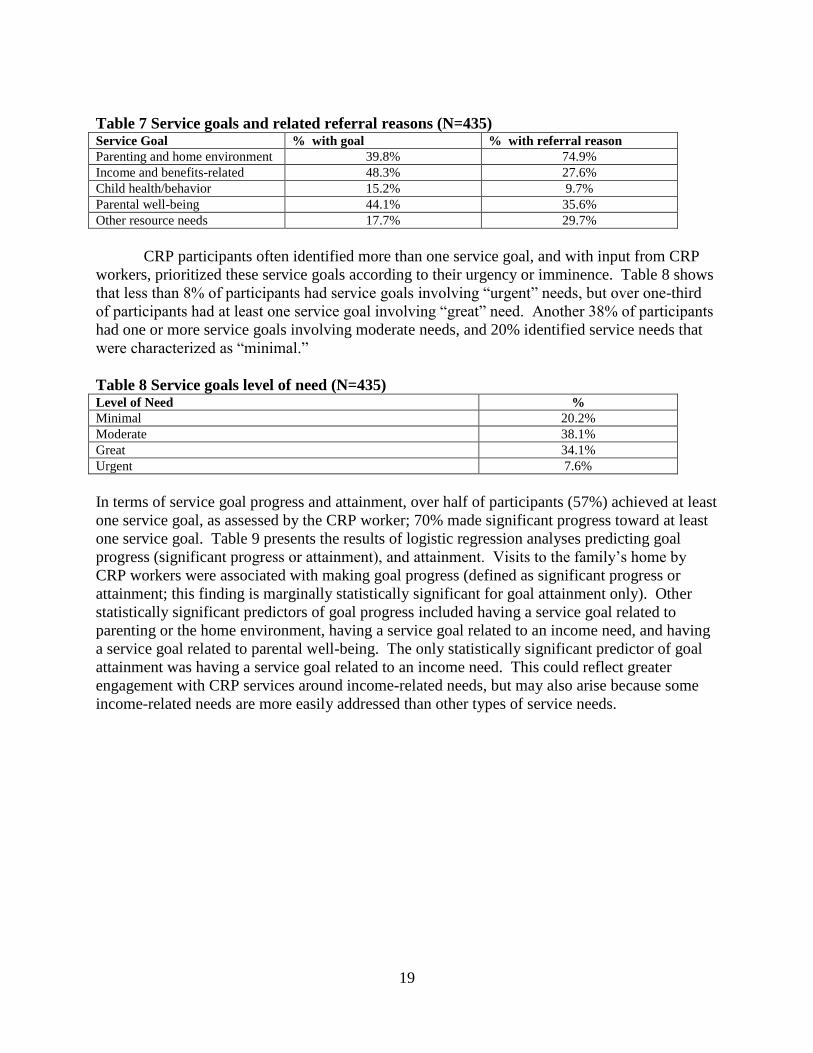
Table 7 repeats this distribution of service goals, and compares it to the distribution of
referral reasons designated by CPS staff. As shown, parenting concerns were the predominant
referral reasons, but only 40% of these CRP participants ultimately identified parenting concerns
(in collaboration with CRP workers) as a service need. Conversely, only one-quarter of CRP
participants were referred for income-related reasons, whereas almost 50% ultimately had
service goals related to such needs. The percentages of participants who were referred for child-
related service needs or needs related to parental well-being are smaller than the percentages of
participants with service goals related to these concerns. These discrepancies potentially reflect
inaccurate assessments by CPS workers (e.g., given the likelihood of missing information or lack
of direct contact with participants at the maltreatment report stage), but a likelier explanation is
that the collaborative goal-setting process between CRP worker and participant gives rise to a
different set of service priorities than the CPS process of identifying risks and safety concerns.
For this reason, the original maltreatment report details should not be used to guide the goal
setting process—families should feel free to articulate their needs and prioritize them as they see
fit.
19
Table 7 Service goals and related referral reasons (N=435) Service Goal % with goal % with referral reason
Parenting and home environment 39.8% 74.9%
Income and benefits-related 48.3% 27.6%
Child health/behavior 15.2% 9.7%
Parental well-being 44.1% 35.6%
Other resource needs 17.7% 29.7%
CRP participants often identified more than one service goal, and with input from CRP
workers, prioritized these service goals according to their urgency or imminence. Table 8 shows
that less than 8% of participants had service goals involving “urgent” needs, but over one-third
of participants had at least one service goal involving “great” need. Another 38% of participants
had one or more service goals involving moderate needs, and 20% identified service needs that
were characterized as “minimal.”
Table 8 Service goals level of need (N=435) Level of Need %
Minimal 20.2%
Moderate 38.1%
Great 34.1%
Urgent 7.6%
In terms of service goal progress and attainment, over half of participants (57%) achieved at least
one service goal, as assessed by the CRP worker; 70% made significant progress toward at least
one service goal. Table 9 presents the results of logistic regression analyses predicting goal
progress (significant progress or attainment), and attainment. Visits to the family’s home by
CRP workers were associated with making goal progress (defined as significant progress or
attainment; this finding is marginally statistically significant for goal attainment only). Other
statistically significant predictors of goal progress included having a service goal related to
parenting or the home environment, having a service goal related to an income need, and having
a service goal related to parental well-being. The only statistically significant predictor of goal
attainment was having a service goal related to an income need. This could reflect greater
engagement with CRP services around income-related needs, but may also arise because some
income-related needs are more easily addressed than other types of service needs.

20
Table 9. Service factors associated with goal progress and attainment (N=435) Significant progress toward
goal attainment/
Goal attainment
Goal attainment
Odds ratio
(SE)
Odds ratio
(SE)
Any visits to the family’s home 2.64** (.33) 1.74+ (.32)
Any visits at CRP site 1.45 (.40) 2.09+ (.38)
Any family team meetings 2.67 (1.19) 2.49 (.27)
Any written contacts .79 (.26) .94 (.24)
Any telephone contacts (reference group) - - - -
Service goal: parenting and home environment 1.84* (.28) .96 (.25)
Service goal: income and benefits-related 3.11*** (.31) 2.60*** (.28)
Service goal: child health/behavior 1.89+ (.38) 1.87
+ (.33)
Service goal: parental well-being 2.27** (.28) .92 (.25)
Service goal: other resource needs (reference group) - - - -
Constant .18** (.55) .30 (.51)
***p<.001; **p<.01; *p<.05; +p<.10; controls for CRP site, family referral and demographic
characteristics, and prior CPS involvement not shown.
Table 9 shows that having a visit in the family’s home is a predictor of making significant
progress toward attaining a service goal. Table 10 explores this relationship further by
examining the role of the number of visits in their home a family received and the number of
months a family received these visitsf. First, however, it is important to note that 98% of all
visits occurred within six months of program enrollment.
There was no significant relationship between the number of visits in the family’s home
and making significant progress toward goal attainment or achieving a goal. However, the
length of time a family received visits in their home was associated with both variables. Having
these visits for a longer period of time (within a six month time frame) was significantly
associated with achieving a service goal, and marginally associated with making significant
progress toward attaining a goal.
Table 10. Goal progress and attainment related to receiving CRP in the family’s home
Significant progress toward goal attainment/
Goal attainment
Odds ratio
(SE)
Odds ratio
(SE)
Number of visits in
the family’s home .991 (1.104) .923 (1.132))
Number of months
visits were received 1.409+ (1.224) 2.077** (1.289)
***p<.001; **p<.01; *p<.05; +p<.10; controls for CRP site, family referral and demographic
characteristics, and prior CPS involvement not shown.
21
Program Satisfaction
Without the benefit of a comparison group, it is difficult to gauge the impact of the CRP
on participant and family well-being. However, several suggestive findings emerged from
descriptive analysis of participants’ assessments of family strengths measured at entry in the
CRP and at exit from the CRP. Ninety-nine (23%) of the 435 enrolled participants completed
the Strengths Assessment at intake and follow-up. Family strengths were measured with six
items related to a participant’s perception of the availability of social and instrumental support,
knowledge and self-efficacy related to accessing community resources, and feeling that one’s
family had adequate resources. A high score on the scale indicates fewer self-assessed strengths.
Between program entry and exit, the average score on the Strengths Assessment measure
dropped from 12.9 to 8.7 (p<.01), reflecting a significant improvement in family strengths, as
assessed by the primary caregiver.
Differences between those who completed the assessment at both points and those who
did not were also analyzed. Service characteristics were also compared, and several significant
differences were identified for the group that completed follow-up forms compared to those who
did not. Those with follow-up information were more likely to have had a visit in their own
home during their participation in CRP than participants without follow-up forms (97% vs.
79%), and more likely to have an income-related service goal than participants lacking a follow-
up form (66% vs. 33%). Other types of service goals (e.g., related to parenting, parental well-
being, child behavior or health issues) did not explain differences between those who returned
follow-up forms and those who did not. It is not clear whether receiving the intervention in a
family’s home explains a greater tendency to engage in CRP services, or are simply just more
likely the longer a family remains engaged in CRP services. Although there are almost certainly
other (unmeasured) factors that are associated with returning feedback forms, the finding that
participants assess family strengths more positively at program exit is suggestive of program
satisfaction, if not program impact. More rigorous assessments involving comparison groups are
needed, however, before conclusions about program impact can be drawn.
Questions about program satisfaction are also administered when participants exit the
CRP. Participants rated the extent to which they found the program beneficial overall, whether
the program helped them manage stress, whether they felt respected by staff, whether their ideas
were welcomed and included, whether they made use of resources, and made positive changes in
their lives as a result of program participation. On all items, the average rating was between
“strongly agree” and “somewhat agree,” suggesting a high degree of program satisfaction.
Although a select group (N=99) completed program feedback forms, this finding provides some
indication that the CRP intervention is viewed positively by program participants.
Summary of Main Findings
Service acceptance rates varied across sites, from 28% to 83%, with an average
acceptance rate of 54%.
Referral rates from CPS to CRP were low relative to the potential pool of eligible
families.
22
The majority of referrals to CRPs were families screened out of CPS at the report stage,
but CRP workers were less successful in engaging these families than families at
different “front-end” junctures.
Over 80% of participants received at least one visit to their home from a CRP worker,
and these visits were associated with making significant progress toward one or more
service goals.
The reasons for referring families to the CRPs differed from the service needs articulated
by CRP participants; CPS referrals were most commonly related to parenting needs,
whereas the service needs identified by CRP participants were most often related to
income needs.
Although participant reports of public benefit receipt were relatively low at CRP intake,
most participants reported income levels that are likely to meet income-tested eligibility
criteria for a range of public benefits.
The majority (70%) of participants made significant progress toward at least one service
goal, and 57% achieved at least one goal, as determined by CRP workers; having an
income-related service goal was highly predictive of goal attainment.
Participants assessed their families’ strengths more positively at program exit compared
to program entry, and participants reported a high degree of program satisfaction at
program exit.
Conclusion
The Community Response Program (CRP) Pilot Initiative funded by the Wisconsin
Children’s Trust Fund and implemented in eleven sites across the State showed promising results
with respect to engaging and serving families previously not served by CPS systems due to
insufficient levels of risk. Given findings from the extant literature suggesting that this
population remains at risk of returning to CPS due to unresolved or escalating levels of risk, the
CRP model helps to fill a critical gap in the child maltreatment prevention continuum of services.
The implementation evaluation offers several valuable insights about the characteristics
of families served by CRPs, their service needs, and aspects of this model that are associated
with positive service outcomes for families. Whereas over three-quarters of families were
referred by CPS staff for parenting-related concerns, collaborative goals developed by the CRP
participants and CRP workers were most likely to be associated with income-related needs.
Given that participating families reported relatively low levels of monthly income, as well as low
levels of monthly income relative to income needs, there may be reason to suspect that the
population targeted by CRPs could benefit from services designed to address economic
instability. One of the strongest predictors of service goal attainment—having an income-related
service goal—further suggests that the CRP models are capable of engaging and successfully
working with families around their economic needs.17
17
Due to the findings that families with economic goals were more likely to attain their goals, and that many
families who were potentially eligible for benefits and not receiving them, CTF piloted an economic support version
of Community Response in La Crosse from May of 2010-2011. In addition, they will begin funding a randomized
control experiment in Milwaukee in July of 2011 to determine the preventive role of economic supports in child
maltreatment.
23
Several factors are essential to consider in the design and implementation of CRPs. A
clear articulation of the service model, including the target population, referral criteria, outreach
mechanisms and engagement strategies, service array, and the criteria for closing a case is
critical. Moreover, these aspects of the service model should be continually monitored, given
findings from the implementation evaluation related to changes over time in the intended target
population in several sites.
The population served by the Wisconsin CRP Pilot Initiative encompasses families
struggling with a range of service needs and risk factors associated with child maltreatment. The
CRP model offers a strategy for systematically targeting these families for the purpose of child
maltreatment prevention. As Wisconsin strives to round out its prevention service continuum,
the CRP model should be considered a critical element of the service array.

24
Appendix A: Service Forms INTAKE FORM
Today’s date: / / CRP intake staff initials:
Name: Primary caregiver: (first, middle, last) eWISACWIS Case Head I.D. (if applicable/known):
If applicable, partner:
(first, middle, last)
Contact
information:
Address:
Phone numbers:
E-mail:
Sex: Female
Male
Family structure: Living with partner: Yes No Unknown
Number children in home: # Unknown
Caregiver/partner pregnant?
Yes No Unknown
Race/ethnicity (check all that apply):
American Indian or Alaskan Native Asian
Black/African American Hispanic/Latino White
Unknown Other (specify):
Primary home language:
English Spanish Hmong Unknown
Other (specify):
Caregiver Disability: Yes No Unknown Child Disability: Yes No Unknown
Source of referral to CRP: CPS Self-referral Other (specify): Check if re-referral
[If referred from CPS, Screened out/no investigation Investigated/not substantiated Investigated/substantiated
check one]: Services intake report Unknown Other (specify):
Reasons for referral
to CRP (check all that
apply):
Insufficient income/benefits eligibility Health care access (child or caregiver)
Nutrition/food/hunger concerns Utilites (e.g., gas, electric, phone)
Housing/homelessness issues Unemployment/underemployment
Parenting/caretaking concerns (e.g., inadequate supervision, discipline, knowledge)
Problems with home environment (e,g,, unclean, unsafe)
Child health/behavior concerns Concerns about unborn child/prenatal care
Caregiver alcohol or drug use Mental health concerns related to caregiver(s)
Domestic violence issues Access to community resources (specify):
Other (specify):
Additional Notes:
Assigned to CRP staff
person (name):
Dates and outcomes of attempted contacts prior to enrollment:
/ / / / / / / /
Not available
Declined CRP
Family accepted CRP
At capacity/unable to
serve at this time
Not available
Declined CRP
Family accepted CRP
Not available
Declined CRP
Family accepted CRP
Not available
Declined CRP
Accepted CRP
CRP decision after
family accepts CRP
(check all that apply)
CRP staff enroll family in program [Date of enrollment/acceptance]: / /
Family referred back to CPS prior to CRP enrollment [Date]: / /
Family referred elsewhere prior to CRP enrollment [Specify where]:
Family deemed ineligible for further CRP intervention [Reason(s)]:
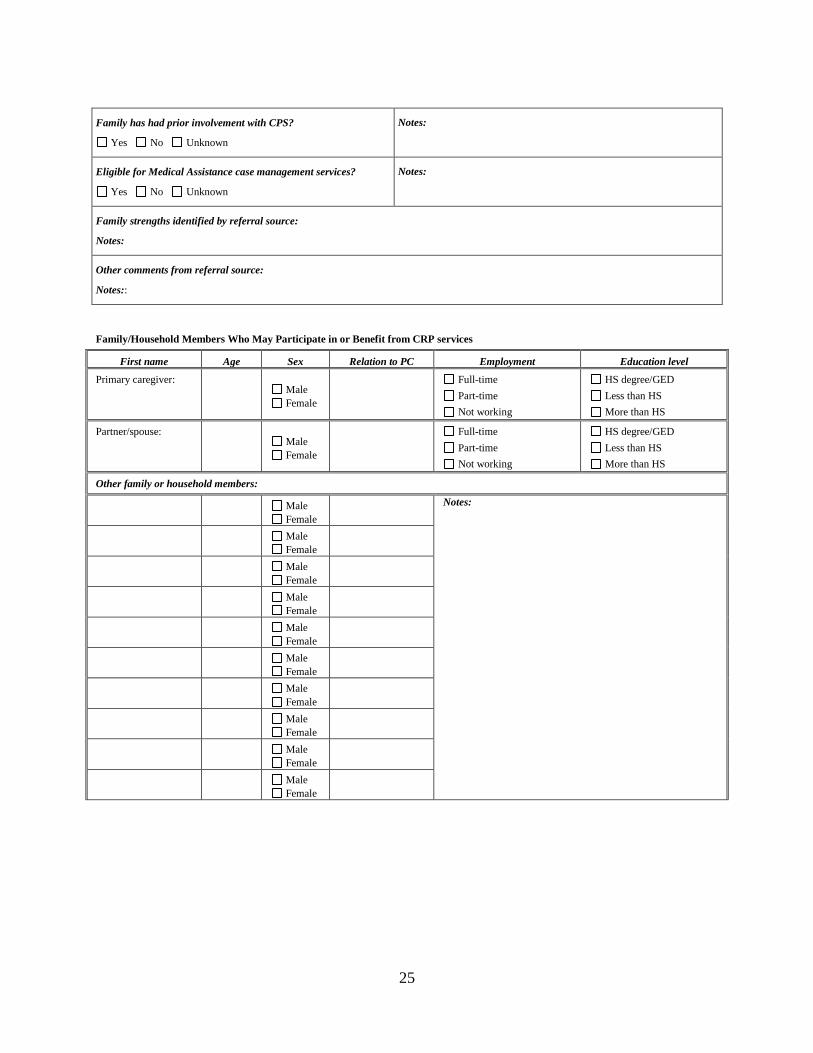
25
Family has had prior involvement with CPS?
Yes No Unknown
Notes:
Eligible for Medical Assistance case management services?
Yes No Unknown
Notes:
Family strengths identified by referral source:
Notes:
Other comments from referral source:
Notes::
Family/Household Members Who May Participate in or Benefit from CRP services
First name Age Sex Relation to PC Employment Education level
Primary caregiver:
Male
Female
Full-time
Part-time
Not working
HS degree/GED
Less than HS
More than HS
Partner/spouse:
Male
Female
Full-time
Part-time
Not working
HS degree/GED
Less than HS
More than HS
Other family or household members:
Male
Female
Notes:
Male
Female
Male
Female
Male
Female
Male
Female
Male
Female
Male
Female
Male
Female
Male
Female
Male
Female

26
Parent/Caregiver First & Last Name: CRP Staff initials: Parent/Caregiver signature:
Initial date of assessment: / /
Service need
(1 or more may
be grouped)
Level of need
(CRP & family
determine together) Goal and steps/activities toward goal
Monthly Progress Toward Goal
(use keys above)
1.
1. minimal
2. moderate 3. great
4. urgent
Goals:
Date: Progress:
Date: Progress:
Date: Progress:
Date: Progress:
Activities/Steps (and by whom):
Referral to:
Dates:
/ /
/ /
/ /
/ /
2.
1. minimal
2. moderate
3. great 4. urgent
Goals: Date: Progress:
Date: Progress:
Date: Progress:
Date: Progress:
Activities/Steps (and by whom):
Referral to:
Dates:
/ /
/ /
/ /
/ /
3.
1. minimal
2. moderate 3. great
4. urgent
Goals: Date: Progress:
Date: Progress:
Date: Progress:
Date: Progress:
Activities/Steps (and by whom):
Referral to:
Dates:
/ /
/ /
/ /
/ /
Service area key:
H=housing T=transportation U=utilities I=income & benefits ED=education/job skills E=employment HE=home environment
B=budgeting/financial planning HC=health care access CH=child health P=parenting PNC=prenatal care CC=child care N=nutrition/food
FP=family planning FV=family violence MH=mental health AODA=alcohol/drug use L=legal issue OTH=other (describe):
Progress key:
0=contact attempted, but not made 3=some progress; still a need/goal
1=need is worse; still a need/goal 4=significant progress; still a need/goal
2=unchanged; still a need/goal 5=resolved or attained goal
ENROLLMENT AND PROGRESS FORMS

27
CONTACT LOG Please record the number of each type of contact monthly from the point of case opening.
Year:
Month: January T H P O W F
Month: February T H P O W F
Month: March T H P O W F
1ST Quarter Total T H P O W F
Month: April T H P O W F
Month: May T H P O W F
Month: June T H P O W F
2nd Quarter Total T H P O W F
Month: July T H P O W F
Month: August T H P O W F
Month: September T H P O W F
3rd Quarter Total T H P O W F
Month: October T H P O W F
Month: November T H P O W F
Month: December T H P O W F
4th Quarter Total T H P O W F
REPORT TO CPS MADE BY CRP STAFF PERSON AFTER FAMILY ENROLLMENT IN CRP: Yes No
[IF YES, DATE: / / ] REASON(S):
DATE OF CASE CLOSURE: [ / / ]
PROVIDED FEEDBACK INCENTIVE: Yes No
FLEX FUNDING PROVIDED TO FAMILY: Yes No
AMOUNT: FOR: FOLLOWED-UP: Yes No
NOTES:
LOCAL FUNDING PROVIDED TO FAMILY (NOT IN-KIND SERVICES): Yes No
AMOUNT: FOR: SOURCE(S):
CASE CLOSE REASON(S):
Service goal(s) attained
Family moved out of area
Family no longer engaged
Service time limit reached Other:
Type of contact key:
T = telephone O = other community location H = in family home
W = written communication P = program office F = family team meeting

28
PRIMARY CAREGIVER SELF-ASSESSMENT OF STRENGTHS
“What are some of the strengths or special things about your family?”
First Name: Last Name: Date Completed: / /
“Please read each statement below, and circle the response that indicates whether you strongly agree, somewhat agree, somewhat disagree, or
strongly disagree. If you are unsure, you can say that, too.”
Strongly
Agree
1
Somewhat
Agree
2
Unsure
3
Somewhat
Disagree
4
Strongly
Disagree
5
I have relationships with people who provide me with support when I need it.
I know who to call and where to go in the community
when I need help
I feel good about my ability to parent and take care of my children.
I have people to talk to when I am worried about my
children or my parenting
I am able to meet family’s needs with the money and resources I currently have
I know how to seek help from the agencies in my
community to get things that my family needs.

29
First Name: Last Name: Today’s Date: / / Date Completed: / /
INCOME AND BENEFITS INVENTORY
“These questions ask about your family’s current sources of income and various benefits you may
receive or be interested in receiving. Knowing this information will help us assess whether your
family has all of the benefits that you may be eligible to receive. Would you be willing to complete this assessment?”
Yes No
Currently
receiving?
[If not currently
receiving, record notes
on potential eligibility]:
TANF or W-2 grant? (cash grant only) Y N
Food stamps? Y N
Badger Care, Medical Assistance (MA), or other health insurance?
Record type: Y N
MA Mileage Reimbursement? Y N
Child support or alimony? Y N
Child care subsidies or help from the county or city with child care payments? Y N
Disability benefits (such as Supplemental Security Income or SSI, or OAS-DI)? Y N
Public housing subsidy or other form of housing assistance? Y N
WIC (Women, Infants, and Children’s assistance)? Y N
Earned Income Tax Credit (EITC) or state earned income credit? Y N
Unemployment Insurance? Y N
Social security benefits (SSA) or any other private or government retirement pension? Y N
Worker’s Compensation as a result of a job-related injury? Y N
Foster child payments or adoption subsidies? Y N
Kinship Care payments? Y N
Utility assistance (e.g., Energy Services)? Y N
Homestead Tax Credit? Y N
Crisis assistance or emergency assistance? Y N
Any other sources of income? (Specify):
Y N
“Think of all of the things your family spends money on, including food, rent, car payments, and other bills—how much money do you think you
need each week or each month to be able to get by?”
$ /week OR $ /month
“Thinking of all your sources of income, including any money from work that you do, from family or friends, or from any of the sources in the above table—how much money does your family currently have each week or each month to pay for your expenses?”
$ /week OR $ /month

30
COMMUNITY RESPONSE PROGRAM FEEDBACK FORM Please clearly print your first and last name and place this form in the stamped, addressed envelope provided to you by program staff. These
program staff will NOT receive or see the responses you gave. This information will be used by researchers who are trying to understand the effectiveness of the program.
First name: ____________________ Last name: ____________________
Provide your address only if this feedback form was mailed to you by your worker, or if you took the feedback form home with you to mail in
yourself. The University evaluators will send your gift certificate when they receive your completed form. You do not need to provide your address if you are completing the form at the Community Response Program Office, and leaving it with your worker in a sealed envelope
Street address: ________________________________________ City, state, zip: ________________________________________
Please respond to the following items on a scale of 1 to 5, with 1
being “strongly agree” and 5 being “strongly disagree.” Strongly Agree
1
Somewhat
Agree
2
Unsure
3
Somewhat
Disagree
4
Strongly
Disagree
5
This program was helpful to me.
I feel good about my ability to take care of my children
This program helped me manage stress in my life.
My ideas were welcomed and included in the program.
I am able to meet my family’s needs with the money and resources I currently have.
Program staff at the community response program treated me with
respect.
I have relationships with people who provide me with support when I need it.
The program helped me and my family reach our goals.
The program helped improve my family relationships.
I know who to call and where to go in the community when I need help
I was able to use the information and contacts my support worker
gave me.
I have people to talk to when I have worries about my children or my parenting.
I know how to seek help from the agencies in my community to get
things that my family needs
I made positive changes in my life because of this program.
Are there things that should be changed in the program to make it better and more helpful in the future?
If yes, please describe (use other side of page if needed):
THANK YOU FOR TAKING THE TIME TO HELP US IMPROVE OUR SERVICES!

31
Appendix B: Implementation Questionnaire
Community Response Program (CRP) Initiative
Implementation Questionnaire for CRP Program Staff
March 15, 2007
We are working on the implementation evaluation component of the Community Response
Program (CRP) initiative supported by the Children’s Trust Fund. In order to gauge progress and
understand barriers that arise in the delivery of these models, we are asking a series of questions.
We are requesting that the person from your site who is most knowledgeable about the daily
operations of the CRP program answer these questions as accurately as possible.
We recognize that some of this information may have been included in your original
proposals; however, we also recognize that many sites have made changes to their protocols
since their original proposal. Answering these questions at the present time will help us get a
better sense of how the CRP models are working in practice.
Please be as specific as possible and feel free to include additional information that you feel
would be helpful to understanding the CRP service delivery at your organization. You can
include your answers within this document and either email responses back to us (Kristi and/or
Lonnie), or fax your responses to the attention of Kristi Slack or Lonnie Berger at the School of
Social Work (fax: 608-263-3836).
County/Site:_________________________________________________________
Your name (for follow-up, if clarifications are needed):_______________________
1. Where are your CRP program staff housed?
2. Please list all community agency partners in the program:
3. Besides child protective services (CPS), are there any other sources of direct referrals to
your CRP? If so, please list them:

32
4. a. In addition to your CRP partners, what service providers are aware of the CRP in your
community?
b. How were these service providers informed about the CRP? (E.g., letter, email,
meeting, other?) Please explain.
5. What criteria are used to determine referrals to your CRP?
a. Given your understanding of your site’s CRP model, who should be referred to
CRP?
b. Who should NOT be referred to CRP?
c. Is CPS referring families to your program who you feel should not be referred?
Please describe these families.
d. To the best of your knowledge, is CPS referring ALL families to you who meet
your program’s referral criteria? If not, please explain why this may be occurring
and which families may not be being referred.
33
e. In what capacity were CRP-referred families involved with CPS prior to their
referral to the CRP? Please check all that apply. If it is possible to approximate
the percentages in each relevant category, please do so.
□ Investigated, substantiated, and CPS case was opened _____%
□ Investigated, substantiated, but no CPS case was opened _____%
□ Investigated, unsubstantiated _____%
□ Referral to CPS, but not investigated _____%
□ Not referred from CPS _____%
f. Does your CRP site accept all families that are referred, or do the CRP staff
themselves screen out some families? If applicable, please describe any criteria
used to screen out families referred to CRP.
g. In order to best understand the referral process, we would like to contact someone
from your local CPS agency who is responsible for making referrals to your CRP
to gain a better understanding of the criteria they are using to make referrals. If
more than one person, we would like to contact someone who has made most of
the referrals so far. Please provide the name, email and/or phone number of the
appropriate CPS staff person:
6. If a family has met criteria for the CRP, how do CRP staff make the initial contact with
the family? Please check all that apply.
□ Phone call
□ Letter
□ Visit to home
□ Other, please specify: __________________________________
a. Prior to CRP staff’s involvement, does the CPS worker inform the family that
they are being referred to CRP?
b. What is the role or title of the CPS worker, CRP staff person, or other service
provider who initially informs the family of their referral to CRP?

34
7. From the point of CRP’s acceptance of a referral, what is the typical time frame in which
a family is contacted for CRP intake?
a. Where does the CRP intake typically occur?
b. What is the role and title of the CRP staff person who completes the CRP intake?
c. Have any sections or questions on the intake form been difficult for the staff to
ask or for clients to answer? Please explain.
8. Once connected to CRP, what are possible services options?
a. What has been or what are you expecting to be the most common service offered?
b. Have any sections or questions on the enrollment and/or progress form been difficult
for the staff to ask or for clients to answer? Please explain.
9. What services could a client expect to receive within:
a. 1 week of CRP intake?
b. 2 weeks of CRP intake?
c. 1 month of CRP intake?
d. 6 months of CRP intake?
35
10. How is it determined when a CRP case should be closed?
a. Who typically makes this decision?
b. Are services time-limited?
c. How is case closing communicated with the client?
d. Is there further communication with the client after case closing?
11. What is/are your CRP site’s measure(s) of success? Please also comment on whether and
how you determine if family functioning improved.
12. In addition to the program feedback form that has been adopted, how does your CRP gain
feedback from:
a. Clients?
b. Service providers?
c. Community stakeholders?
13. Any additional information or comments: