Community Health Needs Assessment Implementation Strategy ...
33
Community Health Needs Assessment Implementation Strategy Plan 2013–2016
Transcript of Community Health Needs Assessment Implementation Strategy ...

Community Health Needs AssessmentImplementation Strategy Plan
2013–2016

Table of ConTenTs Community HealtH needs assessment ................................................................................................................2Description of Community Served ....................................................................................................................................2
Process for Conducting Assessment .............................................................................................................................. 14
Assessment and Selection of Public Health Priorities ................................................................................................. 16
Community HealtH improvement strategy ...................................................................................................... 21
Prevent Chronic Disease ................................................................................................................................................. 21
Reduce Obesity in Children and Adults ........................................................................................................................ 23
Promote Behavioral Health and Prevent Substance Abuse ........................................................................................ 25
Neonatal Abstinence Syndrome ..................................................................................................................................... 25
Priorities Not Addressed ................................................................................................................................................. 26
Dissemination of Plan to the Public .............................................................................................................................. 26
appendix i ..............................................................................................................................................................................27
our mission (reaffirmed by The board of TrusTees, 2013)
We are passionate healers dedicated to honoring the Sacred in our sisters and brothers.
our VisionTo be world-renowned for passionate patient care
and outstanding clinical outcomes.
Core ValuesIn the spirit of good Stewardship, we heal by practicing:
Compassion through our kindness, concern and genuine caring; Reverence in honoring the dignity of the human spirit; Excellence by expecting the best of ourselves and others; Integrity by being and speaking the truth.

22013 Community Health Needs Assessment www.sjhsyr.org
CommuniTy healTh needs assessmenT
Description of the community serveD
While St. Joseph’s serves a 16-county area, the majority of patients live in Onondaga County, and many within the city of Syracuse.
*The following narrative is taken directly from the Onondaga County Community Health Assessment, 2013, to which St. Joseph’s contributed; all data in this section are from the U.S. Census Bureau unless otherwise noted.
Onondaga County is located in Central New York State (Figure 1). It covers 780 square miles and is bordered by Oswego County to the north, Cayuga County to the west, Cortland County to the south, and Madison County to the east.
Figure 1. Location of Onondaga County within New York State (Source: http://en.wikipedia.org/wiki/File:Map_of_New_York_highlighting_Onondaga_County.svg)
The population of Onondaga County is 466,852 (2012) making it the sixth most populous county in upstate New York. Onondaga County consists primarily of forests and agricultural lands, resulting in a population density of 600 persons/mi2. The County seat is the City of Syracuse, located near the center of the county as seen in Figure 2. In addition to Syracuse, 19 towns, 15 villages and the Onondaga Nation territory lie within the County’s borders. Of note, Onondaga County also contains the intersection of Interstates 90 and 81 which are major east-west and north-south thoroughfares.
Figure 2. Map of Onondaga County (Source: New York State: http://www.nysegov.com/map-NY.cfm)
Syracuse is the largest city in the Central New York (CNY) region with a population of 145,135, accounting for almost one-third of the total county population. Syracuse is the fourth largest upstate NewYork city, after Buffalo, Rochester, and Yonkers. Other heavily populated towns in Onondaga County include Clay, Salina and Cicero in the northwest sector and Dewitt and Manlius in the southeast. Figure 3 shows the urban population of Onondaga County by census tract for 2010. Urban population is defined as the percentage of residents of a territory who live in areas that “encompass at least 2,500 people, at least 1,500 of which reside outside institutional group quarters.”

32013 Community Health Needs Assessment www.sjhsyr.org
Figure 3. Urban population by census tract, Onondaga County, 2010 (Source: Community Commons Map Room at http://www.communitycommons.org/maps-data/)
The demographic characteristics of a population are associated with a variety of health outcomes including health-associated behaviors, as well as with health care access and utilization. Significant differences in the demographics between residents of Syracuse and the rest of Onondaga County contribute to geographic disparities in health. Given the extent of these differences, where feasible and available, data are presented separately for Syracuse and Onondaga County. Other disparities are also addressed in this section.
Age AnD genDer
Age distribution can have a major impact on the health outcomes and the health care needs of a community. The median age in Onondaga County is 38.7 years; greater than the median age of 29.2 years in Syracuse. Although Onondaga County’s population distribution is relatively comparable to that of New York State (Figure 4), Syracuse’s population skews younger than either, with both a higher proportion of residents under age five years and a lower proportion over age 65.
42013 Community Health Needs Assessment www.sjhsyr.org
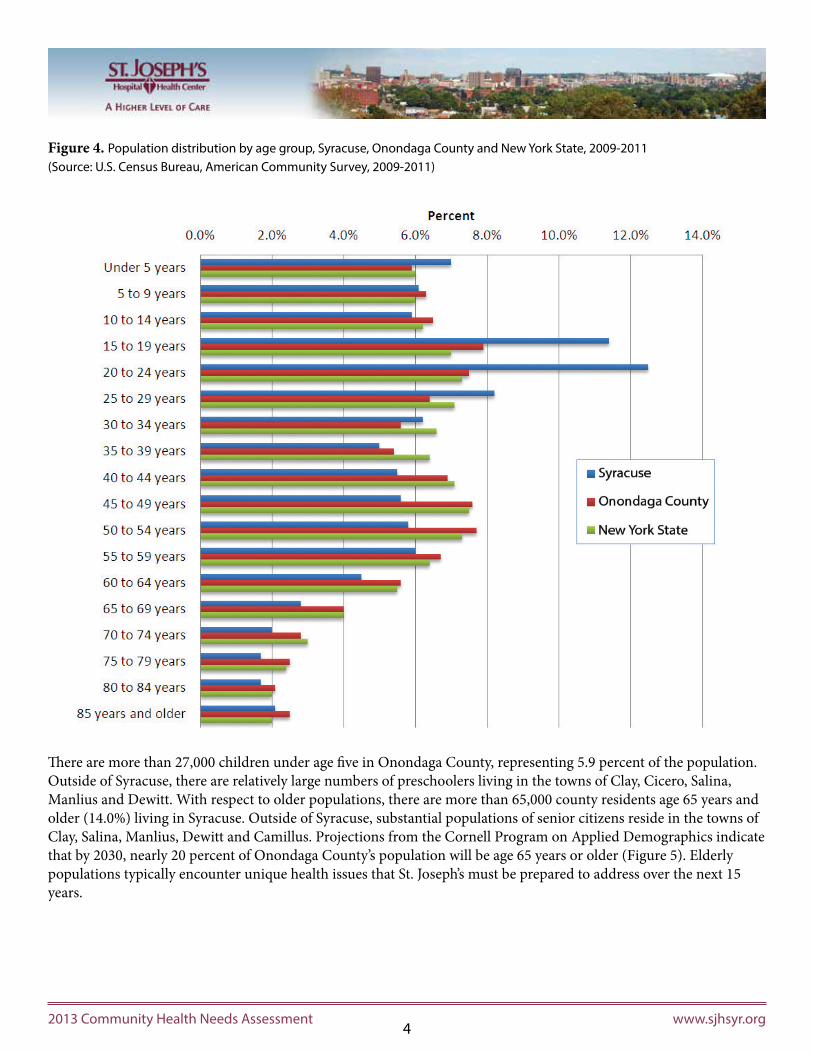
Figure 4. Population distribution by age group, Syracuse, Onondaga County and New York State, 2009-2011 (Source: U.S. Census Bureau, American Community Survey, 2009-2011)
There are more than 27,000 children under age five in Onondaga County, representing 5.9 percent of the population. Outside of Syracuse, there are relatively large numbers of preschoolers living in the towns of Clay, Cicero, Salina, Manlius and Dewitt. With respect to older populations, there are more than 65,000 county residents age 65 years and older (14.0%) living in Syracuse. Outside of Syracuse, substantial populations of senior citizens reside in the towns of Clay, Salina, Manlius, Dewitt and Camillus. Projections from the Cornell Program on Applied Demographics indicate that by 2030, nearly 20 percent of Onondaga County’s population will be age 65 years or older (Figure 5). Elderly populations typically encounter unique health issues that St. Joseph’s must be prepared to address over the next 15 years.

52013 Community Health Needs Assessment www.sjhsyr.org
With respect to gender distribution, women comprise 51.8 percent of the population of Onondaga County and 52.3 percent of the population of Syracuse. Women of childbearing age (generally 15 – 44 years) have specific health needs and health risks. There are nearly 95,000 women in this category in Onondaga County, with roughly 37,000 residing in Syracuse.
rAce AnD ethnicity
Among Onondaga County residents, 97.6 percent identified as being one race. Of these, 81.6 percent self-identify as white and 10.9 percent as black (Figure 6). The majority of the County’s black residents reside in Syracuse (Figure 7), particularly on the near-south and near-west sides of the city. Between the 2000 and 2010 Census, the black population in Syracuse increased by almost 16 percent. Asians and American Indian/Alaska Natives comprise additional racial groups represented in comparatively large numbers. Approximately three percent of Onondaga’s total population self-identifies as Asian and 0.7 percent self-identifies as Native American.
Figure 6. Population by race, Onondaga County, 2009-2011 (Source: U.S. Census Bureau, American Community Survey, 2009-2011)
Figure 5. Projected age distribution for Onondaga County, 2030 (Source: Cornell Program on Applied Demographics, 2011: http://pad.human.cornell.edu/counties/projections.cfm)
62013 Community Health Needs Assessment www.sjhsyr.org
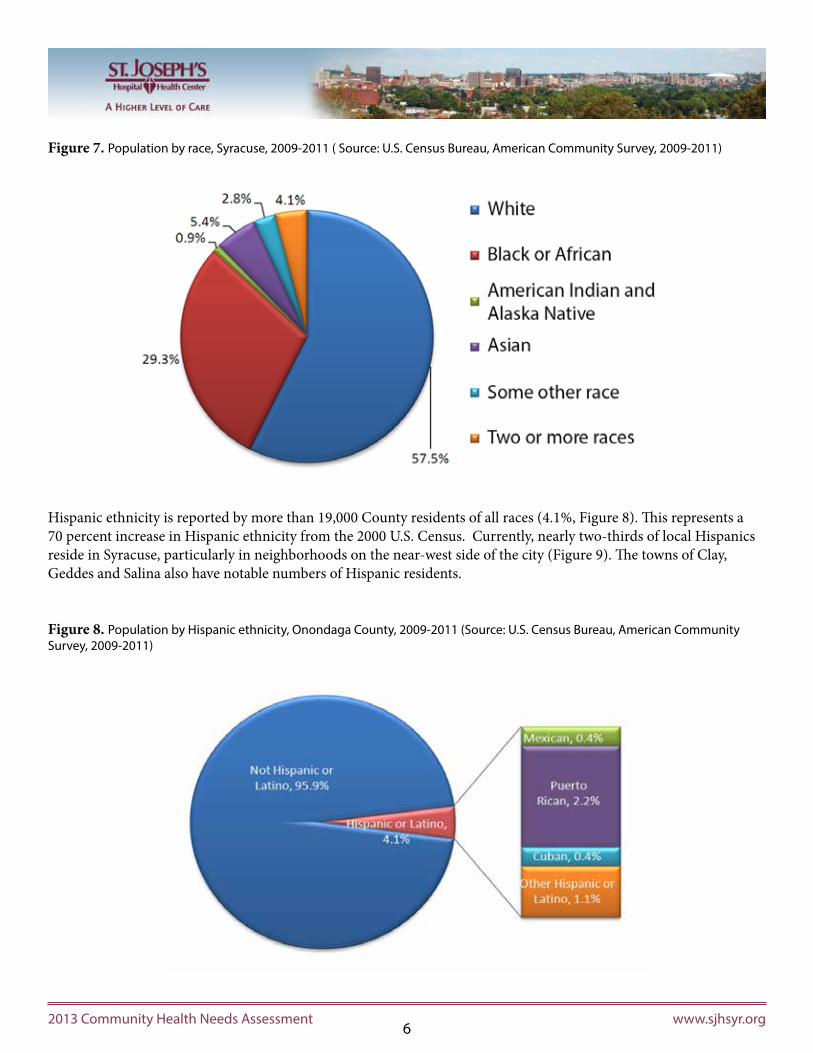
Figure 7. Population by race, Syracuse, 2009-2011 ( Source: U.S. Census Bureau, American Community Survey, 2009-2011)
Hispanic ethnicity is reported by more than 19,000 County residents of all races (4.1%, Figure 8). This represents a 70 percent increase in Hispanic ethnicity from the 2000 U.S. Census. Currently, nearly two-thirds of local Hispanics reside in Syracuse, particularly in neighborhoods on the near-west side of the city (Figure 9). The towns of Clay, Geddes and Salina also have notable numbers of Hispanic residents.
Figure 8. Population by Hispanic ethnicity, Onondaga County, 2009-2011 (Source: U.S. Census Bureau, American Community Survey, 2009-2011)
72013 Community Health Needs Assessment www.sjhsyr.org
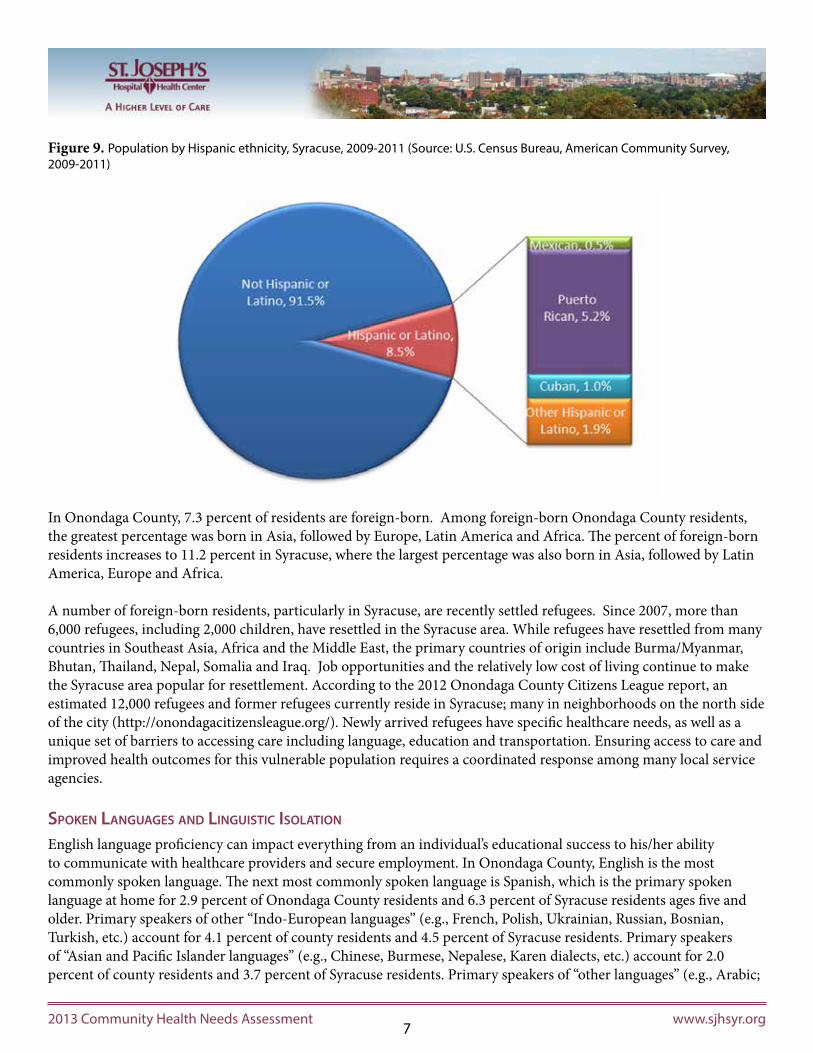
Figure 9. Population by Hispanic ethnicity, Syracuse, 2009-2011 (Source: U.S. Census Bureau, American Community Survey, 2009-2011)
In Onondaga County, 7.3 percent of residents are foreign-born. Among foreign-born Onondaga County residents, the greatest percentage was born in Asia, followed by Europe, Latin America and Africa. The percent of foreign-born residents increases to 11.2 percent in Syracuse, where the largest percentage was also born in Asia, followed by Latin America, Europe and Africa.
A number of foreign-born residents, particularly in Syracuse, are recently settled refugees. Since 2007, more than 6,000 refugees, including 2,000 children, have resettled in the Syracuse area. While refugees have resettled from many countries in Southeast Asia, Africa and the Middle East, the primary countries of origin include Burma/Myanmar, Bhutan, Thailand, Nepal, Somalia and Iraq. Job opportunities and the relatively low cost of living continue to make the Syracuse area popular for resettlement. According to the 2012 Onondaga County Citizens League report, an estimated 12,000 refugees and former refugees currently reside in Syracuse; many in neighborhoods on the north side of the city (http://onondagacitizensleague.org/). Newly arrived refugees have specific healthcare needs, as well as a unique set of barriers to accessing care including language, education and transportation. Ensuring access to care and improved health outcomes for this vulnerable population requires a coordinated response among many local service agencies.
spoken LAnguAges AnD Linguistic isoLAtion
English language proficiency can impact everything from an individual’s educational success to his/her ability to communicate with healthcare providers and secure employment. In Onondaga County, English is the most commonly spoken language. The next most commonly spoken language is Spanish, which is the primary spoken language at home for 2.9 percent of Onondaga County residents and 6.3 percent of Syracuse residents ages five and older. Primary speakers of other “Indo-European languages” (e.g., French, Polish, Ukrainian, Russian, Bosnian, Turkish, etc.) account for 4.1 percent of county residents and 4.5 percent of Syracuse residents. Primary speakers of “Asian and Pacific Islander languages” (e.g., Chinese, Burmese, Nepalese, Karen dialects, etc.) account for 2.0 percent of county residents and 3.7 percent of Syracuse residents. Primary speakers of “other languages” (e.g., Arabic;

82013 Community Health Needs Assessment www.sjhsyr.org
American Indian languages including Onondaga; African languages including Swahili and other Bantu languages; Somali, etc.) account for 0.9 percent of county residents and 2.0 percent of Syracuse residents.
A household is considered linguistically isolated if all adults (age 14 and older) speak a language other than English and none speaks English “very well.” Individuals who speak a language other than English at home and do not speak English “very well” are also considered linguistically isolated. Compared to New York State and the U.S., Onondaga County residents are less likely to be linguistically isolated, with only about 6.2 percent of households speaking a language other than English and only 3.7 percent speaking English less than “very well.” As with other comparable indicators, Syracuse residents are more likely to be linguistically challenged than County residents, with 9.7 percent of households speaking a language other than English and 6.8 percent speaking English less than “very well.”
With respect to English language proficiency among children, 11.9 percent of the more than 22,000 students in the Syracuse City School District are English language learners (ELLs). These students represent 80 countries, with 74 different languages spoken. Approximately half of ELLs are refugees. Most other ELLs are secondary refugees or migrants, immigrants, or individuals who were born in the U.S., but grew up in a home where a language other than English is spoken.
eDucAtion
Educational attainment is an important predictor of health outcomes. As seen in Table 1, among adults age 25 years and older in Onondaga County, 89.3 percent have a high school education or higher, and 32.6 percent have a bachelor’s degree or higher. In Syracuse, these fall to 80.2 percent and 26.1 percent respectively. Table 1. Highest level of education obtained among adults age 25 years and older, Syracuse, Onondaga County and New York State, 2009-2011
There are 18 public school districts in Onondaga County with an enrollment of approximately 70,000 students, including more than 22,000 students in the Syracuse City School District (SCSD). Thirty-four private or parochial schools in the county educate an additional 8,165 students. Disparities in education outcomes between Syracuse and the rest of the county are evident, as SCSD students consistently test significantly below the state average on standardized tests. The district is generally considered one of the lowest performing in New York State, as evidenced by the low pass-rate on tests administered between grades 3 and 8 (pass rates ranged from 19 to 31 percent for all tests over the six grades). In addition, the high school dropout rate in Syracuse was 11 percent for the 2011-12 school year, significantly higher than the average rate of one percent seen in suburban schools. Within the SCSD, the average graduation rate is 52 percent compared with the average suburban district rate of 84.4 percent. The percent of graduates in Syracuse who will go on to some type of college is 77.2 percent, compared with 86.8 percent among suburban students (New York State Report Cards, 2011-2012).

92013 Community Health Needs Assessment www.sjhsyr.org
Unique to the Syracuse area is the Say Yes to Education program, of which St. Joseph’s College of Nursing is a part. Initiated in 2008, the mission of this program is to dramatically increase high school and college graduation rates for urban youth. To achieve this mission, the program seeks to unite a diverse group of academics, educators, government agencies, corporations, research institutions and community partners to provide support to SCSD students. This support is demonstrated through offering extended academic programming, mentoring, tutoring, family outreach, health care, social work, psychological services and/or legal assistance. One exceptional feature of the Say Yes program is the promise of free college tuition at participating colleges for those SCSD students who meet residency, graduation, and admission requirements. Since 2009, nearly 2,000 Say Yes students have enrolled in two- and four-year colleges. Other positive outcomes have been observed, including a 3.5 percent increase in Syracuse city home values since the program’s inception. The impact of Say Yes to Education in Syracuse will continue to be evaluated in the years to come. (Source: Say Yes to Education, Syracuse.)
The Central New York region is home to a large number and variety of post-secondary educational institutions. More than 32,000 students currently attend colleges within Onondaga County, including but not limited to St. Joseph’s College of Nursing, Syracuse University, Le Moyne College, SUNY Upstate Medical University, SUNY College of Environmental Science and Forestry and Onondaga Community College. A number of other professional and licensing programs are offered in the county. Furthermore, an additional 35 institutions of higher learning are located within 100 miles of Onondaga County.
empLoyment
According to the American Community Survey (ACS) 2007-2011, the “educational services, health care and social assistance” sectors employ 29.3 percent of Onondaga County civilians ages 16 and older. This is followed by the “retail trade” (11.7%); the “professional, scientific, and management” and “administrative and waste management” sectors (9.5%); manufacturing (9.1%); and the “arts, entertainment and recreation” and “accommodation and food services” sectors (8.2%). According to the Onondaga County Office of Economic Development, the leading employer in the Onondaga County area is Upstate University Health System with 9,525 employees. Other major employers in the area include Syracuse University, St. Joseph’s Hospital Health Center, Wegmans, Crouse Hospital, and Onondaga County government. Recent data from the New York State Department of Labor show job growth in the Syracuse Metropolitan Statistical Area (MSA) in the fields of education and health, trade, transportation and utilities, and leisure and hospitality. Recent job losses have occurred in the manufacturing, financial activities and information sectors.
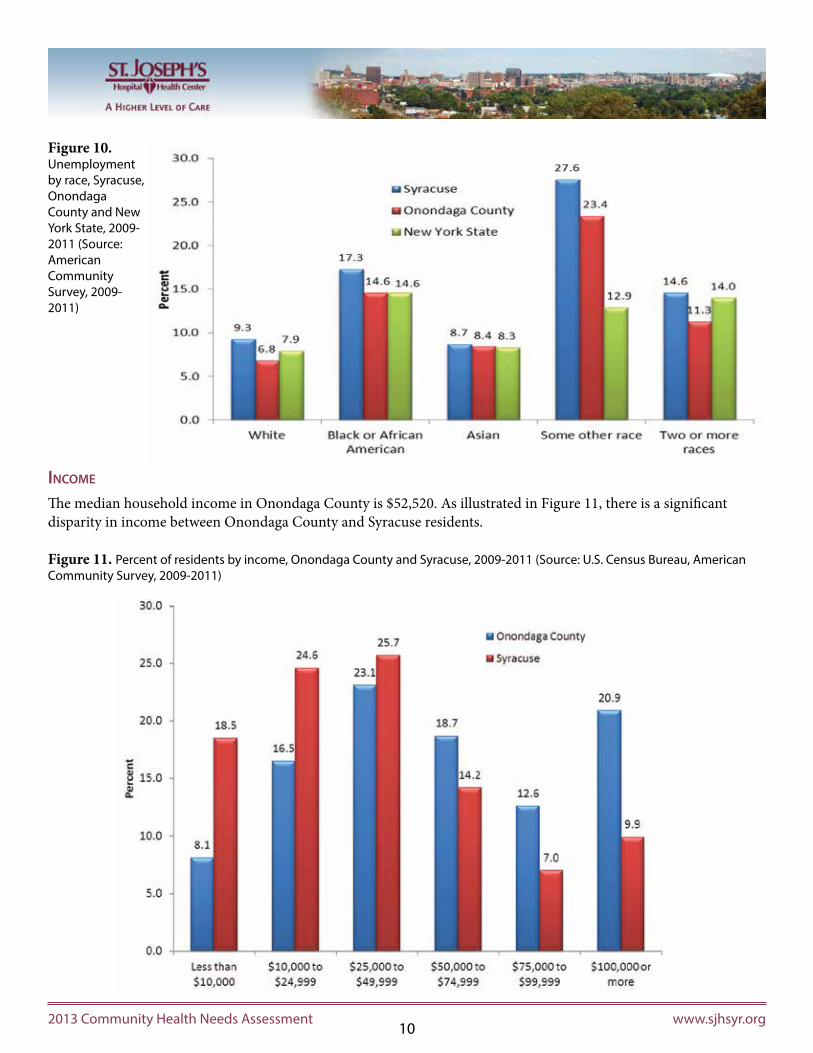
According to the U.S. Bureau of Labor Statistics, the unemployment rate in Onondaga County was 7.1 percent in April 2013 and has declined slowly from a high of 8.8 percent in January 2010. The current unemployment rate is nearly identical to the statewide unemployment rate of 7.3 percent in April 2013. Consequences of unemployment can include a decrease in health care-related expenditures and a decrease in access to employer-sponsored health insurance programs, which may lead to higher rates of uninsured persons. As seen in Figure 10, racial disparities in unemployment exist both within Onondaga County and Syracuse. In general, white residents have lower unemployment rates than other races. The highest unemployment rate is seen in those who identify as some other race.
102013 Community Health Needs Assessment www.sjhsyr.org
Figure 10. Unemployment by race, Syracuse, Onondaga County and New York State, 2009-2011 (Source: American Community Survey, 2009-2011)
income
The median household income in Onondaga County is $52,520. As illustrated in Figure 11, there is a significant disparity in income between Onondaga County and Syracuse residents.
Figure 11. Percent of residents by income, Onondaga County and Syracuse, 2009-2011 (Source: U.S. Census Bureau, American Community Survey, 2009-2011)

112013 Community Health Needs Assessment www.sjhsyr.org
poverty
Among all residents, 14.7 percent had income in the last 12 months that was below the federal poverty level. Especially striking is the poverty rate among children in Syracuse, where 49 percent of those under age 18 live in poverty, compared to 21 percent of children in Onondaga County. Poverty rates for families can be seen in Figure 12. Poverty rates are consistently higher in Syracuse than in Onondaga County, peaking at 56 percent among female-headed households with related children under 18 years of age.
Figure 12. Percent of families living below the federal poverty level, Onondaga County and Syracuse, 2009-2011 (Source: U.S. Census Bureau, American Community Survey, 2009-2011)
Another indicator of poverty is the percent of students receiving free or reduced price lunch at school. As seen in Table 2, this varies by school district, with a far greater percentage of students in the SCSD receiving free or reduced price lunch compared to the surrounding suburban school districts.

122013 Community Health Needs Assessment www.sjhsyr.org
Table 2. Free and reduced price lunch by school district, 2011-2012
In addition to children and families, seniors living in poverty warrant special attention. In Onondaga County, 7.6 percent of residents ages 65 years and older live in poverty, as do 17.4 percent of seniors in Syracuse.
The poverty burden in an area can also be assessed through utilization of public benefits. In Onondaga County, nearly 9,000 (5.4%) households receive an average of $8,715 in Supplemental Security Income each year. Of these, nearly 5,700 are in Syracuse, representing 10.2 percent of city households. In addition, almost 5,600 county households receive cash public assistance income, 4,100 of which are in Syracuse. Almost 23,000 (12.4%) households receive Supplemental Nutrition Assistance Program (SNAP) benefits in Onondaga County, of which nearly 15,000 (26.9%) are in Syracuse. The Special Supplemental Nutrition Program for Women, Infants and Children (WIC) in Onondaga County served an average of 10,077 participants per month in 2012 (Onondaga County Health Department Annual Report).
heALth insurAnce
Another important factor relating to health outcomes and access to care is the presence of health insurance. In Onondaga County, nine percent of residents do not have any health insurance. This increases to 13 percent in Syracuse.
Data Source: NYS Report Cards, 2011-2012

132013 Community Health Needs Assessment www.sjhsyr.org
housing
Onondaga County has been largely insulated from the unstable housing market that has plagued much of the rest of the nation over the last several years. Recent data from the U.S. Bureau of Labor Statistics accessed through National Public Radio indicate that the current foreclosure rate in Onondaga County is just one in 12,647 homes. The ages of housing units in Onondaga County are similar to New York State averages. Compared to New York State, housing units are more likely to be owner occupied (65%) in Onondaga County but less likely to be owner occupied in Syracuse (40%) (ACS 2007-2011). The median home value in Onondaga County in 2010 was $134,700, compared to $88,400 in Syracuse.
DispArities
Overall, Syracuse has a younger and more racially and ethnically diverse population when compared to the rest of Onondaga County. In addition, there is higher poverty and lower educational attainment in Syracuse than in the surrounding suburban and rural areas. These factors are important predictors of health outcomes and should be considered when evaluating populations at risk and allocating resources for public health activities. Some of these disparities are highlighted in Table 3.
Table 3. Demographic disparities between Onondaga County and the City of Syracuse (Source: U.S. Census Bureau, American Community Survey, 2009-2011)
According to Healthy People 2020, a disparity exists “if a health outcome is seen in a greater or lesser extent between populations” (Disparities 2010, retrieved from healthypeople.gov). As part of an overall Community Health
142013 Community Health Needs Assessment www.sjhsyr.org
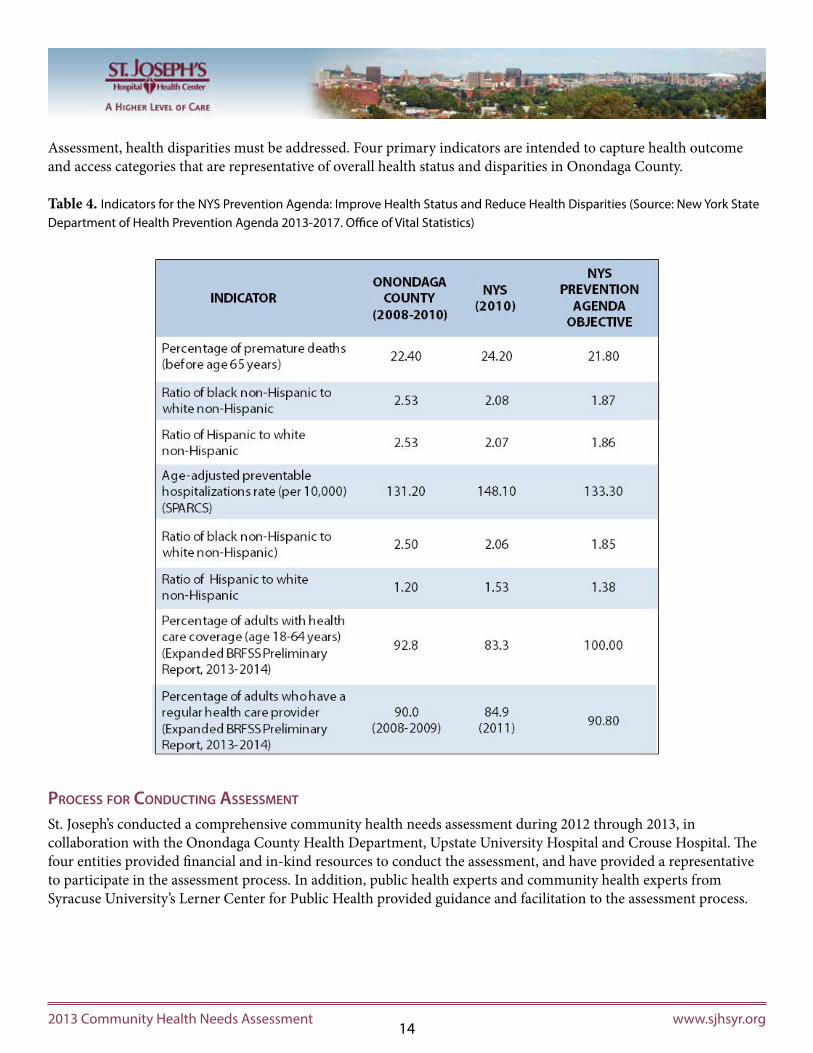
Assessment, health disparities must be addressed. Four primary indicators are intended to capture health outcome and access categories that are representative of overall health status and disparities in Onondaga County.
Table 4. Indicators for the NYS Prevention Agenda: Improve Health Status and Reduce Health Disparities (Source: New York State Department of Health Prevention Agenda 2013-2017. Office of Vital Statistics)
process for conDucting Assessment
St. Joseph’s conducted a comprehensive community health needs assessment during 2012 through 2013, in collaboration with the Onondaga County Health Department, Upstate University Hospital and Crouse Hospital. The four entities provided financial and in-kind resources to conduct the assessment, and have provided a representative to participate in the assessment process. In addition, public health experts and community health experts from Syracuse University’s Lerner Center for Public Health provided guidance and facilitation to the assessment process.
152013 Community Health Needs Assessment www.sjhsyr.org
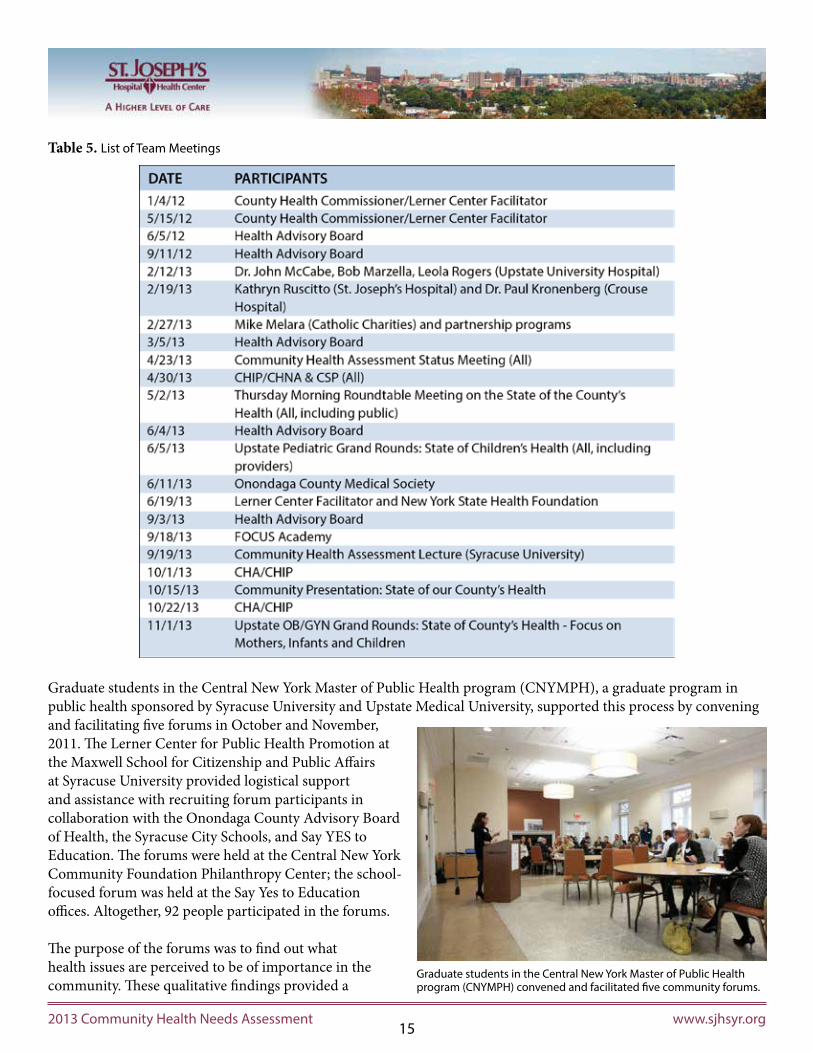
Table 5. List of Team Meetings
Graduate students in the Central New York Master of Public Health program (CNYMPH), a graduate program in public health sponsored by Syracuse University and Upstate Medical University, supported this process by convening and facilitating five forums in October and November, 2011. The Lerner Center for Public Health Promotion at the Maxwell School for Citizenship and Public Affairs at Syracuse University provided logistical support and assistance with recruiting forum participants in collaboration with the Onondaga County Advisory Board of Health, the Syracuse City Schools, and Say YES to Education. The forums were held at the Central New York Community Foundation Philanthropy Center; the school-focused forum was held at the Say Yes to Education offices. Altogether, 92 people participated in the forums.
The purpose of the forums was to find out what health issues are perceived to be of importance in the community. These qualitative findings provided a
Graduate students in the Central New York Master of Public Health program (CNYMPH) convened and facilitated five community forums.

162013 Community Health Needs Assessment www.sjhsyr.org
backdrop against which data was collected and analyzed to better understand the concerns raised by community members. The results of the forum were summarized in a report issued in January, 2012.
In addition, St. Joseph’s determined community needs for health care in its service area through the following activities and reports:
• Bi-annual community perception study;• Surveys administered to hospital groups, community leaders and discharged patients;• Interviews with community, business, political and religious leaders, and local employees;• Focus groups of active medical staff and employees;• Focus groups of Syracuse neighborhood residents;• Surveys and focus groups of discharged patients, focusing on staff sensitivity to the inconvenience of
hospitalization.• Research and data-gathering projects with Syracuse University and other institutions;• Service on boards of various health and community organizations;• Representation of the community on our Board of Trustees, Foundation Board, Physicians Emeritus
Council, Auxiliary, and Council of Advisors; • Staff participation with
various health and community organizations; and
• Local, state and federal publications from such sources as the Onondaga County Health Department, Iroquois Healthcare Association, Healthcare Association of New York State, New York State Department of Health, and the U.S. Department of Health and Human Services.
Assessment AnD seLection of pubLic heALth priorities
The Onondaga County Health Department partnered with the hospitals in Onondaga County to conduct a community health assessment process that engaged health improvement efforts already under way and drew on local resources. The process was designed to result in a clear picture of the health of the community, and to identify meaningful and realistic community health improvement initiatives that are supported by key constituencies. The process began with meetings between the leadership of the Onondaga County Health Department (Commissioner of Health and Chair of the Advisory Board of Health) with the chief executive officers of the three hospitals in the community (St. Joseph’s Hospital Health Center, Crouse Hospital and Upstate University Hospital, including the Golisano Children’s Hospital and Upstate at Community General) to discuss the process and gain support of the leadership. The outcome of the meeting was an agreement that the community health assessment process would be a collaborative effort that would focus on building on existing partnerships to ensure that the outcome would incorporate initiatives that have a strong base of support.
St. Joseph’s Board of Trustees.
172013 Community Health Needs Assessment www.sjhsyr.org
The data collection and analysis phase followed. Data from a number of sources were utilized, including the New York State Prevention Agenda, the 2013 Community Needs Assessment Report developed by the United Way of CNY, as well as internal information from the health department and hospitals. Again, students from the CNYMPH program were engaged to support the community health assessment effort. Teams of students were paired with the hospitals and with the health department to support data collection and analysis. The teams, at the direction of the hospitals and health department, collected and organized data that was used by the leadership of the organizations to understand the health needs of the community. The students provided formal reports to each of the organizations in the spring of 2013.
A task force composed of representatives from the health department and the hospitals met regularly through 2012 and 2013 to review the data and explore areas for collaboration.
During the course of the community health assessment, an issue related to neonatal abstinence syndrome, drug withdrawal in a baby, surfaced. Local physicians and hospital staff initially identified the issue and a neonatologist brought it to the Onondaga County Advisory Board of Health. A review of the data revealed that Onondaga County has the highest rate of hospital discharges for newborns with drug-related issues.
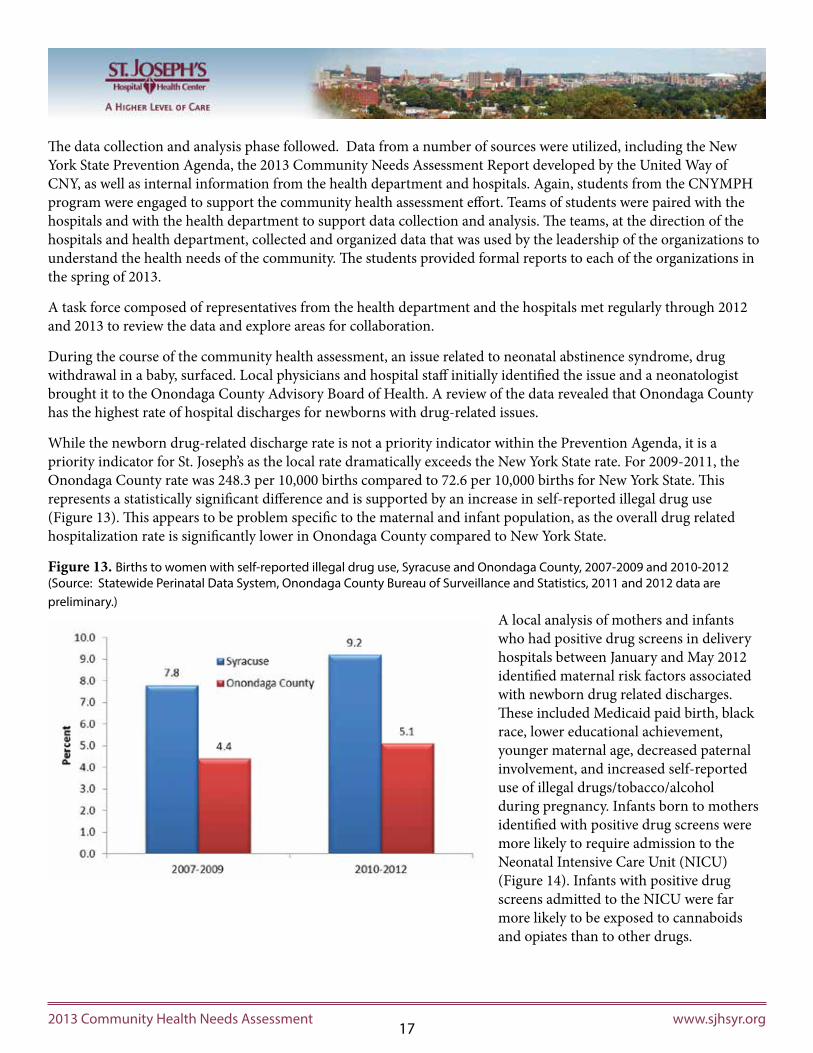
While the newborn drug-related discharge rate is not a priority indicator within the Prevention Agenda, it is a priority indicator for St. Joseph’s as the local rate dramatically exceeds the New York State rate. For 2009-2011, the Onondaga County rate was 248.3 per 10,000 births compared to 72.6 per 10,000 births for New York State. This represents a statistically significant difference and is supported by an increase in self-reported illegal drug use (Figure 13). This appears to be problem specific to the maternal and infant population, as the overall drug related hospitalization rate is significantly lower in Onondaga County compared to New York State.
Figure 13. Births to women with self-reported illegal drug use, Syracuse and Onondaga County, 2007-2009 and 2010-2012 (Source: Statewide Perinatal Data System, Onondaga County Bureau of Surveillance and Statistics, 2011 and 2012 data are preliminary.)
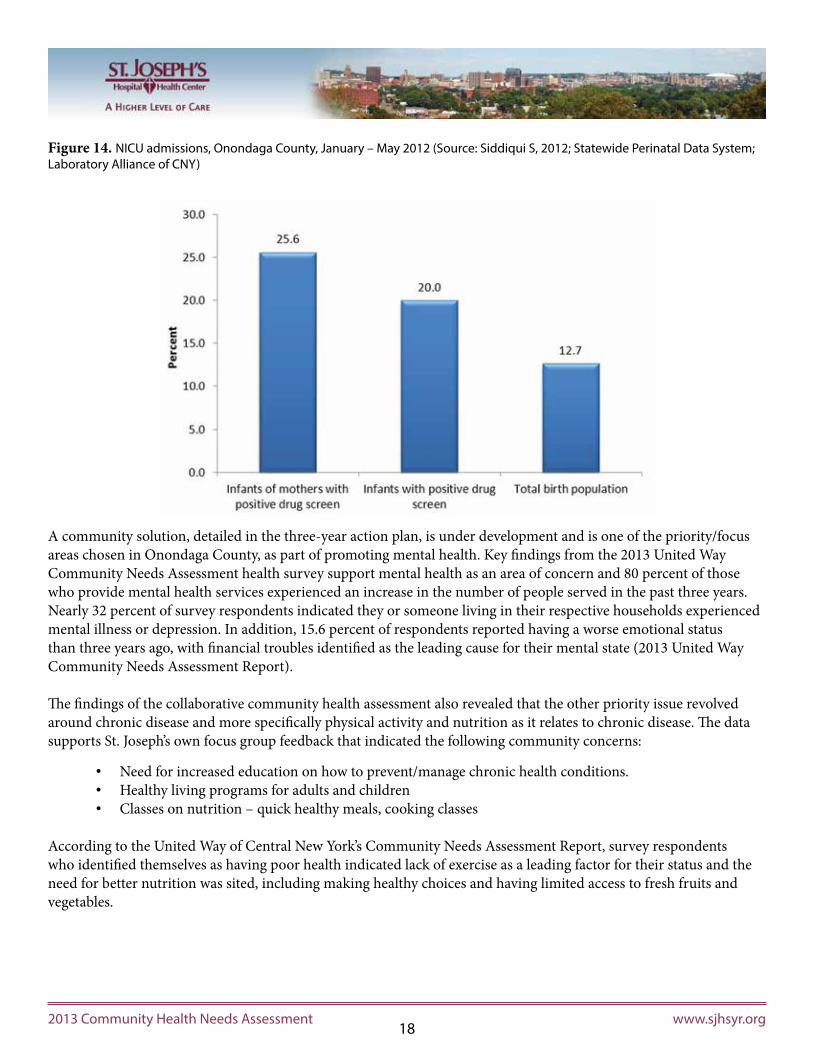
A local analysis of mothers and infants who had positive drug screens in delivery hospitals between January and May 2012 identified maternal risk factors associated with newborn drug related discharges. These included Medicaid paid birth, black race, lower educational achievement, younger maternal age, decreased paternal involvement, and increased self-reported use of illegal drugs/tobacco/alcohol during pregnancy. Infants born to mothers identified with positive drug screens were more likely to require admission to the Neonatal Intensive Care Unit (NICU) (Figure 14). Infants with positive drug screens admitted to the NICU were far more likely to be exposed to cannaboids and opiates than to other drugs.
182013 Community Health Needs Assessment www.sjhsyr.org
Figure 14. NICU admissions, Onondaga County, January – May 2012 (Source: Siddiqui S, 2012; Statewide Perinatal Data System; Laboratory Alliance of CNY)
A community solution, detailed in the three-year action plan, is under development and is one of the priority/focus areas chosen in Onondaga County, as part of promoting mental health. Key findings from the 2013 United Way Community Needs Assessment health survey support mental health as an area of concern and 80 percent of those who provide mental health services experienced an increase in the number of people served in the past three years. Nearly 32 percent of survey respondents indicated they or someone living in their respective households experienced mental illness or depression. In addition, 15.6 percent of respondents reported having a worse emotional status than three years ago, with financial troubles identified as the leading cause for their mental state (2013 United Way Community Needs Assessment Report).
The findings of the collaborative community health assessment also revealed that the other priority issue revolved around chronic disease and more specifically physical activity and nutrition as it relates to chronic disease. The data supports St. Joseph’s own focus group feedback that indicated the following community concerns:
• Need for increased education on how to prevent/manage chronic health conditions.• Healthy living programs for adults and children• Classes on nutrition – quick healthy meals, cooking classes
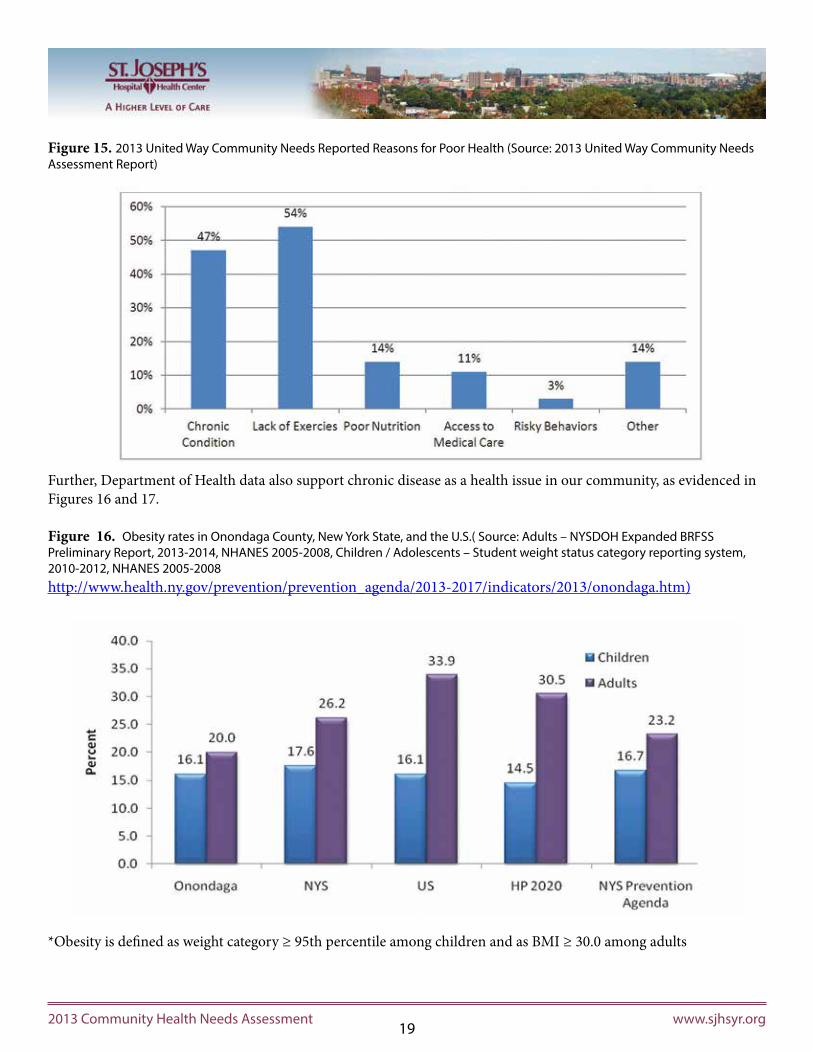
According to the United Way of Central New York’s Community Needs Assessment Report, survey respondents who identified themselves as having poor health indicated lack of exercise as a leading factor for their status and the need for better nutrition was sited, including making healthy choices and having limited access to fresh fruits and vegetables.
192013 Community Health Needs Assessment www.sjhsyr.org
Figure 15. 2013 United Way Community Needs Reported Reasons for Poor Health (Source: 2013 United Way Community Needs Assessment Report)
Further, Department of Health data also support chronic disease as a health issue in our community, as evidenced in Figures 16 and 17.
Figure 16. Obesity rates in Onondaga County, New York State, and the U.S.( Source: Adults – NYSDOH Expanded BRFSS Preliminary Report, 2013-2014, NHANES 2005-2008, Children / Adolescents – Student weight status category reporting system, 2010-2012, NHANES 2005-2008http://www.health.ny.gov/prevention/prevention_agenda/2013-2017/indicators/2013/onondaga.htm)
*Obesity is defined as weight category ≥ 95th percentile among children and as BMI ≥ 30.0 among adults
202013 Community Health Needs Assessment www.sjhsyr.org
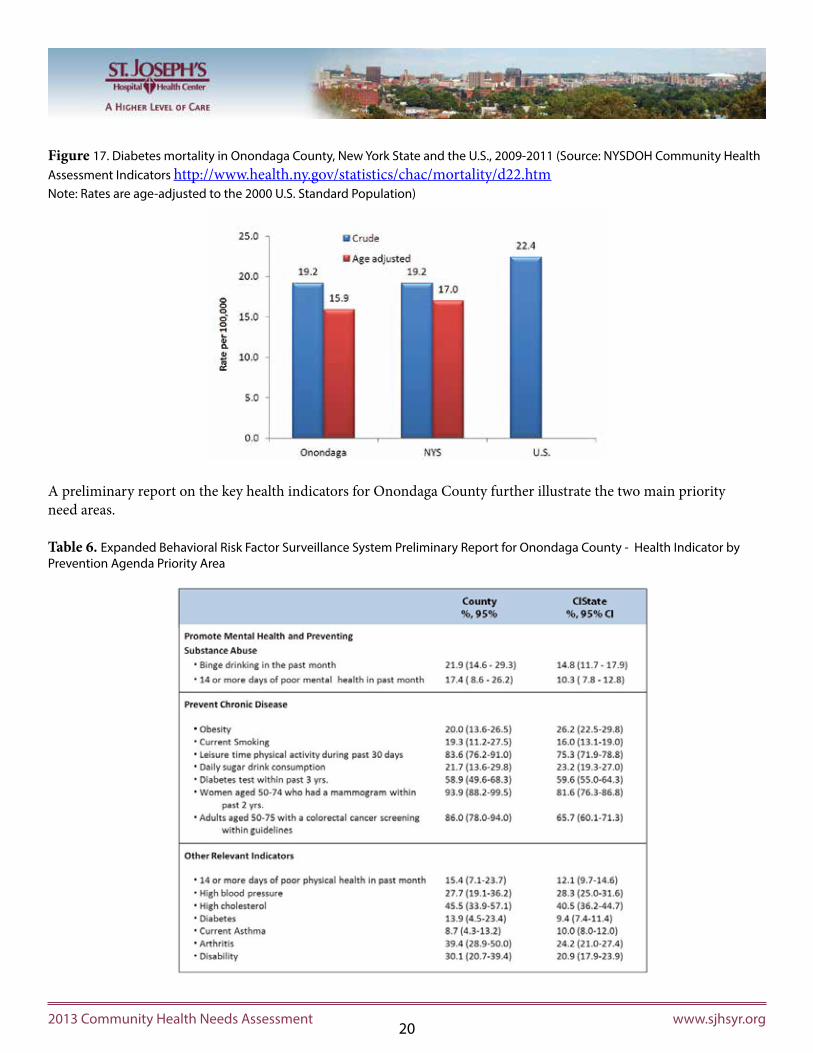
Figure 17. Diabetes mortality in Onondaga County, New York State and the U.S., 2009-2011 (Source: NYSDOH Community Health Assessment Indicators http://www.health.ny.gov/statistics/chac/mortality/d22.htm Note: Rates are age-adjusted to the 2000 U.S. Standard Population)
A preliminary report on the key health indicators for Onondaga County further illustrate the two main priority need areas.
Table 6. Expanded Behavioral Risk Factor Surveillance System Preliminary Report for Onondaga County - Health Indicator by Prevention Agenda Priority Area
212013 Community Health Needs Assessment www.sjhsyr.org
The final prioritization of health needs was based on the following criteria:
• Size: The number of persons affected by the health need (incidence and prevalence).• Seriousness: Level of severity as indicated by morbidity and mortality rates and economic and/or social impact.• Economic Feasibility: Costs of internal resources and potential costs of external resources.• Potential for Impact: Could St. Joseph’s make an important contribution? Did it have the expertise, time and resources for planning, implementation of programs/activities and evaluation of all initiatives?• Availability of Community Assets: Were there programs already in existence that addressed the identified health needs?• Probability of Success: What was the likelihood of achieving objectives and goals created for a Community Benefit Implementation Plan?• Value: Subjective measures that indicated importance.
Through discussions with the task force and the leadership of the health department and the hospitals, and after careful consideration of all data and prioritization criteria, the two priority areas chosen include:
• Prevent Chronic Disease• Promote Mental Health and Prevention of Substance Abuse
St. Joseph’s also has selected additional priority areas – access to dental services and reduction of falls among vulnerable populations.
At a meeting on May 1, 2013 of the Thursday Morning Roundtable, a community forum sponsored by Syracuse University, the Commissioner of Health and Chair of the Advisory Board of Health presented “The State of our County’s Health: An Assessment of Onondaga County’s Health.” With the priority areas identified, the health department and hospitals have collaborated to refine the focus areas and strategies, building on community health initiatives that are under way, that will be undertaken to address these issues.
implemenTaTion sTraTegy plan (Three year plan of aCTion)
prevent chronic DiseAse:
To increase access to high quality chronic disease preventive care and management in clinical and community settings St. Joseph’s has identified four goals: A. Promote the use of evidence-based care to manage chronic disease.
Objective: To increase the percentage of adults with diabetes whose blood glucose is in good control, to reduce the rate of hospitalizations for short-term complications of diabetes and to increase the number of adults with diabetes who have learned how to manage their condition, St. Joseph’s is participating in the following initiatives, along with key community partners:
• Near Westside Initiative: St. Joseph’s, together with the Onondaga County Health Department, Syracuse University Lerner Center for Public Health Promotion, Nojaim Brothers, Huntington Family Center, Excellus BlueCross BlueShield of CNY and CenterState CEO and economic development agencies, is
222013 Community Health Needs Assessment www.sjhsyr.org
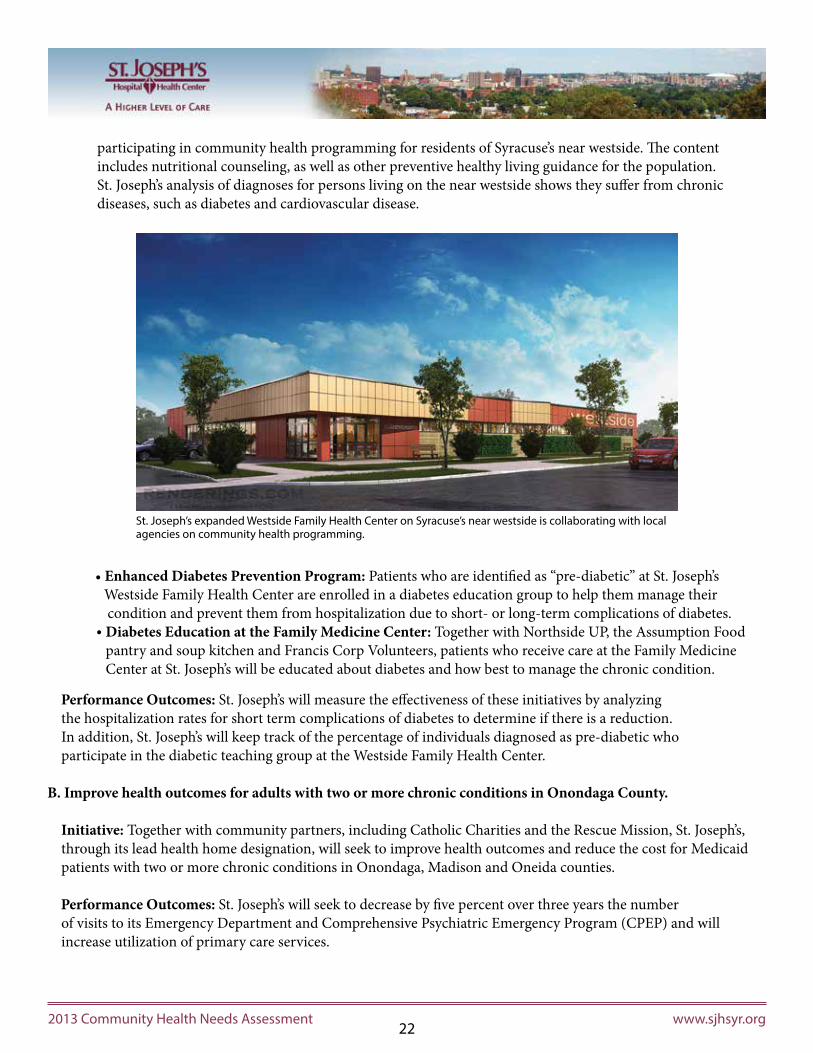
participating in community health programming for residents of Syracuse’s near westside. The content includes nutritional counseling, as well as other preventive healthy living guidance for the population. St. Joseph’s analysis of diagnoses for persons living on the near westside shows they suffer from chronic diseases, such as diabetes and cardiovascular disease.
• Enhanced Diabetes Prevention Program: Patients who are identified as “pre-diabetic” at St. Joseph’s Westside Family Health Center are enrolled in a diabetes education group to help them manage their condition and prevent them from hospitalization due to short- or long-term complications of diabetes.
Diabetes Education at the Family Medicine Center: Together with Northside UP, the Assumption Food pantry and soup kitchen and Francis Corp Volunteers, patients who receive care at the Family Medicine
Center at St. Joseph’s will be educated about diabetes and how best to manage the chronic condition.
Performance Outcomes: St. Joseph’s will measure the effectiveness of these initiatives by analyzing the hospitalization rates for short term complications of diabetes to determine if there is a reduction. In addition, St. Joseph’s will keep track of the percentage of individuals diagnosed as pre-diabetic who participate in the diabetic teaching group at the Westside Family Health Center.
B. Improve health outcomes for adults with two or more chronic conditions in Onondaga County.
Initiative: Together with community partners, including Catholic Charities and the Rescue Mission, St. Joseph’s, through its lead health home designation, will seek to improve health outcomes and reduce the cost for Medicaid patients with two or more chronic conditions in Onondaga, Madison and Oneida counties.
Performance Outcomes: St. Joseph’s will seek to decrease by five percent over three years the number of visits to its Emergency Department and Comprehensive Psychiatric Emergency Program (CPEP) and will increase utilization of primary care services.
St. Joseph’s expanded Westside Family Health Center on Syracuse’s near westside is collaborating with local agencies on community health programming.
•
232013 Community Health Needs Assessment www.sjhsyr.org
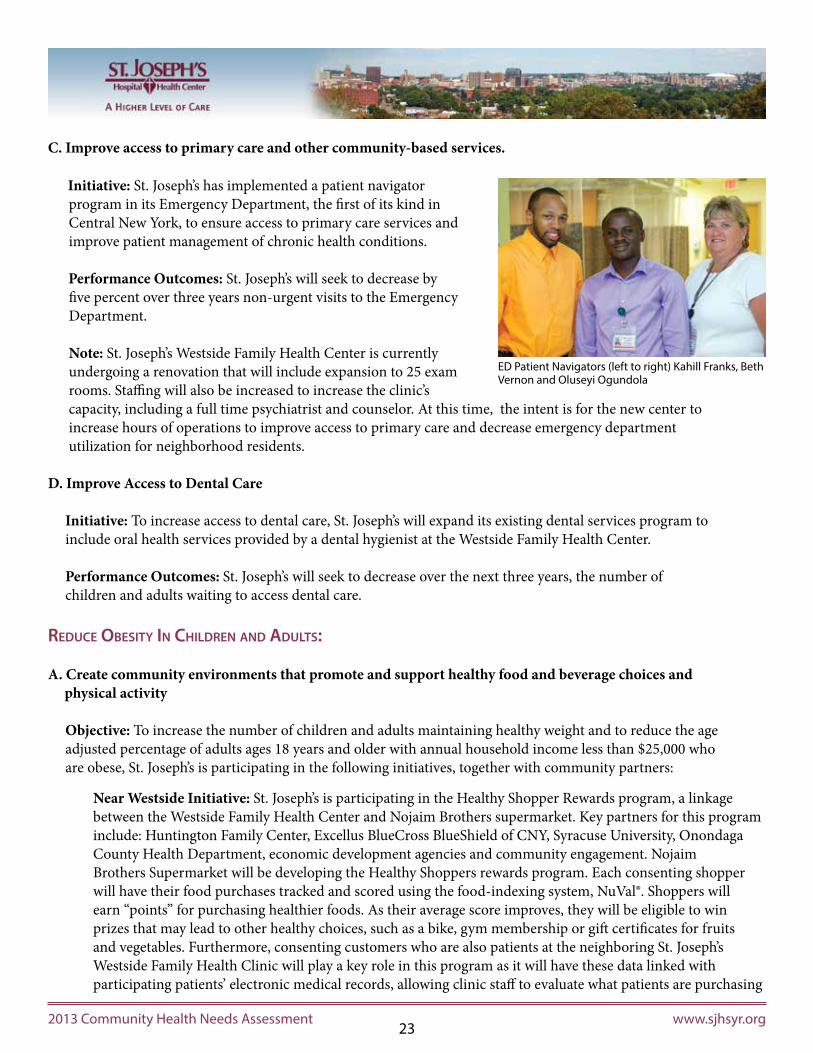
C. Improve access to primary care and other community-based services. Initiative: St. Joseph’s has implemented a patient navigator program in its Emergency Department, the first of its kind in Central New York, to ensure access to primary care services and improve patient management of chronic health conditions.
Performance Outcomes: St. Joseph’s will seek to decrease by five percent over three years non-urgent visits to the Emergency Department.
Note: St. Joseph’s Westside Family Health Center is currently undergoing a renovation that will include expansion to 25 exam rooms. Staffing will also be increased to increase the clinic’s capacity, including a full time psychiatrist and counselor. At this time, the intent is for the new center to increase hours of operations to improve access to primary care and decrease emergency department utilization for neighborhood residents.
D. Improve Access to Dental Care
Initiative: To increase access to dental care, St. Joseph’s will expand its existing dental services program to include oral health services provided by a dental hygienist at the Westside Family Health Center.
Performance Outcomes: St. Joseph’s will seek to decrease over the next three years, the number of children and adults waiting to access dental care.
reDuce obesity in chiLDren AnD ADuLts:
A. Create community environments that promote and support healthy food and beverage choices and physical activity
Objective: To increase the number of children and adults maintaining healthy weight and to reduce the age adjusted percentage of adults ages 18 years and older with annual household income less than $25,000 who are obese, St. Joseph’s is participating in the following initiatives, together with community partners:
Near Westside Initiative: St. Joseph’s is participating in the Healthy Shopper Rewards program, a linkage between the Westside Family Health Center and Nojaim Brothers supermarket. Key partners for this program include: Huntington Family Center, Excellus BlueCross BlueShield of CNY, Syracuse University, Onondaga County Health Department, economic development agencies and community engagement. Nojaim Brothers Supermarket will be developing the Healthy Shoppers rewards program. Each consenting shopper will have their food purchases tracked and scored using the food-indexing system, NuVal®. Shoppers will earn “points” for purchasing healthier foods. As their average score improves, they will be eligible to win prizes that may lead to other healthy choices, such as a bike, gym membership or gift certificates for fruits and vegetables. Furthermore, consenting customers who are also patients at the neighboring St. Joseph’s Westside Family Health Clinic will play a key role in this program as it will have these data linked with participating patients’ electronic medical records, allowing clinic staff to evaluate what patients are purchasing
ED Patient Navigators (left to right) Kahill Franks, Beth Vernon and Oluseyi Ogundola

242013 Community Health Needs Assessment www.sjhsyr.org
and have informed discussions of simple ways to make better choices. • North Side Community Health Improvement Project: Together with Franciscan Ministries, Assumption Church and Francis Corp Volunteers, St. Joseph’s nutritional services department will help to provide access to fruits and vegetables for individuals and families who receive food from the Assumption Food Pantry/Soup Kitchen. In addition, St. Joseph’s will help provide education on nutrition, including USDA guidelines, through recipes and cooking demonstrations.
Performance Outcomes: To reduce the number of children and adults diagnosed as obese and to ensure that 100 percent of individuals who utilize the Assumption Church Food Pantry/Soup Kitchen will have access to fruits and vegetables.
Three additional initiatives seek to support the creation of community environments that promote and support healthy food and beverage choices, as well as physical activity:
• Workplace Policies: To create a healthier environment in the workplace by providing healthier food options, St. Joseph’s will develop policies that support the use of healthy, locally-grown foods in its cafeteria and on its patient room service menu. • School-based Programs: To promote and educate children on the importance of healthy food choices, St. Joseph’s, along with Healthy Syracuse, will support Syracuse City School District school-based health clinics with obesity prevention programs. The Healthy Syracuse coalition was founded in 2010 by the YMCA of Greater Syracuse and the Onondaga County Health Department to engage communities and collaborate with national networks to focus on chronic disease prevention. Strategies address healthy weight, access to nutritious foods and the ability to be physically active among other initiatives. • Community Gardens: To increase access to fresh vegetables and increase community engagement to support health improvement, St. Joseph’s, in conjunction with Northside UP and the near westside initiative partners, will support a Syracuse Grows sponsorship of community gardens. Performance Outcomes: To ensure that 80 percent of the retail menu selections at St. Joseph’s align with dietary guidelines for Americans; to establish one to two educational programs provided to local schools on healthy food choices, and to initiate one new neighborhood garden per year.
reDuce iLLness, DisAbiLity AnD DeAth reLAteD to tobAcco use AnD seconDhAnD smoke exposure:
A. Prevent initiation of tobacco use by youth and adults, especially among new socioeconomic populations
Initiative: Through participation in a community-wide initiative to educate youth on tobacco use, St. Joseph’s will decrease the prevalence of cigarette use by adults 18 to 24 years of age. Partners include the Onondaga County Health Department, Healthy Syracuse, Crouse and Upstate University Hospitals. St. Joseph’s involvement with Healthy Syracuse allows it to seek to reduce exposure to smoke and other tobacco products and seek to create living spaces that encourage emotional well-being.
St. Joseph’s is one of the sites of the Regional Market Mobile Market every summer.
252013 Community Health Needs Assessment www.sjhsyr.org
Performance Outcomes: The percentage of adults ages 18 to 24 who report smoking will be decreased.
B. Promote Tobacco Cessation Especially Among Lower Socioeconomic Populations and Those with Poor Mental Health.
Initiative: The Cessation Center will work with St. Joseph’s Personal Recovery Oriented Services (PROS) program to implement evidence-based treatment recommendations from the Clinical Practice Guidelines for Treating Tobacco Use and Dependence. Additionally, the Cessation Center will assist primary care providers in the St. Joseph’s system to adopt a system to screen all patients for tobacco use, provide brief advice to quit at every visit and provide smoke cessation sessions as needed. Performance Outcomes: Increase number of adults receiving education regarding the harmful effects of tobacco and increase participation in smoke cessation classes.
promote mentAL heALth AnD prevent substAnce Abuse
A. To improve maternal and infant health, St. Joseph’s will reduce the incidence of neonatal abstinence syndrome.
Initiatives: St. Joseph’s, in conjunction with the Onondaga County Health Department, Regional Perinatal Center, local hospitals and primary care centers, will increase education to both providers and patients regarding neonatal abstinence syndrome through the following initiatives: • Patient Education: St. Joseph’s will increase patient education regarding neonatal abstinence syndrome. • Provider Education: St. Joseph’s will increase provider education on safe prescribing practices to pregnant women.
B. To promote mental, emotional and behavioral well-being, St. Joseph’s will implement evidenced based practice in screening and prevention of behavioral health concerns.
Initiatives: Through newly expanded primary care centers, which will integrate primary care and behavioral health care, St. Joseph’s will seek to increase early detection of behavioral health concerns in children and adults.
• Syracuse Healthy Start-Perinatal Substance Abuse Committee: This committee is convened by SUNY by data analysis, making recommendations, and developing educational materials. The Committee was formed out of recognition that substance use in the prenatal period presents a major risk to the health of women and infants and contributes to poor birth outcomes. The Committee brings together clinical and human service providers to share information from practice examine local data, share current medical literature, and identify best practices with the goal of developing policies, procedures, and educational messages to improve local efforts to prevent, identify, and treat perinatal substance abuse pregnant and parenting women in Syracuse. Center for Maternal and Child Health (CMATCH), as a part of the CNY Regional Perinatal Program, often shares the efforts and recommendations of the Committee throughout the CNY Region. In addition to St. Joseph’s, current members include Crouse Hospital’s NICU, SUNY Upstate Center for Maternal Child Health, Reach CNY, Neonatal Associates of CNY/Regional Perinatal Center Onondaga County Health Department, Prevention Network, and Upstate Poison Control Center.
Performance Outcomes: To reduce the incidence of neonatal abstinence syndrome.

262013 Community Health Needs Assessment www.sjhsyr.org
Performance Outcomes: 100 percent of initial assessments will include screening for behavioral health issues.
promote A heALthy AnD sAfe environment
A. To reduce fall risks among vulnerable populations, St. Joseph’s will partner with county agencies on education programs.
Initiatives: St. Joseph’s in conjunction with the Onondaga County Department of Aging and Youth participates in the Onondaga County Prevention Program, Step up to Stop Falls. As a member of this coalition, St. Joseph’s will educate primary care providers about the Community-Based Falls Prevention Programs. In addition, all providers will have resource materials, including strategies to reduce falls in a home-setting, they can make available to patients and families.
Performance Outcomes: 100 percent of St. Joseph’s primary care practices will receive education on the Community Based Falls Prevention Program.
priorities not ADDresseD
While St. Joseph’s Hospital Health Center acknowledges that the implementation strategy plan does not address all the community health needs identified, we believe the focus areas selected in this plan will indirectly have a positive impact on other items reflected in the CHNA. It was determined that to be most effective improving community health, we should align our resources consistent with St. Joseph’s strategic direction and mission.
DisseminAtion of the pLAn to the pubLic
St. Joseph’s Community Health Needs Assessment and Implementation Strategy Plan will be available to the public on its website at www.sjhsyr.org. The organization will advise the public of its availability via a news release and postings on social media. Its employees and medical staff will be advised through the regular internal communications channels, including daily huddles, the intranet website and flyers.

272013 Community Health Needs Assessment www.sjhsyr.org
appendiX i
finDings from 2011 community heALth neeDs Assessment forums:syrAcuse, new york
JAnuAry, 2012
INTrODuCTION
Title IX of the Patient Protection and Affordable Care Act of 2010 requires charitable hospitals to meet certain provisions related to community benefit in order to maintain their tax-exempt status. Among those requirements is that every three years they are to conduct a community health needs assessment (CHNA) that includes community and public health input. Local health departments in New York State are required to conduct periodic community health assessments (CHA) in order to ensure that their programming remains consistent with community needs. These two community planning processes run parallel and have similar attributes.
The Central New York Masters in Public Health Program, run jointly by the State University of New York Upstate Medical Center and Syracuse University, initiated a process of community engagement that can support the hospital’s CHNA and the Onondaga County Health Department’s CHA. Students in the program’s Public Health Administration course coordinated and facilitated five forums convened in October and November 2011 and analyzed data collected during those forums as their semester’s project. The Lerner Center for Public Health Promotion at the Maxwell School for Citizenship and Public Affairs at Syracuse University provided logistical support and assistance with recruiting forum participants in collaboration with the Onondaga County Advisory Board of Health, the Syracuse City Schools, and Say YES to Education. The forums were held at the Central New York Community Foundation Philanthropy Center; the school-focused forum was held at the Say Yes to Education offices. Altogether, 92 people participated in the forums. APPrOACH
The forums were conducted using a small-table format that included five to seven participants per table as well as two students from the public health administration course – a facilitator and a scribe (for transcribing ideas onto newsprint). Each table, regardless of the type of representatives present, was presented with a common set of core questions/topics. These consisted of an exercise in composing a picture of an ideal community; describing that community succinctly in narrative form; identifying strengths and weaknesses of the current public health situation in our community; issues needing attention in the domains of the public health system and the health status of individuals; and, based upon what they had identified in previous portions of the session, recommendations for local public health priorities. Each session was designed to last two hours.
The data used for the analysis presented in this report consist of responses given during the portion of the sessions devoted to identifying issues needing attention in the domains of the public health system and the health status of individuals. The analysis process, carried out by an independent researcher assigned to the project as well as public health experts from the Lerner Center, consisted of thematically coding the responses inductively into categories that are consistent with dimensions targeted by the public health field.
282013 Community Health Needs Assessment www.sjhsyr.org
The following presentation of findings is divided into those representing system-level needs and those representing health status issues. The report’s final section attempts to draw conclusions regarding public health priorities for the next three years.
FINDINGS
System-Level Issues
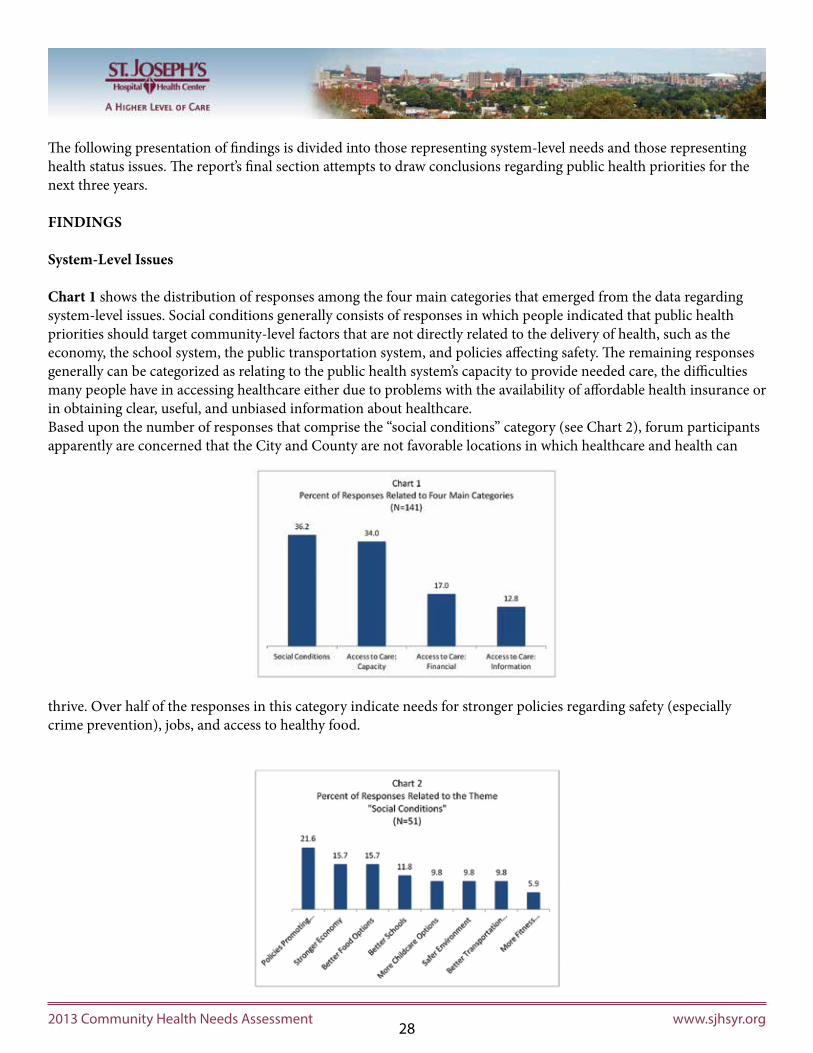
Chart 1 shows the distribution of responses among the four main categories that emerged from the data regarding system-level issues. Social conditions generally consists of responses in which people indicated that public health priorities should target community-level factors that are not directly related to the delivery of health, such as the economy, the school system, the public transportation system, and policies affecting safety. The remaining responses generally can be categorized as relating to the public health system’s capacity to provide needed care, the difficulties many people have in accessing healthcare either due to problems with the availability of affordable health insurance or in obtaining clear, useful, and unbiased information about healthcare. Based upon the number of responses that comprise the “social conditions” category (see Chart 2), forum participants apparently are concerned that the City and County are not favorable locations in which healthcare and health can
thrive. Over half of the responses in this category indicate needs for stronger policies regarding safety (especially crime prevention), jobs, and access to healthy food.
292013 Community Health Needs Assessment www.sjhsyr.org
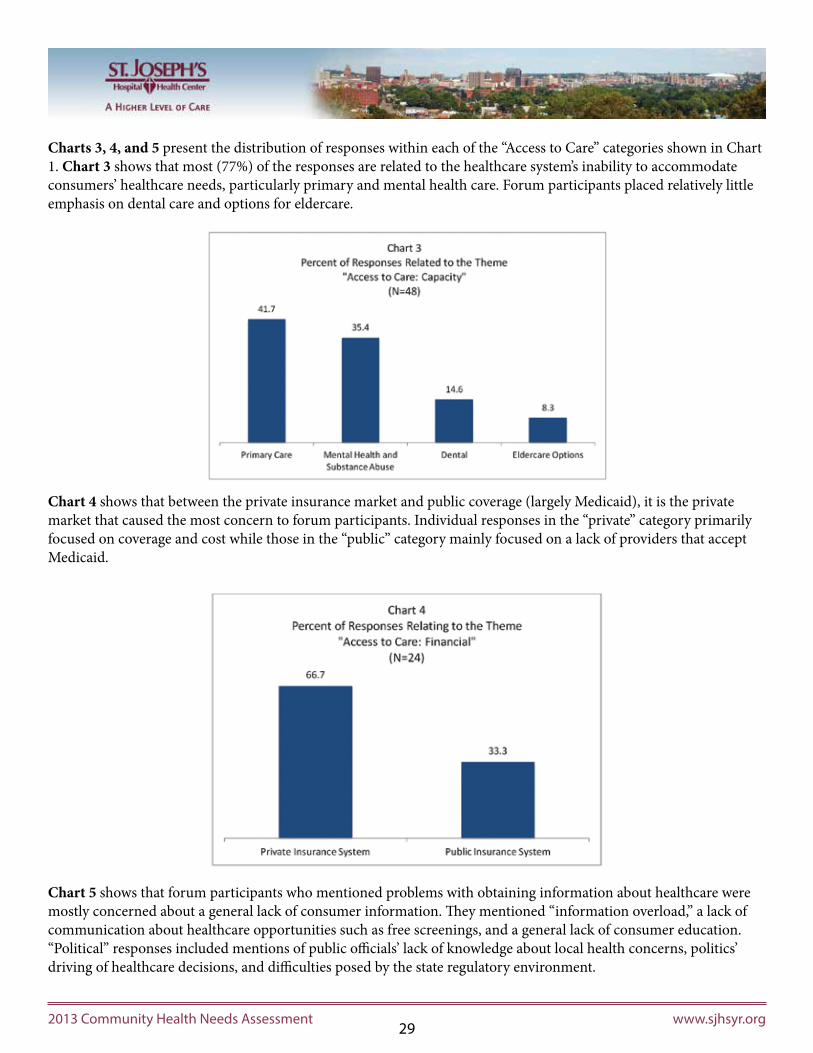
Charts 3, 4, and 5 present the distribution of responses within each of the “Access to Care” categories shown in Chart 1. Chart 3 shows that most (77%) of the responses are related to the healthcare system’s inability to accommodate consumers’ healthcare needs, particularly primary and mental health care. Forum participants placed relatively little emphasis on dental care and options for eldercare.
Chart 4 shows that between the private insurance market and public coverage (largely Medicaid), it is the private market that caused the most concern to forum participants. Individual responses in the “private” category primarily focused on coverage and cost while those in the “public” category mainly focused on a lack of providers that accept Medicaid.
Chart 5 shows that forum participants who mentioned problems with obtaining information about healthcare were mostly concerned about a general lack of consumer information. They mentioned “information overload,” a lack of communication about healthcare opportunities such as free screenings, and a general lack of consumer education. “Political” responses included mentions of public officials’ lack of knowledge about local health concerns, politics’ driving of healthcare decisions, and difficulties posed by the state regulatory environment.

302013 Community Health Needs Assessment www.sjhsyr.org
heALth stAtus issues
Chart 6 presents the distribution of responses across four general categories impacting health status. Over half of the responses are captured in the “chronic disease,” “mental health and substance abuse,” and “physical activity and nutrition” categories Chart 7 shows that the forum participants identified the need for prevention and treatment of chronic disease to be of importance to the local community. They particularly mentioned asthma as needing attention.
312013 Community Health Needs Assessment www.sjhsyr.org
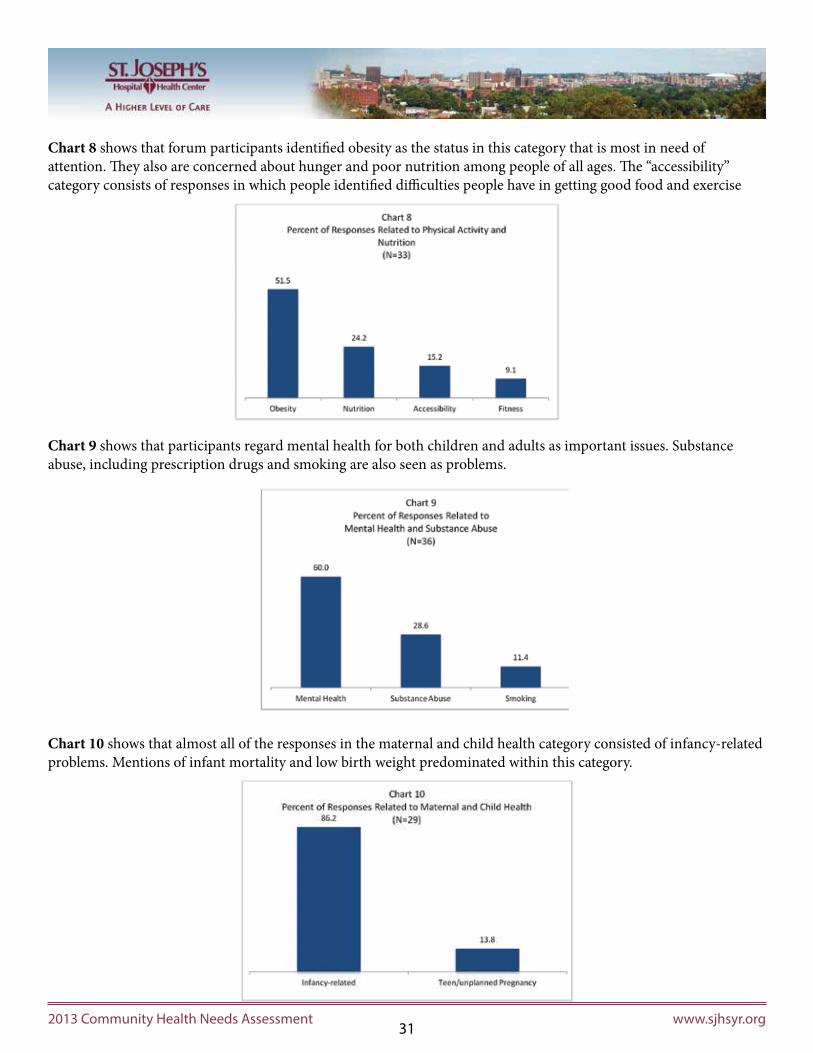
Chart 8 shows that forum participants identified obesity as the status in this category that is most in need of attention. They also are concerned about hunger and poor nutrition among people of all ages. The “accessibility” category consists of responses in which people identified difficulties people have in getting good food and exercise
Chart 9 shows that participants regard mental health for both children and adults as important issues. Substance abuse, including prescription drugs and smoking are also seen as problems.
Chart 10 shows that almost all of the responses in the maternal and child health category consisted of infancy-related problems. Mentions of infant mortality and low birth weight predominated within this category.

322013 Community Health Needs Assessment www.sjhsyr.org
Chart 11 presents information about the distribution of other conditions that arose during the sessions. “Other” conditions mainly include infectious diseases (especially STDs), injuries (especially falls among elderly people), and general oral health. “Other” conditions within this overall category that were mentioned by forum participants were diseases of the eye, seasonal affective disorder, and allergies.
Chart 12 presents findings regarding social factors that are connected to health status. Most responses related to violence mentioned crime or domestic violence, including child abuse; most responses in the “education” category mentioned either the cost of education or low rates of achievement; all of the responses in the “income category” either mentioned the cost of health insurance or poverty; and lead poisoning was mentioned by three people.
overALL Assessment of pubLic heALth issues
When the health system and health status issues are considered together, social conditions is the set of factors that are most frequently cited as impacting overall health of the community. These social issues are wide ranging and clearly demonstrate the enormous effect of social and environmental conditions on health. Interventions to address these issues are also broad and would include economic development and expansion of educational opportunities.
Access to health care is also a dominant theme. Access is defined broadly and includes financial access and capacity as well as the degree to which consumers are a partner in their health care. In particular, access to primary care and mental health care were identified as problematic.
Health status was also negatively impacted by a number of variables including physical activity and nutrition which drives, in large measure, chronic disease, another area of concern frequently cited. Other health concerns relate to mental health and substance abuse as well as maternal and child health, problems exacerbated by limited access to care and poor social conditions.