Community Assessment
12
Community Assessment Agripina Polushkin Nevada State College
-
Upload
apolushkin -
Category
Education
-
view
44 -
download
1
Transcript of Community Assessment

Community
Assessment
Agripina Polushkin
Nevada State College

Community of Las Vegas
• Estimated population as of 2013 was 603,488, with a total population density of 4,298 persons per square mile (U.S. Census Bureau, 2015).
• As of 2010 census, 62.1% of residents were White, 11.1% Black or African American, and 31.5% Hispanic or Latino (U.S. Census Bureau, 2015).
• Age of residents: 7.2% under 5, 25.7% under 18, and 12.0% 65 years and over (U.S. Census Bureau, 2015).
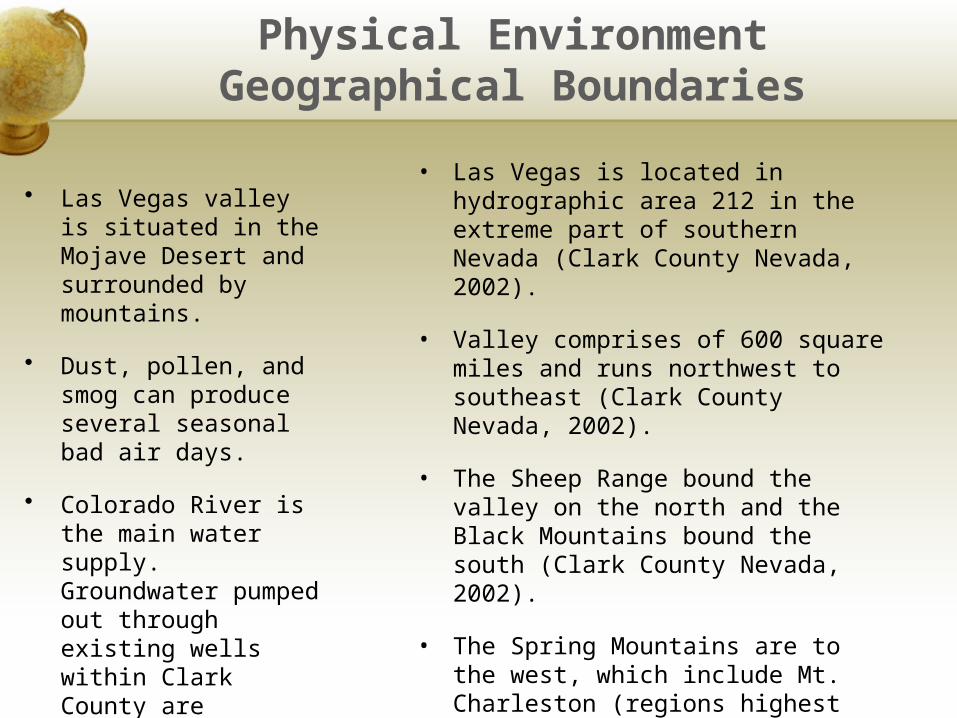
Physical EnvironmentGeographical Boundaries
• Las Vegas valley is situated in the Mojave Desert and surrounded by mountains.
• Dust, pollen, and smog can produce several seasonal bad air days.
• Colorado River is the main water supply. Groundwater pumped out through existing wells within Clark County are additional water sources.
• Las Vegas is located in hydrographic area 212 in the extreme part of southern Nevada (Clark County Nevada, 2002).
• Valley comprises of 600 square miles and runs northwest to southeast (Clark County Nevada, 2002).
• The Sheep Range bound the valley on the north and the Black Mountains bound the south (Clark County Nevada, 2002).
• The Spring Mountains are to the west, which include Mt. Charleston (regions highest peak at 11,918 feet) (Clark County Nevada, 2002).

Housing/Neighborhoods
• Housing options range from a house in a family friendly neighborhood, a high-rise condo, to a simple apartment.
• Current median Las Vegas home price: $180,300 (Zillow, 2015).
• One bedroom apartments rent for about $800 and two bedrooms rent for approximately $1,000 a month (Rent Jungle, 2015).
• Numerous family friendly neighborhoods with school options, access to parks, and youth development opportunities.

Culture & Values
• Although a top tourist destination, Las Vegas is a growing retirement and family city.
• City is highly recognized for its artistic culture; involved in many events and programs that further the advancement of arts in the community.
• The city sponsors many cultural events ranging from concerts and plays to dances and film showings.

Community Strengths & Resources
• Increasingly diverse and unique quality of life that is continuing to evolve with new cultural offerings.
• Various types of art festivals & cultural events throughout the year.
• Numerous sporting recreation activities: baseball, tennis, hockey, football, college sports, etc.
• Five exceptional stadiums and arenas that provide community top venues for entertainment.
• A number of sports, cultural and recreational programs for area youth.
• Numerous community parks, water parks, sports courts, & playgrounds.
• Las Vegas Fire and Rescue with 18 fire stations protecting residents; work closely with community to educate residents about fire safety issues.
• Las Vegas Metropolitan Police Department (LVMPD) work to keep Las Vegas safe; programs such as Citizen’s Police Academy, Crime Stoppers, Neighborhood watch, Gang Prevention, etc.
• Clark County school district maintains own police department; education DARE program.
• Citizens Area Transit (CAT) bus service for transportation needs.

Socioeconomic Data
• Total number of households in Las Vegas between 2009-2013 was 212,735; median household income was $51,143 (U.S. Census Bureau, 2015).
• Estimated per capita income in 2013 was $25,607; 17.1% of persons was considered below poverty level (U.S. Census Bureau, 2015).
• Current unemployment rate in Las Vegas is 8.0% (U.S. Bureau of Labor Statistics, 2015).
• Employment status as of 2012: 35.4% full-time & 16.0% part-time workers, 9.8% homemakers, 26.3% students, & 12.5% retired persons (City of Las Vegas Redevelopment Agency, 2014).
• Educational level: 82.5% age 25 and over are high school graduates or higher; 21.4% age 25 and over are Bachelor’s degree prepared or higher (U.S. Census Bureau, 2015).
• Major occupational groups: food preparation & serving related, personal care & service, and building & grounds cleaning and maintenance (U.S. Bureau of Labor Statistics, 2015).

Health Care• Total of 10 full-service
hospitals within city of Las Vegas; 80 physicians per 100,000 people (Williams & Rowley, 2012).
• Las Vegas metropolitan area ranks low in regard to quality of medical care, combination of quality of care, access & affordability, preventive care, costs, & potential for patients to lead healthy lives (Williams & Rowley, 2012).
• There is a shortage of primary care providers and psychiatrists in Las Vegas (Williams & Rowley, 2012).
• Nearly 60% of all workers are employed in the service or retail sector; income for many does not meet basic needs without government assistance (St. Rose Dominican Hospitals, 2013).
• Many struggle to afford housing, childcare, health insurance or health care; places increased pressure on social service agencies and health care providers to make up difference when families cannot make ends meet.
• Top five priority issues in community: diabetes management, adult & children without health insurance, heart disease & stroke, breast cancer screening/mammography, & childhood asthma (St. Rose Dominican Hospitals, 2013).

Morbidity & Mortality
• Rates of infectious disease and preventable hospitalizations have declined significantly since 2000; however, percentage of residents reporting high cholesterol, high blood pressure, and diabetes are steadily increasing in Nevada (Monnat, 2012).
• Significant behavioral risk factors in Clark County are unhealthy diet and lack of exercise: major contributing factors to increasing rates of obesity, coronary heart disease, type-2 diabetes, cancer, stroke, respiratory problems, and poor health status (Williams & Rowley, 2012).
• Rates of vaccine preventable diseases are low; however, Nevada ranks 49th out of all states in the percentage of children who received required vaccinations by 3rd birthday; adolescents & adults also under-immunized; leaving possibility for infectious disease outbreak (Monnat, 2012).
• Top five leading causes of death in Clark County: diseases of the heart (26%), cancer (23%), chronic lower respiratory diseases (6%), accidents (5%), and stroke (5%) (Williams & Rowley, 2012).

Community Problems• Problem one:
• One of primary priorities identified by St. Rose Dominican Hospitals 2013 community assessment is diabetes management.
• Clark County data shows that only 17.5% of youth under 18 and 23.9% of adults consume at least 5 servings of fruits & vegetables per day (Williams & Rowley, 2012).
• Obesity rates: 12.3% of youth under 18 and 26.5% of adults in Clark County are obese (Williams & Rowley, 2012).
• Stats show that 14.7% of youth under 18 and 26.5% of adults get little or no exercise (Williams & Rowley, 2012).
• Problem two:
• Adults and children without health insurance is another significant issue.
• According to the U.S. Census Bureau 2013 survey, Nevada had an uninsured rate of greater than or equal to 19.1% (Smith & Medalia, 2014).
• Nevada’s uninsured rate is one of highest in the nation.
• Lack of insurance restricts access to health care on every level, and ultimately leads to poor health outcomes.

Problem Analysis• Problem one:• Unhealthy diet and lack of exercise are
key contributing factors to type-2 diabetes.
• Direct/indirect contributing factors: overweight, inactive, pre-diabetes, etc.; unhealthy choices at fast food/restaurant chains, and higher cost of healthier food choices are unaffordable to many.
• Southern Nevada Health District (2015) launched new online program: Road to Diabetes Prevention to reduce risk of developing type-2 diabetes.
• Employers should provide incentive programs to encourage employees to exercise and eat healthy.
• Children should have opportunity to eat healthy and fresh foods, including fruits and vegetables at home and school to improve healthy eating habits.
• Problem two:• High percentage of uninsured
Nevadans problem is contributable to the fact that majority of workers are employed in service or retail sector and many cannot afford health insurance.
• Uninsured individuals are less likely to seek preventive care and more likely to delay seeking treatment for an illness/disease.
• The Patient Protection and Affordable Care Act (ACA), signed into law in 2010, targets giving more Americans access to quality, affordable health insurance.
• Benefit of ACA: effective in 2014, coverage under Medicaid and Children Health Insurance Program (CHIP) expanded to provide medical coverage for low-income residents.
References • City of Las Vegas Redevelopment Agency. (2014). Demographics. Retrieved from: http://
www.census.gov/historyv/pdf/egas_demographics.pdf• Clark County Nevada. (2002). Geography and climatic summary for the Las Vegas and Apex
Valleys. Retrieved from: http://www.clarkcountynv.gov/Depts/AirQuality/Documents/Planning/SIP/ PM10/App_B%E2%80%93Geography_and_Climatic_Summary.pdf
• Monnat, S.M. (2012). Disease prevalence and behavioral risk in Nevada. Retrieved from: http://cdclv.unlv.edu/healthnv_2012/disease.pdf
• Rent Jungle. (2015). Rent trend data in Las Vegas, Nevada. Retrieved from: https://www.rentjungle.com/average-rent-in-las-vegas-rent-trends/
• Smith, J.C., & Medalia, C. (2014). Health insurance coverage in the United States: 2013. Retrieved from: http://www.census.gov/content/dam/Census/library/publications/2014/demo/p60-250.pdf
• St. Rose Dominican Hospitals. (2013). Community health needs assessment 2013. Retrieved from: http://www.dignityhealth.org/cm/media/documents/St-Rose-Dominican-Hospital-Rose-de-Lima- IS.pdf
• United States Bureau of Labor Statistics. (2015). Las Vegas area economic summary. Retrieved from: http://www.bls.gov/regions/west/summary/blssummary_lasvegas.pdf
• United States Census Bureau. (2015). State and county quick facts: Las Vegas, Nevada. Retrieved from: http://quickfacts.census.gov/qfd/states/32/3240000.html
• Williams, N., & Rowley, P. (2012). Clark County community health status assessment. Retrieved from: http://www.naccho.org/topics/infrastructure/accreditation/upload/draft-cha.pdf
• Zillow. (2015). Las Vegas home prices and values. Retrieved from: http://www.zillow.com/las-vegas-nv/ home-values/