COMMUNICATION MARKETS MONITORING SYSTEM
27
COMMUNICATION MARKETS MONITORING SYSTEM no. 4/2019 Servizio Economico Statistico
Transcript of COMMUNICATION MARKETS MONITORING SYSTEM

COMMUNICATION MARKETS MONITORING SYSTEM
no. 4/2019
Servizio Economico Statistico
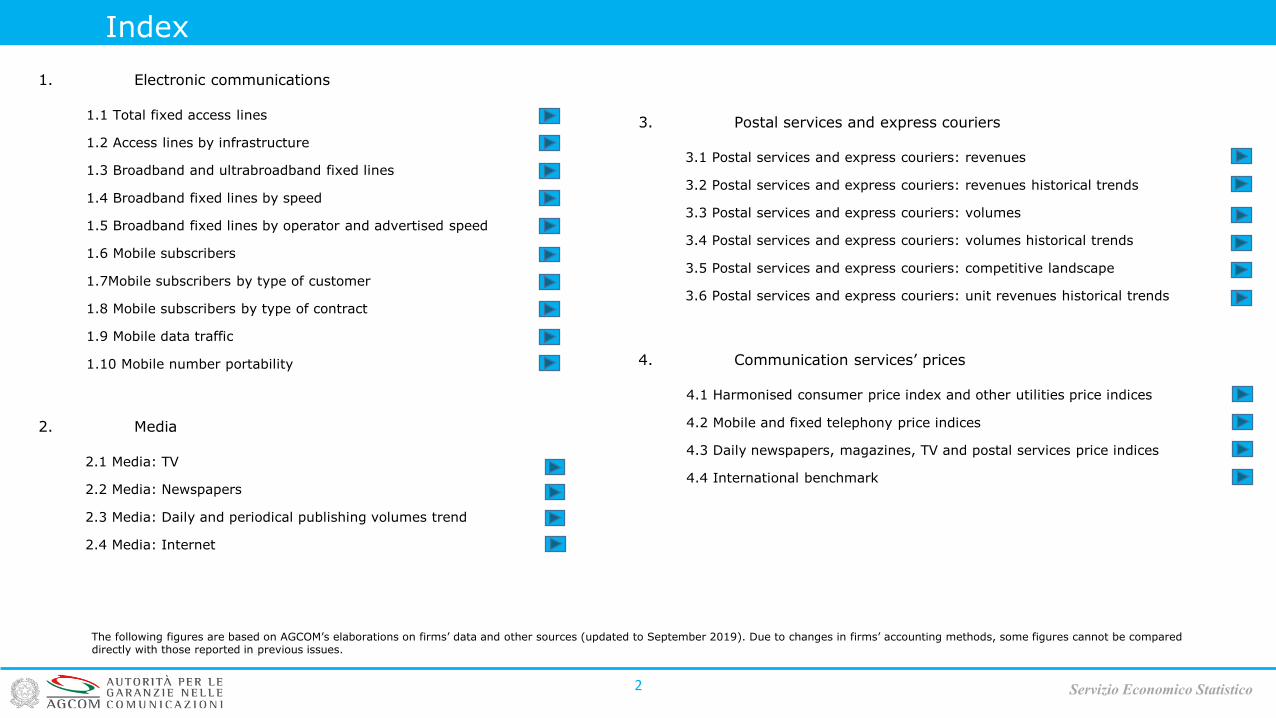
Index
1. Electronic communications
1.1 Total fixed access lines
1.2 Access lines by infrastructure
1.3 Broadband and ultrabroadband fixed lines
1.4 Broadband fixed lines by speed
1.5 Broadband fixed lines by operator and advertised speed
1.6 Mobile subscribers
1.7Mobile subscribers by type of customer
1.8 Mobile subscribers by type of contract
1.9 Mobile data traffic
1.10 Mobile number portability
2. Media
2.1 Media: TV
2.2 Media: Newspapers
2.3 Media: Daily and periodical publishing volumes trend
2.4 Media: Internet
3. Postal services and express couriers
3.1 Postal services and express couriers: revenues
3.2 Postal services and express couriers: revenues historical trends
3.3 Postal services and express couriers: volumes
3.4 Postal services and express couriers: volumes historical trends
3.5 Postal services and express couriers: competitive landscape
3.6 Postal services and express couriers: unit revenues historical trends
4. Communication services’ prices
4.1 Harmonised consumer price index and other utilities price indices
4.2 Mobile and fixed telephony price indices
4.3 Daily newspapers, magazines, TV and postal services price indices
4.4 International benchmark
The following figures are based on AGCOM’s elaborations on firms’ data and other sources (updated to September 2019). Due to changes in firms’ accounting methods, some figures cannot be compared directly with those reported in previous issues.
2 Servizio Economico Statistico
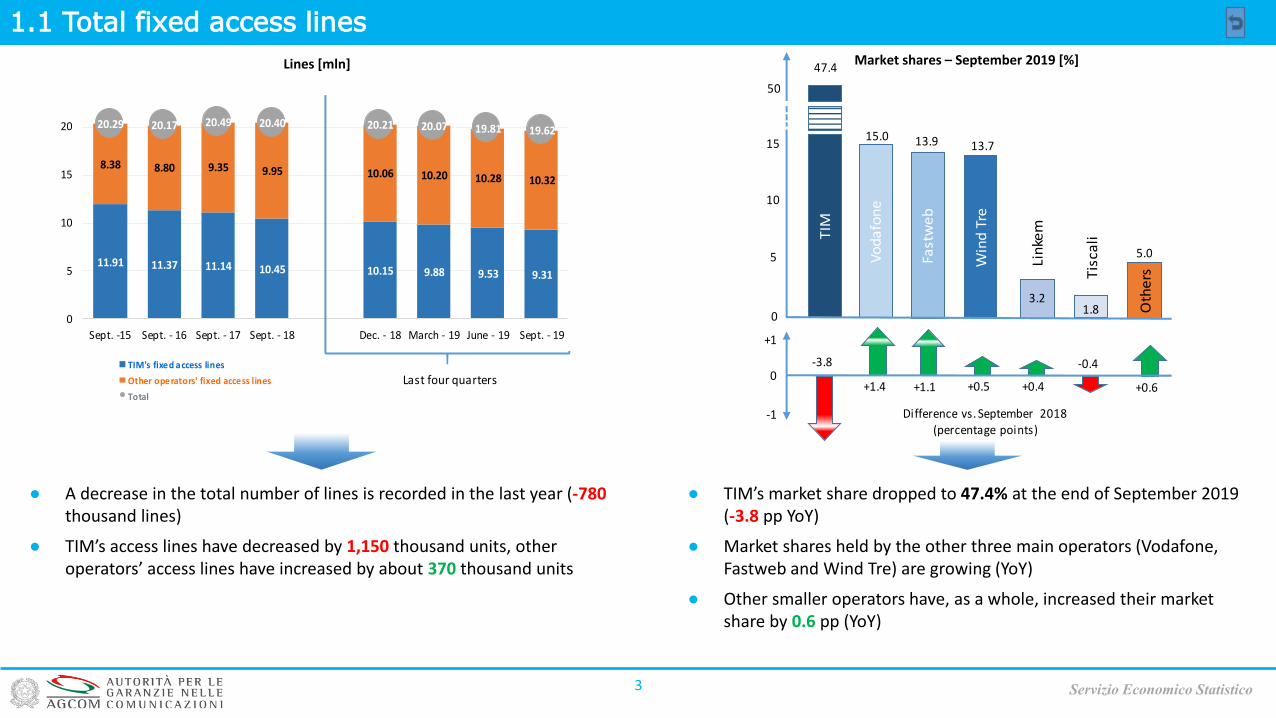
● TIM’s market share dropped to 47.4% at the end of September 2019 (-3.8 pp YoY)
● Market shares held by the other three main operators (Vodafone, Fastweb and Wind Tre) are growing (YoY)
● Other smaller operators have, as a whole, increased their market share by 0.6 pp (YoY)
1.1 Total fixed access lines
3
● A decrease in the total number of lines is recorded in the last year (-780thousand lines)
● TIM’s access lines have decreased by 1,150 thousand units, other operators’ access lines have increased by about 370 thousand units
Servizio Economico Statistico
Lines [mln] Market shares – September 2019 [%]
11.91 11.37 11.14 10.45 10.15 9.88 9.53 9.31
8.38 8.80 9.35 9.95 10.06 10.20 10.28 10.32
20.29 20.17 20.49 20.40 20.21 20.07 19.81 19.62
0
5
10
15
20
Sept. -15 Sept. - 16 Sept. - 17 Sept. - 18 Dec. - 18 March - 19 June - 19 Sept. - 19
TIM's fixed access lines
Other operators' fixed access lines
Total
Last four quarters
5.0
-0.4
Tis
cali
Vo
da
fon
e
TIM
Fast
we
b
Win
d T
re
Oth
ers
15
10
5
0
47.4
15.0 13.9 13.7
3.2
50
-3.8
+1.1+1.40
+1
-1
+0.6+0.5
Lin
kem
+0.4
1.8
Difference vs. September 2018(percentage points)
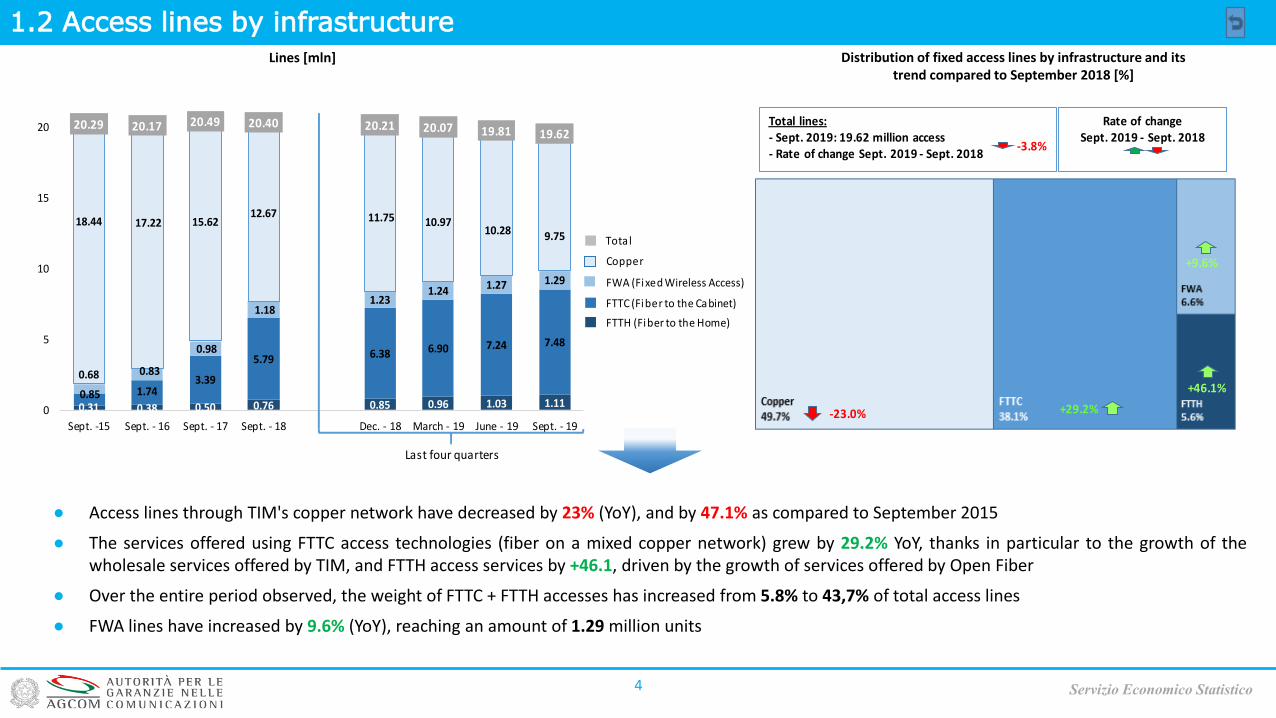
1.2 Access lines by infrastructure
4
● Access lines through TIM's copper network have decreased by 23% (YoY), and by 47.1% as compared to September 2015
● The services offered using FTTC access technologies (fiber on a mixed copper network) grew by 29.2% YoY, thanks in particular to the growth of thewholesale services offered by TIM, and FTTH access services by +46.1, driven by the growth of services offered by Open Fiber
● Over the entire period observed, the weight of FTTC + FTTH accesses has increased from 5.8% to 43,7% of total access lines
● FWA lines have increased by 9.6% (YoY), reaching an amount of 1.29 million units
Servizio Economico Statistico
Lines [mln] Distribution of fixed access lines by infrastructure and its trend compared to September 2018 [%]
FTTC (Fiber to the Cabinet)
FWA (Fixed Wireless Access)
FTTH (Fiber to the Home)
Copper
Total
0.31 0.38 0.50 0.76 0.85 0.96 1.03 1.110.85 1.74
3.39
5.79 6.38 6.90 7.24 7.48
0.68 0.83
0.98
1.181.23
1.24 1.27 1.29
18.44 17.22 15.6212.67 11.75 10.97
10.28 9.75
20.29 20.17 20.49 20.40 20.21 20.07 19.81 19.62
0
5
10
15
20
Sept. -15 Sept. - 16 Sept. - 17 Sept. - 18 Dec. - 18 March - 19 June - 19 Sept. - 19
Last four quarters
Total lines:- Sept. 2019: 19.62 million access- Rate of change Sept. 2019 - Sept. 2018
Rate of changeSept. 2019 - Sept. 2018
-3.8%
+9.6%
+46.1%
-23.0% +29.2%
1.3 Broadband and ultrabroadband fixed lines
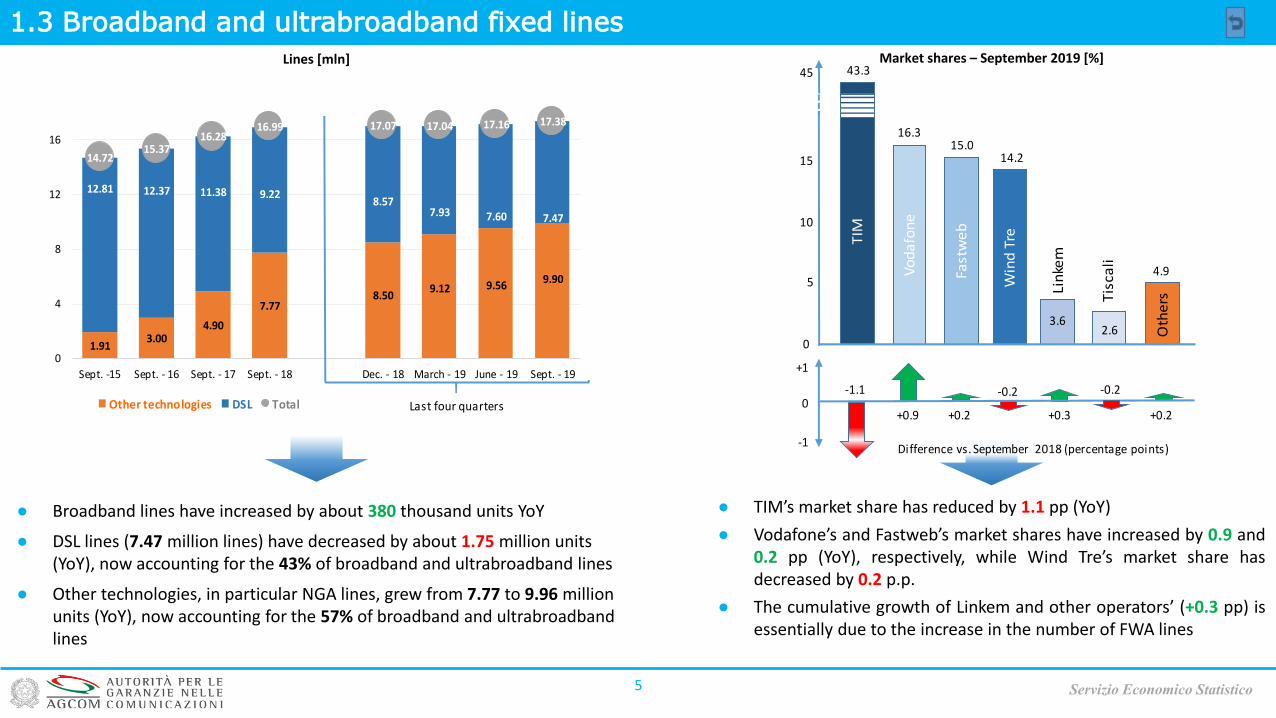
● Broadband lines have increased by about 380 thousand units YoY
● DSL lines (7.47 million lines) have decreased by about 1.75 million units (YoY), now accounting for the 43% of broadband and ultrabroadband lines
● Other technologies, in particular NGA lines, grew from 7.77 to 9.96 million units (YoY), now accounting for the 57% of broadband and ultrabroadband lines
● TIM’s market share has reduced by 1.1 pp (YoY)
● Vodafone’s and Fastweb’s market shares have increased by 0.9 and0.2 pp (YoY), respectively, while Wind Tre’s market share hasdecreased by 0.2 p.p.
● The cumulative growth of Linkem and other operators’ (+0.3 pp) isessentially due to the increase in the number of FWA lines
5 Servizio Economico Statistico
Market shares – September 2019 [%]Lines [mln]
1.913.00
4.90
7.778.50
9.12 9.569.90
12.81 12.37 11.38 9.228.57
7.93 7.60 7.47
14.7215.37
16.2816.99 17.07 17.04 17.16 17.38
0
4
8
12
16
Sept. -15 Sept. - 16 Sept. - 17 Sept. - 18 Dec. - 18 March - 19 June - 19 Sept. - 19
Other technologies DSL Total Last four quarters-0.2
+0.3
Win
d T
reTIM
Fast
we
b
Vo
da
fon
e
Oth
ers
Lin
kem
Tis
cali
15
10
5
0
43.3
16.3
14.215.0
4.9
45
-1.1
+0.2 +0.20
3.6
+1
-1
2.6
+0.9
-0.2
Difference vs. September 2018 (percentage points)
1.4 Broadband fixed lines by speed
6 Servizio Economico Statistico
Broadband access lines trend by speed classes [mln] Access lines by speed classes [%]
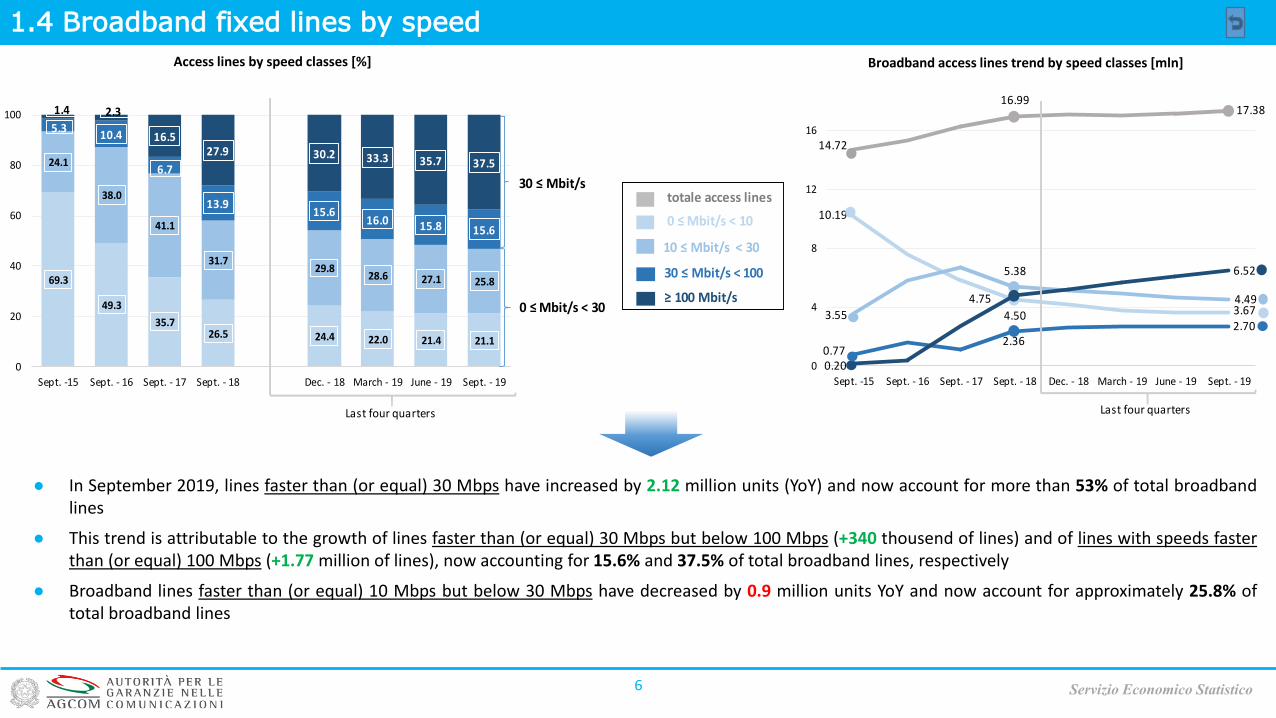
● In September 2019, lines faster than (or equal) 30 Mbps have increased by 2.12 million units (YoY) and now account for more than 53% of total broadbandlines
● This trend is attributable to the growth of lines faster than (or equal) 30 Mbps but below 100 Mbps (+340 thousend of lines) and of lines with speeds fasterthan (or equal) 100 Mbps (+1.77 million of lines), now accounting for 15.6% and 37.5% of total broadband lines, respectively
● Broadband lines faster than (or equal) 10 Mbps but below 30 Mbps have decreased by 0.9 million units YoY and now account for approximately 25.8% oftotal broadband lines
69.3
49.3
35.726.5 24.4 22.0 21.4 21.1
24.1
38.0
41.1
31.729.8
28.6 27.1 25.8
5.310.4
6.7
13.915.6
16.0 15.8 15.6
1.4 2.3
16.527.9 30.2 33.3 35.7 37.5
0
20
40
60
80
100
Sept. -15 Sept. - 16 Sept. - 17 Sept. - 18 Dec. - 18 March - 19 June - 19 Sept. - 19
Last four quarters
totale access lines
30 ≤ Mbit/s < 100
0 ≤ Mbit/s < 10
10 ≤ Mbit/s < 30
≥ 100 Mbit/s
10.19
4.50 3.67
0.772.36
2.703.55
5.38
4.49
14.72
16.9917.38
0.20
4.75
6.52
0
4
8
12
16
Sept. -15 Sept. - 16 Sept. - 17 Sept. - 18 Dec. - 18 March - 19 June - 19 Sept. - 19
Last four quarters
0 ≤ Mbit/s < 30
30 ≤ Mbit/s
1.5 Broadband fixed lines by operator and advertised speed
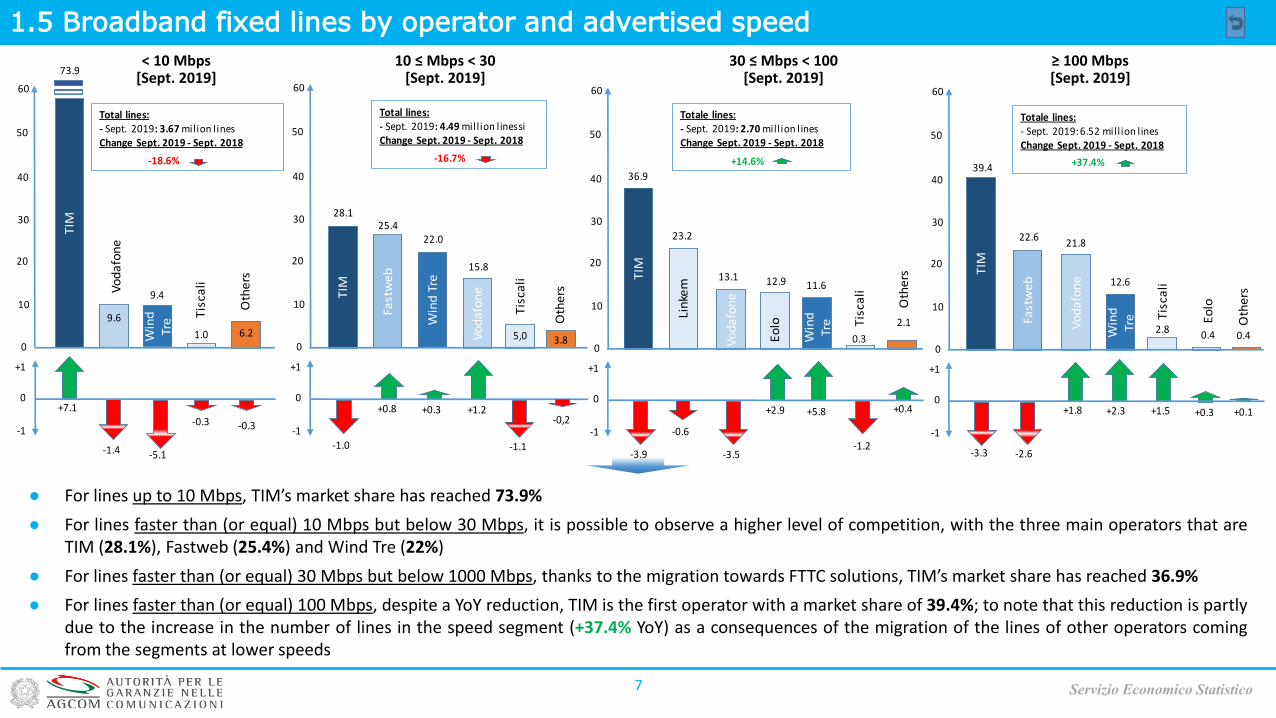
● For lines up to 10 Mbps, TIM’s market share has reached 73.9%
● For lines faster than (or equal) 10 Mbps but below 30 Mbps, it is possible to observe a higher level of competition, with the three main operators that areTIM (28.1%), Fastweb (25.4%) and Wind Tre (22%)
● For lines faster than (or equal) 30 Mbps but below 1000 Mbps, thanks to the migration towards FTTC solutions, TIM’s market share has reached 36.9%
● For lines faster than (or equal) 100 Mbps, despite a YoY reduction, TIM is the first operator with a market share of 39.4%; to note that this reduction is partlydue to the increase in the number of lines in the speed segment (+37.4% YoY) as a consequences of the migration of the lines of other operators comingfrom the segments at lower speeds
7 Servizio Economico Statistico
< 10 Mbps [Sept. 2019]
10 ≤ Mbps < 30 [Sept. 2019]
≥ 100 Mbps[Sept. 2019]
30 ≤ Mbps < 100[Sept. 2019]
Total lines:- Sept. 2019: 3.67 milion linesChange Sept. 2019 - Sept. 2018
-0.3
50
TIM
Win
d
Tre
Tis
cali
30
20
10
0
73.9
9.6
9.4
6.2
40
-5.1
0
+1
-1
1.0
+7.1
-1.4
60
-0.3
Oth
ers
-18.6%
Vo
da
fon
e
Oth
ers
50
Vo
da
fon
eTIM
Win
d T
re
Fast
we
b
Tis
cali
30
20
10
0
28.125.4
22.0
5,0 3.8
40
-1.0
0
+1
-1
15.8
+0.3
60
-1.1
+1.2+0.8
Total lines:- Sept. 2019: 4.49 million linessiChange Sept. 2019 - Sept. 2018
-16.7%
-0,2
50
Lin
kem
TIM
Vo
da
fon
e
Oth
ers
30
20
10
0
36.9
12.9
0.3
11.6
2.1
40
-3.5
+0.40
23.2
+1
-1
+5.8
-0.6
60
Eo
lo
13.1
+2.9
Tis
cali
Win
d
Tre
-1.2
Totale lines:- Sept. 2019: 2.70 million linesChange Sept. 2019 - Sept. 2018
+14.6%
-3.9
TIM
Tis
cali
Eo
lo
50
Vo
da
fon
e
Fast
we
b
Oth
ers
30
20
10
00.4
12.6
2.80.4
40
+0.30
22.6
+1
-1
-3.3
60
21.8
+1.8 +1.5
Win
d
Tre
39.4
+2.3
-2.6
+0.1
Totale lines:- Sept. 2019: 6.52 mill ion linesChange Sept. 2019 - Sept. 2018
+37.4%
1.6 Mobile subscribers
8
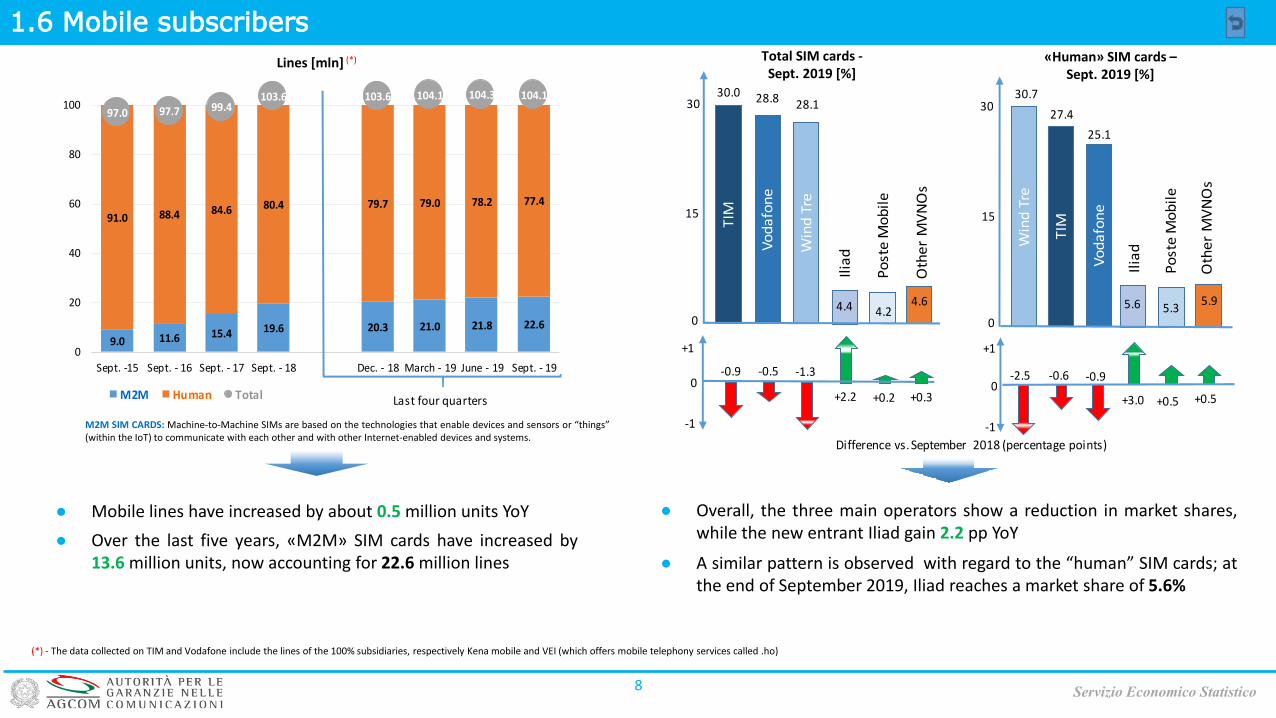
● Overall, the three main operators show a reduction in market shares,while the new entrant Iliad gain 2.2 pp YoY
● A similar pattern is observed with regard to the “human” SIM cards; atthe end of September 2019, Iliad reaches a market share of 5.6%
Total SIM cards -Sept. 2019 [%]
«Human» SIM cards –Sept. 2019 [%]
● Mobile lines have increased by about 0.5 million units YoY
● Over the last five years, «M2M» SIM cards have increased by13.6 million units, now accounting for 22.6 million lines
Lines [mln] (*)
Servizio Economico Statistico
M2M SIM CARDS: Machine-to-Machine SIMs are based on the technologies that enable devices and sensors or “things”(within the IoT) to communicate with each other and with other Internet-enabled devices and systems.
(*) - The data collected on TIM and Vodafone include the lines of the 100% subsidiaries, respectively Kena mobile and VEI (which offers mobile telephony services called .ho)
9.0 11.6 15.4 19.6 20.3 21.0 21.8 22.6
91.0 88.4 84.6 80.4 79.7 79.0 78.2 77.4
97.0 97.7 99.4103.6 103.6 104.1 104.3 104.1
0
20
40
60
80
100
Sept. -15 Sept. - 16 Sept. - 17 Sept. - 18 Dec. - 18 March - 19 June - 19 Sept. - 19
M2M Human Total Last four quarters
Win
d T
re
Vo
da
fon
e
TIM
Po
ste
Mo
bil
e
Oth
er
MV
NO
s
15
0
28.8 28.130.0
4.6
30
0
4.2
+1
-1
-1.3-0.5
+0.2
Ilia
d
+2.2
4.4
-0.9
+0.3
Po
ste
Mo
bil
e
Oth
er
MV
NO
s
TIM
Vo
da
fon
e
Win
d T
re
15
0
27.4
25.1
30.7
5.6 5.9
30
0
+1
-1
-2.5
+0.5
-0.9
+3.0 +0.5
Ilia
d
-0.6
5.3
Difference vs. September 2018 (percentage points)
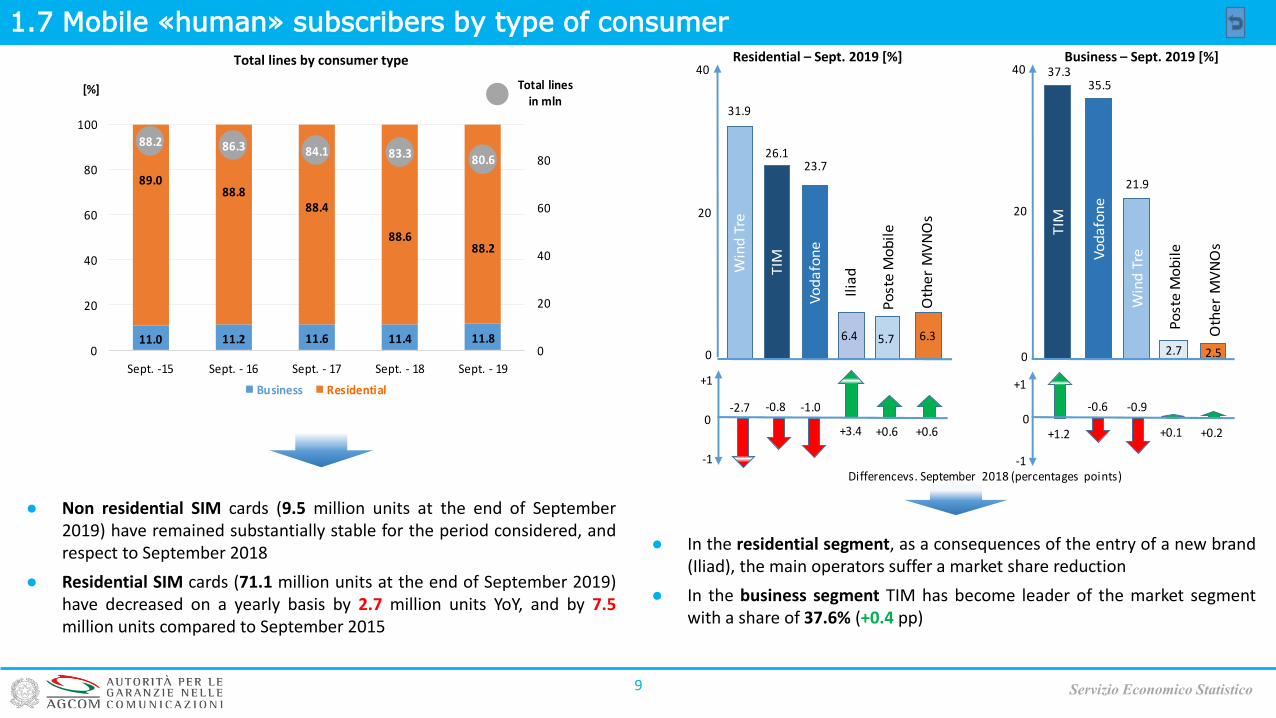
1.7 Mobile «human» subscribers by type of consumer
● Non residential SIM cards (9.5 million units at the end of September2019) have remained substantially stable for the period considered, andrespect to September 2018
● Residential SIM cards (71.1 million units at the end of September 2019)have decreased on a yearly basis by 2.7 million units YoY, and by 7.5million units compared to September 2015
● In the residential segment, as a consequences of the entry of a new brand(Iliad), the main operators suffer a market share reduction
● In the business segment TIM has become leader of the market segmentwith a share of 37.6% (+0.4 pp)
9 Servizio Economico Statistico
Residential – Sept. 2019 [%] Business – Sept. 2019 [%]Total lines by consumer type
11.0 11.2 11.6 11.4 11.8
89.088.8
88.4
88.688.2
88.2 86.3 84.1 83.3 80.6
0
20
40
60
80
0
20
40
60
80
100
Sept. -15 Sept. - 16 Sept. - 17 Sept. - 18 Sept. - 19
Business Residential
[%] Total lines in mln
-1.0
Po
ste
Mo
bil
e
Oth
er
MV
NO
s
TIM
Vo
da
fon
e
Win
d T
re
20
0
26.123.7
31.9
6.4 6.3
40
0
+1
-1
-2.7
+3.4 +0.6 +0.6
Ilia
d
5.7
Win
d T
reVo
da
fon
e
TIM
Po
ste
Mo
bil
e
Oth
er
MV
NO
s
20
0
35.5
21.9
37.3
2.5
40
0
2.7
+1
-1
-0.9
+0.2+0.1+1.2
-0.8 -0.6
Differencevs. September 2018 (percentages points)
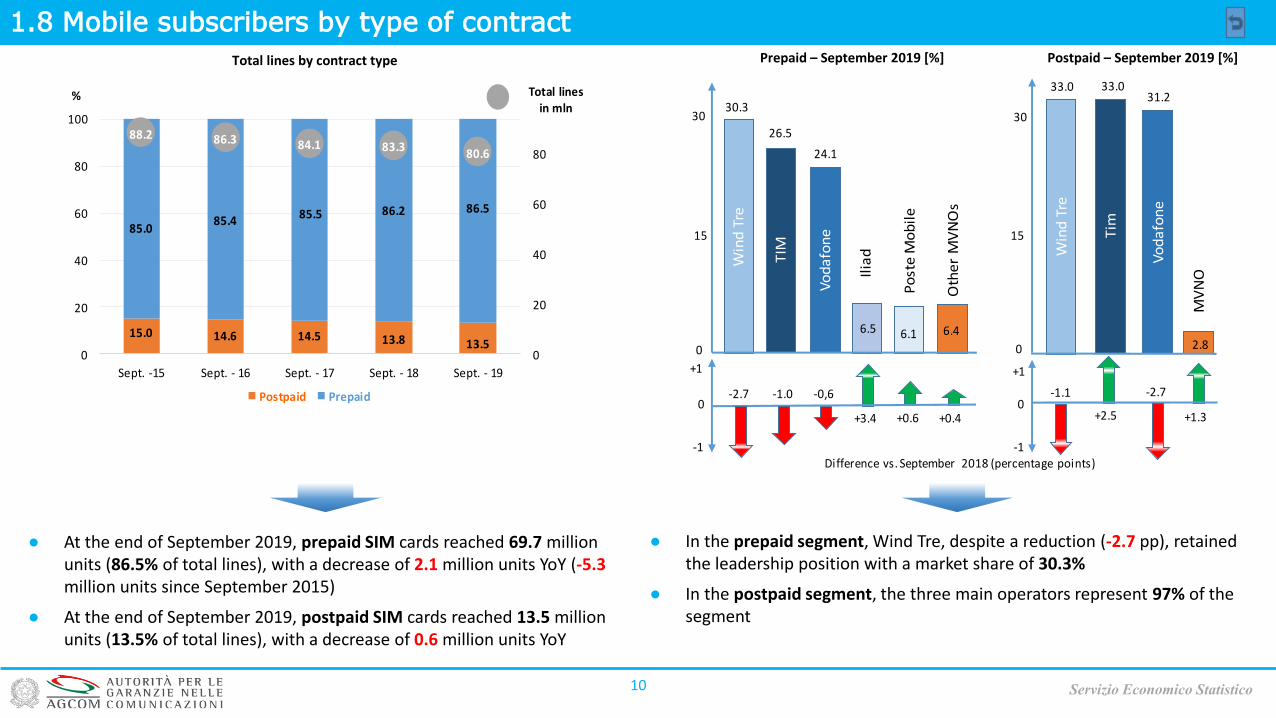
1.8 Mobile subscribers by type of contract
● At the end of September 2019, prepaid SIM cards reached 69.7 million units (86.5% of total lines), with a decrease of 2.1 million units YoY (-5.3 million units since September 2015)
● At the end of September 2019, postpaid SIM cards reached 13.5 million units (13.5% of total lines), with a decrease of 0.6 million units YoY
● In the prepaid segment, Wind Tre, despite a reduction (-2.7 pp), retained the leadership position with a market share of 30.3%
● In the postpaid segment, the three main operators represent 97% of the segment
10
Total lines by contract type
Servizio Economico Statistico
Prepaid – September 2019 [%] Postpaid – September 2019 [%]
15.0 14.6 14.5 13.8 13.5
85.085.4
85.5 86.2 86.5
88.2 86.3 84.1 83.380.6
0
20
40
60
80
0
20
40
60
80
100
Sept. -15 Sept. - 16 Sept. - 17 Sept. - 18 Sept. - 19
Postpaid Prepaid
Total lines in mln
%
TIM
Vo
da
fon
e
Win
d T
re
Ilia
d
Oth
er
MV
NO
s
15
0
26.5
24.1
30.3
6.4
30
-0,6
+3.40
6.1
+1
-1
Tim
Win
d T
re
Vo
da
fon
e
MV
NO
15
0
33.031.2
33.0
2.8
30
-2.70
+1
-1
-2.7
+0.6 +2.5
Po
ste
Mo
bil
e
6.5
-1.0
+0.4 +1.3
-1.1
Difference vs. September 2018 (percentage points)
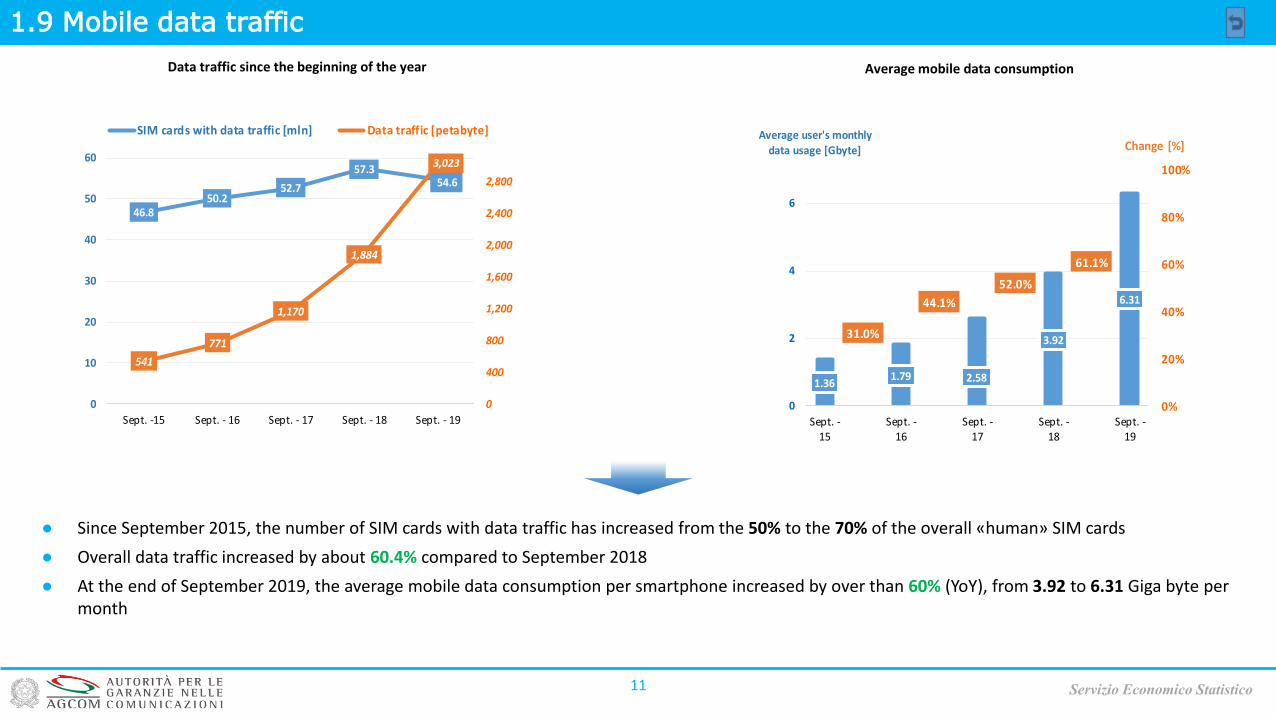
1.9 Mobile data traffic
11
● Since September 2015, the number of SIM cards with data traffic has increased from the 50% to the 70% of the overall «human» SIM cards
● Overall data traffic increased by about 60.4% compared to September 2018
● At the end of September 2019, the average mobile data consumption per smartphone increased by over than 60% (YoY), from 3.92 to 6.31 Giga byte per month
Data traffic since the beginning of the year
Servizio Economico Statistico
Average mobile data consumption
1.361.79 2.58
3.92
6.31
31.0%
44.1%
52.0%
61.1%
0%
20%
40%
60%
80%
100%
0
2
4
6
Sept. -15
Sept. -16
Sept. -17
Sept. -18
Sept. -19
Change [%]Average user's monthly
data usage [Gbyte]
46.850.2
52.7
57.354.6
541
771
1,170
1,884
3,023
0
400
800
1,200
1,600
2,000
2,400
2,800
0
10
20
30
40
50
60
Sept. -15 Sept. - 16 Sept. - 17 Sept. - 18 Sept. - 19
SIM cards with data traffic [mln] Data traffic [petabyte]
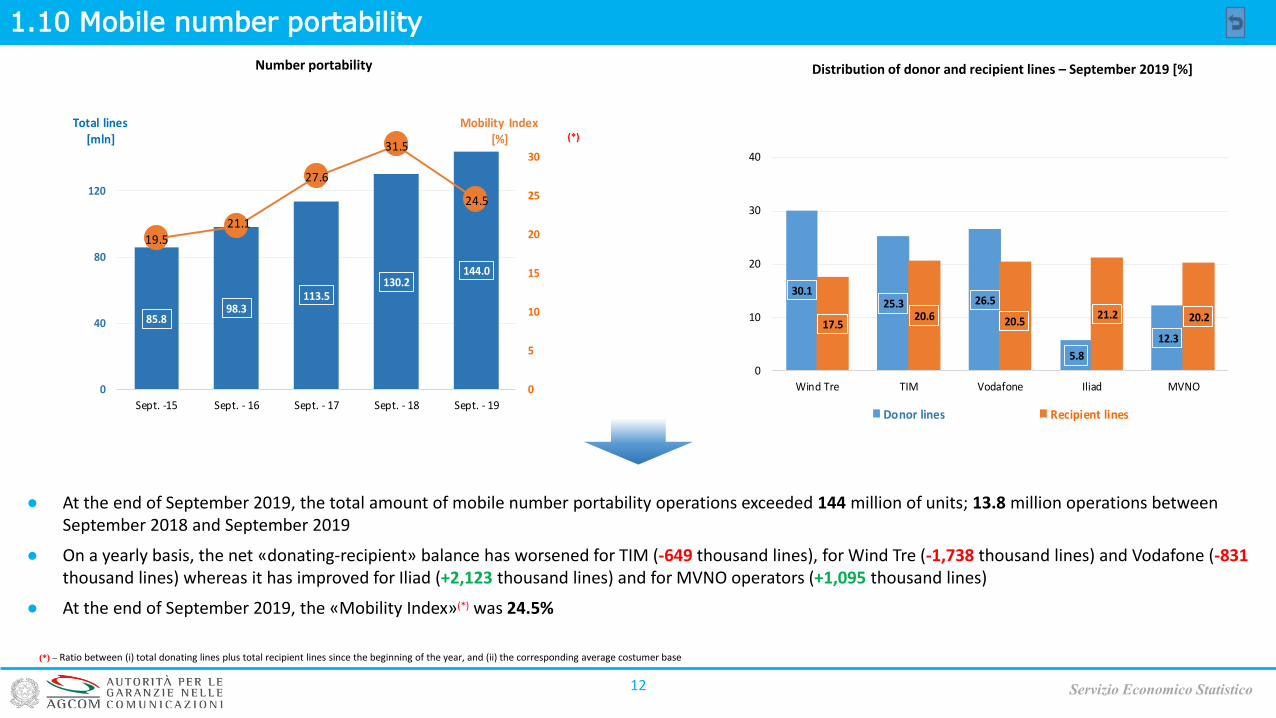
1.10 Mobile number portability
12
Number portability Distribution of donor and recipient lines – September 2019 [%]
Servizio Economico Statistico
● At the end of September 2019, the total amount of mobile number portability operations exceeded 144 million of units; 13.8 million operations betweenSeptember 2018 and September 2019
● On a yearly basis, the net «donating-recipient» balance has worsened for TIM (-649 thousand lines), for Wind Tre (-1,738 thousand lines) and Vodafone (-831thousand lines) whereas it has improved for Iliad (+2,123 thousand lines) and for MVNO operators (+1,095 thousand lines)
● At the end of September 2019, the «Mobility Index»(*) was 24.5%
(*) – Ratio between (i) total donating lines plus total recipient lines since the beginning of the year, and (ii) the corresponding average costumer base
(*)
85.898.3
113.5130.2
144.0
19.521.1
27.6
31.5
24.5
0
5
10
15
20
25
30
0
40
80
120
Sept. -15 Sept. - 16 Sept. - 17 Sept. - 18 Sept. - 19
Total lines[mln]
Mobility Index[%]
30.125.3 26.5
5.8
12.317.5
20.6 20.521.2 20.2
0
10
20
30
40
Wind Tre TIM Vodafone Iliad MVNO
Donor lines Recipient lines
2.1 Media: TV
13
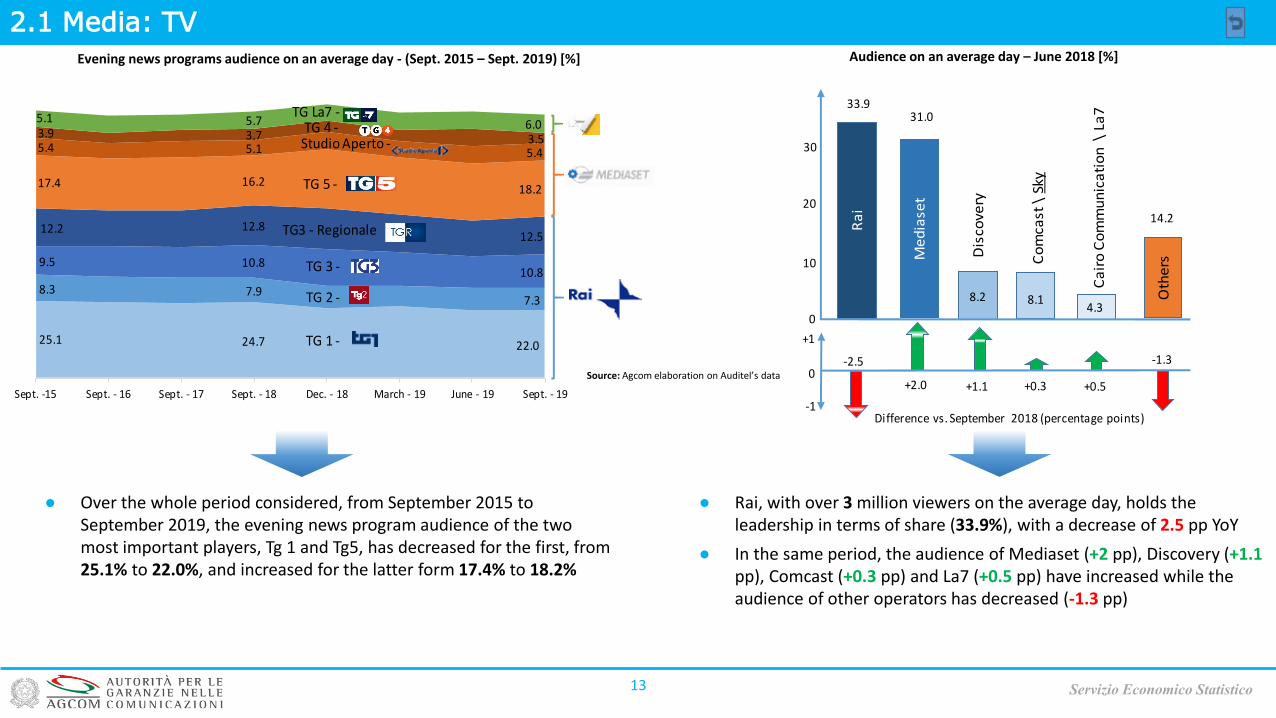
● Over the whole period considered, from September 2015 to September 2019, the evening news program audience of the two most important players, Tg 1 and Tg5, has decreased for the first, from 25.1% to 22.0%, and increased for the latter form 17.4% to 18.2%
● Rai, with over 3 million viewers on the average day, holds the leadership in terms of share (33.9%), with a decrease of 2.5 pp YoY
● In the same period, the audience of Mediaset (+2 pp), Discovery (+1.1pp), Comcast (+0.3 pp) and La7 (+0.5 pp) have increased while the audience of other operators has decreased (-1.3 pp)
Servizio Economico Statistico
Audience on an average day – June 2018 [%]Evening news programs audience on an average day - (Sept. 2015 – Sept. 2019) [%]
Source: Agcom elaboration on Auditel’s data
25.1 24.7 22.0
8.3 7.97.3
9.5 10.810.8
12.2 12.812.5
17.4 16.218.2
5.4 5.1 5.4
3.9 3.7 3.5
5.1 5.7 6.0
Sept. -15 Sept. - 16 Sept. - 17 Sept. - 18 Dec. - 18 March - 19 June - 19 Sept. - 19
TG3 - Regionale
TG 5 -
TG La7 -
TG 1 -
TG 2 -
TG 3 -
Studio Aperto -TG 4 -
-2.5
+2.0 +0.3
Ra
i
Me
dia
set
8.2 Oth
ers
Dis
cove
ry
Ca
iro
Co
mm
un
ica
tio
n \
La7
0
33.931.0
Co
mca
st \
Sky
8.1
14.2
0
4.3
10
20
30
-1
+1
-1.3
+1.1 +0.5
Difference vs. September 2018 (percentage points)
2.2 Media: Newspapers
14 Servizio Economico Statistico
Newspapers’ sales by 7 major editorial brand and type of distribution channelsSeptember 2019 [%]
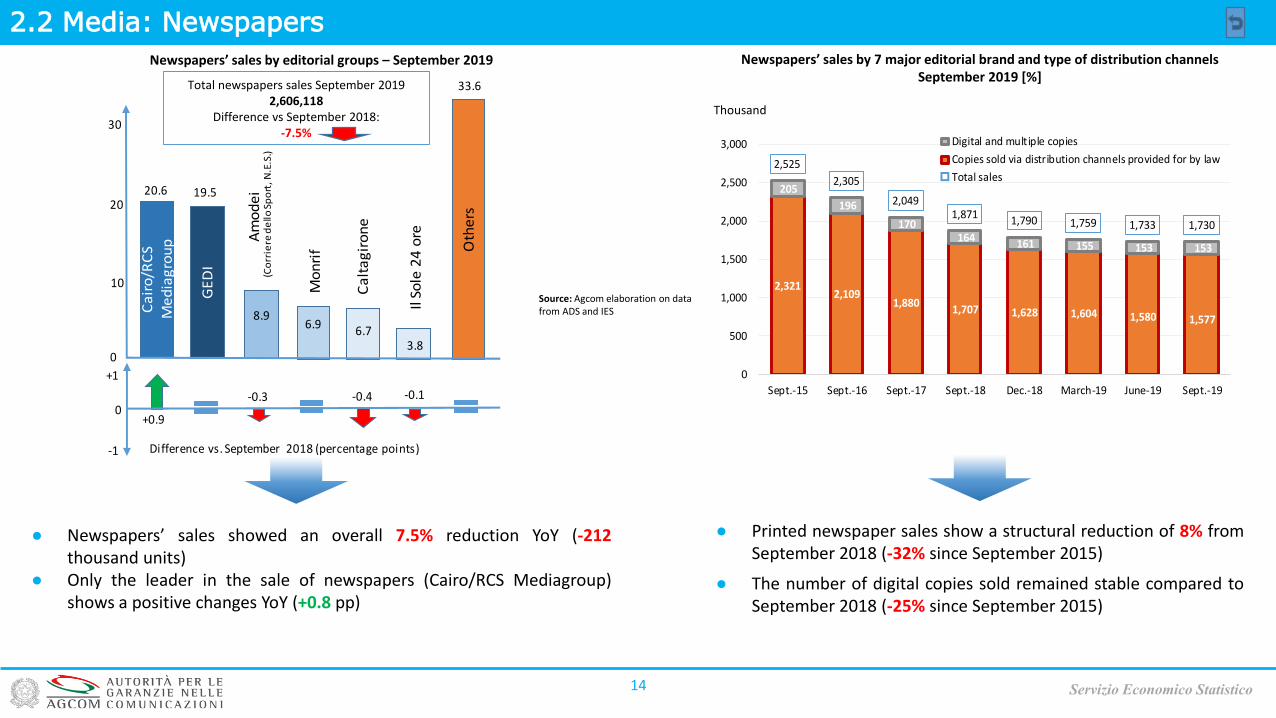
● Newspapers’ sales showed an overall 7.5% reduction YoY (-212thousand units)
● Only the leader in the sale of newspapers (Cairo/RCS Mediagroup)shows a positive changes YoY (+0.8 pp)
● Printed newspaper sales show a structural reduction of 8% fromSeptember 2018 (-32% since September 2015)
● The number of digital copies sold remained stable compared toSeptember 2018 (-25% since September 2015)
Newspapers’ sales by editorial groups – September 2019 [%]
Source: Agcom elaboration on data from ADS and IES
Total newspapers sales September 20192,606,118
Difference vs September 2018:-7.5%
Thousand
2,321 2,109
1,880 1,707 1,628 1,604 1,580 1,577
205
196
170 164
161 155 153 153
2,525
2,305
2,0491,871
1,790 1,759 1,733 1,730
0
500
1,000
1,500
2,000
2,500
3,000
Sept.-15 Sept.-16 Sept.-17 Sept.-18 Dec.-18 March-19 June-19 Sept.-19
Digital and multiple copies
Copies sold via distribution channels provided for by law
Total sales
-0.3 -0.40
+1
-1
+0.9
Oth
ers
GE
DI
Ca
iro
/RC
S M
ed
iag
rou
p
Ca
lta
gir
on
e
Il S
ole
24
ore
10
0
20.6 19.5
Am
od
ei
(Co
rrie
re d
ello
Sp
ort
, N.E
.S.)
Mo
nri
f6.9
3.8
20
30
33.6
8.96.7
Difference vs. September 2018 (percentage points)
-0.1
1,1961,095
968886
826
1,078
943 930888
777
0
400
800
1,200
2014 2015 2016 2017 2018
Newspapers Magazines
2.3 Media: Daily and periodical publishing volumes trend(*)
15 Servizio Economico Statistico
Copies sold [mln of units] (**) Periodical publishing; distribution of copies [%] (***)
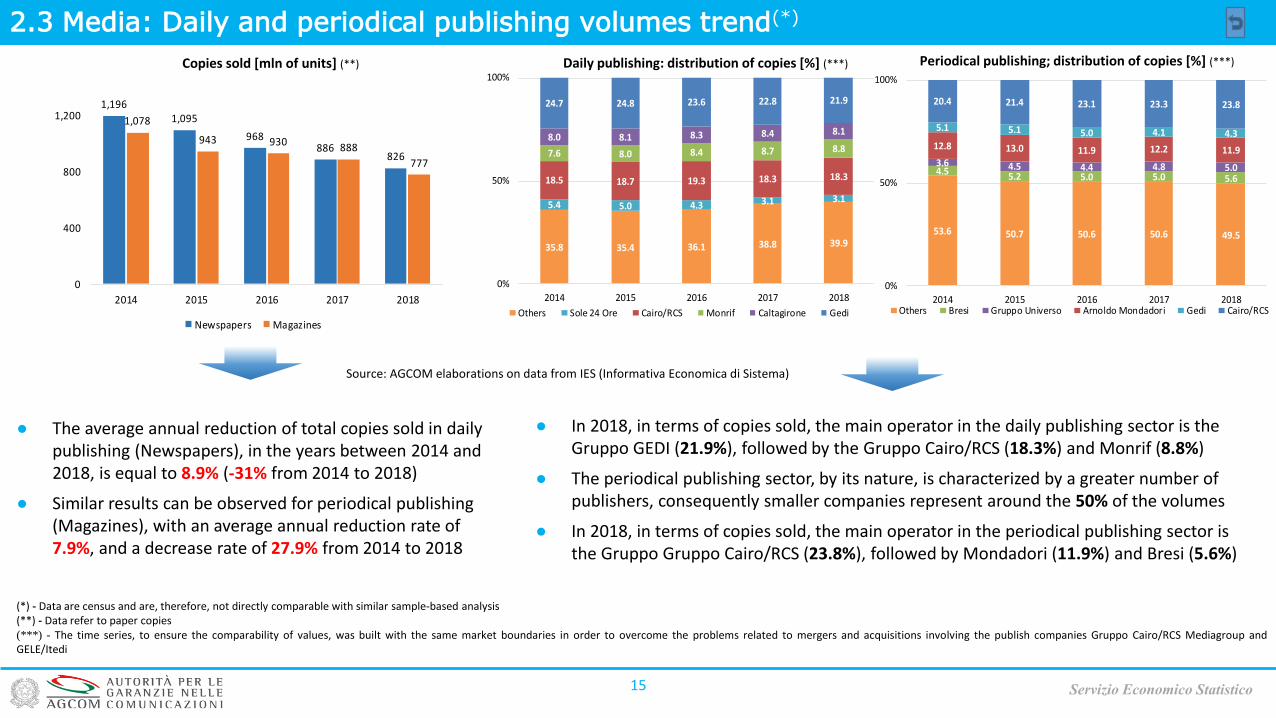
● The average annual reduction of total copies sold in daily publishing (Newspapers), in the years between 2014 and 2018, is equal to 8.9% (-31% from 2014 to 2018)
● Similar results can be observed for periodical publishing (Magazines), with an average annual reduction rate of 7.9%, and a decrease rate of 27.9% from 2014 to 2018
● In 2018, in terms of copies sold, the main operator in the daily publishing sector is the Gruppo GEDI (21.9%), followed by the Gruppo Cairo/RCS (18.3%) and Monrif (8.8%)
● The periodical publishing sector, by its nature, is characterized by a greater number of publishers, consequently smaller companies represent around the 50% of the volumes
● In 2018, in terms of copies sold, the main operator in the periodical publishing sector is the Gruppo Gruppo Cairo/RCS (23.8%), followed by Mondadori (11.9%) and Bresi (5.6%)
Daily publishing: distribution of copies [%] (***)
(*) - Data are census and are, therefore, not directly comparable with similar sample-based analysis(**) - Data refer to paper copies(***) - The time series, to ensure the comparability of values, was built with the same market boundaries in order to overcome the problems related to mergers and acquisitions involving the publish companies Gruppo Cairo/RCS Mediagroup andGELE/Itedi
Source: AGCOM elaborations on data from IES (Informativa Economica di Sistema)
35.8 35.4 36.1 38.8 39.9
5.4 5.0 4.3 3.1 3.1
18.5 18.7 19.3 18.3 18.3
7.6 8.0 8.4 8.7 8.88.0 8.1 8.3 8.4 8.1
24.7 24.8 23.6 22.8 21.9
0%
50%
100%
2014 2015 2016 2017 2018
Others Sole 24 Ore Cairo/RCS Monrif Caltagirone Gedi
53.6 50.7 50.6 50.6 49.5
4.5 5.2 5.0 5.0 5.6
3.6 4.5 4.4 4.8 5.0
12.8 13.0 11.9 12.2 11.9
5.1 5.1 5.0 4.1 4.3
20.4 21.4 23.1 23.3 23.8
0%
50%
100%
2014 2015 2016 2017 2018Others Bresi Gruppo Universo Arnoldo Mondadori Gedi Cairo/RCS
2.4 Media: Internet
16 Servizio Economico Statistico
Audience on an average day [%] and the average monthly time [mln. minutes] spent on website by visitors- Sept. 2016, Sept. 2017, Sept. 2018, Sept. 2019 -
Audience of the major social network in % – September 2019
0:00:00
12:00:00
24:00:00
36:00:00
48:00:00
Google Facebook Amazon Microsoft GEDI GruppoEditoriale
Avarege time spent on website by visitor
Sept.-16 Sept.-17 Sept.-18 Sept.-19
2825
1821
1318
1310
17
8
3128
21 23
1518
1210
17
7
4237
3026 26 28
25 2427
18
4137
31 3027 27 27 26 25
22
0
5
10
15
20
25
30
35
40
45
Google Facebook Amazon Microsoft GEDIGruppo
Editoriale
ItaliaOnline RCSMediaGroup
CaltagironeEditore
Mondadori SKY PLC
Unique audience (mln.)
mln.
hh:mm:ss
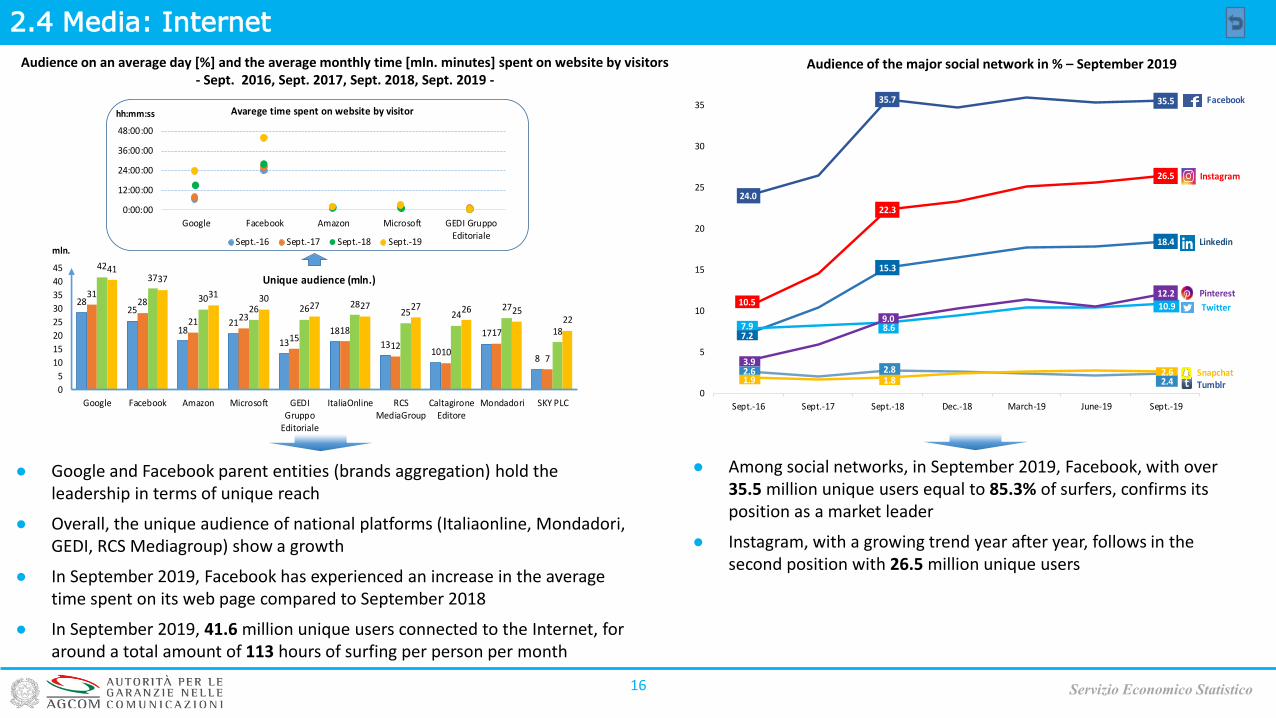
● Google and Facebook parent entities (brands aggregation) hold the leadership in terms of unique reach
● Overall, the unique audience of national platforms (Italiaonline, Mondadori, GEDI, RCS Mediagroup) show a growth
● In September 2019, Facebook has experienced an increase in the average time spent on its web page compared to September 2018
● In September 2019, 41.6 million unique users connected to the Internet, for around a total amount of 113 hours of surfing per person per month
24.0
35.7 35.5
10.5
22.3
26.5
7.2
15.3
18.4
7.9 8.6
10.9
3.9
9.0
12.2
2.6 2.82.41.9 1.82.6
0
5
10
15
20
25
30
35
Sept.-16 Sept.-17 Sept.-18 Dec.-18 March-19 June-19 Sept.-19
Snapchat
Tumblr
● Among social networks, in September 2019, Facebook, with over 35.5 million unique users equal to 85.3% of surfers, confirms its position as a market leader
● Instagram, with a growing trend year after year, follows in the second position with 26.5 million unique users
Changes in revenues [%] - (Sept. 2018 vs. Sept. 2019)
1,913
2,924
4,837
1,867
3,067
4,933
0
1600
3200
4800
Postal services Courier services Total
September 2018
September 2019
0
+5%
-5%
-2.4%
+2.0%+4.9%
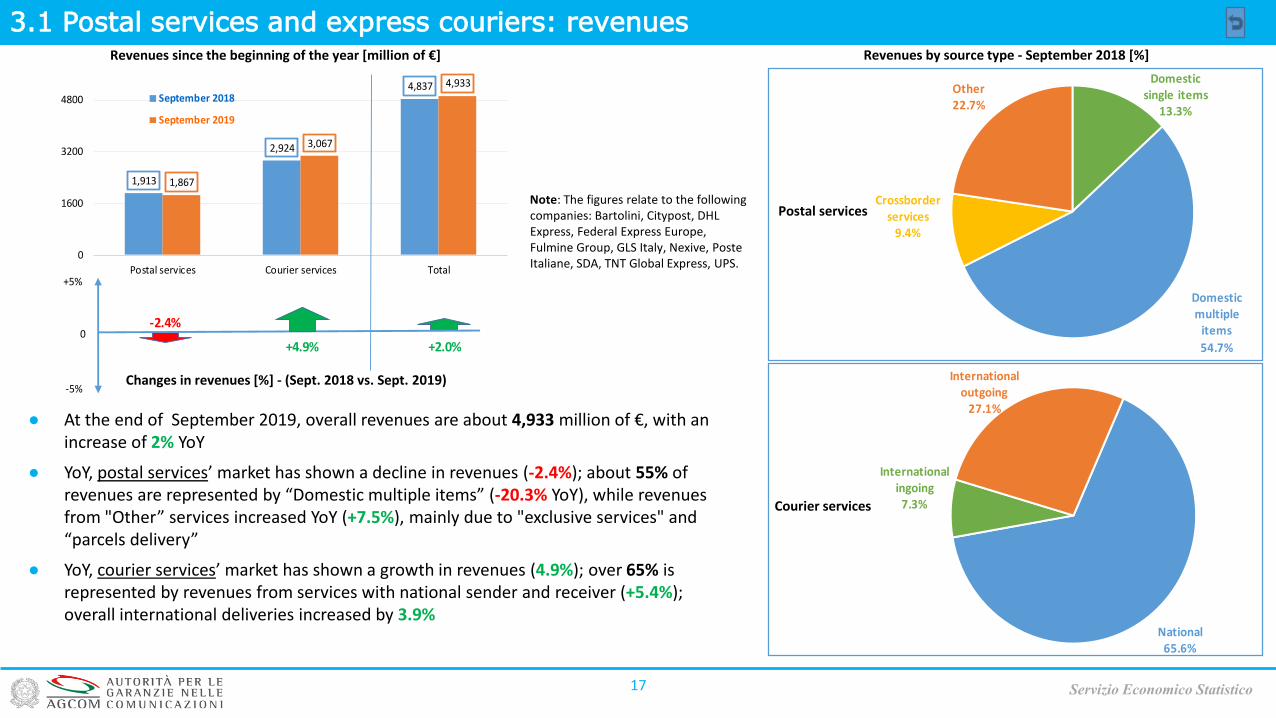
3.1 Postal services and express couriers: revenues
17
● At the end of September 2019, overall revenues are about 4,933 million of €, with an increase of 2% YoY
● YoY, postal services’ market has shown a decline in revenues (-2.4%); about 55% of revenues are represented by “Domestic multiple items” (-20.3% YoY), while revenues from "Other” services increased YoY (+7.5%), mainly due to "exclusive services" and “parcels delivery”
● YoY, courier services’ market has shown a growth in revenues (4.9%); over 65% is represented by revenues from services with national sender and receiver (+5.4%); overall international deliveries increased by 3.9%
Servizio Economico Statistico
Revenues since the beginning of the year [million of €]
Note: The figures relate to the followingcompanies: Bartolini, Citypost, DHL Express, Federal Express Europe, Fulmine Group, GLS Italy, Nexive, Poste Italiane, SDA, TNT Global Express, UPS.
Revenues by source type - September 2018 [%]
Postal services
Courier services
Domestic single items
13.3%
Domestic multiple
items
54.7%
Crossborder services
9.4%
Other22.7%
National65.6%
International ingoing
7.3%
International outgoing
27.1%
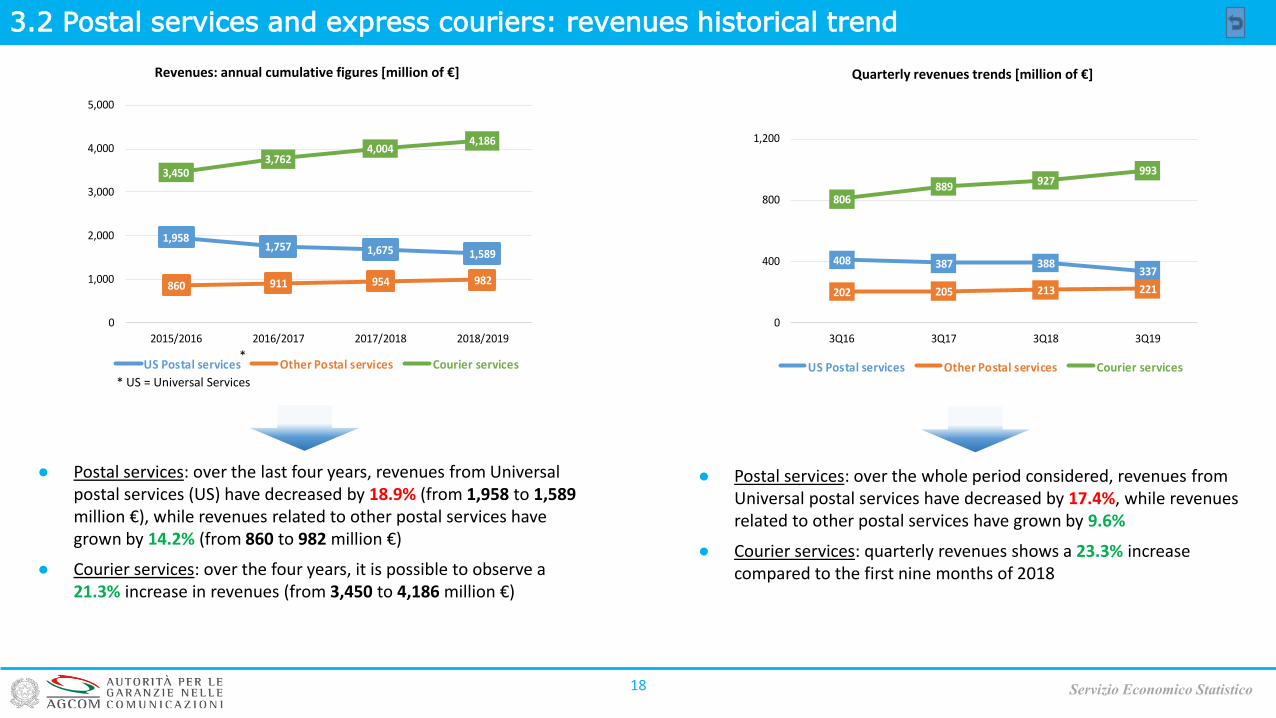
3.2 Postal services and express couriers: revenues historical trend
18
● Postal services: over the last four years, revenues from Universal postal services (US) have decreased by 18.9% (from 1,958 to 1,589million €), while revenues related to other postal services have grown by 14.2% (from 860 to 982 million €)
● Courier services: over the four years, it is possible to observe a 21.3% increase in revenues (from 3,450 to 4,186 million €)
Servizio Economico Statistico
Revenues: annual cumulative figures [million of €] Quarterly revenues trends [million of €]
* US = Universal Services
*
● Postal services: over the whole period considered, revenues from Universal postal services have decreased by 17.4%, while revenues related to other postal services have grown by 9.6%
● Courier services: quarterly revenues shows a 23.3% increase compared to the first nine months of 2018
1,9581,757 1,675 1,589
860 911 954 982
3,4503,762
4,0044,186
0
1,000
2,000
3,000
4,000
5,000
2015/2016 2016/2017 2017/2018 2018/2019
US Postal services Other Postal services Courier services
408 387 388337
202 205 213 221
806889 927
993
0
400
800
1,200
3Q16 3Q17 3Q18 3Q19
US Postal services Other Postal services Courier services
901
1,569
321
770
1,510
342
0
500
1000
1500
Universal service Other postal services Courier services
September 2018
September 2019
0
+10%
-10%
-14.6%
+6.4%
-3.8%
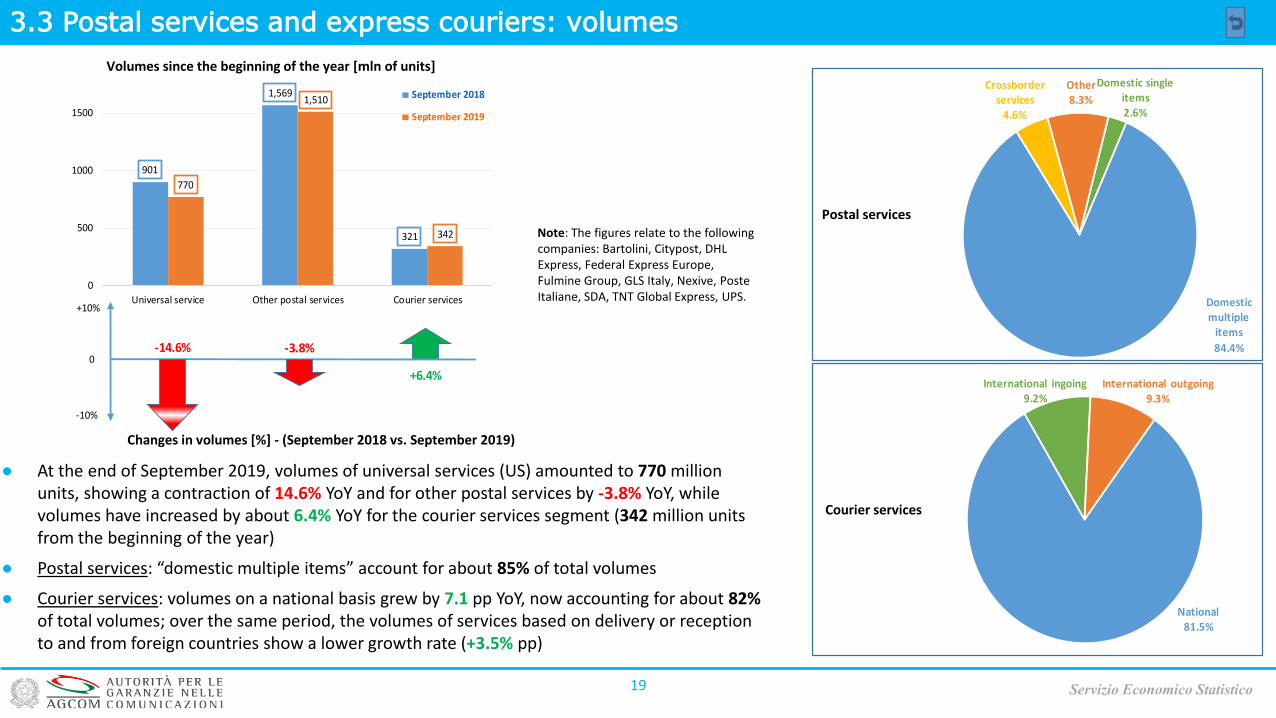
3.3 Postal services and express couriers: volumes
19 Servizio Economico Statistico
Volumes since the beginning of the year [mln of units]
Changes in volumes [%] - (September 2018 vs. September 2019)
Courier services
Postal servicesNote: The figures relate to the followingcompanies: Bartolini, Citypost, DHL Express, Federal Express Europe, Fulmine Group, GLS Italy, Nexive, Poste Italiane, SDA, TNT Global Express, UPS.
● At the end of September 2019, volumes of universal services (US) amounted to 770 million units, showing a contraction of 14.6% YoY and for other postal services by -3.8% YoY, while volumes have increased by about 6.4% YoY for the courier services segment (342 million units from the beginning of the year)
● Postal services: “domestic multiple items” account for about 85% of total volumes
● Courier services: volumes on a national basis grew by 7.1 pp YoY, now accounting for about 82%of total volumes; over the same period, the volumes of services based on delivery or reception to and from foreign countries show a lower growth rate (+3.5% pp)
Domestic single items2.6%
Domestic multiple
items
84.4%
Crossborder services
4.6%
Other8.3%
National81.5%
International ingoing9.2%
International outgoing9.3%
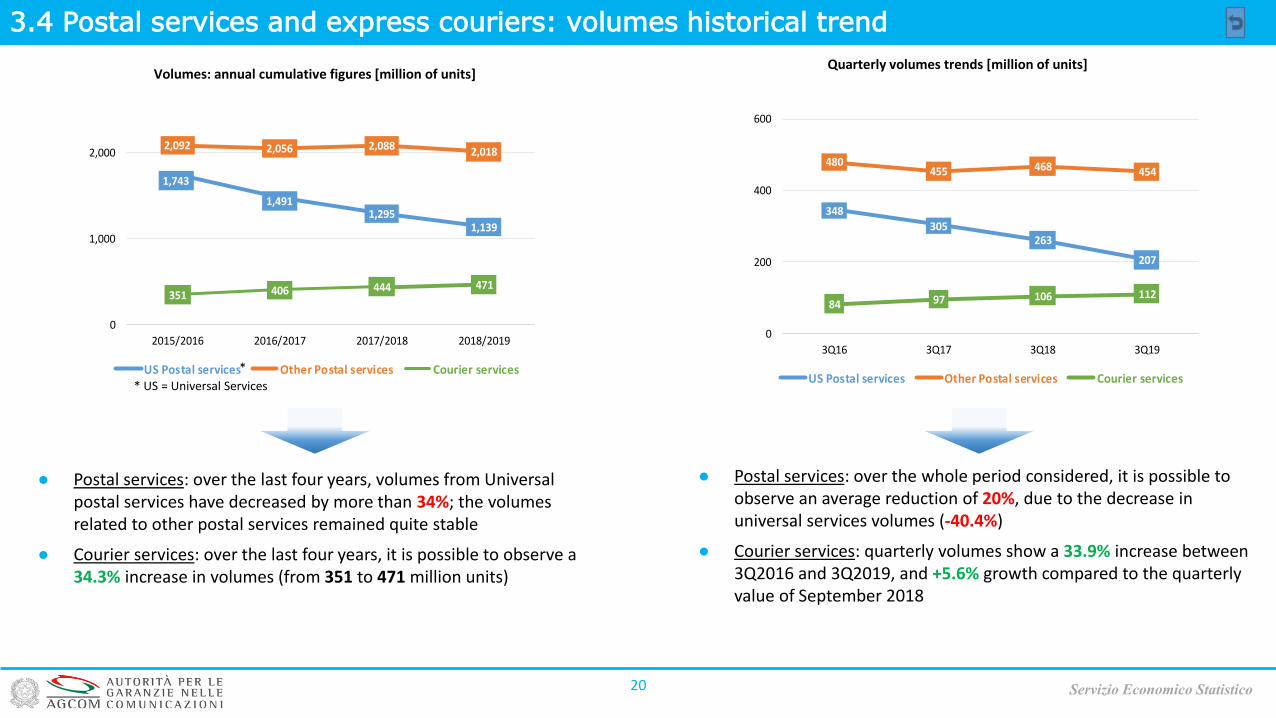
3.4 Postal services and express couriers: volumes historical trend
20
● Postal services: over the last four years, volumes from Universal postal services have decreased by more than 34%; the volumes related to other postal services remained quite stable
● Courier services: over the last four years, it is possible to observe a 34.3% increase in volumes (from 351 to 471 million units)
Servizio Economico Statistico
Volumes: annual cumulative figures [million of units]Quarterly volumes trends [million of units]
* US = Universal Services
*
● Postal services: over the whole period considered, it is possible to observe an average reduction of 20%, due to the decrease in universal services volumes (-40.4%)
● Courier services: quarterly volumes show a 33.9% increase between 3Q2016 and 3Q2019, and +5.6% growth compared to the quarterly value of September 2018
1,743
1,4911,295
1,139
2,092 2,056 2,088 2,018
351 406 444 471
0
1,000
2,000
2015/2016 2016/2017 2017/2018 2018/2019
US Postal services Other Postal services Courier services
348
305263
207
480455 468 454
84 97 106 112
0
200
400
600
3Q16 3Q17 3Q18 3Q19
US Postal services Other Postal services Courier services
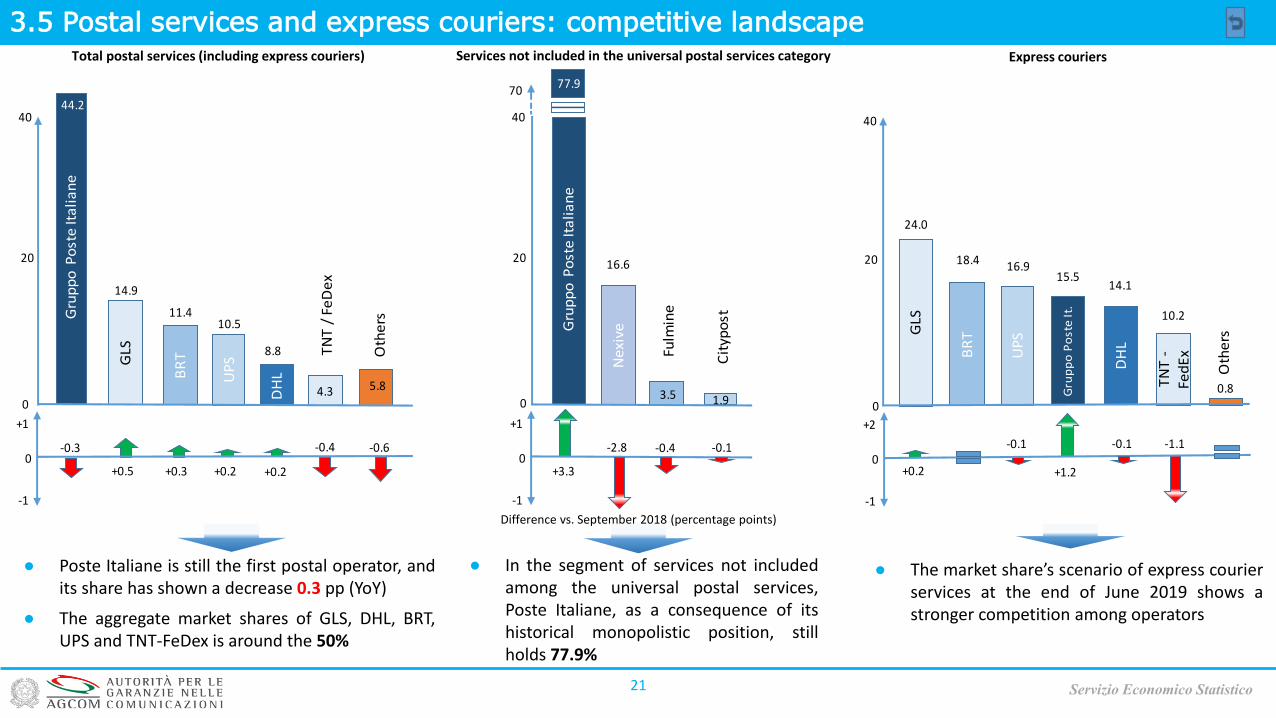
3.5 Postal services and express couriers: competitive landscape
21 Servizio Economico Statistico
● In the segment of services not includedamong the universal postal services,Poste Italiane, as a consequence of itshistorical monopolistic position, stillholds 77.9%
Total postal services (including express couriers)
Difference vs. September 2018 (percentage points)
Services not included in the universal postal services category Express couriers
● The market share’s scenario of express courierservices at the end of June 2019 shows astronger competition among operators
● Poste Italiane is still the first postal operator, andits share has shown a decrease 0.3 pp (YoY)
● The aggregate market shares of GLS, DHL, BRT,UPS and TNT-FeDex is around the 50%
GLS
Gru
pp
o P
ost
e It
ali
an
e
DH
LBR
T
UP
S
0
44.2
11.410.5
40
4.3
14.9
20
8.8
5.8
0
+1
-1
-0.4
+0.5
-0.6
+0.3 +0.2 +0.2
TN
T /
Fe
De
x
-0.3
Oth
ers
-2.8
+3.3
Cit
ypo
st
0
+1
-1
-0.1
Ne
xiveG
rup
po
Po
ste
Ita
lia
ne
0
77.9
16.6
Fulm
ine
1.9
70
20
40
3.5
-0.4
+0.2
-0.1
GLS
0.8
Oth
ers
DH
L
TN
T -
Fed
ExB
RT
UP
S
0
18.4
15.516.9
14.1
10.2
20
40
0
+2
-1
-0.1 -1.1
Gru
pp
o P
ost
e It
.
+1.2
24.0
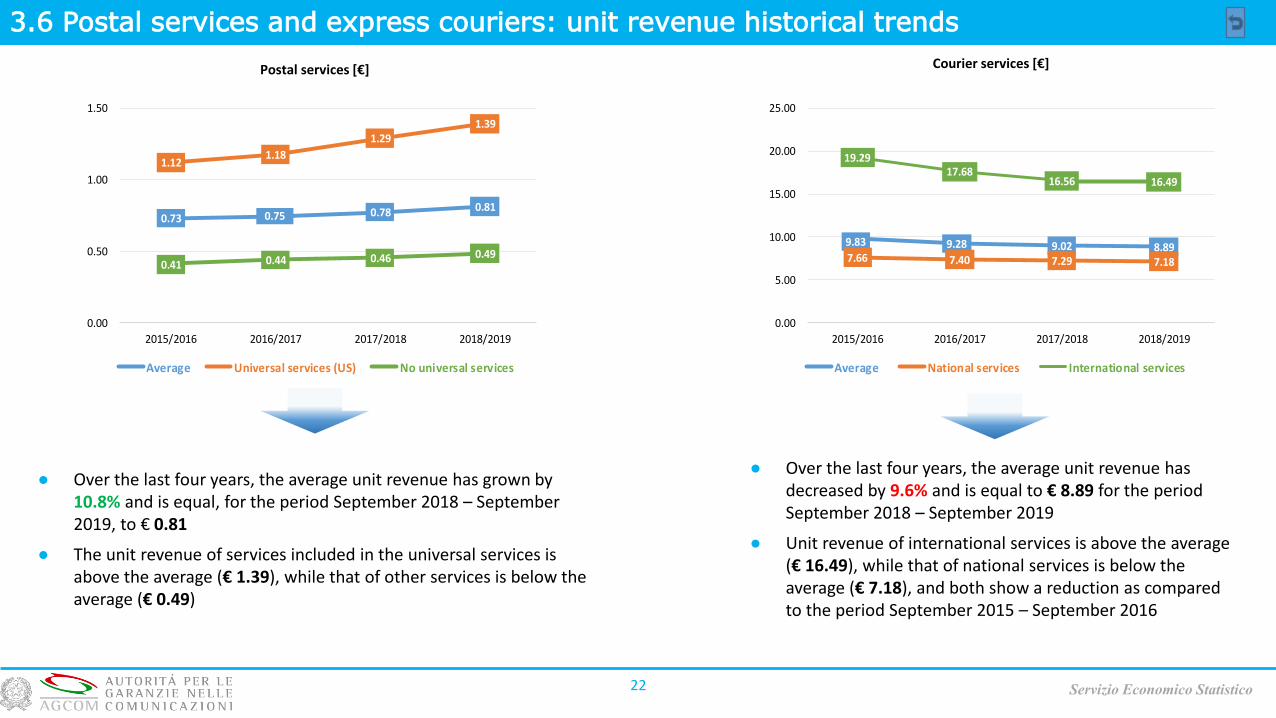
3.6 Postal services and express couriers: unit revenue historical trends
22
● Over the last four years, the average unit revenue has grown by 10.8% and is equal, for the period September 2018 – September 2019, to € 0.81
● The unit revenue of services included in the universal services is above the average (€ 1.39), while that of other services is below the average (€ 0.49)
Servizio Economico Statistico
Postal services [€] Courier services [€]
● Over the last four years, the average unit revenue has decreased by 9.6% and is equal to € 8.89 for the period September 2018 – September 2019
● Unit revenue of international services is above the average (€ 16.49), while that of national services is below the average (€ 7.18), and both show a reduction as compared to the period September 2015 – September 2016
9.83 9.28 9.02 8.897.66 7.40 7.29 7.18
19.2917.68
16.56 16.49
0.00
5.00
10.00
15.00
20.00
25.00
2015/2016 2016/2017 2017/2018 2018/2019
Average National services International services
0.73 0.75 0.78 0.81
1.121.18
1.291.39
0.41 0.44 0.46 0.49
0.00
0.50
1.00
1.50
2015/2016 2016/2017 2017/2018 2018/2019
Average Universal services (US) No universal services
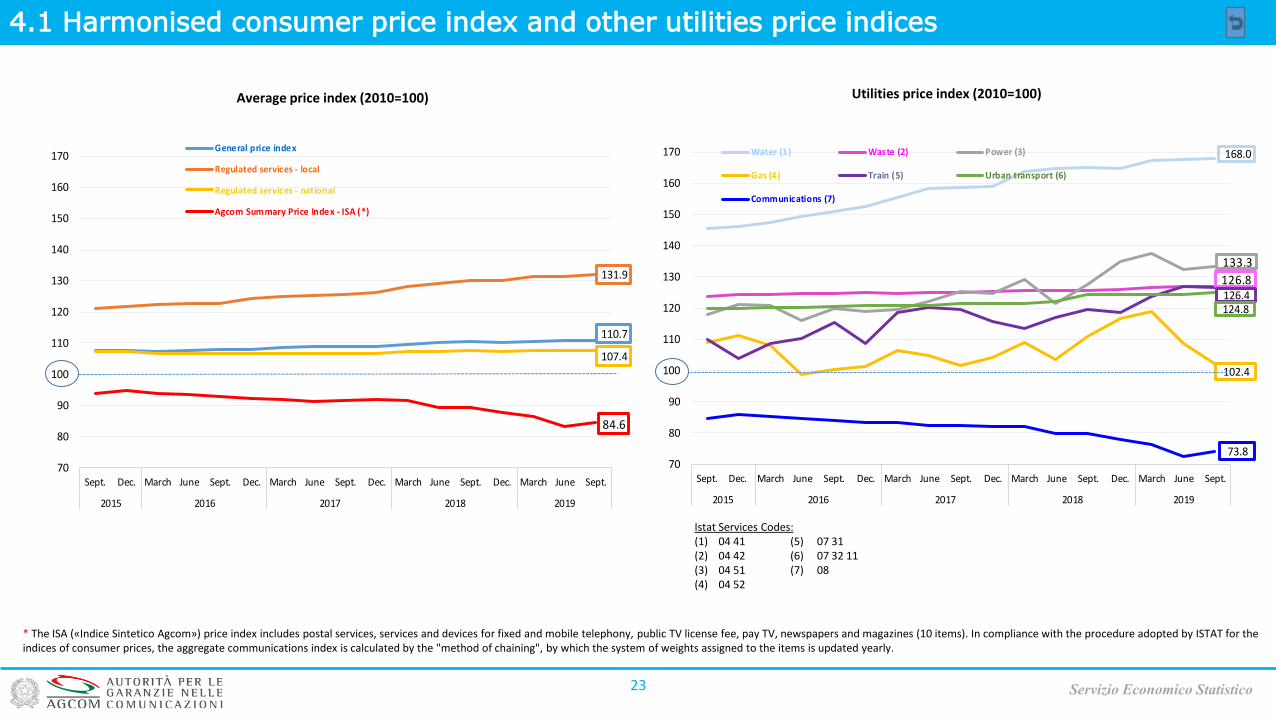
4.1 Harmonised consumer price index and other utilities price indices
23
Average price index (2010=100) Utilities price index (2010=100)
Servizio Economico Statistico
Istat Services Codes:(1) 04 41 (5) 07 31(2) 04 42 (6) 07 32 11(3) 04 51 (7) 08(4) 04 52
* The ISA («Indice Sintetico Agcom») price index includes postal services, services and devices for fixed and mobile telephony, public TV license fee, pay TV, newspapers and magazines (10 items). In compliance with the procedure adopted by ISTAT for the indices of consumer prices, the aggregate communications index is calculated by the "method of chaining", by which the system of weights assigned to the items is updated yearly.
110.7
131.9
107.4
84.6
70
80
90
100
110
120
130
140
150
160
170
Sept. Dec. March June Sept. Dec. March June Sept. Dec. March June Sept. Dec. March June Sept.
2015 2016 2017 2018 2019
General price index
Regulated services - local
Regulated services - national
Agcom Summary Price Index - ISA (*)
168.0
126.8
133.3
102.4
126.4124.8
73.870
80
90
100
110
120
130
140
150
160
170
Sept. Dec. March June Sept. Dec. March June Sept. Dec. March June Sept. Dec. March June Sept.
2015 2016 2017 2018 2019
Water (1) Waste (2) Power (3)
Gas (4) Train (5) Urban transport (6)
Communications (7)
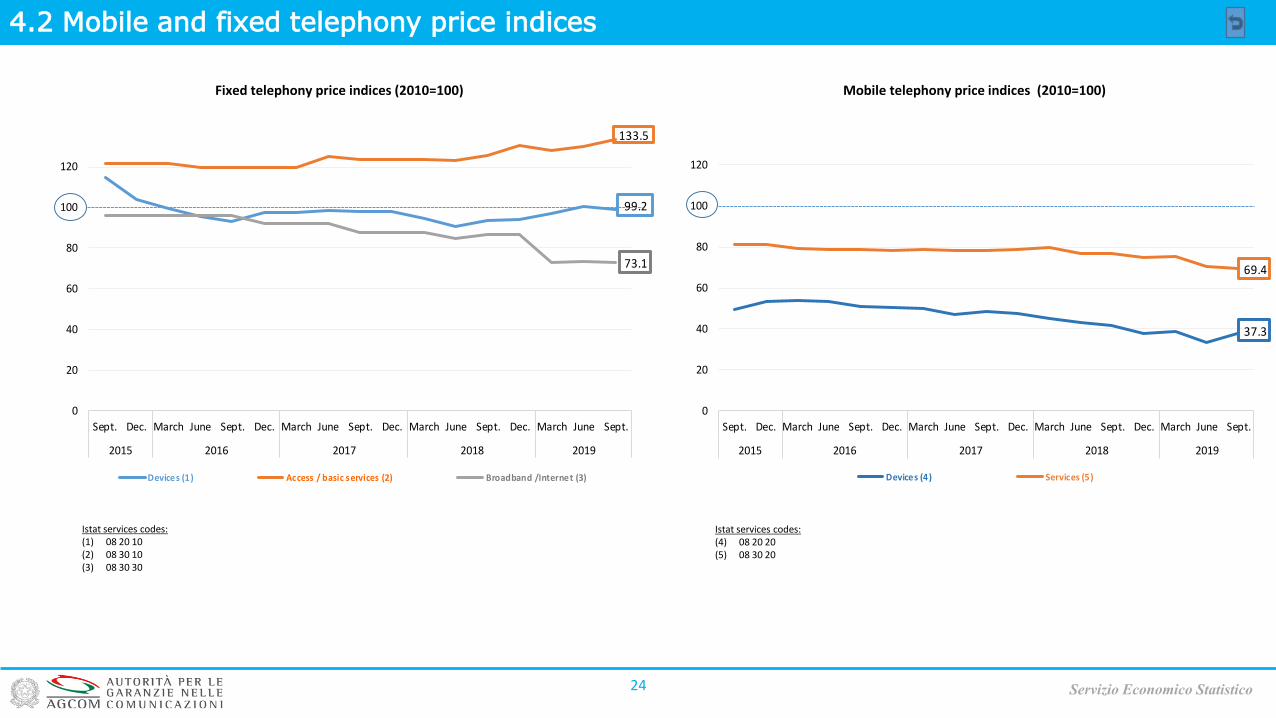
Fixed telephony price indices (2010=100) Mobile telephony price indices (2010=100)
4.2 Mobile and fixed telephony price indices
24 Servizio Economico Statistico
Istat services codes:(1) 08 20 10 (2) 08 30 10(3) 08 30 30
Istat services codes:(4) 08 20 20 (5) 08 30 20
99.2
133.5
73.1
0
20
40
60
80
100
120
Sept. Dec. March June Sept. Dec. March June Sept. Dec. March June Sept. Dec. March June Sept.
2015 2016 2017 2018 2019
Devices (1) Access / basic services (2) Broadband /Internet (3)
37.3
69.4
0
20
40
60
80
100
120
Sept. Dec. March June Sept. Dec. March June Sept. Dec. March June Sept. Dec. March June Sept.
2015 2016 2017 2018 2019
Devices (4) Services (5)
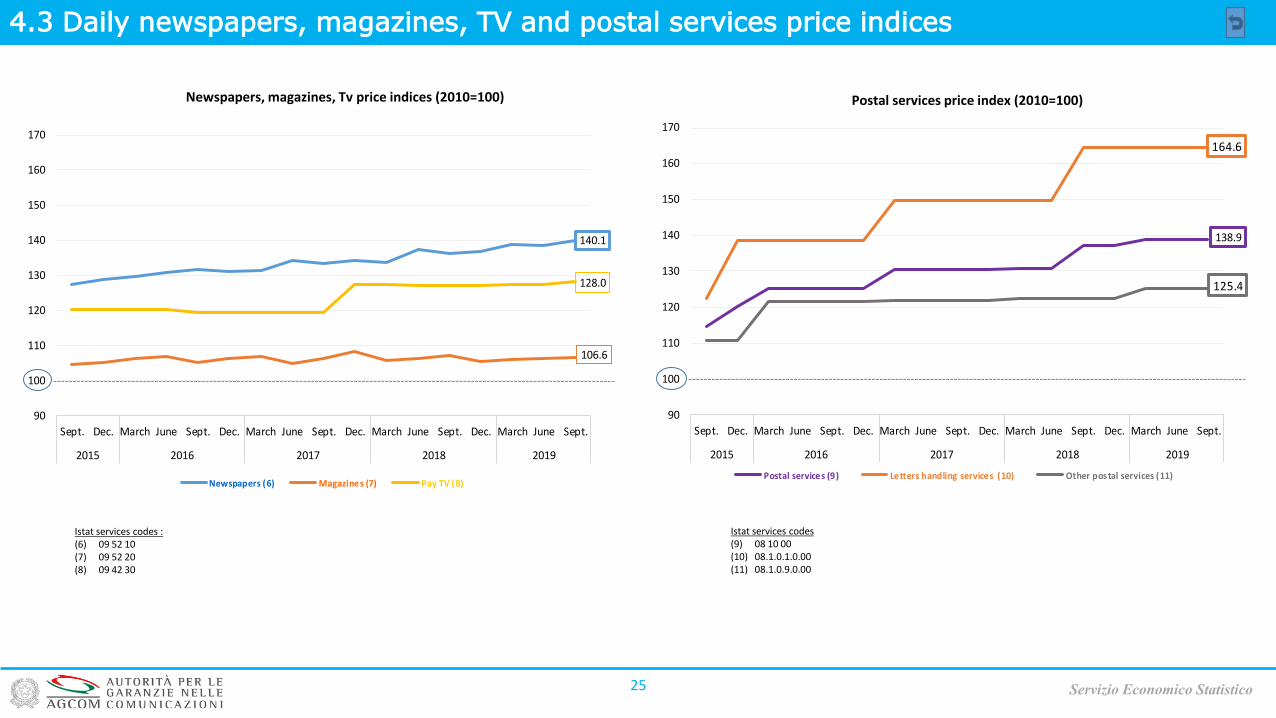
4.3 Daily newspapers, magazines, TV and postal services price indices
25
Newspapers, magazines, Tv price indices (2010=100) Postal services price index (2010=100)
Servizio Economico Statistico
Istat services codes :(6) 09 52 10 (7) 09 52 20(8) 09 42 30
Istat services codes(9) 08 10 00(10) 08.1.0.1.0.00(11) 08.1.0.9.0.00
140.1
106.6
128.0
90
100
110
120
130
140
150
160
170
Sept. Dec. March June Sept. Dec. March June Sept. Dec. March June Sept. Dec. March June Sept.
2015 2016 2017 2018 2019
Newspapers (6) Magazines (7) Pay TV (8)
138.9
164.6
125.4
90
100
110
120
130
140
150
160
170
Sept. Dec. March June Sept. Dec. March June Sept. Dec. March June Sept. Dec. March June Sept.
2015 2016 2017 2018 2019
Postal services (9) Letters handling services (10) Other postal services (11)
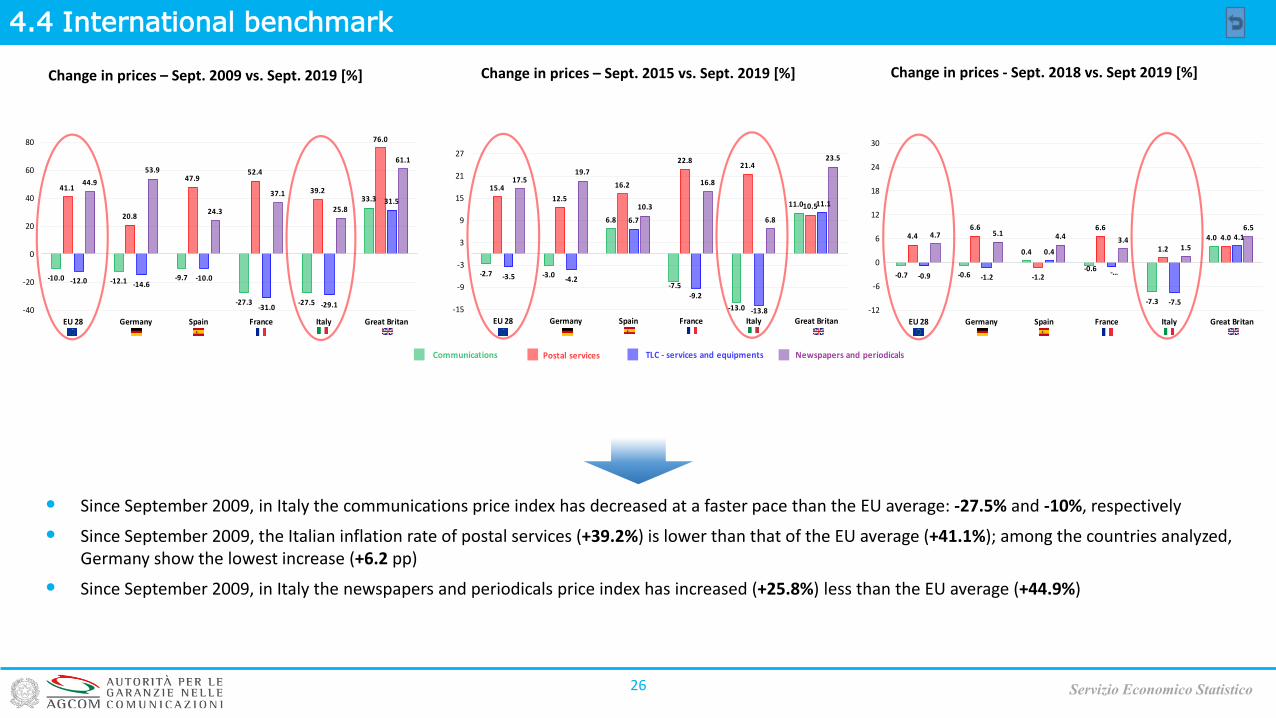
4.4 International benchmark
26 Servizio Economico Statistico
Change in prices – Sept. 2009 vs. Sept. 2019 [%] Change in prices - Sept. 2018 vs. Sept 2019 [%]
• Since September 2009, in Italy the communications price index has decreased at a faster pace than the EU average: -27.5% and -10%, respectively
• Since September 2009, the Italian inflation rate of postal services (+39.2%) is lower than that of the EU average (+41.1%); among the countries analyzed,Germany show the lowest increase (+6.2 pp)
• Since September 2009, in Italy the newspapers and periodicals price index has increased (+25.8%) less than the EU average (+44.9%)
Change in prices – Sept. 2015 vs. Sept. 2019 [%]
-10.0 -12.1 -9.7
-27.3 -27.5
33.3
41.1
20.8
47.952.4
39.2
76.0
-12.0 -14.6-10.0
-31.0 -29.1
31.5
44.9
53.9
24.3
37.1
25.8
61.1
-40
-20
0
20
40
60
80
EU 28 Germany Spain France Italy Great Britan
-2.7 -3.0
6.8
-7.5
-13.0
11.0
15.4
12.5
16.2
22.821.4
10.5
-3.5 -4.2
6.7
-9.2
-13.8
11.1
17.519.7
10.3
16.8
6.8
23.5
-15
-9
-3
3
9
15
21
27
EU 28 Germany Spain France Italy Great Britan
-0.7 -0.6
0.4
-0.6
-7.3
4.04.46.6
-1.2
6.6
1.2
4.0
-0.9 -1.2
0.4
-…
-7.5
4.14.7 5.1 4.4 3.41.5
6.5
-12
-6
0
6
12
18
24
30
EU 28 Germany Spain France Italy Great Britan

Servizio Economico Statistico
Napoli
Centro Direzionale Isola B5 - 80143
Roma
Via Isonzo 21/b - 00198