Commonwealth of Australia · Appendix A A.l: WAIS-IV Interpretive Worksheet 2 Step 3a. Determine...
41
Copyright Notice: Commonwealth of Australia Copyright Act 1968 Notice for paragraph 135ZXA (a) of the Copyright Act 1968 Warning This material has been reproduced and communicated to you by or on behalf of Charles Sturt University under Part VB of the Copyright Act 1968 (the Act). The material in this communication may be subject to copyright under the Act. Any further reproduction or communication of this material by you may be the subject of copyright protection under the Act. Do not remove this notice. Reading Description: Lichtenberger, E. O., & Kaufman, A. S. (2009). Appendix A : WAIS-IV interpretive worksheet. In Essentials of WAIS-IV assessment (pp. 1-40). Hoboken, NJ : Wiley. Reading Description Disclaimer: (This reference information is provided as a guide only, and may not conform to the required referencing standards for your subject)
Transcript of Commonwealth of Australia · Appendix A A.l: WAIS-IV Interpretive Worksheet 2 Step 3a. Determine...

Copyright Notice:
Commonwealth of Australia
Copyright Act 1968
Notice for paragraph 135ZXA (a) of the Copyright Act 1968
Warning
This material has been reproduced and communicated to you by or on behalf of Charles Sturt University under Part VB of the Copyright Act 1968 (the Act).
The material in this communication may be subject to copyright under the Act. Any further reproduction or communication of this material by you may be the subject of copyright protection under the Act.
Do not remove this notice.
Reading Description:
Lichtenberger, E. O., & Kaufman, A. S. (2009). Appendix A : WAIS-IV interpretive worksheet. In Essentials of WAIS-IV assessment (pp. 1-40). Hoboken, NJ : Wiley.
Reading Description Disclaimer:
(This reference information is provided as a guide only, and may not conform to the required referencing standards for your subject)
Appendix A A.l: WAIS-IV Interpretive Worksheet 1
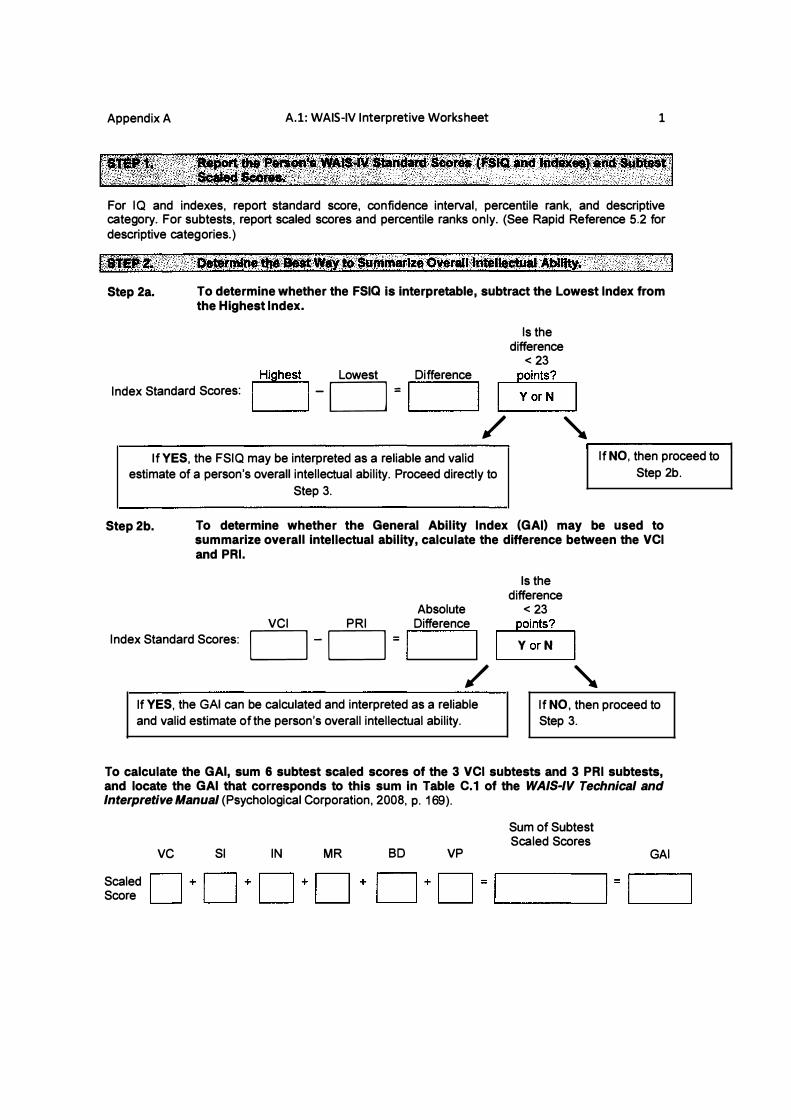
For IQ and indexes, report standard score, confidence interval, percentile rank, and descriptive category. For subtests, report scaled scores and percentile ranks only. (See Rapid Reference 5.2 for descriptive categories.)
Step 2a. To determine whether the FSIQ is interpretable, subtract the Lowest Index from the Highest Index.
Is the difference
< 23 � Lowest Difference � Index Standard Scores: L__j - D = I I �
/ ' �----------------------------------------------� r----------------� If YES, the FSIQ may be interpreted as a reliable and valid
estimate of a person's overall intellectual ability. Proceed directly to
Step 3.
If NO, then proceed to
Step 2b.
Step 2b. To determine whether the General Ability Index (GAl) may be used to summarize overall intellectual ability, calculate the difference between the VCI and PRI.
Index Standard Scores:
Is the difference
Absolute < 23 VCI PRI Difference points?
D - D = I I ._____I y 0____,r N I / ' �--------------------------------------------�
If YES, the GAl can be calculated and interpreted as a reliable and valid estimate of the person's overall intellectual ability.
If NO, then proceed to Step 3.
To calculate the GAl, sum 6 subtest scaled scores of the 3 VCI subtests and 3 PRI subtests, and locate the GAl that corresponds to this sum in Table C.1 of the WAIS-IV Technical and Interpretive Manual (Psychological Corporation, 2008, p. 169).
Scaled Score
VC SI IN MR BD VP
Sum of Subtest Scaled Scores
GAl

Appendix A A.l: WAIS-IV Interpretive Worksheet 2
Step 3a. Determine whether the GAl and CPI represent unitary abilities or processes.
If you have not already done so in Step 2b, determine whether the GAl represents a unitary ability by calculating the difference between the VCI and PRI. If you completed this calculation in Step 2b, then transfer those results here.
Is the difference
Absolute < 23 VCI PRI Difference l �
Index Slandard Scores: CJ- CJ = I � If YES, the GAl can be calculated and interpreted as a reliable and valid
estimate of the person's overall intellectual ability. Proceed to the next
part of this step to determine whether the CPI can be interpreted.
If NO, the GAI-CPI comparison cannot be
made. Go to Step 4.
Determine whether the CPI represents a unitary ability by calculating the difference between the WMI and the PSI.
Index Standard Scores:
Is the difference
Absolute < 23 WMI PSI Difference 1 �
D-D =I � ,....---------.
If YES, then the CPI can be calculated and interpreted as a reliable and valid estimate of the person's overall ability for proficient information processing, through quick visual speed and good mental control.
If NO, the GAI-CPI comparison
cannot be made. Go to Step 4.
Step 3b. Calculate the GAl and CPI if they represent unitary abilities or processes. If the GAl has been calculated in Step 2b, use the value for Step 3c. Otherwise use the tables below to calculate the GAl and CPl.
To calculate the GAl, sum 6 subtest scaled scores of the 3 VCI subtests and 3 PRI subtests and locate the GAl that corresponds to this sum in Table C.1 of the WAIS-IV Technical and Interpretive Manual (Psychological Corporation, 2008, p. 169).
Scaled Score
Sum of Subtest Scaled Scores
To calculate the CPI, sum 4 subtest scaled scores of the 2 Core WMI subtests and 2 Core PSI subtests and locate the CPI that corresponds to this sum in Appendix A.2 the CD-ROM.

Appendix A
Scaled Score
A.l: WAIS-IV Interpretive Worksheet
Sum of Subtest Scaled Scores
3
Step 3c. Record the size of the difference between the GAl and CPI in the table below. If it is 9 points or more, it should be considered statistically different (at the p < .05 level).
Step 3d. Determine whether the size of the difference between the GAl and CPI is uncommonly large. If it is 19 points or more, it should be considered uncommonly large (occurring less than 10% of the time in the standardization sample).
Is the Is the difference difference
Absolute significant? uncommon? GAl CPI Difference � 9 points � 19 points
Index Standard Scores CJ - CJ = I I l.__v o----lr N I �.--I Y_or N___.
Step 4 is designed to help you determine if use of the Keith Five-Factor model is appropriate or if the Wechsler Four-Index model should be your choice for interpretation. Answering the next three questions will help you select the appropriate model.
Step 4a. Question: Is the person you tested between the ages of 16 and 69?
l vorN I: If no, proceed to Step 5 to interpret data with the Wechsler Four-Index Model. If yes, answer the Step 4b question below.
Step 4b. Question: Did you administer the supplementary subtests, Letter-Number Sequencing, and Figure Weights?
l vorN I: If no, proceed to Step 5 to interpret data with the Wechsler Four-Index Model. If yes, answer the Step 4c question below.
Step 4c. Question: Considering your personal theoretical and clinical foundations, do you choose to interpret the WAIS-IV data with the Keith Five-Factor model?
YorN I: If no, proceed to Step 5 to interpret data with the Wechsler Four-Index model. If yes, continue to Step 6 to interpret the data with the Keith Five-Factor model.
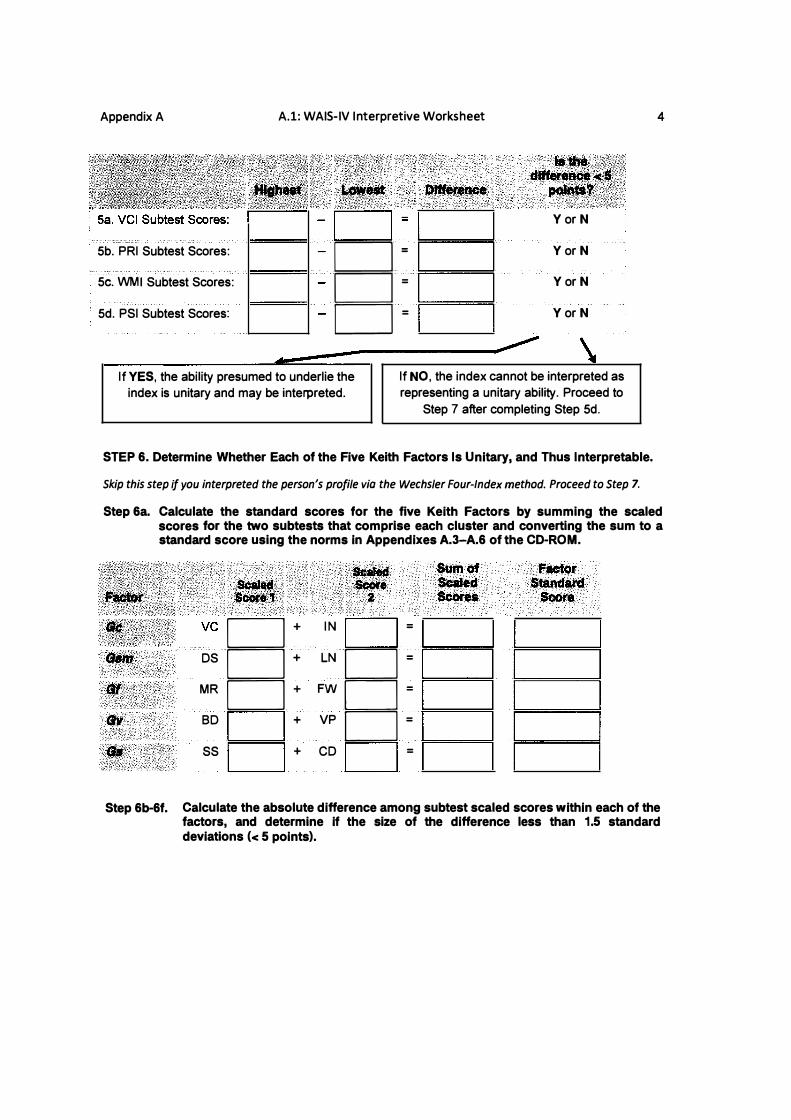
Skip this step if you are interpreting the person's profile via the Keith Five-Factor Approach. Proceed to Step 6. Step 5a-5d. Calculate the difference between the highest and lowest subtest scaled scores
for the VCI, PRI, WMI, and PSI.
Appendix A
5b. PRI Subtest Scores:
Se. WMI Subtest Scores:
5d. PSI Subtest Scores:
A.l: WAIS-IV Interpretive Worksheet
, , , ·., .. . · _, .. ·'.�>' D=
o= o= o=
YorN
YorN
YorN
YorN
If YES, the ability presumed to underlie the index is unitary and may be interpreted.
If NO, the index cannot be interpreted as representing a unitary ability. Proceed to
Step 7 after completing Step 5d.
STEP 6. Determine Whether Each of the Five Keith Factors Is Unitary, and Thus Interpretable.
Skip this step if you interpreted the person's profile via the Wechsler Four-Index method. Proceed to Step 7.
4
Step 6a. Calculate the standard scores for the five Keith Factors by summing the scaled scores for the two subtests that comprise each cluster and converting the sum to a standard score using the norms in Appendixes A.3-A.6 of the CD-ROM.
;t:l,.:,:, D +
DS D +
MR D +
BD D +
ss D +
IN D LN D FWD VP D CD D
= = = = =
Sum of Scaled SCOre&
factor Standard
SCOre
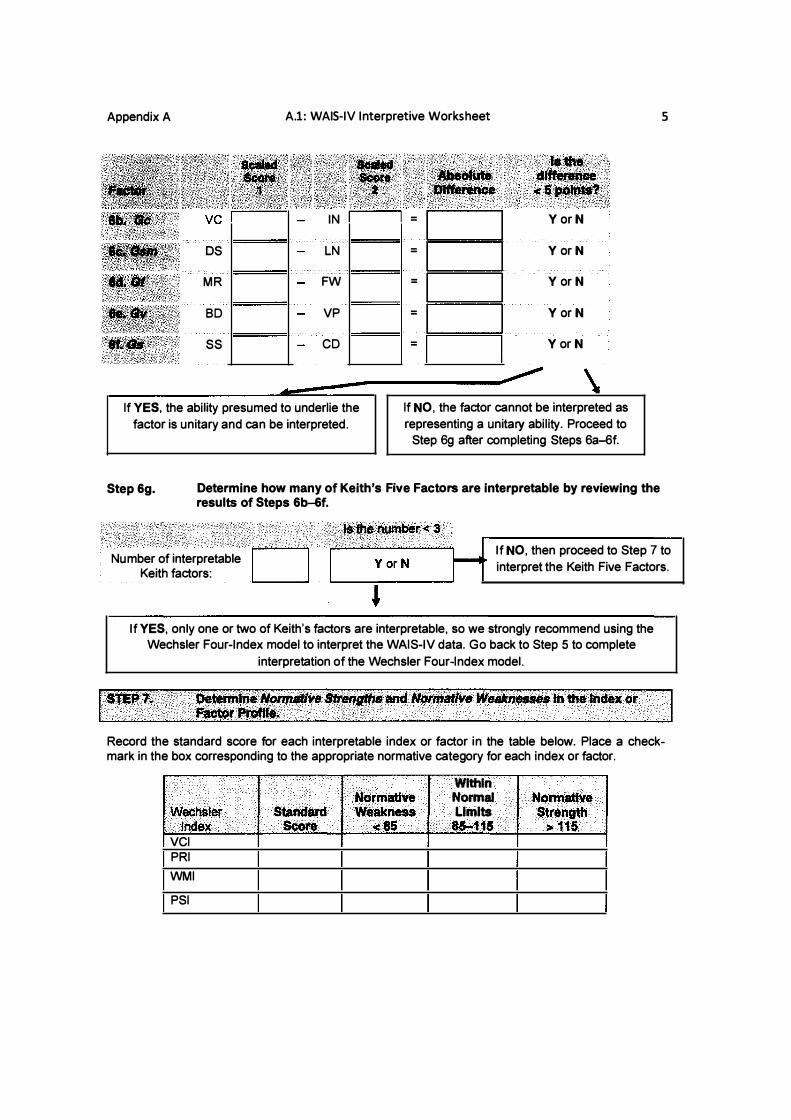
Step 6b-6f. Calculate the absolute difference among subtest scaled scores within each of the factors, and determine if the size of the difference less than 1.5 standard deviations (< 5 points).
Appendix A
os
MR
BD
ss
A.l: WAIS-IV Interpretive Worksheet
'":;•.J�. cn��:��z��i· IN = I 1======1
LN = FW = VP = CD =
Y ar N
Y ar N
Y ar N
Y ar N
Y ar N
If YES, the ability presumed to underlie the factor is unitary and can be interpreted.
If NO, the factor cannot be interpreted as representing a unitary ability. Proceed to
Step 6g after completing Steps 6a-6f.
Step 6g. Determine how many of Keith's Five Factors are interpretable by reviewing the results of Steps 6b-6f.
5
Number of interpretable o·· . . ·
. .
Keith factors:
If NO, then proceed to Step 7 to
interpret the Keith Five Factors.
If YES, only one or two of Keith's factors are interpretable, so we strongly recommend using the Wechsler Four-Index model to interpret the WAIS-IV data. Go back to Step 5 to complete
interpretation of the Wechsler Four-Index model.
Detettnlne Nonnatl.-e .tr...,.s and tl«<ftati've weak��.- in the lnclex: or �tQrProfl,._.
Record the standard score for each interpretable index or factor in the table below. Place a checkmark in the box corresponding to the appropriate normative category for each index or factor.
Within Normative Normal Normative
.Weohsler StalldaJ'd Weakness Limits Strength Index . Scofe <85 85-115 >115
VCI PRI
WMI
PSI

Appendix A
Gsm
Gv
Gf
Gs
A.l: WAIS-IV Interpretive Worksheet
Norm� Sttenl"''
>.115:>.
6
Step Sa. Compute the mean of the person's indexes or factors and round to the nearest tenth of a point. Note that all indexes or factors (interpretable and noninter· pretable) are included in the computation of the mean.
Wecttsler Stanclarct todex Score
VCI
PRI
WMI
PSI
Sum of Indexes
Number of Indexes +4
Mean of Indexes
Step 8b. Fill in the table as follows:
Kelth Factor
Gc
Gsm
Gv
Gf
Gs
Sum of Factors
Number of Factors
Mean of Factors
Standard Score
+5
• Record the interpretable index or factor standard score in column (2). • Record the rounded mean of all indexes or factors in column (3) (from Step Sa or 6a). • Record the difference Score (i.e., Standard Score minus Mean) in column (4). • Record the critical value needed for the difference score to be considered significant in column (5). (See below for p < .05 values, and see Tables 5.4 and 5.5 for p < .01 level of significance.) • If the difference score equals or exceeds the critical value, record "PS" for a positive (+} difference score or "PW' for a negative (-) difference score.

Appendix A A.l: WAIS-IV Interpretive Worksheet 7
Step Se. Determine whether the personal strength/weakness is uncommon (base rate < 10%) in the general population. If the difference score is� 15 points, it is uncommon.
• Record "Uncommon {or U)" in column {7) for difference scores that are� 15 points.
Gc Gsm Gv Gf Gs
VCI
6.5
5.6
5.7
5.5
5.6
5.6
5.1
5.0
5.0
5.1
5.5
5.1
4.6
· biffetence Score ·
.J4>
Cr.iticel Value
Needed fOr Sftl'rificanCe (5}
Strength or
Personal Weakness (PSorPW)
Personal $trefttth or Pensonal
WUimess ·(PSorPW)
($)
. . Uncommon (tJ)orNot.
Uncommon (NU} m
Critical Value Needed for Significance for Ages 16-90
(p <.OS level of significance)
Wechsler Indexes Kelth Factors
PRI WMI PSI Gc Gf Gv Gsm Gs 6.1 6.8 8.3 6.2 7.0 7.0 6.6 8.7
6.3 6.3 7.6 6.0 6.8 6.8 6.4 7.8
6.4 7.0 7.6 5.6 7.2 7.2 6.8 7.9
5.5 5.8 7.5 5.9 6.3 6.3 5.9 7.8
5.6 6.0 8.4 5.9 5.9 6.4 5.5 8.8
6.0 6.0 8.4 5.6 6.8 6.8 6.4 8.8
5.5 5.9 8.3 5.0 6.4 5.9 5.9 8.8
5.8 6.2 7.2 4.9 6.7 6.7 6.3 7.4
5.8 6.2 7.2 4.9 6.3 6.3 6.3 7.4
5.9 6.6 7.2
6.2 5.8 6.9
6.9 6.3 6.9
6.6 6.6 6.9

Appendix A
Step Sd.
A.l: WAIS-IV Interpretive Worksheet
Determine whether any of the interpretable Wechsler indexes or Keith factors are Key Assets or High-Priority Concerns.
8
Review your findings from Steps 7, 8b, and Se. For each relevant index or factor, place a checkmark in the column that accurately describes the findings for that index or factor. Indexes or factors that represent an uncommon, normative, and personal strength should be identified as a "Key Asset." Indexes that represent an uncommon, normative, and personal weakness should be identified as a "High-Priority Concern."
-� fil'n ��� < c(�::�b} ..... (�wei,; u;;r:cr VCI
PRI
WMI
PSI
Gc Gsm Gv Gf Gs Notes: NS = Normative Strength; NW= Normative Weakness; PS = Personal Strength; PW = Personal Weakness.
Review Rapid Reference 5.1 0 for a description of all the terms that are used to classify Indexes or Factors. See Rapid Reference 5.11 for examples of how to describe indexes or factors that are classified as strengths. Rapid Reference 5.12 gives examples of how to describe indexes or factors that are classified as weaknesses. Basic definitions of CHC Broad and Narrow Abilities are also summarized in Appendix A.7 on the CD-ROM. An overview of neuropsychological theory and CHC theory related to the interpretation of the Keith Five-Factor model is presented in Rapid Reference 5.7. The information in Rapid Reference 5.7 can also provide a useful outline for neuropsychologically based and CHC-based interpretation of the Wechsler Four-Index model.
There are §. possible clinical comparisons. Either conduct all comparisons or select those that are most appropriate for a given individual based on the referral questions and assessment results.
Step 10a.
• • • • •
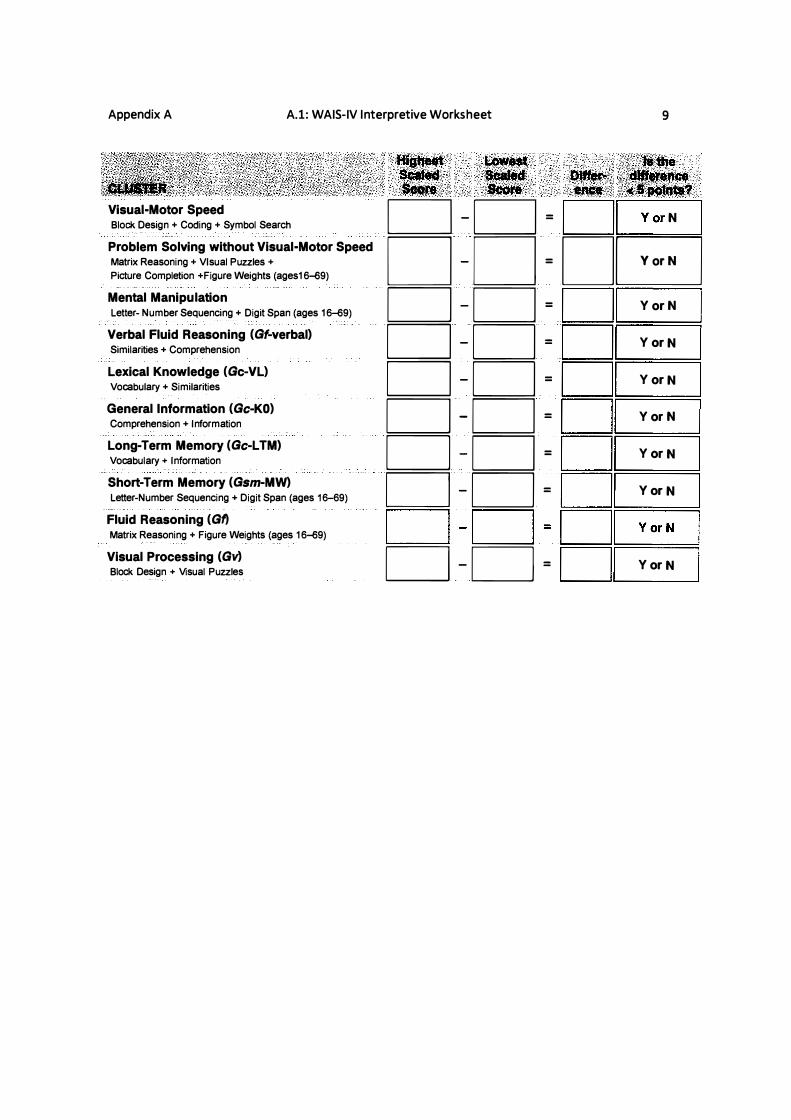
Determine whether each Clinical Cluster is unitary.
Using the tables that follow, record the scaled scores for each relevant subtest. Subtract the lowest from the highest scaled score to compute the difference . If the difference equals or exceeds 5 points, the Clinical Cluster is not unitary and cannot be used to conduct clinical comparisons. If the difference is less than 5 points, the Clinical Cluster is unitary . Clinical comparisons may be made only if both clusters comprising the comparison have been determined to be unitary.
Appendix A A.l: WAIS-IV Interpretive Worksheet 9
Visual-Motor Speed Block Design + Coding + Symbol Search
Problem Solving without Visual-Motor Speed Matrix Reasoning+ VIsual Puzzles+
Picture Completion +Figure Weights (ages1 6-69)
Mental Manipulation Letter- Number Sequencing +Digit Span (ages 1 6-69)
Verbal Fluid Reasoning (Gf-verbal) Similarities+ Comprehension
Lexical Knowledge (Gc-VL) Vocabulary + Similarities
General Information (Gc-KO) Comprehension+ Information
Long-Term Memory (Gc-LTM) Vocabulary+ Information
Short-Term Memory (Gsm-MW) Letter-Number Sequencing +Digit Span (ages 1 6-69)
Fluid Reasoning (Gf) Matrix Reasoning+ Figure Weights (ages 1 6-69)
Visual Processing (Gv) Block Design + Visual Puzzles
�" i�:'ifitJl!le ; ". ': �-1f"; t,
CJ -CJ = Dlr---vo_____,r N I D-D=DB CJ -CJ = Dl Yor N I CJ -CJ = Dl Yor N I CJ -CJ = Dl Yor N I CJ-CJ = Dl Yor N I CJ -CJ = Dl Yor N I CJ -CJ = Dl Yor N I CJ-CJ=DI Yor N I CJ -CJ = Dl Yor N I

Appendix A A.l: WAIS-IV Interpretive Worksheet 10
Step 10b. For unitary clusters only, calculate the Clinical Cluster by following the steps below.
DS
MR
VC
AR
ss VP
IN
CD
LN
FW
CO
CA
PC m
• Sum the scaled scores in each column for the subtests that comprise the Clinical Cluster. • Convert the sum of scaled scores to a Clinical Cluster standard score using Appendixes A 9-A.17. • Record the cluster's percentile Rank and Confidence Interval (also available in Appendixes A.9-A.17).
,>; • .
c=Jc=Jc=JDDDDDDD .. c=Jc=Jc=JDDDDDDD
Appendix A
Step 10c.
• • • •
Visual-Motor Speed
A.1: WAIS-IV Interpretive Worksheet 11
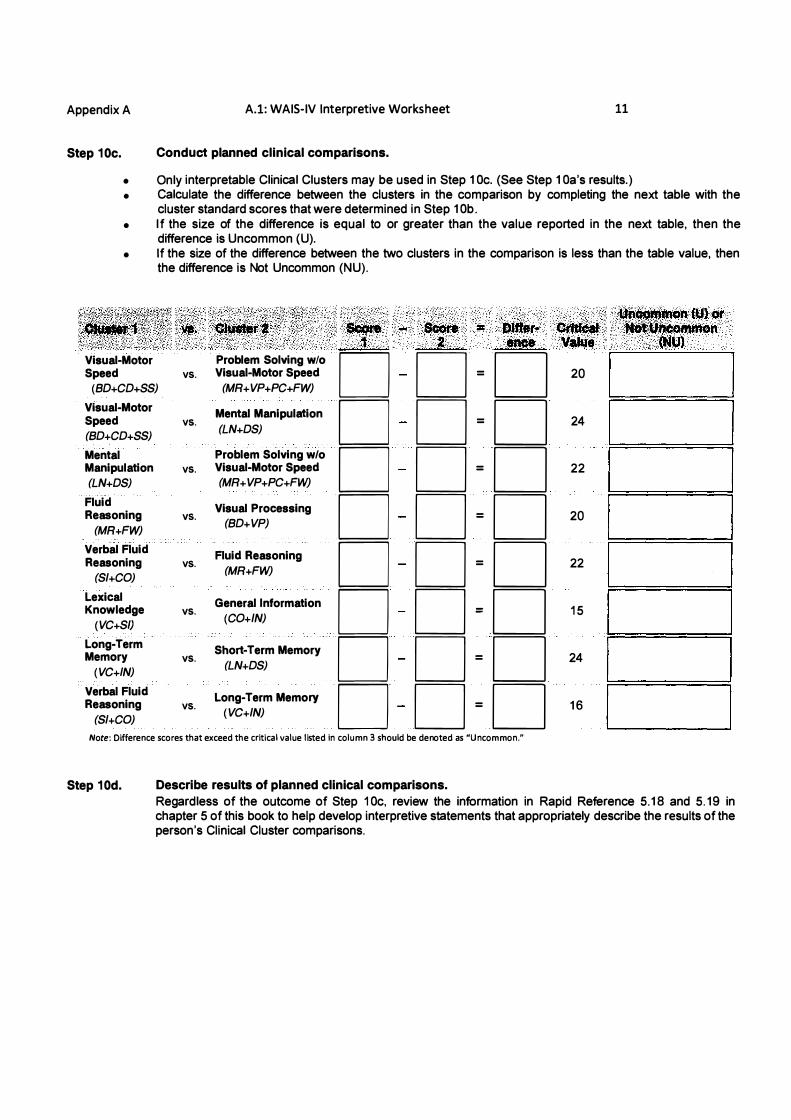
Conduct planned clinical comparisons.
Only interpretable Clinical Clusters may be used in Step 1 Oc. (See Step 1 Oa's results.) Calculate the difference between the clusters in the comparison by completing the next table with the cluster standard scores that were determined in Step 1 Ob. If the size of the difference is equal to or greater than the value reported in the next table, then the difference is Uncommon {U). If the size of the difference between the two clusters in the comparison is less than the table value, then the difference is Not Uncommon (NU).
,_,(£,' c ;:�< < ..:,��:· '��·� .. ·� • Oltler.; c� .I .ence v• .····.· · · ···'.JtU)
Problem Solving w/o
vs. Visual-Motor Speed = 20 (BD+CD+SS) (MR+VP+PC+FW) D D D I I
Visual-Motor Mental Manipulation D D D I I Speed vs. = 24
(BD+CD+SS) (LN+DS)
Mental Problem Solving w/o
D D D I I Manipulation vs. Visual-Motor Speed = 2 2 (LN+DS) (MR+VP+PC+FW)
Fluid Visual Processing D D D I I Reasoning vs. = 20
(MR+FW) (BD+VP)
Verbal Fluid Fluid Reasoning D D D I I Reasoning vs. = 22
(SI+CO) (MR+FW)
Lexical General Information D D D I I Knowledge vs. = 15
(VC+S/) (CO+ IN)
Long-Term Short-Term Memory D D D I I Memory vs. = 24
(VC+IN) (LN+DS)
Verbal Fluid Long-Term Memory D D D I I Reasoning vs. = 16
(SI+CO) (VC+IN)
Note: Difference scores that exceed the critical value listed in column 3 should be denoted as "Uncommon."
Step 10d. Describe results of planned clinical comparisons. Regardless of the outcome of Step 1 Oc, review the information in Rapid Reference 5.18 and 5. 19 in chapter 5 of this book to help develop interpretive statements that appropriately describe the results of the person's Clinical Cluster comparisons.
Appendix A A.2: CPI Equivalents of Sums of Scaled Scores 12
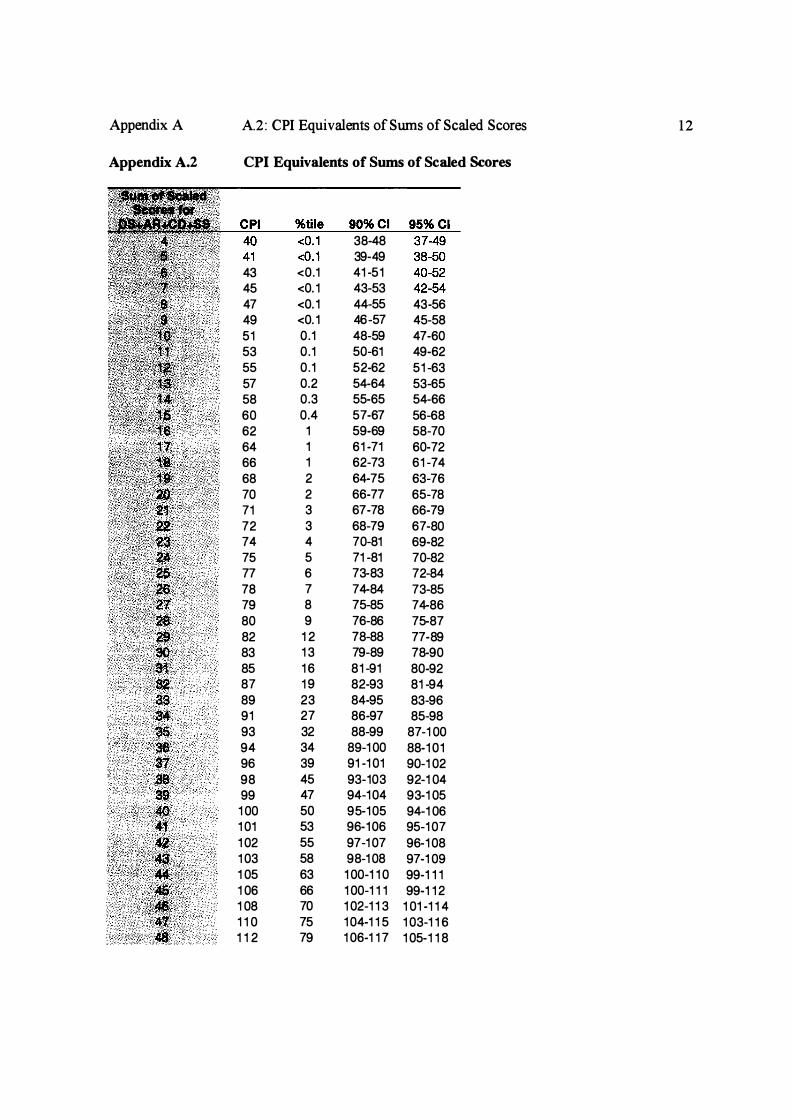
Appendix A.2 CPI Equivalents of Sums of Scaled Scores
38-48 39-49
43 <0.1 41 -51 45 <0.1 43-53 47 <0.1 44-55 43-56 49 <0.1 48-57 45-58 51 0.1 48-59 47-60 53 0.1 50-61 49-62 55 0.1 52-62 51 -63 57 0.2 54-64 53-65 58 0.3 55-65 54-66 60 0.4 57-67 56-68 62 1 59-69 58-70 64 1 61 -71 60-72 66 1 62-73 61 -74 68 2 64-75 63-76 70 2 66-77 65-78 71 3 67-78 66-79 72 3 68-79 67-80 74 4 70-81 69-82 75 5 71 -81 70-82 77 6 73-83 72-84 78 7 74-84 73-85 79 8 75-85 74-86 80 9 76-86 75-87 82 1 2 78-88 77-89 83 1 3 79-89 78-90 85 1 6 81 -91 80-92 87 1 9 82-93 81 -94 89 23 84-95 83-96 91 27 86-97 85-98 93 32 88-99 87-1 00 94 34 89-1 00 88-1 01 96 39 91 -1 01 90-1 02 98 45 93-103 92-1 04 99 47 94-1 04 93-1 05
1 00 50 95-1 05 94-1 06 1 01 53 96-1 06 95-1 07 1 02 55 97-1 07 96-1 08 1 03 58 98-1 08 97-1 09 1 05 63 1 00-1 1 0 99-1 1 1 1 06 66 1 00-1 1 1 99-1 1 2 1 08 70 1 02-1 1 3 1 01 -1 1 4 1 1 0 75 1 04-1 1 5 1 03-1 1 6 1 1 2 79 1 06-1 1 7 1 05-1 1 8

Appendix A A.2: CPI Equivalents of Swns of Scaled Scores 1 3
1 1 4 82 1 08-1 1 9 1 07-1 20 1 1 6 86 1 1 0-1 20 1 09-1 21 1 1 8 88 1 1 2-1 22 1 1 1 -1 23 1 20 91 1 1 4-1 24 1 1 3-1 25 1 21 92 1 1 5-1 25 1 1 4-1 26 1 23 94 1 1 7-127 1 1 6-1 28 1 25 95 1 1 9-129 1 1 8-1 30 1 26 96 1 1 9-1 30 1 1 8-1 31 1 28 97 1 21 -1 32 1 20-1 33 1 29 97 1 22-1 33 1 21 -1 34 1 31 98 1 24-1 35 1 23-1 36 1 33 99 1 26-1 37 1 25-1 38 1 35 99 1 28-1 38 1 27-1 39 1 37 99 1 30-1 40 1 29-1 41 1 39 99.5 1 32-1 42 1 31 -1 43 1 41 99. 7 1 34-1 44 1 33-1 45 1 43 99.8 1 36-1 46 1 35-1 47 1 46 99.9 1 38-1 49 1 37-1 50 1 48 99.9 1 40-1 51 1 39-1 52 1 50 >99.9 1 42-1 53 1 41 -1 54 1 52 >99.9 1 44-1 55 1 43-1 56 1 55 >99.9 1 47-1 57 1 46-1 58 1 57 >99.9 1 49-1 59 1 48-1 60 1 60 >99. 9 1 52-1 62 1 51 -1 63 1 60 >99.9 1 52-1 62 1 51 -1 63 1 60 >99.9 1 52-1 62 1 51 -1 63 1 60 >99.9 1 52-1 62 1 51 -1 63 1 60 >99.9 1 52-1 62 1 51 -1 63
Source: Standardization data and analysis results from the Wechsler Adult Intelligence Scale-Fourth Edition (W AIS-IV). Copyright © 2008 by NCS Pearson, Inc. Used with permission. All rights reserved.
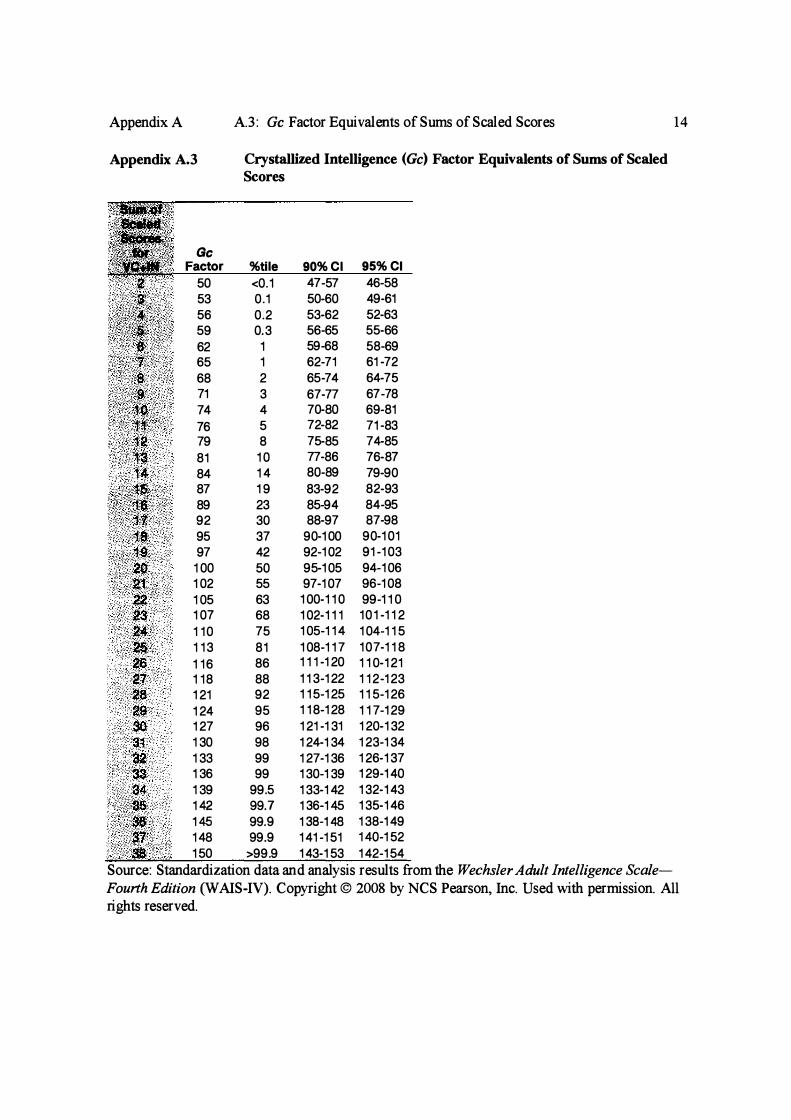
Appendix A A.3: Gc Factor Equivalents of Sums of Scaled Scores
Appendix A.3 Crystallized Intelligence (Gc) Factor Equivalents of Sums of Scaled Scores
Gc Factor %tile 90% Cl
50 <0. 1 47-57 53 0.1 50-60 56 0.2 53-62 59 0.3 56-65
62 1 59-68 65 1 62-71 68 2 65-74 71 3 67-77 74 4 70-80
76 5 72-82
79 8 75-85
81 1 0 77-86
84 1 4 80-89
87 1 9 83-92 89 23 85-94 92 30 88-97 95 37 90-1 00 97 42 92-1 02
1 00 50 95-1 05 1 02 55 97-1 07 1 05 63 1 00-1 1 0 1 07 68 1 02-1 1 1 1 1 0 75 1 05-1 1 4 1 1 3 81 1 08-1 1 7
1 1 6 86 1 1 1 -1 20
1 1 8 88 1 1 3-1 22 1 21 92 1 1 5-1 25
1 24 95 1 1 8-1 28 1 27 96 1 21 -1 31
.i �l... 1 30 98 1 24-1 34 .. :u 1 33 99 1 27-1 36
;33: 1 36 99 1 30-1 39 ' �' 34 1 39 99.5 1 33-1 42 ',�;�"�,> �: :::� ��:��: . . !7' 1 48 99.9 1 41 -1 51 � ' ' '
95% CI 46-58 49-61 52-63 55-66 58-69 61 -72 64-75 67-78 69-81 71 -83 74-85 76-87 79-90 82-93 84-95 87-98 90-1 01 91 -1 03 94-1 06 96-1 08 99-1 1 0
1 0 1 -1 1 2 1 04-1 1 5 1 0 7-1 1 8 1 1 0-1 21 1 1 2-1 23 1 1 5-1 26 1 1 7-1 29 1 20-1 32 1 23-1 34 1 26-1 37 1 29-1 40 1 32-1 43 1 35-1 46 1 38-1 49 1 40-1 52
: SL ""' 1 50 >99.9 1 43-1 53 1 42-1 54
14
Source: Standardization data and analysis results from the Wechsler Adult Intelligence Scale
Fourth Edition (W AIS-IV). Copyright © 2008 by NCS Pearson, Inc. Used with permission. All rights reserved.
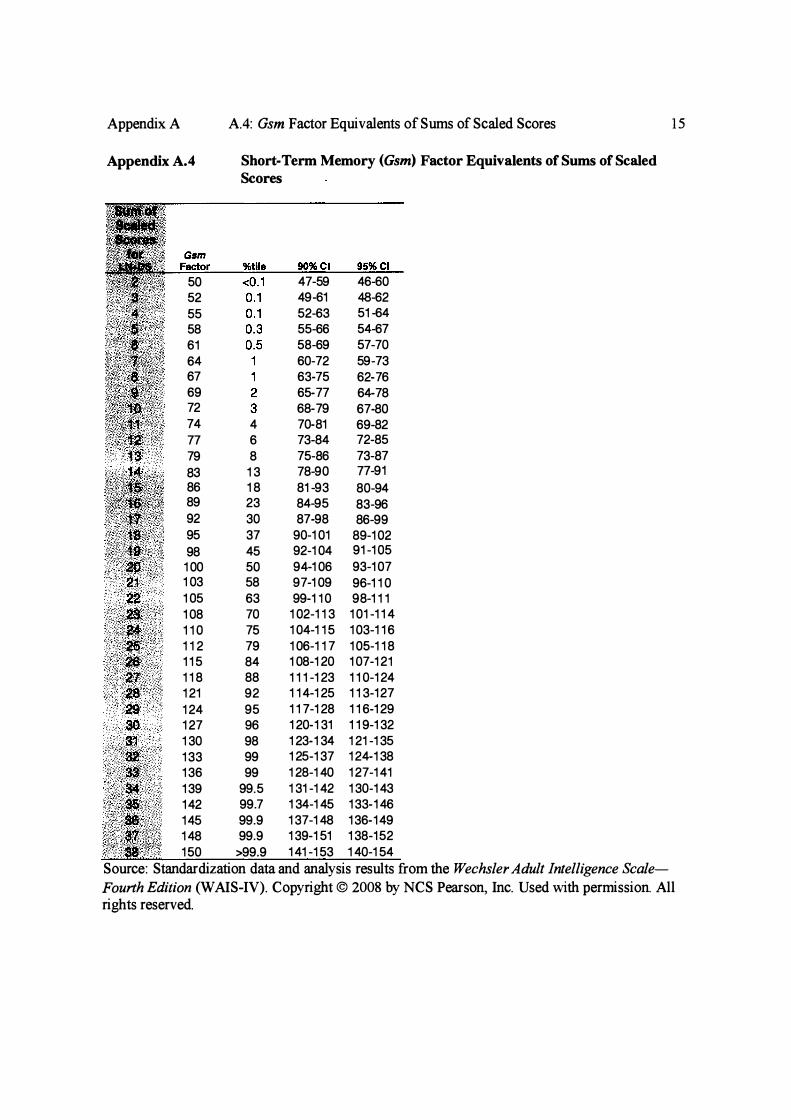
Appendix A A.4: Gsm Factor Equivalents of Sums of Scaled Scores
Appendix A.4 Short-Term Memory (Gsm) Factor Equivalents of Sums of Scaled Scores
50 47-59 46-60 52 49-61 48-62
55 52-63 51 -64 58 55-66 54-67 61 58-69 57-70
64 60-72 59-73 67 63-75 62-76 69 65-77 64-78 72 68-79 67-80 74 4 70-81 69-82 77 6 73-84 72-85 79 8 75-86 73-87
83 1 3 78-90 77-91
86 1 8 81 -93 80-94 89 23 84-95 83-96 92 30 87-98 86-99 95 37 90-1 01 89-1 02 98 45 92-1 04 91 -1 05
1 00 50 94-1 06 93-1 07 1 03 58 97-1 09 96-1 1 0 1 05 63 99-1 1 0 98-1 1 1 1 08 70 1 02-1 1 3 1 01 -1 1 4 1 1 0 75 1 04-1 1 5 1 03-1 1 6 1 1 2 79 1 06-1 1 7 1 05-1 1 8 1 1 5 84 1 08-1 20 1 07-1 21 1 1 8 88 1 1 1 -1 23 1 1 0-1 24 1 21 92 1 1 4-1 25 1 1 3-1 27
1 24 95 1 1 7-1 28 1 1 6-1 29 1 27 96 1 20-1 31 1 1 9-1 32 1 30 98 1 23-1 34 1 21 -1 35 1 33 99 1 25-1 37 1 24-1 38 1 36 99 1 28-1 40 1 27-1 41 1 39 99.5 1 31 -1 42 1 30-1 43 1 42 99.7 1 34-1 45 1 33-1 46 1 45 99.9 1 37-1 48 1 36-1 49 1 48 99.9 1 39-1 51 1 38-1 52 1 50 >99.9 1 41 -1 53 1 40-1 54
15
Source: Standardization data and analysis results from the Wechsler Adult Intelligence Scale
Fourth Edition (W AIS-IV). Copyright © 2008 by NCS Pearson, Inc. Used with permission. All rights reserved.

Appendix. A
Appendix A.5
50 52 55 58 61 64 67 69 72 75 78 81 84 87 89 92 94 97
1 00 1 02 1 05 1 07 1 1 0 1 1 3 1 1 6 1 1 9 1 22 1 25 1 28 1 31 1 34 1 37 1 40 1 43 1 46 1 49 1 50
A.5: GfFactor Equivalents of Sums of Scaled Scores
Fluid Reasoning Intelligence (G./) Factor Equivalents of Sums of Scaled Scores
1 1 2 3 5 7
1 0 1 4 1 9 23 30 34 42 50 55 63 68 75 81 86 90 93 95 97 98 99 99
99.6 99.8 99.9 99.9
>99.9
47-60 49-61 52-64 55-67 58-70 60-73 63-75 65-77 68-80 71 -83 73-86 76-88 79-91 82-94 84-96 86-99
88-1 00 91 -1 03 94-1 06 96-1 08 99-1 1 1
1 00-1 1 3 1 03-1 1 5 1 06-1 1 8 1 09-1 21 1 1 2-1 24 1 1 4-1 27 1 1 7-1 29 1 20-1 32 1 23-1 35 1 26-1 38 1 28-1 40 1 31 -1 43 1 34-146 1 37-1 49 1 39-1 52 1 40-1 53
46-61 48-63 51 -65 54-68 56-71 59-74 62-77 64-78 67-81 70-84 72-87 75-90 78-92 81 -95 83-97
85-1 00 87-1 02 90-1 04 93-1 07 95-1 09 97-1 1 2 99-1 1 4
1 02-1 1 7 1 05-1 1 9 1 08-1 22 1 1 0-1 25 1 1 3-1 28 1 1 6-1 30 1 1 9-1 33 1 22-1 36 1 24-1 39 1 2 7-1 42 1 30-1 44 1 33-1 47 1 36-1 50 1 38-1 53 1 39-1 54
Source: Standardization data and analysis results from the Wechsler Adult Intelligence ScaleFourth Edition (W AIS-IV). Copyright © 2008 by NCS Pearson, Inc. Used with permission. All rights reserved.
16

Appendix A
Appendix A.6
Gv Factor
50 52 55 58 61 64 67 70 73 75 78 81 84 87 90 92 95 97
1 00 1 02 1 05 1 07 1 1 0 1 1 3 1 1 6 1 1 9 1 22 1 25 1 28 1 31 1 34 1 37 1 40 1 43 1 46 1 49 1 50
A.6: Gv Factor Equivalents of Sums of Scaled Scores
Visual Processing (Gv) Factor Equivalents of Sums of Scaled Scores
%tile
<0.1 0 . 1 0 . 1 0.3 0.5 1 1 2 4 5 7
1 0 1 4 1 9 25 30 37 42 50 55 63 68 75 81 86 90 93 95 97 98 99 99
99.6 99.8 99.9 99.9
>99.9
90%CI
47-60 49-61 52-64 55-67 58-70 60-73 63-75 66-78 69-81 71 -83 73-86 76-88 79-91 82-94 85-97 86-99
89-1 01 91 -1 03 94-1 06 96-1 08 99-1 1 1
1 00-1 1 3 1 03-1 1 5 1 06-1 1 8 1 09-1 21 1 1 2-1 24 1 1 4-1 27 1 1 7-1 29 1 20-1 32 1 23-1 35 1 26-1 38 1 28-1 40 1 31 -1 43 1 34-1 46 1 37-1 49 1 39-1 52 1 40-1 53
95%CI
46-61 48-63 51 -65 54-68 56-71 59-74 62-77 65-79 68-82 70-84 72-87 75-90 78-92 81 -95 83-98
85-1 00 88-1 03 90-1 04 93-1 07 95-1 09 97-1 1 2 99-1 1 4
1 02-1 1 7 1 05-1 1 9 1 08-1 22 1 1 0-1 25 1 1 3-1 28 1 1 6-1 30 1 1 9-1 33 1 22-1 36 1 24-1 39 1 27-1 42 1 30-1 44 1 33-1 47 1 36-1 50 1 38-1 53 1 39-1 54
Source: Standardization data and analysis results from the Wechsler Adult Intelligence Scale
Fourth Edition (W AIS-IV). Copyright © 2008 by NCS Pearson, Inc. Used with permission. All rights reserved.
17

Appendix A Definitions of CHC Abilities and Processes
CHC THEORY AND THE STRUCTURE OF
COGNITIVE ABILITIES AND PROCESSES
In this section, the definitions of the broad and some of the narrow abilities in
cluded in CHC theory are presented. These definitions are consistent with those
presented in Flanagan, Ortiz, and Alfonso (2007). Given the number of narrow abilities and processes comprising the theory (more than 70), it is not practical to
include definitions of all of them in this text. Practitioners are referred to Carroll (1993), Flanagan, and colleagues (2007), and McGrew (2005) for definitions of
all CHC narrow abilities and processes.
Fluid Intelligence (Gf)
Fluid lntell(r,mce ( G]J refers to mental operations that an individual uses when faced
with a relatively novel task that cannot be performed automatically. These mental
operations may include forming and recognizing concepts, perceiving relation
ships among patterns, drawing inferences, comprehending implications, problem
solving, extrapolating, and reorganizing or transforming information. Inductive
and deductive reasoning are generally considered to be the hallmark narrow-ability
indicators of Cj The W ISC-IV provides three distinct reasoning tests: Picture
Concepts and Word Reasoning (which involve the use of inductive reasoning)
and Matrix Reasoning (which involves the use of general sequential reasoning,
i.e., deductive reasoning). Select GJnarrow abilities are defined in Table A.1.
Crystallized Intelligence (Gc)
C�J'Stallized Intelligence (Cc) refers to the breadth and depth of a person's acquired
knowledge of a culture and the effective application of this knowledge. This
store of primarily verbal or language-based knowledge represents those abilities that have been developed largely through the inustment of other abilities during educational and general life experiences (Horn & Blankson, 2005).
AI

c= ___________ 2 __ AP_P_E _N _D _IX_A __________________________________ � Table A. I Description of Select GfNarrow Ability Definitions
Narrow stratum I name (code)
General Sequential Reasoning (RG)
Induction (I)
Quantitative Reasoning (RQ)
Definition
Ability to start with stated rules, premises, or conditions, and to engage in one or more steps to reach a solution to a novel problem.
Ability to discover the underlying characteristic (e.g., rule, concept, process, trend, class membership) that governs a problem or a set of materials.
Ability to inductively and deductively reason with concepts involving mathematical relations and properties.
Note: Narrow ability definitions were adapted from McGrew (1997) with permission from
Guilford. All rights reserved. Two letter factor codes (e.g., RG) are from Carroll (1993a).
Gc includes both declarative (static) and procedural (dy namic) knowledge.
Declarative knowledge is held in long-term memory (Gir) and is activated when
related information is in working memory (Gsm). Declarative knowledge includes factual information, comprehension, concepts, rules, and relationships,
especially when the information is verbal in nature. Procedural knowledge refers to
the process of reasoning with previously learned procedures in order to trans
form knowledge. For example, a child's knowledge of his or her street address
would reflect declarative knowledge, while a child's ability to find his or her way
home from school would require procedural knowledge. Declarative knowledge refers to knowledge "that something is the case, whereas procedural knowledge
is knowledge of how to do something" (Gagne, 1985, p. 48). The WISC-IV
measures many different aspects of Gc. For example, the WISC-IV Verbal Comprehension Index (VCI), which is composed of Vocabulary, Similarities, and Comprehension, provides an assessment of several G'c narrow abilities, includ
ing Lexical Knowledge (VL), Language Development (LD), and General Infor
mation (KO). The WISC-IV Information (KO), Word Reasoning (VL), Picture
Concepts (KO), and Picture Completion (KO) subtests also involve the use of
specific G'c narrow abilities. The breadth of G'c is apparent from the number of
narrow abilities (i.e., 11) that it subsumes. Select Gc narrow abilities are defined in Table A.2.
A rather unique aspect of Gcnot seen in the other broad abilities is that it appears
to be both a store of acquired knowledge (e.g., lexical knowledge) as well as a col
lection of processing abilities (e.g., oral production and fluency). Although G'c is
probably most often conceptualized much like Gq and GnJ! as an ability that is highly

�-----------------------------------A-PP_E_N_D_IX __ A __ 3-----------�
Table A.2 Description of Select Gc Narrow Ability Definitions
Narrow stratum I name (code)
Language Development (LD)
Lexical Knowledge (VL)
Listening Ability (LS)
General (verbal) Information (KO)
Information About Culture (K2)
Definition
General development, or the understanding of words, sentences, and paragraphs (not requiring reading), in spoken native language skills.
Extent of vocabulary that can be understood in terms of correct word meanings.
Ability to listen and comprehend oral communications.
Range of general knowledge.
Range of cultural knowledge (e.g., music, art).
Note: Narrow ability definitions were adapted from McGrew (1997) with permission from
Guilford. All rights reserved. Two letter factor codes (e.g., LD) are from Carroll (1993a).
dependent upon learning experiences (especially formal, classroom-type experi
ences), it also seems to encompass a few narrow constructs that are more process oriented. General Information, as one example of a narrow ability, is clearly a repository of learned information. Yet, Ustening Ability, as another example of a narrow
ability under Gc, not only appears to represent learned material but reflects another ability as well-the ability to comprehend information presented orally. Although
comprehension is of course dependent on knowledge of the words being presented, the natures of these abilities are clearly not identical. Assessment of Cc abilities there
fore may require that closer attention be paid to the narrow abilities and processes
it subsumes. Despite the interrelatedness of all narrow abilities under Gi; there may
well be times when focus on the narrow constructs that are more process oriented as
opposed to those that are more knowledge or ability oriented is important.
Quantitative Knowledge (Gq)
Quantitative Knowledge (Gq) represents an individual's store of acquired quantitative, declarative, and procedural knowledge. The Gq store of acquired knowledge
represents the ability to use quantitative information and manipulate numeric
symbols. Gq abilities are typically measured by achievement tests. For example,
most comprehensive tests of achievement include measures of math calculation,
applied problems, and general math knowledge. Although intelligence batteries

C 4 APPENDIX A ) --------(e.g., the Wechsler Scales, SB-IV) have measured aspects of Cq, they typically do not measure them comprehensively. The W ISC-IV contains one Cq subtest
namely, Arithmetic, which measures primarily Math Achievement (A3).
It is important to understand the difference between Cq and the Quantitative
Reasoning (RQ) ability that is subsumed by Gf On the whole, Gq represents an individual's store of acquired mathematical knowledge, including the ability to
perform mathematical calculations correctly. Quantitative Reasoning represents
only the ability to reason inductively and deductively when solving quantitative
problems. Recall that RQ is a narrow ability that is typically found to fall under q:
However, because RQ, as discussed previously, is dependent on possession of ba
sic mathematical concepts and knowledge, it seems to be as much a narrow ability
under Cq as it is under q: Quantitative Reasoning is most evident when a task
requires mathematical skills and general mathematical knowledge (e.g., knowing what the square-root symbol means). Quantitative Reasoning would be required
in order to solve for a missing number in a number-series task (e.g., 3, 6, 9,_). Al
though most achievement batteries measure specific math skills and general math
knowledge, some also require individuals to solve quantitative problems through
inductive or deductive reasoning. Therefore, it may be best to conceptualize RQ
as being a narrow ability that falls under both Cf and G'q broad abilities. Select Cq narrow abilities are defined in Table A.3.
Short-Term Memory (Gsm) Short-Term Memory (Csm) is the ability to apprehend and hold information in immediate awareness and then use it within a few seconds. It is a limited-capacity
system, as most individuals can retain only seven cbunks of information (plus or
minus two chunks) in this system at one time. The ability to remember a telephone
number long enough to dial it, or the ability to retain a sequence of spoken directions long enough to complete the tasks specified in the directions, are examples
Table A.3 Description of Select Gq Narrow Ability Definitions
Narrow stratum I name (code)
Mathematical Knowledge (KM)
Mathematical Achievement (A3)
Detinition
Range of general knowledge about mathematics.
Measured mathematics achievement.
Note: Narrow ability definitions were adapted from McGrew (1997) with permission from Guilford. All rights reserved. 1\vo letter factor codes (e.g., KM) are from Carroll (1993a).

<='----------------------------------A-PP_E_N_D_IX __ A __ s ________ �� of Gsm. Given the limited amount of information that can be held in short-term
memory, information is typically retained for only a few seconds before it is lost.
As most individuals have experienced, it is difficult to remember an unfamiliar
telephone number for more than a few seconds unless one consciously uses a cog
nitive learning strategy (e.g., continually repeating or rehearsing the numbers) or
other mnemonic device. When a new task requires an individual to use his or her
Gsm abilities to store new information, the previous information held in short
term memory is either lost or must be stored in the acquired stores of knowledge
(i.e., Cc, Gq, Grw) through the use of Glr.
In the CHC model, Gsm subsumes the narrow construct of working memory, which has received considerable attention in the cognitive psychology literature.
Working Memory is considered to be the "mechanism responsible for the tempo
rary storage and processing of information" (Richardson, 1996, p. 23). It has been referred to as the "mind's scratchpad" Oensen, 1998, p. 220), and most
models of working memory postulate a number of subsystems or temporary bu/
fors. The phonological or articulatory loop processes auditory-linguistic information, while the visuospatial sketch- or scratchpad (Baddeley, 1986, 1992; Logie,
1996) is the temporary buffer for visually processed information. Most working
memory models also posit a central executive or processor mechanism that co
ordinates and manages the activities and subsystems in working memory.
Carroll (1993) is skeptical of the working memory construct, as reflected
in his conclusion that "although some evidence supports such a speculation,
one must be cautious in accepting it because as yet there has not been suf
ficient work on measuring working memory, and the validity and generality
of the concept have not yet been well established in the individual differ
ences research" (p. 647). Leffard, Miller, Bernstein, DeMann, Mangis, and
McCoy (2006) found that many of the cognitive batteries only measure one aspect of working memory-either the phonological loop or the visuospatial
sketchpad-but not both. Notwithstanding these issues, the working memory
construct has been related empirically to a variety of different outcomes, in
cluding many specific reading and math skills. Therefore, despite the questions
that have been raised regarding its validity as a measurable construct, Flanagan
and colleagues (2000, 2006, 2007), as well as others (e.g., McGrew, 1997, 2005;
Woodcock, McGrew, & Mather, 2001), included working memory in the CHC
taxonomy in light of the current literature that argues strongly for its predictive utility. Nevertheless, given that Carroll has raised questions about the validity
of the construct of working memory, it is important to remember that this con
struct was included in current CHC theory primarily for practical application

�'----------6--AP __ P _EN _D_ I_X_A ___________________________________ � and ease of communication. Additional research is necessary before definitive decisions can be reached about the inclusion or exclusion of working memory
in CHC theory. Even so, the WISC-IV Letter-Number Sequencing subtest is
purported to measure working memory and the WISC-IV Digit Span subtest is purported to measure memory span, in addition to working memory (viz.,
Digits Backward). Select Gsm narrow abilities are defined in Table A.4.
Visual Processing (Gv)
Vi.mal Proces.ring ( GtJ) is the ability to generate, perceive, analyze, synthesize, store, re
trieve, manipulate, transform, and think with visual patterns and stimuli (Lohman,
1992). These abilities are measured frequently by tasks that require the perception
and manipulation of visual shapes and forms, usually of a figural or geometric
nature (e.g., a standard Block Design task). An individual who can mentally reverse and rotate objects effectively, interpret how objects change as they move through
space, perceive and manipulate spatial configurations, and maintain spatial orienta
tion would be regarded as having a strength in Gt' abilities. The W ISC-IV provides two Gv measures, including Block Design, which assesses the GZJ narrow ability of
Spatial Relations (SR), and the Picture Completion subtest, which assesses primar
ily Flexibility of Closure (CF). Select GZJ narrow abilities are defined in Table A.S.
Auditory Processing (Ga)
In the broadest sense, auditor_y abilities "are cognitive abilities that depend on
sound as input and on the functioning of our hearing apparatus" (Stankov, 1994, p. 157) and reflect "the degree to which the individual can cognitively control the
Table A.4 Description of Select Gsm Narrow Ability Definitions
Narrow stratum I name (code)
Memory Span (MS)
Working Memory (MW )
Definition
Ability to attend to and immediately recall temporally ordered elements in the correct order after a single presentation.
Ability to temporarily store and perform a set of cognitive operations on information that requires divided attention and the management of the limited capacity of short-term memory.
Note: Narrow ability definitions were adapted from McGrew (1997) with permission from
Guilford. All rights reserved. Two letter factor codes (e.g., MS) are from Carroll (1993a).
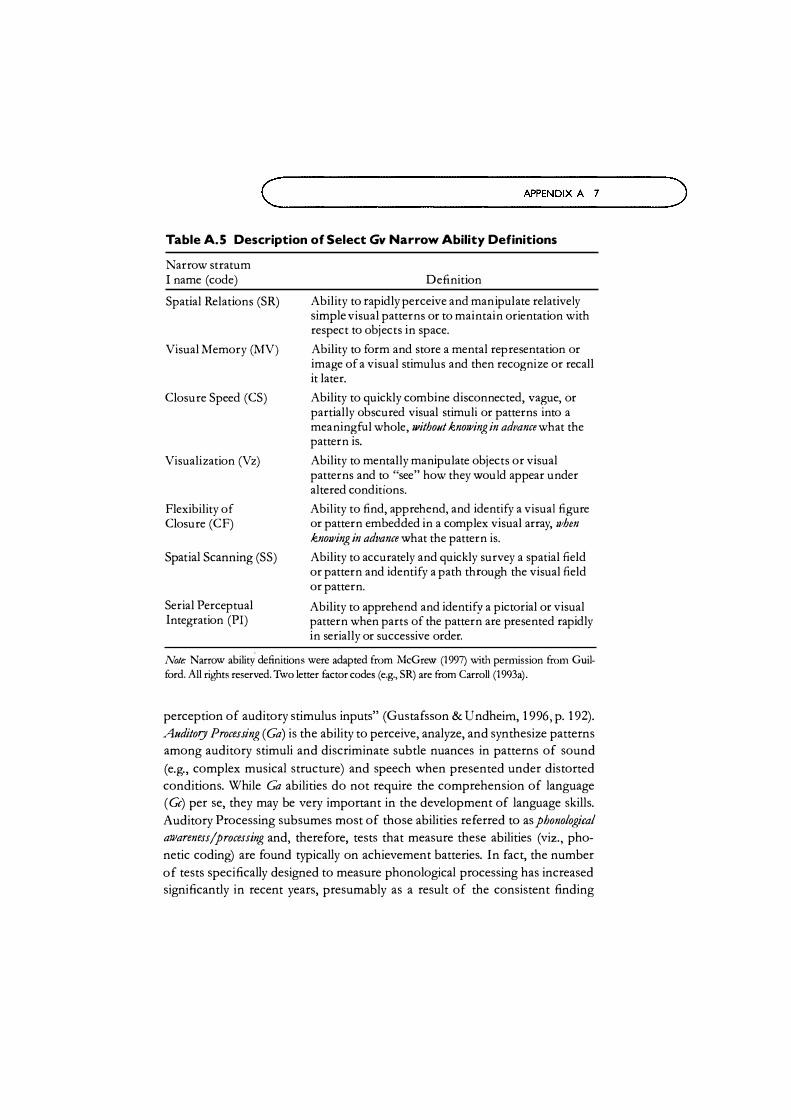
��----------------------------------A_P_PE_N_D_IX __ A __ ? ___________ � Table A.S Description of Select Gv Narrow Ability Definitions
Narrow stratum I name (code)
Spatial Relations (SR)
Visual Memory (MV)
Closure Speed (CS)
Visualization (Vz)
Flexibility of Closure (CF)
Spatial Scanning (SS)
Serial Perceptual Integration (PI)
Definition
Ability to rapidly perceive and manipulate relatively simple visual patterns or to maintain orientation with respect to objects in space.
Ability to form and store a mental representation or image of a visual stimulus and then recognize or recall it later.
Ability to quickly combine disconnected, vague, or partially obscured visual stimuli or patterns into a meaningful whole, withoNt knoJJ'ing in advance what the pattern is.
Ability to mentally manipulate objects or visual patterns and to "see" how they would appear under altered conditions.
Ability to find, apprehend, and identify a visual figure or pattern embedded in a complex visual array, u'hen knou1ing in advance what the pattern is.
Ability to accurately and quickly survey a spatial field or pattern and identify a path through the visual field or pattern.
Ability to apprehend and identify a pictorial or visual pattern when parts of the pattern are presented rapidly in serially or successive order.
Note.· Narrow ability definitions were adapted from McGrew (1997) \Vith permission from Guilford. All rights reserved. Two letter factor codes (e.g., SR) are from Carroll (1993a).
perception of auditory stimulus inputs" (Gustafsson & U ndheim, 1996, p. 192).
Auditory Processing ( Ga) is the ability to perceive, analyze, and synthesize patterns among auditory stimuli and discriminate subtle nuances in patterns of sound
(e.g., complex musical structure) and speech when presented under distorted
conditions. While Ga abilities do not require the comprehension of language
( Gc) per se, they may be very important in the development of language skills.
Auditory Processing subsumes most of those abilities referred to as phonological auJarenessjprocessing and, therefore, tests that measure these abilities (viz., pho
netic coding) are found typically on achievement batteries. In fact, the number
of tests specifically designed to measure phonological processing has increased
significantly in recent years, presumably as a result of the consistent finding

<=�----------8--AP __ P _EN_ D_I_X_A ___________________________________ � that phonological awareness/processing appears to be the core deficit in in
dividuals with reading difficulties (e.g., Fletcher, Lyon, Fuchs, & Barnes, 2007;
Fletcher-Janzen & Reynolds, 2008; Morris et al., 1998; Vellutino, Scanlon, & Lyon, 2000). However, the Ga domain is very broad (i.e., it contains many narrow abilities subsumed by Ga) and, thus, extends far beyond phonetic coding
ability (McGrew, 2005). In CHC theory, Carroll's Phonetic Coding (PC) narrow ability was split
into separate analysis (PC:A) and synthesis (PC:S) abilities. Support for two different PC abilities comes from a growing number of sources. First, in a
sample of kindergarten students, Yopp (1988) reported evidence in favor of two phonemic awareness factors: simple phonemic awareness (required one
operation to be performed on sounds) and compound phonemic awareness
(required holding sounds in memory while performing another operation on
them). Second, in what appears to be one of the most comprehensive Ga factor-analytic studies, Stankov and Horn (1980) presented evidence for seven different auditory abilities, two of which had tests of sound blending (synthesis) and incomplete words (analysis) as factor markers. Third, the WJ-R Sound
Blending and Incomplete Words tests (which are almost identical in format to the tests used by Stankov & Horn) correlated only moderately (.37 or 13.7%
shared or common variance) across the kindergarten to adult WJ-R norm
sample-a correlation that suggests that these tests are measuring different
aspects of PC. Fourth, using confirmatory factor-analytic methods, Wagner,
Torgesen, Laughton, Simmons, and Rashotte (1993) presented a model of
phonological processing that included separate auditory analysis and synthesis
factors.
Although the features of these different auditory factors across respective
studies are not entirely consistent, there are many similarities. For example, Yopp 's
(1988) simple phonemic factor appears to be analogous to Wagner and colleagues'
(1993) synthesis factor and the factor Stankov and Horn (1980) identified with
the aid of sound-blending tasks. Also, Yopp's compound phonemic factor bears
similarities to Wagner and colleagues' analysis factor and the Stankov and Horn
factor, identified, in part, by an incomplete words task. Presently, it appears that
Wagner and colleagues' analysis/synthesis distinction is likely the most useful.
According to Wagner and colleagues, anafysis and [J'Ilthesis can be defined as "the
ability to segment larger units of speech into smaller units" and "the ability to
blend smaller units of speech to form larger units" (p. 87), respectively. The analy
sis/synthesis distinction continues to be empirically supported, as demonstrated
by the separate Phonetic Coding: Analysis and Phonetic Coding: Synthesis tests
included in the new WJ Ill (Woodcock et al., 2001 ). Select Ga narrow abilities are
defined in Table A.6.

�'--------------------------------A_P_P_EN __ D_IX_A---9----------�
Table A.6 Description of Select Ga Narrow Ability Definitions
Narrow stratum I name (code)
Phonetic Coding: Analysis (PC: A)
Phonetic Coding: Synthesis (PC:S)
Speech Sound Discrimination (US)
Resistance to Auditory Stimulus Distortion (UR)
Memory for Sound Patterns (UM)
General Sound Discrimination (U3)
Definition
Ability to segment larger units of speech sounds into smaller units of speech sounds.
Ability to blend smaller units of speech together into larger units of speech.
Ability to detect differences in speech sounds under conditions of little distraction or distortion.
Ability to understand speech and language that has been distorted or masked in one or more ways.
Ability to retain on a short-term basis auditory events such as tones, tonal patterns, and voices.
Ability to discriminate tones, tone patterns, or musical materials with regard to pitch, intensity, duration, and rhythm.
Note: Narrow ability definitions were adapted from McGrew (1997) with permission from Guilford.
All rights reserved. Two letter factor codes (e.g., PC:A) are from Carroll (1993a).
Long-Term Storage and Retrieval (Glr)
Long-Term Storage and Retriet;a/ (Gii) is the ability to store information in and fluently retrieve new or previously acquired information (e.g., concepts, ideas, items,
names) from long-term memory. G/rabilities have been prominent in creativity
research, where they have been referred to as idea prodt�ction, ideational jlttenry, or
associational jlttmry. It is important not to confuse Glr with G'c, Gq, and Gm;, an in
dividual's stores of acquired knowledge: Cc, Gq, and Gm' represent n'hat is stored
in long-term memory, while Clris the ejficienry by which this information is initially
stored in and later retrieved from long-term memory.
It is important to note that different processes are involved in Glrand Gsm. Al
though the expression long-term frequently carries with it the connotation of days,
weeks, months, and years in the clinical literature, long-term storage processes can
begin within a few minutes or hours of performing a task. Therefore, the time
lapse between the initial task performance and the recall of information related
to that task is not necessarily of critical importance in defining Glr. More important is the occurrence of an intervening task that engages short-term memory
before the attempted recall of the stored information (e.g., G'c; Woodcock, 1993;

��----------�-O __ A_PP_
E_N_
D_
IX __ A __________________________________ :> Woodcock, McGrew, & Mather, 2001). Although Glris measured directly by sev
eral major intelligence batteries, the W ISC-IV does not assess Gb: ln the present
CHC model, 13 narrow memory and fluency abilities are included under G/r.
Select Glr narrow abilities are defined in Table A. 7.
Table A. 7 Description of Select Glr Narrow Ability Definitions
Narrow stratum I name (code)
Associative Memory (MA)
Meaningful Memory (MM)
Free Recall Memory (M6)
Ideational Fluency (FI)
Associational Fluency (FA)
Expressional Fluency (FE)
Naming Facility (NA)
Word Fluency (FW)
Figural Fluency (FF)
Definition
Ability to recall one part of a previously learned but unrelated pair of items when the other part is presented (i. e. , paired-associative learning) .
Ability to recall a set of items where there is a meaningful relation between items or the items comprise a meaningful story or connected discourse.
Ability to recall as many unrelated items as possible, in any order, after a large collection of items is presented.
Ability to rapidly produce a series of ideas, words, or phrases related to a specific condition or object. Quantity not quality is emphasized.
Ability to rapidly produce words or phrases associated in meaning (semantically associated) with a given word or concept.
Ability to rapidly think of and organize words or phrases into meaningful complex ideas under high general or more specific cueing conditions.
Ability to rapidly produce names for concepts when presented with a pictorial or verbal cue.
Ability to rapidly produce words that have specific phonemic, structural, or orthographic characteristics (independent of word meanings).
Ability to rapidly draw or sketch several examples or elaborations when given a starting visual or descriptive stimulus.
Note: Narrow ability definitions were adapted from McGrew (1997) with permission from
Guilford. All rights reserved. Two letter factor codes (e.g., :MA) are from Carroll (1993a) .

�'---------------------------------A_P_P_EN __ D_IX_A ___ I_I __________ � Table A.S Description of Select Gs Narrow Ability Definitions
Narrow stratum I name (code)
Perceptual Speed (P)
Rate-of-Test-Taking (R9)
Number Facility (N)
Definition
Ability to rapidly search for and compare known visual symbols or patterns presented side-by-side or separated in a visual field.
Ability to rapidly perform tests which are relatively easy or that require very simple decisions.
Ability to rapidly and accurately manipulate and deal with numbers, from elementary skills of counting and recognizing numbers to advanced skills of adding, subtracting, multiplying, and dividing numbers.
Note: Narrow ability definitions were adapted from McGrew (1997) with permission from Guilford. All rights reserved. Two letter factor codes (e.g., R9) are from Carroll (1993a).
Processing Speed (Gs)
Processing Speed (Gs), or mental quickness, is often mentioned when one is talking
about intelligent behavior (Nettelbeck, 1 992). Processing speed is the ability to fluently and automatically perform cognitive tasks, especially when under pressure
to maintain focused attention and concentration . AttentiJJe speediness encapsulates
the essence of Cs, which is measured typically by fixed-interval, timed tasks that
require little in the way of complex thinking or mental processing. The WISC-IV
provides three Gs tasks-namely, Coding, Symbol Search, and Cancellation.
Recent interest in information-processing models of cognitiye functioning has
resulted in a renewed focus on Cs (Kail, 1 99 1 ; Lohman, 1 989; Woodcock et al.,
2001) . A central construct in information-processing models is the idea of lim
ited processing resources (e.g., the limited capacities of short-term or working memory). That is, "many cognitive activities require a person's deliberate efforts
and . . . people are limited in the amount of effort they can allocate. In the face of
limited processing resources, the speed of processing is critical because it determines in part how rapidly limited resources can be reallocated to other cognitive
tasks" (Kail, p. 1 52). Woodcock (1 993) likens Cs to a valve in a water pipe. The rate
in which water flows in the pipe (i .e., Cs) increases when the valve is opened wide and decreases when the valve is partially closed. Three different narrow speed
of-processing abilities are subsumed by Gs in the present CHC model. Select Cs
narrow abilities are defined in Table A.8.
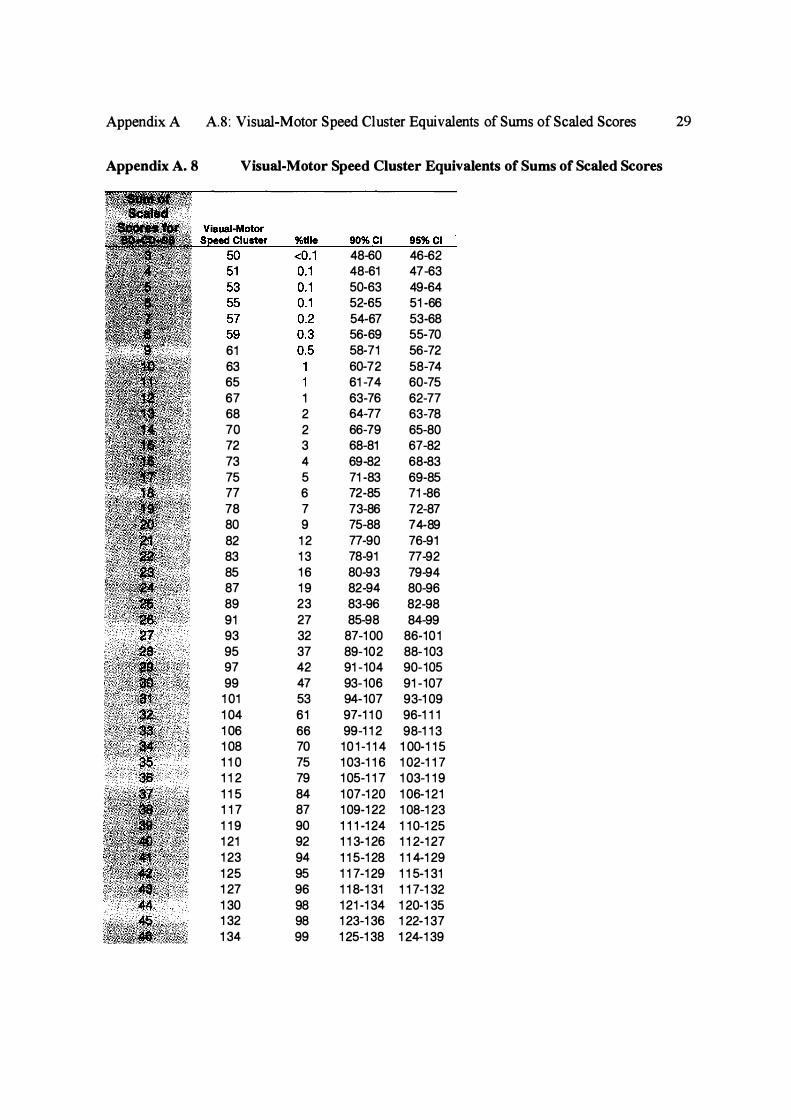
Appendix A A.8: Visual-Motor Speed Cluster Equivalents of Sums of Scaled Scores 29
Appendix A. 8 Visual-Motor Speed Cluster Equivalents of Sums of Scaled Scores
48-60 46-62 48-61 47-63 50-63 49-64 52-65 51 -66 54-67 53-68 56-69 55-70
61 58-71 56-72 63 60-72 58-74 65 61 -74 60-75 67 1 63-76 62-77 68 2 64-77 63-78 70 2 66-79 65-80 72 3 68-81 67-82 73 4 69-82 68-83 75 5 71 -83 69-85 77 6 72-85 71 -86 78 7 73-86 72-87 80 9 75-88 74-89 82 1 2 77-90 76-91 83 1 3 78-91 77-92 85 1 6 80-93 79-94 87 1 9 82-94 80-96 89 23 83-96 82-98 91 27 85-98 84-99 93 32 87-1 00 86-101 95 37 89-102 88-103 97 42 91 -104 90-105 99 47 93-106 91 -107
1 01 53 94-107 93-1 09 1 04 61 97-1 1 0 96-1 1 1 1 06 66 99-1 1 2 98-1 1 3 1 08 70 1 0 1 -1 1 4 1 00-1 1 5 1 1 0 75 1 03-1 1 6 1 02-1 1 7 1 1 2 79 1 05-1 1 7 1 03-1 1 9 1 1 5 84 1 07-1 20 1 06-1 21 1 1 7 87 1 09-1 22 1 08-1 23 1 1 9 90 1 1 1 -1 24 1 1 0-1 25 1 21 92 1 1 3-1 26 1 1 2-1 27 1 23 94 1 1 5-1 28 1 1 4-1 29 1 25 95 1 1 7-1 29 1 1 5-1 31 1 27 96 1 1 8-1 31 1 1 7-1 32 1 30 98 1 21 -1 34 1 20-1 35 1 32 98 1 23-1 36 1 22-1 37 1 34 99 1 25-1 38 1 24-1 39

Appendix A A.8: Visual-Motor Speed Cluster Equivalents of Sums of Scaled Scores 30
%t ile 90%CI
1 36 99 1 27-1 40
1 38 99 1 29-1 41 1 40 99.6 1 30-1 43 1 42 99.7 1 32-1 45 1 44 99.8 1 34-1 47 1 46 99.9 1 36-1 49 1 48 99.9 1 38-1 51 1 50 >99.9 1 40-1 52 1 50 >99.9 1 40-1 52 1 50 >99.9 1 40-1 52 1 50 >99.9 1 40-1
95%CI
1 25-1 41 1 27-1 43 1 29-1 44 1 31 -1 46 1 33-1 48 1 35-1 50 1 37-1 52 1 38-1 54 1 38-1 54 1 38-1 54
Source: Standardization data and analysis results from the Wechsler Adult Intelligence Scale
Fourth Edition (W AIS-IV). Copyright © 2008 by NCS Pearson, Inc. Used with permission. All rights reserved.

Appendix A A.9: Problem Solving without Visual-Motor Speed Cluster 3 1
Appendix A.9 Problem Solving without Visual-Motor Speed Cluster Equivalents of Sums of Scaled Scores
Pr oblem S olv ing wit h ou t VIsual-M o tor Speed
Clust er 90% 95%CI %tile
40 38-48 37-49 <0.1 41 39-49 38-50 <0.1 43 41 -51 40-52 <0.1 45 43-53 42-54 <0.1 47 44-55 43-56 <0.1 49 46-57 45-58 <0.1 51 48-59 47-60 0.1 53 50-61 49-62 0.1 55 52-62 51 -63 0.1 57 54-64 53-65 0.2 58 55-65 54-66 0.3 60 57-67 56-68 0.4 62 59-69 58-70 64 61 -71 60-72 66 62-73 61 -74 1 68 64-75 63-76 2 70 66-77 65-78 2 71 67-78 66-79 3 73 69-80 68-81 4 74 70-81 69-82 4 76 72-82 71 -83 5 77 73-83 72-84 6 79 75-85 74-86 8 80 76-86 75-87 9 82 78-88 77-89 1 2 83 79-89 78-90 1 3 85 81 -91 80-92 1 6 86 81 -92 80-93 1 8 88 83-94 82-95 21 89 84-95 83-96 23 91 86-97 85-98 27 93 88-99 87-1 00 32 94 89-1 00 88-1 01 34 96 91 -1 01 90-1 02 39 97 92-1 02 91 -1 03 42 99 94-1 04 93-1 05 47
1 00 95-1 05 94-1 06 50 1 01 96-1 06 95-107 53 1 02 97-1 07 96-1 08 55 1 03 98-1 08 97-1 09 58 1 05 1 00-1 1 0 99-1 1 1 63 1 06 1 00-1 1 1 99-1 1 2 66 1 08 1 02-1 1 3 1 0 1 -1 1 4 70 1 1 0 1 04-1 1 5 1 03-1 1 6 75

Appendix A A.9: Problem Solving without Visual-Motor Speed Cluster 32
Pr oblem S olving wit h out Visual-M ot or Sp e ed Clust er Cl
1 1 1 1 05-1 1 6 1 04-1 1 7 77 1 1 3 1 07-1 1 8 1 06-1 1 9 81 1 1 5 1 09-1 1 9 1 08-1 20 84 1 1 7 1 1 1 -1 21 1 1 0-1 22 87 1 1 9 1 1 3-1 23 1 1 2-1 24 90 1 20 1 1 4-1 24 1 1 3-1 25 91 1 22 1 1 6-1 26 1 1 5-1 27 93 1 24 1 1 8-1 28 1 1 7-1 29 95 1 26 1 1 9-1 30 1 1 8-1 31 96 1 28 1 2 1 -1 32 1 20-1 33 97 1 30 1 23-1 34 1 22-1 35 98 1 32 1 25-1 36 1 24-1 37 98 1 34 1 27-1 38 1 26-1 39 99 1 36 1 29-1 39 1 28-1 40 99 1 38 1 31 -1 41 1 30-1 42 99 1 40 1 33-1 43 1 32-1 44 99.6 1 42 1 35-1 45 1 34-1 46 99.7 1 44 1 37-1 47 1 36-1 48 99.8 1 46 1 38-1 49 1 37-1 50 99.9 1 48 1 40-1 51 1 39-1 52 99.9 1 50 1 42-1 53 1 41 -1 54 >99.9 1 52 1 44-1 55 1 43-1 56 >99.9 1 54 1 46-1 57 1 45-1 58 >99.9 1 56 1 48-1 58 1 47-1 59 >99.9 1 58 1 50-1 60 1 49-1 61 >99.9 1 60 1 52-1 62 1 51 -1 63 >99.9 1 60 1 52-1 62 1 51 -1 63 >99.9 1 60 1 52-1 62 1 51 -1 63 >99.9 1 60 1 1 62
Source: Standardization data and analysis results from the Wechsler Adult Intelligence Scale-
Fourth Edition (W AIS-IV). Copyright © 2008 by NCS Pearson, Inc. Used with permission. All rights reserved.

Appendix A A. lO: Mental Manipulation Cluster
Appendix A.l 0 Mental Manipulation Cluster Equivalents of Sums of Scaled Scores
50 4 7-59 46-60 . 52 49-61 48-62 55 52-63 51 -64 58 55-66 54-67 61 58-69 57-70 64 60-72 59-73 67 63-75 62-76 69 2 65-77 64-78 72 3 68-79 67-80 7 4 4 70-81 69-82 77 6 73-84 72-85 79 8 75-86 73-87 83 1 3 78-90 77-91 86 1 8 81 -93 80-94 89 23 84-95 83-96 92 30 87-98 86-99 95 37 90-1 01 89-1 02
98 45 92-104 91 -1 05
1 00 50 94-106 93-1 07 1 03 58 97-1 09 96-1 1 0 1 05 63 99-1 1 0 98-1 1 1 1 08 70 1 02-1 1 3 1 01 -1 1 4 1 1 0 75 1 04-1 1 5 1 03-1 1 6 1 1 2 79 1 06-1 1 7 1 05-1 1 8 1 1 5 84 1 08-1 20 1 07-1 21 1 1 8 88 1 1 1 -1 23 1 1 0-1 24 1 21 92 1 1 4-1 25 1 1 3-1 27 1 24 95 1 1 7-1 28 1 1 6-1 29 1 27 96 1 20-1 31 1 1 9-1 32 1 30 98 1 23-1 34 1 21 -1 35 1 33 99 1 25-1 37 1 24-1 38 1 36 99 1 28-1 40 1 27-1 41 1 39 99.5 1 31 -1 42 1 30-1 43 1 42 99.7 1 34-1 45 1 33-1 46 1 45 99.9 1 37-1 48 1 36-1 49 1 48 99.9 1 39-1 51 1 38-1 52 1 50 >99.9 1 41 -1 53 1 40-1 54
Source: Standardization data and analysis results from the Wechsler Adult Intelligence Scale
Fourth Edition (W AIS-IV). Copyright © 2008 by NCS Pearson, Inc. Used with permission. All rights reserved.
33

Appendix 1 1 A l l : Verbal Fluid Reasoning Cluster 34
Appendix A.l l Verbal Fluid Reasoning Cluster Equivalents of Sums of Scaled Scores
%t ile 90%CI 95%CI
50 <0.1 48-60 46-62 53 0.1 50-63 49-64 56 0.2 53-66 52-67 59 0.3 56-69 55-70 62 1 59-71 57-73 65 1 61 -74 60-75 68 2 64-77 63-78 71 3 67-80 66-81 73 4 69-82 68-83 76 5 71 -84 70-86 78 7 73-86 72-87 81 1 0 76-89 75-90 84 1 4 79-92 78-93 86 1 8 81 -94 79-95 88 21 83-95 81 -97 91 27 85-98 84-99 94 34 88-1 01 87-1 02 97 42 91 -1 04 90-1 05
1 00 50 94-106 92-1 08 1 02 55 95-1 08 94-1 09 1 05 63 98-1 1 1 97-1 1 2 1 08 70 1 01 -1 1 4 1 00-1 1 5 1 1 1 77 1 04-1 1 7 1 02-1 1 8 1 1 3 81 1 06-1 1 8 1 04-1 20 1 1 6 86 1 08-1 21 1 07-1 22 1 1 9 90 1 1 1 -1 24 1 1 0-1 25 1 22 93 1 1 4-1 27 1 1 3-1 28 1 25 95 1 1 7-1 29 1 1 5-1 31 1 28 97 1 1 9-1 32 1 1 8-1 33 1 32 98 1 23-1 36 1 22-1 37 1 35 99 1 26-1 39 1 25-1 40 1 38 99 1 29-1 41 1 27-1 43 1 41 99.7 1 31 -1 44 1 30-1 45 1 44 99.8 1 34-1 47 1 33-1 48 1 47 99.9 1 37-1 50 1 36-1 51 1 50 >99.9 1 40-1 52 1 38-1 54 1 50 >99.9 1 40-1 52 1 38-1 54
Source: Standardization data and analysis results from the Wechsler Adult Intelligence Scale-
Fourth Edition (W AIS-IV). Copyright © 2008 by NCS Pearson, Inc. Used with permission. All rights reserved.

Appendix A A 12: Lexical Knowledge Cluster 35
Appendix A.12 Lexical Knowledge Cluster Equivalents of Sums of Scaled Scores
47-58 46-59 50-61 49-62
56 53-63 52-64 59 56-66 55-67 62 59-69 58-70 65 1 62-72 61 -73 68 2 64-75 63-76 71 3 67-78 66-79 73 4 69-80 68-81 76 5 72-82 71 -83 78 7 74-84 73-85 81 1 0 77-87 76-88 84 1 4 80-90 79-91 86 1 8 81 -92 80-93 88 21 83-94 82-95 91 27 86-97 85-98 94 34 89-1 00 88-101 97 42 92-1 02 91 -1 03
1 00 50 95-1 05 94-1 06 1 02 55 97-107 96-1 08 1 05 63 1 00-1 1 0 99-1 1 1 1 08 70 1 02-1 1 3 1 01 -1 1 4 1 1 1 77 1 05-1 1 6 1 04-1 1 7 1 1 3 81 1 07-1 1 8 1 06-1 1 9 1 1 6 86 1 1 0-1 20 1 09-1 21 1 1 9 90 1 1 3-1 23 1 1 2-1 24 1 22 93 1 1 6-1 26 1 1 5-1 27 1 25 95 1 1 9-129 1 1 8-1 30 1 28 97 1 21 -1 32 1 20-1 33 1 32 98 1 25-1 36 1 24-1 37 1 35 99 1 28-1 38 1 27-1 39 1 38 99 1 31 -141 1 30-1 42 1 41 99.7 1 34-1 44 1 33-1 45 1 44 99.8 1 37-1 47 1 36-1 48 1 47 99.9 1 39-1 50 1 38-1 51 1 50 >99.9 1 42-1 53 1 41 -1 54 1 50 >99.9 1 42-1 53 1 41 -1 54
Source: Standardization data and analysis results from the Wechsler Adult Intelligence Scale-
Fourth Edition (W AIS-IV). Copyright © 2008 by NCS Pearson, Inc. Used with permission. All rights reserved.
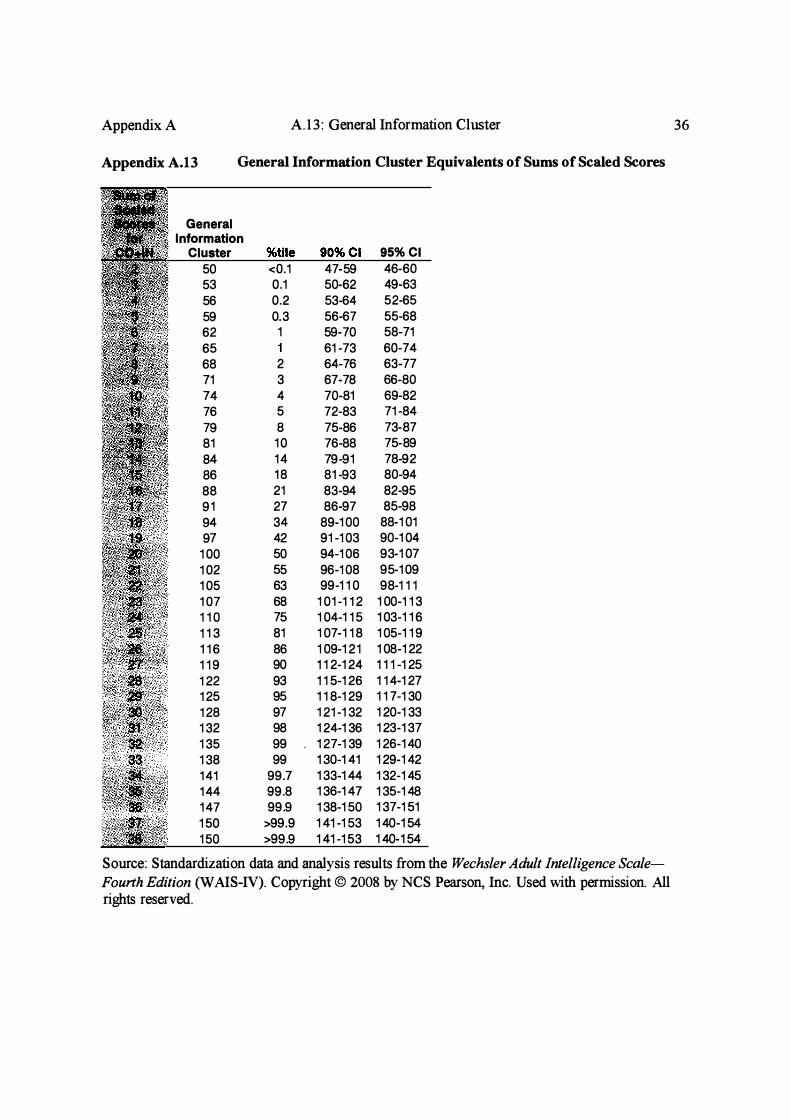
Appendix A A.13 : General Information Cluster
Appendix A.13 General Information Cluster Equivalents of Sums of Scaled Scores
General Information
Cluster 50 53 56 59 62 65 68 71 74 76 79 81 84 86 88 91 94 97
1 00 1 02 1 05 1 07 1 1 0 1 1 3 1 1 6 1 1 9 1 22 1 25 1 28 1 32 1 35 1 38 1 41 1 44 1 47 1 50 1 50
<0.1 0.1 0.2 0.3 1
2 3 4 5 8 1 0 1 4 1 8 21 27 34 42 50 55 63 68 75 81 86 90 93 95 97 98 99 99
99.7 99.8 99.9
>99.9 >99.9
47-59 50-62 53-64 56-67 59-70 61 -73 64-76 67-78 70-81 72-83 75-86 76-88 79-91 81 -93 83-94 86-97
89-1 00 91 -1 03 94-1 06 96-1 08 99-1 1 0
1 01 -1 1 2 1 04-1 1 5 1 07-1 1 8 1 09-1 21 1 1 2-1 24 1 1 5-1 26 1 1 8-1 29 1 21 -1 32 1 24-1 36 1 27-1 39 1 30-1 41 1 33-1 44 1 36-1 47 1 38-1 50 1 41 -1 53 1 41 -1 53
95% CI 46-60 49-63 52-65 55-68 58-71 60-74 63-77 66-80 69-82 71 -84 73-87 75-89 78-92 80-94 82-95 85-98
88-1 01 90-1 04 93-1 07 95-1 09 98-1 1 1
1 00-1 1 3 1 03-1 1 6 1 05-1 1 9 1 08-1 22 1 1 1 -1 25 1 1 4-1 27 1 1 7-1 30 1 20-1 33 1 23-1 37 1 26-1 40 1 29-1 42 1 32-1 45 1 35-1 48 1 37-1 51 1 40-1 54 1 40-1 54
Source : Standardization data and analysis results from the Wechsler Adult Intelligence Scale
Fourth Edition (W AIS-IV). Copyright © 2008 by NCS Pearson, Inc. Used with permission. All rights reserved.
36
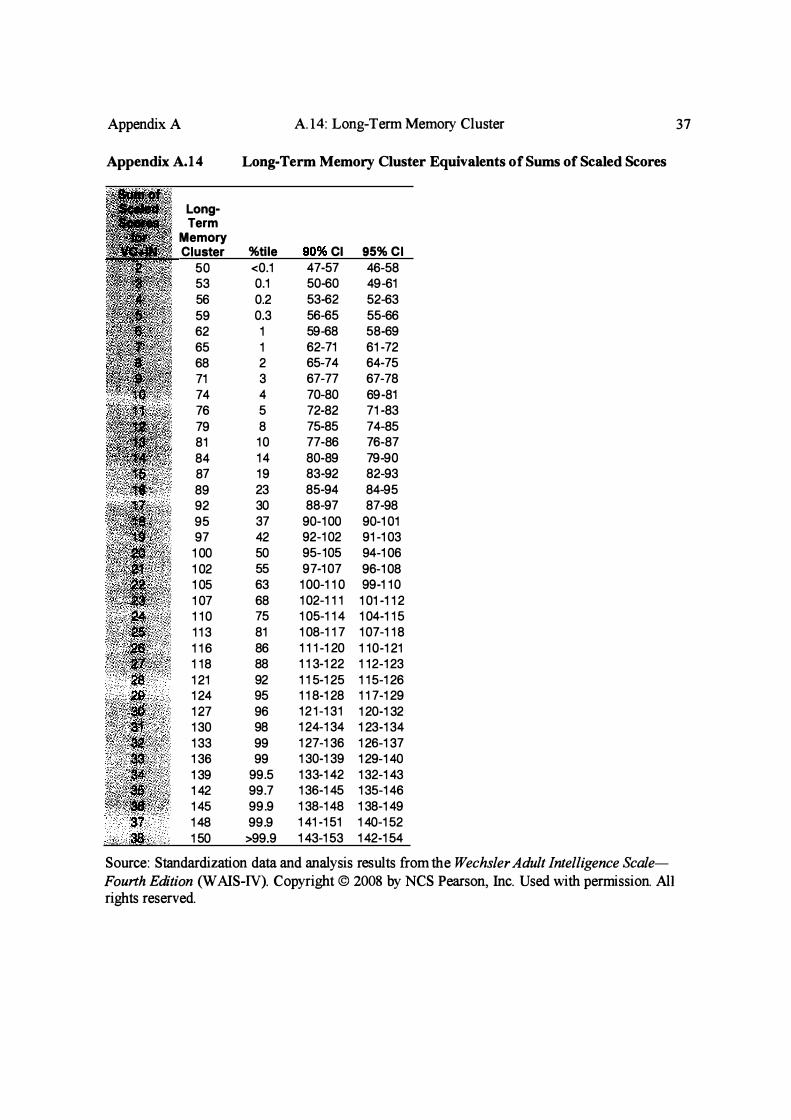
Appendix A A. 14: Long-Term Memory Cluster 37
Appendix A.14 Long-Term Memory Cluster Equivalents of Sums of Scaled Scores
Long-Term
Memory Cluster %tile Cl 95% CI
50 <0.1 47-57 46-58 53 0.1 50-60 49-61 56 0.2 53-62 52-63 59 0.3 56-65 55-66 62 1 59-68 58-69 65 1 62-71 61 -72 68 2 65-74 64-75 71 3 67-77 67-78 74 4 70-80 69-81 76 5 72-82 71 -83 79 8 75-85 74-85 81 1 0 77-86 76-87 84 1 4 80-89 79-90 87 1 9 83-92 82-93 89 23 85-94 84-95 92 30 88-97 87-98 95 37 90-1 00 90-1 01 97 42 92-1 02 91 -1 03
1 00 50 95-105 94-1 06 1 02 55 97-1 07 96-1 08 1 05 63 1 00-1 1 0 99-1 1 0 1 07 68 1 02-1 1 1 1 01 -1 1 2 1 1 0 75 1 05-1 1 4 1 04-1 1 5 1 1 3 81 1 08-1 1 7 1 07-1 1 8 1 1 6 86 1 1 1 -1 20 1 1 0-1 21 1 1 8 88 1 1 3-1 22 1 1 2-1 23 1 21 92 1 1 5-1 25 1 1 5-1 26 1 24 95 1 1 8-1 28 1 1 7-1 29 1 27 96 1 2 1 -1 31 1 20-1 32 1 30 98 1 24-1 34 1 23-1 34 1 33 99 1 27-1 36 1 26-1 37 1 36 99 1 30-1 39 1 29-1 40 1 39 99.5 1 33-1 42 1 32-1 43 1 42 99.7 1 36-1 45 1 35-1 46 1 45 99.9 1 38-1 48 1 38-1 49 1 48 99.9 1 41 -1 51 1 40-1 52
. :x: . . ,aft, . .. ·). 1 50 >99.9 1 43-1 53 1 42-1 54
Source: Standardization data and analysis results from the Wechsler Adult Intelligence Scale-
Fourth Edition (W AIS-IV). Copyright © 2008 by NCS Pearson, Inc. Used with permission. All rights reserved.

Appendix A
Appendix A.15
S h ort· T erm
M em ory Clust er
50 52 55 58 61 64 67 69 72 74 77 79 83 86 89 92 95 98
1 00 1 03 1 05 1 08 1 1 0 1 1 2 1 1 5 1 1 8 1 21 1 24 1 27 1 30 1 33 1 36 1 39 1 42 1 45 1 48 1 50
A.l5: Short-Term Memory Cluster
Short-Term Memory Cluster Equivalents of Sums of Scaled Scores
<0.1 0.1 0.1 0.3 0.5 1 1 2 3 4 6 8
1 3 1 8 23 30 37 45 50 58 63 70 75 79 84 88 92 95 96 98 99 99
99.5 99.7 99.9 99.9
>99.9
47-59 49-61 52-63 55-66 58-69 60·72 63-75 65-77 68-79 70-81 73-84 75-86 78-90 81 -93 84-95 87-98
90-1 01 92-1 04 94-1 06 97-1 09 99-1 1 0
1 02-1 1 3 1 04-1 1 5 1 06-1 1 7 1 08-1 20 1 1 1 -1 23 1 1 4-1 25 1 1 7-1 28 1 20-1 31 1 23-1 34 1 25-1 37 1 28-1 40 1 31 -1 42 1 34-1 45 1 37-1 48 1 39-1 51 1 41 -1 53
46-60 48-62 51 -64 54-67 57-70 59-73 62-76 64-78 67-80 69-82 72-85 73-87 77-91 80-94 83-96 86-99
89-1 02 91 -1 05 93-1 07 96-1 1 0 98-1 1 1
1 01 -1 1 4 1 03-1 1 6 1 05-1 1 8 1 07-1 21 1 1 0-1 24 1 1 3-127 1 1 6-1 29 1 1 9-1 32 1 21 -1 35 1 24-1 38 1 27-1 41 1 30-1 43 1 33-1 46 1 36-1 49 1 38-1 52 1 40-1 54
Source: Standardization data and analysis results from the Wechsler Adult Intelligence Scale
Fourth Edition 0N AlS-IV). Copyright © 2008 by NCS Pearson, Inc. Used with permission. All rights reserved.
38
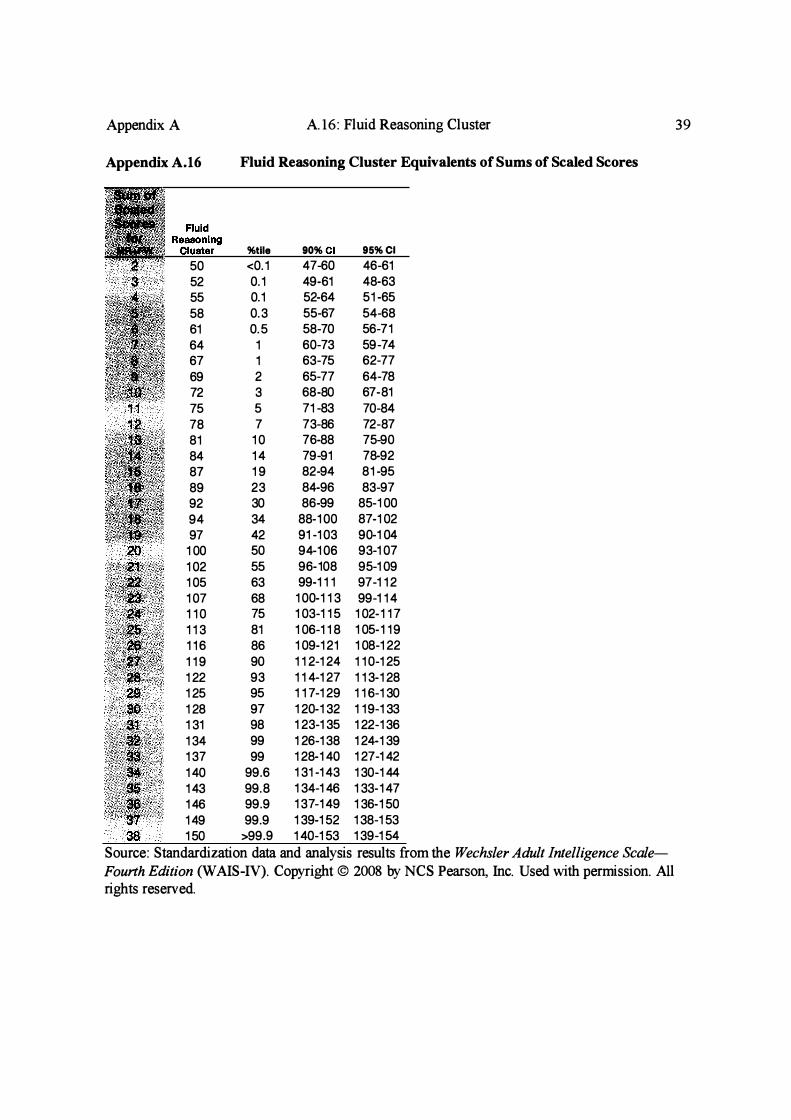
Appendix A A. 16: Fluid Reasoning Cluster 39
Appendix A.16 Fluid Reasoning Cluster Equivalents of Sums of Scaled Scores
%tile 90% 95%CI
50 <0.1 47-60 46-61 52 0.1 49-61 48-63 55 0.1 52-64 51 -65 58 0.3 55-67 54-68 61 0.5 58-70 56-71 64 1 60-73 59-74 67 1 63-75 62-77 69 2 65-77 64-78 72 3 68-80 67-81
75 5 71 -83 70-84 78 7 73-86 72-87 81 1 0 76-88 75-90 84 1 4 79-91 78-92 87 1 9 82-94 81 -95 89 23 84-96 83-97 92 30 86-99 85-1 00 94 34 88-1 00 87-1 02 97 42 91 -1 03 90-1 04
1 00 50 94-1 06 93-1 07 1 02 55 96-108 95-1 09 1 05 63 99-1 1 1 97-1 1 2 1 07 68 1 00-1 1 3 99-1 1 4 1 1 0 75 1 03-1 1 5 1 02-1 1 7 1 1 3 81 1 06-1 1 8 1 05-1 1 9 1 1 6 86 1 09-1 21 1 08-1 22 1 1 9 90 1 1 2-1 24 1 1 0-1 25 1 22 93 1 1 4-1 27 1 1 3-1 28 1 25 95 1 1 7-1 29 1 1 6-1 30 1 28 97 1 20-1 32 1 1 9-1 33 1 31 98 1 23-1 35 1 22-1 36 1 34 99 1 26-1 38 1 24-1 39 1 37 99 1 28-1 40 1 27-1 42 1 40 99.6 1 31 -1 43 1 30-1 44 1 43 99.8 1 34-1 46 1 33-1 47 1 46 99.9 1 37-1 49 1 36-1 50 1 49 99.9 1 39-1 52 1 38-1 53
38 1 50 >99.9 1 40-1 53 1 39-1 54
Source : Standardization data and analysis results from the Wechsler Adult Intelligence Scale-
Fourth Edition (W AIS-IV). Copyright © 2008 by NCS Pearson, Inc. Used with permission. All rights reserved.

Appendix A
Appendix A.17
58 61 64 67 70 73 75 78 81 84 87 90 92 95 97
1 00 1 02 1 05 1 07 1 1 0 1 1 3 1 1 6 1 1 9 1 22 1 25 1 28 1 31 1 34 1 37 1 40 1 43 1 46 1 49 1 50
A.l 7: Visual Processing Cluster
Visual Processing Cluster Equivalents of Sums of Scaled Scores
%tile
<0.1 0.1 0.1 0.3 0.5
1 1 2 4 5 7
1 0 1 4 1 9 25 30 37 42 50 55 63 68 75 81 86 90 93 95 97 98 99 99
99.6 99.8 99.9 99.9
>99.9
90%CI
47-60 49-61 52-64 55-67 58-70 60-73 63-75 66-78 69-81 71 -83 73-86 76-88 79-91 82-94 85-97 86-99
89-1 01 91 -1 03 94-1 06 96-108 99-1 1 1
1 00-1 1 3 1 03-1 1 5 1 06-1 1 8 1 09-1 21 1 1 2-1 24 1 1 4-1 27 1 1 7-129 1 20-1 32 1 23-1 35 1 26-1 38 1 28-1 40 1 31 -1 43 1 34-1 46 1 37-1 49 1 39-1 52 1 40-1 53
95%CI
46-61 48-63 51 -65 54-68 56-71 59-74 62-77 65-79 68-82 70-84 72-87 75-90 78-92 81 -95 83-98
85-1 00 88-1 03 90-1 04 93-1 07 95-109 97-1 1 2 99-1 1 4
1 02-1 1 7 1 05-1 1 9 1 08-1 22 1 1 0-1 25 1 1 3-1 28 1 1 6-1 30 1 1 9-1 33 1 22-1 36 1 24-1 39 1 27-1 42 1 30-1 44 1 33-1 47 1 36-1 50 1 38-1 53 1 39-1 54
Source : Standardization data and analysis results from the Wechsler Adult Intelligence Scale
Fourth Edition (W AIS-IV). Copyright © 2008 by NCS Pearson, Inc. Used with permission. All rights reserved.
40