Philippine Stock Exchange, Inc. 3/F Makati Stock Exchange ...

UNITED STATESSECURITIES AND EXCHANGE COMMISSION
Washington, D.C. 20549
Form 10-Q(Mark One)x QUARTERLY REPORT PURSUANT TO SECTION 13 OR 15(d) OF THE SECURITIES EXCHANGE ACT OF 1934
For the quarterly period ended March 31, 2019
OR
¨ TRANSITION REPORT PURSUANT TO SECTION 13 OR 15(d) OF THE SECURITIES EXCHANGE ACT OF 1934For the transition period from to
Commission File Number 001-38735
CONTURA ENERGY, INC.(Exact name of registrant as specified in its charter)
Delaware 81-3015061(State or other jurisdiction of incorporation or organization) (I.R.S. Employer Identification Number)
340 Martin Luther King Jr. Blvd.
Bristol, Tennessee 37620(Address of principal executive offices, zip code)
(423) 573-0300(Registrant’s telephone number, including area code)
Indicate by check mark whether the registrant (1) has filed all reports required to be filed by Section 13 or 15(d) of the Securities Exchange Act of 1934 duringthe preceding 12 months (or for such shorter period that the registrant was required to file such reports), and (2) has been subject to such filing requirements for thepast 90 days. xYes ¨No
Indicate by check mark whether the registrant has submitted electronically and posted on its corporate Web site, if any, every Interactive Data File required tobe submitted and posted pursuant to Rule 405 of Regulation S-T (Sec.232.405 of this chapter) during the preceding 12 months (or for such shorter period that theregistrant was required to submit and post such files). xYes ¨No
Indicate by check mark whether the registrant is a large accelerated filer, an accelerated filer, a non-accelerated filer, a smaller reporting company or anemerging growth company. See the definitions of “large accelerated filer,” “accelerated filer,” “smaller reporting company,” and “emerging growth company” inRule 12b-2 of the Exchange Act.
Large accelerated filer ¨ Accelerated filer ¨
Non-accelerated filer x Smaller reporting company ¨
Emerging growth company ¨
If an emerging growth company, indicate by check mark if the registrant has elected not to use the extended transition period for complying with any new orrevised financial accounting standards provided pursuant to Section 13(a) of the Exchange Act. ¨
Indicate by check mark whether the registrant is a shell company (as defined in Rule 12b-2 of the Exchange Act) ¨Yes x No

Securities registered pursuant to Section 12(b) of the Act:
Title of each class Trading Symbol(s) Name of each exchange on which registeredCommon Stock CTRA New York Stock Exchange
Number of shares of the registrant’s Common Stock, $0.01 par value, outstanding as of April 30, 2019: 19,187,073
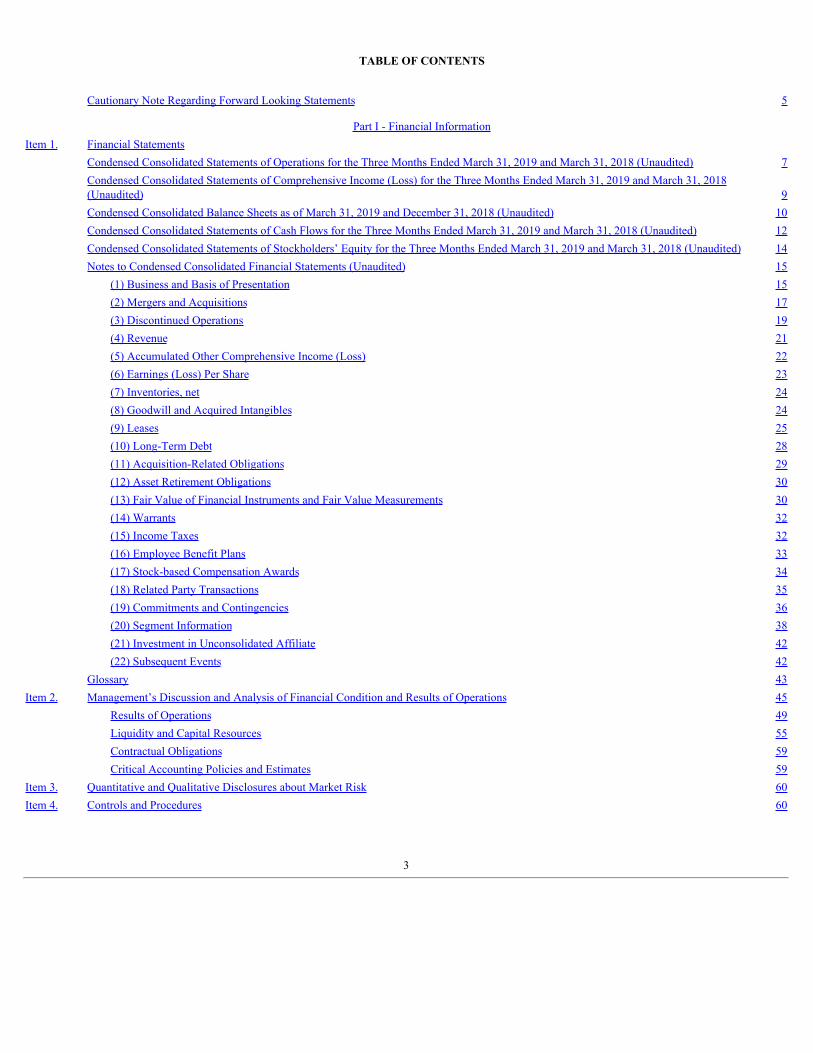
TABLE OF CONTENTS
Cautionary Note Regarding Forward Looking Statements 5 Part I - Financial Information Item 1. Financial Statements Condensed Consolidated Statements of Operations for the Three Months Ended March 31, 2019 and March 31, 2018 (Unaudited) 7
Condensed Consolidated Statements of Comprehensive Income (Loss) for the Three Months Ended March 31, 2019 and March 31, 2018(Unaudited) 9
Condensed Consolidated Balance Sheets as of March 31, 2019 and December 31, 2018 (Unaudited) 10 Condensed Consolidated Statements of Cash Flows for the Three Months Ended March 31, 2019 and March 31, 2018 (Unaudited) 12 Condensed Consolidated Statements of Stockholders’ Equity for the Three Months Ended March 31, 2019 and March 31, 2018 (Unaudited) 14 Notes to Condensed Consolidated Financial Statements (Unaudited) 15 (1) Business and Basis of Presentation 15 (2) Mergers and Acquisitions 17 (3) Discontinued Operations 19 (4) Revenue 21 (5) Accumulated Other Comprehensive Income (Loss) 22 (6) Earnings (Loss) Per Share 23 (7) Inventories, net 24 (8) Goodwill and Acquired Intangibles 24 (9) Leases 25 (10) Long-Term Debt 28 (11) Acquisition-Related Obligations 29 (12) Asset Retirement Obligations 30 (13) Fair Value of Financial Instruments and Fair Value Measurements 30 (14) Warrants 32 (15) Income Taxes 32 (16) Employee Benefit Plans 33 (17) Stock-based Compensation Awards 34 (18) Related Party Transactions 35 (19) Commitments and Contingencies 36 (20) Segment Information 38 (21) Investment in Unconsolidated Affiliate 42 (22) Subsequent Events 42 Glossary 43Item 2. Management’s Discussion and Analysis of Financial Condition and Results of Operations 45 Results of Operations 49 Liquidity and Capital Resources 55 Contractual Obligations 59 Critical Accounting Policies and Estimates 59Item 3. Quantitative and Qualitative Disclosures about Market Risk 60Item 4. Controls and Procedures 60
3

Part II - Other Information Item 1. Legal Proceedings 61Item 1A. Risk Factors 61Item 2. Unregistered Sales of Equity Securities and Use of Proceeds 61Item 4. Mine Safety Disclosures 61Item 6. Exhibits 61
4

Table of Contents
CAUTIONARY NOTE REGARDING FORWARD LOOKING STATEMENTS
This report includes statements of our expectations, intentions, plans and beliefs that constitute “forward-looking statements”. These statements, which involverisks and uncertainties, relate to analyses and other information that are based on forecasts of future results and estimates of amounts not yet determinable and mayalso relate to our future prospects, developments and business strategies. We have used the words “anticipate”, “believe”, “could”, “estimate”, “expect”, “intend”,“may”, “plan”, “predict”, “project”, “should” and similar terms and phrases, including references to assumptions, in this report to identify forward-lookingstatements. These forward-looking statements are made based on expectations and beliefs concerning future events affecting us and are subject to uncertainties andfactors relating to our operations and business environment, all of which are difficult to predict and many of which are beyond our control, that could cause ouractual results to differ materially from those matters expressed in or implied by these forward-looking statements.
The following factors are among those that may cause actual results to differ materially from our forward-looking statements:
• the financial performance of the company following the Merger with Alpha Natural Resources Holdings, Inc. and ANR, Inc. (the “Merger” or the “AlphaMerger”);
• our liquidity, results of operations and financial condition;• depressed levels or declines in coal prices;• worldwide market demand for coal, steel, and electricity, including demand for U.S. coal exports, and competition in coal markets;• the imposition or continuation of barriers to trade, such as tariffs;• utilities switching to alternative energy sources such as natural gas, renewables and coal from basins where we do not operate;• reductions or increases in customer coal inventories and the timing of those changes;• our production capabilities and costs;• inherent risks of coal mining beyond our control;• changes in, interpretations of, or implementations of domestic or international tax or other laws and regulations, including the Tax Cuts and Jobs Act and
its related regulations;• changes in domestic or international environmental laws and regulations, and court decisions, including those directly affecting our coal mining and
production, and those affecting our customers’ coal usage, including potential climate change initiatives;• our relationships with, and other conditions affecting, our customers, including the inability to collect payments from our customers if their
creditworthiness declines;• changes in, renewal or acquisition of, terms of and performance of customers under coal supply arrangements and the refusal by our customers to receive
coal under agreed contract terms;• our ability to obtain, maintain or renew any necessary permits or rights, and our ability to mine properties due to defects in title on leasehold interests;• attracting and retaining key personnel and other employee workforce factors, such as labor relations;• funding for and changes in employee benefit obligations;• cybersecurity attacks or failures, threats to physical security, extreme weather conditions or other natural disasters;• reclamation and mine closure obligations;• our assumptions concerning economically recoverable coal reserve estimates;• our ability to negotiate new United Mine Workers of America wage agreements on terms acceptable to us, increased unionization of our workforce in the
future, and any strikes by our workforce;• disruptions in delivery or changes in pricing from third party vendors of key equipment and materials that are necessary for our operations, such as diesel
fuel, steel products, explosives, tires and purchased coal;• inflationary pressures on supplies and labor and significant or rapid increases in commodity prices;• railroad, barge, truck and other transportation availability, performance and costs;• disruption in third party coal supplies;• the consummation of financing or refinancing transactions, acquisitions or dispositions and the related effects on our business and financial position;• our indebtedness and potential future indebtedness;• our ability to generate sufficient cash or obtain financing to fund our business operations; and• our ability to obtain or renew surety bonds on acceptable terms or maintain our current bonding status; and• other factors, including the other factors discussed in the “Management’s Discussion and Analysis of Financial Condition and Results of Operations”
section of this Report and the “ Management’s Discussion and Analysis of Financial Condition and Results of Operations ”, and “ Risk Factors ” sectionsour Annual Report on Form 10-K for the year ended December 31, 2018.
5

Table of Contents
The factors identified above are not exhaustive. We caution readers not to place undue reliance on any forward-looking statements, which are based only oninformation currently available to us and speak only as of the dates on which they are made. When considering these forward-looking statements, you should keepin mind the cautionary statements in this report. We do not undertake any responsibility to release publicly any revisions to these forward-looking statements totake into account events or circumstances that occur after the date of this report. Additionally, we do not undertake any responsibility to update you on theoccurrence of any unanticipated events, which may cause actual results to differ from those expressed or implied by the forward-looking statements contained inthis report.
6

Table of Contents
Part I - Financial Information
Item 1. Financial StatementsCONTURA ENERGY, INC. AND SUBSIDIARIES
CONDENSED CONSOLIDATED STATEMENTS OF OPERATIONS (Unaudited)(Amounts in thousands, except share and per share data)
Three Months Ended March 31,
2019 2018Revenues:
Coal revenues $ 606,960 $ 478,365Other revenues 2,154 3,967
Total revenues 609,114 482,332Costs and expenses:
Cost of coal sales (exclusive of items shown separately below) 438,510 295,078Freight and handling costs 77,184 75,666Depreciation, depletion and amortization 61,271 11,588Accretion on asset retirement obligations 6,232 2,460Amortization of acquired intangibles, net (6,683) 10,206Selling, general and administrative expenses (exclusive of depreciation, depletion and amortizationshown separately above) 20,951 19,157Merger related costs 831 460Total other operating (income) loss:
Mark-to-market adjustment for acquisition-related obligations 1,936 —Other income (8,899) (99)
Total costs and expenses 591,333 414,516Income from operations 17,781 67,816Other income (expense):
Interest expense (15,155) (9,205)Interest income 1,936 131Equity loss in affiliates (484) (63)Miscellaneous income, net (866) (313)
Total other expense, net (14,569) (9,450)Income from continuing operations before income taxes 3,212 58,366Income tax benefit (expense) 4,778 (66)Net income from continuing operations 7,990 58,300Discontinued operations:
Loss from discontinued operations before income taxes (1,590) (1,359)Income tax benefit from discontinued operations 415 —Loss from discontinued operations (1,175) (1,359)
Net income $ 6,815 $ 56,941
Basic income (loss) per common share:Income from continuing operations $ 0.42 $ 6.11Loss from discontinued operations (0.06) (0.15)Net income $ 0.36 $ 5.96
Diluted income (loss) per common shareIncome from continuing operations $ 0.41 $ 5.66
7

Table of Contents
Loss from discontinued operations (0.06) (0.13)Net income $ 0.35 $ 5.53
Weighted average shares - basic 18,894,315 9,548,613Weighted average shares - diluted 19,538,629 10,292,607
Refer to accompanying Notes to Condensed Consolidated Financial Statements.
8

Table of Contents
CONTURA ENERGY, INC. AND SUBSIDIARIESCONDENSED CONSOLIDATED STATEMENTS OF COMPREHENSIVE INCOME (LOSS) (Unaudited)
(Amounts in thousands)
Three Months Ended March 31,
2019 2018
Net income $ 6,815 $ 56,941Other comprehensive income, net of tax: Employee benefit plans:
Amortization of and adjustments to employee benefit costs $ 239 $ 37Income tax expense (62) —
Total other comprehensive income, net of tax $ 177 $ 37
Total comprehensive income $ 6,992 $ 56,978
Refer to accompanying Notes to Condensed Consolidated Financial Statements.
9

Table of Contents
CONTURA ENERGY, INC. AND SUBSIDIARIESCONDENSED CONSOLIDATED BALANCE SHEETS (Unaudited)
(Amounts in thousands, except share and per share data)
March 31, 2019 December 31, 2018Assets
Current assets:
Cash and cash equivalents $ 181,953 $ 233,599Trade accounts receivable, net of allowance for doubtful accounts of $0 as of March 31, 2019 and December 31,2018 319,687 292,617Inventories, net 145,058 121,965Prepaid expenses and other current assets 150,914 158,945Current assets - discontinued operations 22,806 22,475Total current assets 820,418 829,601Property, plant, and equipment, net of accumulated depreciation and amortization of $163,603 and $106,766 as ofMarch 31, 2019 and December 31, 2018 678,549 699,990Operating lease right-of-use assets 13,025 —Owned and leased mineral rights, net of accumulated depletion and amortization of $15,698 and $11,390 as ofMarch 31, 2019 and December 31, 2018 532,476 528,232Goodwill 107,534 95,624Other acquired intangibles, net of accumulated amortization of $26,917 and $20,267 as of March 31, 2019 andDecember 31, 2018 147,886 154,584Long-term restricted cash 233,488 227,173Deferred income taxes 34,438 27,179Other non-current assets 188,237 183,675Total assets $ 2,756,051 $ 2,746,058
Liabilities and Stockholders’ Equity
Current liabilities:
Current portion of long-term debt $ 43,105 $ 42,743Operating lease liabilities - current 3,447 —Acquisition-related obligations - current 26,122 27,334Trade accounts payable 109,854 114,568Accrued expenses and other current liabilities 150,812 148,699Current liabilities - discontinued operations 21,854 21,892Total current liabilities 355,194 355,236Long-term debt 540,387 545,269Operating lease liabilities - long-term 9,578 —Acquisition-related obligations - long-term 75,218 72,996Workers’ compensation and black lung obligations 248,134 249,294Pension obligations 179,444 180,802Asset retirement obligations 215,415 203,694Deferred income taxes 12,816 15,118Other non-current liabilities 39,126 52,415Non-current liabilities - discontinued operations 95 94Total liabilities 1,675,407 1,674,918Commitments and Contingencies (Note 19)
Stockholders’ Equity Preferred stock - par value $0.01, 5.0 million shares authorized, none issued — —
10
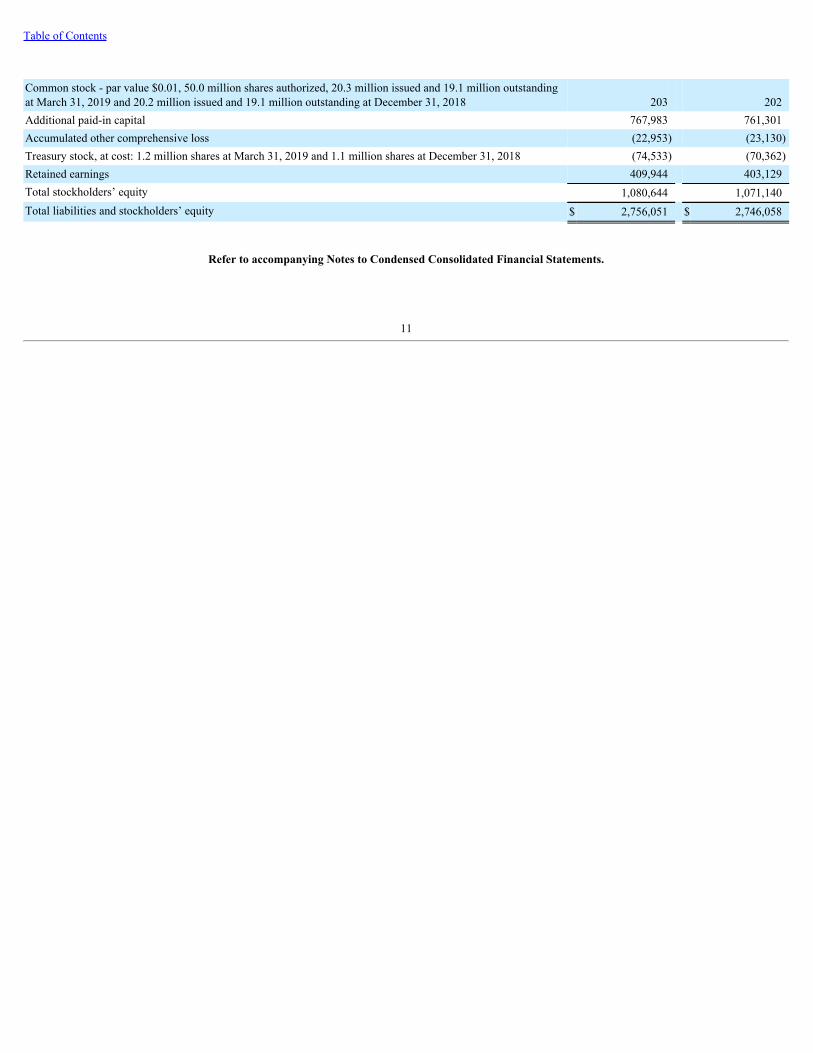
Table of Contents
Common stock - par value $0.01, 50.0 million shares authorized, 20.3 million issued and 19.1 million outstandingat March 31, 2019 and 20.2 million issued and 19.1 million outstanding at December 31, 2018 203 202Additional paid-in capital 767,983 761,301Accumulated other comprehensive loss (22,953) (23,130)Treasury stock, at cost: 1.2 million shares at March 31, 2019 and 1.1 million shares at December 31, 2018 (74,533) (70,362)Retained earnings 409,944 403,129Total stockholders’ equity 1,080,644 1,071,140Total liabilities and stockholders’ equity $ 2,756,051 $ 2,746,058
Refer to accompanying Notes to Condensed Consolidated Financial Statements.
11

Table of Contents
CONTURA ENERGY, INC. AND SUBSIDIARIESCONDENSED CONSOLIDATED STATEMENTS OF CASH FLOWS (Unaudited)
(Amounts in thousands)
Three Months Ended March 31,
2019 2018
Operating activities: Net income $ 6,815 $ 56,941Adjustments to reconcile net income to net cash provided by (used in) operating activities:
Depreciation, depletion and amortization 61,271 11,588Amortization of acquired intangibles, net (6,683) 10,206Accretion of acquisition-related obligations discount 1,575 1,475Amortization of debt issuance costs and accretion of debt discount 3,262 744Mark-to-market adjustment for acquisition-related obligations 1,936 —Gain on assets acquired in an exchange transaction (9,083) —Accretion on asset retirement obligations 6,232 2,460Employee benefit plans, net 3,926 2,700Deferred income taxes (5,597) —Stock-based compensation 5,319 4,811Equity loss in affiliates 484 —Other, net (25) (116)Changes in operating assets and liabilities (54,821) (121,144)Net cash provided by (used in) operating activities 14,611 (30,335)
Investing activities: Capital expenditures (41,084) (19,441)Payments on disposal of assets — (10,000)Purchases of investment securities - held to maturity (4,308) (1,437)Maturity of investment securities - held to maturity 3,202 —Capital contributions to equity affiliates (3,536) (525)Other, net 403 55Net cash used in investing activities (45,323) (31,348)
Financing activities: Principal repayments of debt (6,875) (1,000)Principal repayments of financing lease obligations (635) (56)Common stock repurchases and related expenses (4,171) (4,835)Other, net (105) (418)Net cash used in financing activities (11,786) (6,309)Net decrease in cash and cash equivalents and restricted cash (42,498) (67,992)Cash and cash equivalents and restricted cash at beginning of period 477,246 193,960
Cash and cash equivalents and restricted cash at end of period $ 434,748 $ 125,968
The following table provides a reconciliation of cash and cash equivalents and restricted cash reported within the Condensed Consolidated Balance Sheets thatsum to the total of the same such amounts shown in the Condensed Consolidated Statements of Cash Flows.
12

Table of Contents
As of March 31,
2019 2018
Cash and cash equivalents $ 181,953 $ 72,076Short-term restricted cash (included in Prepaid expenses and other current assets) 19,307 11,618Long-term restricted cash 233,488 42,274
Total cash and cash equivalents and restricted cash shown in the Condensed Consolidated Statementsof Cash Flows $ 434,748 $ 125,968
Refer to accompanying Notes to Condensed Consolidated Financial Statements.
13

Table of Contents
CONTURA ENERGY, INC. AND SUBSIDIARIESCONDENSED CONSOLIDATED STATEMENTS OF STOCKHOLDERS' EQUITY (Unaudited)
(Amounts in thousands)
Common Stock Additional
Paid-in Capital
Accumulated Other
ComprehensiveIncome (Loss)
TreasuryStock at Cost Retained Earnings
TotalStockholders’
Equity
Balances, December 31, 2017 $ 108 $ 40,616 $ (1,948) $ (50,092) $ 103,964 $ 92,648Net income — — — — 56,941 56,941Other comprehensive income, net — — 37 — — 37Stock-based compensation and net issuance ofcommon stock for share vesting — 4,479 — — — 4,479Common stock repurchases and related expenses — — — (4,835) — (4,835)Balances, March 31, 2018 $ 108 $ 45,095 $ (1,911) $ (54,927) $ 160,905 $ 149,270
Balances, December 31, 2018 $ 202 $ 761,301 $ (23,130) $ (70,362) $ 403,129 $ 1,071,140Net income — — — — 6,815 6,815Other comprehensive income, net — — 177 — — 177Stock-based compensation and net issuance ofcommon stock for share vesting — 6,377 — — — 6,377Exercise of stock options 1 305 — — — 306Common stock repurchases and related expenses — — — (4,171) — (4,171)
Balances, March 31, 2019 $ 203 $ 767,983 $ (22,953) $ (74,533) $ 409,944 $ 1,080,644
Refer to accompanying Notes to Condensed Consolidated Financial Statements.
14

Table of ContentsCONTURA ENERGY, INC. AND SUBSIDIARIES
Notes to Condensed Consolidated Financial Statements(Unaudited, amounts in thousands except share and per share data)
( 1 ) Business and Basis of Presentation
Business
Contura Energy, Inc. (“Contura” or the “Company”) is a Tennessee-based coal supplier with affiliate mining operations across major coal basins inPennsylvania, Virginia and West Virginia. With customers across the globe, high-quality reserves and significant port capacity, Contura reliably supplies bothmetallurgical coal to produce steel and thermal coal to generate power. Contura was formed to acquire and operate certain of Alpha Natural Resources, Inc.’s(“Alpha”) core coal operations, as part of the Alpha Restructuring. Contura began operations on July 26, 2016 and currently operates mines in the NorthernAppalachia and Central Appalachia regions.
A Merger with ANR, Inc. (“ANR”) and Alpha Natural Resources Holdings, Inc. (“Holdings”, and, together with ANR, the "Alpha Companies”) wascompleted on November 9, 2018 (the “Merger” or the “Alpha Merger”). Refer to Note 2 for information on terms of the definitive merger agreement (the “MergerAgreement”). Upon the consummation of the transactions contemplated by the Merger Agreement, Contura began trading on the New York Stock Exchange underthe ticker “CTRA.”
Basis of Presentation
Together, the condensed consolidated statements of operations, comprehensive (loss) income, balance sheet, cash flows and stockholders’ equity for theCompany are referred to as the “Condensed Consolidated Financial Statements.” The Condensed Consolidated Financial Statements are also referenced acrossperiods as “Condensed Consolidated Balance Sheets,” “Condensed Consolidated Statements of Operations,” and “Condensed Consolidated Statements of CashFlows.”
The Condensed Consolidated Financial Statements include all wholly-owned subsidiaries’ results of operations for the three months ended March 31, 2019and 2018 . All significant intercompany transactions have been eliminated in consolidation.
On November 9, 2018, the Company completed the Alpha Merger and the Alpha Companies’ financial results are not included in the Condensed ConsolidatedFinancial Statements in periods prior to November 9, 2018. Refer to Note 2 for information on the Alpha Merger.
On December 8, 2017, the Company closed a transaction with Blackjewel L.L.C. (“Buyer”) to sell the Eagle Butte and Belle Ayr mines located in the PowderRiver Basin (“PRB”), Wyoming, along with related coal reserves, equipment, infrastructure and other real properties. The PRB results of operations and financialposition are reported as discontinued operations in the Condensed Consolidated Financial Statements. Refer to Note 3 for further information on discontinuedoperations.
The accompanying interim Condensed Consolidated Financial Statements are unaudited and have been prepared in accordance with accounting principlesgenerally accepted in the United States (“U.S. GAAP”) and in accordance with the rules and regulations of the United States Securities and Exchange Commission(“SEC”) for Form 10-Q. Such rules and regulations allow the omission of certain information and footnote disclosures normally included in the financialstatements prepared in accordance with U.S. GAAP as long as the financial statements are not misleading. In the opinion of management, these interim CondensedConsolidated Financial Statements reflect all normal and recurring adjustments necessary for a fair presentation of the results for the periods presented. Results ofoperations for the three months ended March 31, 2019 are not necessarily indicative of the results to be expected for the year ending December 31, 2019 or anyother period. These interim Condensed Consolidated Financial Statements should be read in conjunction with the Company’s Consolidated Financial Statementsand related notes included in the Company’s Annual Report on Form 10-K for the year ended December 31, 2018.
Reclassifications
Accretion on asset retirement obligations has been reclassified in the prior year from cost of coal sales to a separate line item in the Condensed ConsolidatedStatements of Operations to conform to the current year presentation.
New Accounting Pronouncements
15
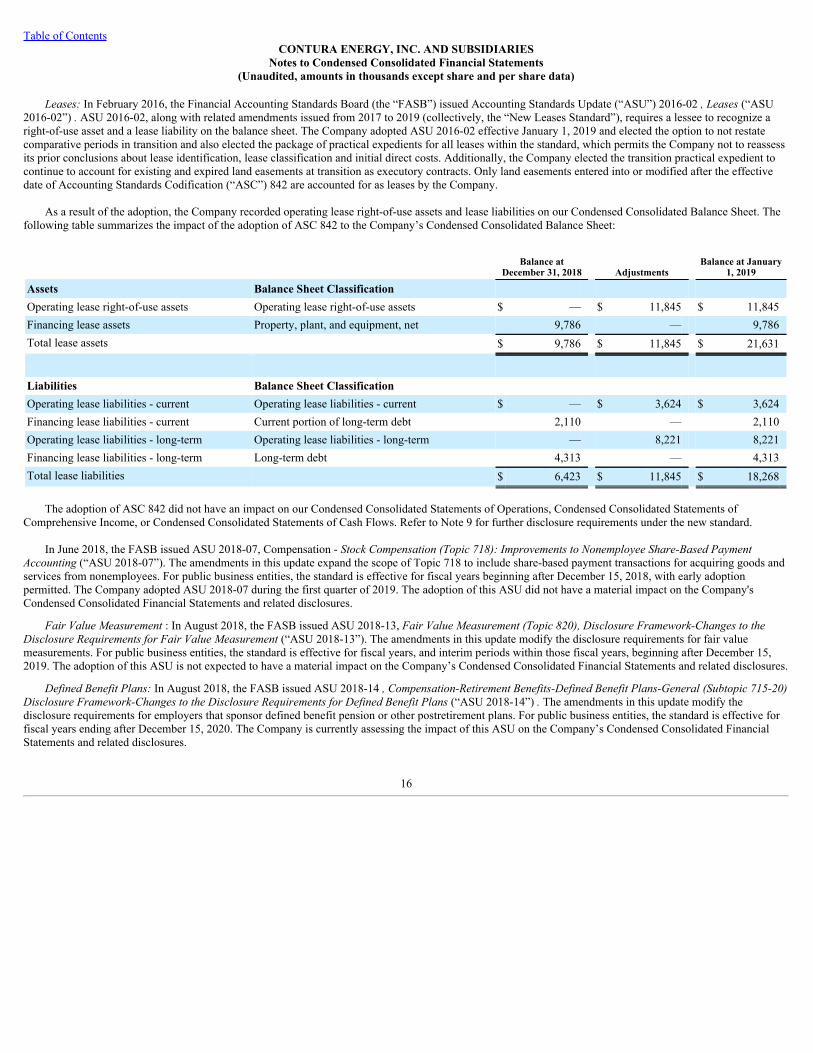
Table of ContentsCONTURA ENERGY, INC. AND SUBSIDIARIES
Notes to Condensed Consolidated Financial Statements(Unaudited, amounts in thousands except share and per share data)
Leases: In February 2016, the Financial Accounting Standards Board (the “FASB”) issued Accounting Standards Update (“ASU”) 2016-02 , Leases (“ASU2016-02”) . ASU 2016-02, along with related amendments issued from 2017 to 2019 (collectively, the “New Leases Standard”), requires a lessee to recognize aright-of-use asset and a lease liability on the balance sheet. The Company adopted ASU 2016-02 effective January 1, 2019 and elected the option to not restatecomparative periods in transition and also elected the package of practical expedients for all leases within the standard, which permits the Company not to reassessits prior conclusions about lease identification, lease classification and initial direct costs. Additionally, the Company elected the transition practical expedient tocontinue to account for existing and expired land easements at transition as executory contracts. Only land easements entered into or modified after the effectivedate of Accounting Standards Codification (“ASC”) 842 are accounted for as leases by the Company.
As a result of the adoption, the Company recorded operating lease right-of-use assets and lease liabilities on our Condensed Consolidated Balance Sheet. Thefollowing table summarizes the impact of the adoption of ASC 842 to the Company’s Condensed Consolidated Balance Sheet:
Balance at
December 31, 2018 Adjustments Balance at January
1, 2019
Assets Balance Sheet Classification
Operating lease right-of-use assets Operating lease right-of-use assets $ — $ 11,845 $ 11,845Financing lease assets Property, plant, and equipment, net 9,786 — 9,786Total lease assets $ 9,786 $ 11,845 $ 21,631
Liabilities Balance Sheet Classification Operating lease liabilities - current Operating lease liabilities - current $ — $ 3,624 $ 3,624Financing lease liabilities - current Current portion of long-term debt 2,110 — 2,110Operating lease liabilities - long-term Operating lease liabilities - long-term — 8,221 8,221Financing lease liabilities - long-term Long-term debt 4,313 — 4,313Total lease liabilities $ 6,423 $ 11,845 $ 18,268
The adoption of ASC 842 did not have an impact on our Condensed Consolidated Statements of Operations, Condensed Consolidated Statements ofComprehensive Income, or Condensed Consolidated Statements of Cash Flows. Refer to Note 9 for further disclosure requirements under the new standard.
In June 2018, the FASB issued ASU 2018-07, Compensation - Stock Compensation (Topic 718): Improvements to Nonemployee Share-Based PaymentAccounting (“ASU 2018-07”). The amendments in this update expand the scope of Topic 718 to include share-based payment transactions for acquiring goods andservices from nonemployees. For public business entities, the standard is effective for fiscal years beginning after December 15, 2018, with early adoptionpermitted. The Company adopted ASU 2018-07 during the first quarter of 2019. The adoption of this ASU did not have a material impact on the Company'sCondensed Consolidated Financial Statements and related disclosures.
Fair Value Measurement : In August 2018, the FASB issued ASU 2018-13, Fair Value Measurement (Topic 820), Disclosure Framework-Changes to theDisclosure Requirements for Fair Value Measurement (“ASU 2018-13”). The amendments in this update modify the disclosure requirements for fair valuemeasurements. For public business entities, the standard is effective for fiscal years, and interim periods within those fiscal years, beginning after December 15,2019. The adoption of this ASU is not expected to have a material impact on the Company’s Condensed Consolidated Financial Statements and related disclosures.
Defined Benefit Plans: In August 2018, the FASB issued ASU 2018-14 , Compensation-Retirement Benefits-Defined Benefit Plans-General (Subtopic 715-20)Disclosure Framework-Changes to the Disclosure Requirements for Defined Benefit Plans (“ASU 2018-14”) . The amendments in this update modify thedisclosure requirements for employers that sponsor defined benefit pension or other postretirement plans. For public business entities, the standard is effective forfiscal years ending after December 15, 2020. The Company is currently assessing the impact of this ASU on the Company’s Condensed Consolidated FinancialStatements and related disclosures.
16

Table of ContentsCONTURA ENERGY, INC. AND SUBSIDIARIES
Notes to Condensed Consolidated Financial Statements(Unaudited, amounts in thousands except share and per share data)
( 2 ) Mergers and Acquisitions
Merger with Alpha Natural Resources Holdings, Inc. and ANR, Inc.
On November 9, 2018, Contura, along with the Alpha Companies, completed the Merger in which the Company acquired 100% of the outstanding Class C-1shares of ANR and the 100% of the outstanding shares of Holdings. Under the terms of the Merger Agreement, the Alpha Companies stockholders received 0.4417Contura common shares for each ANR Class C-1 share and each share of common stock of Holdings they owned, representing approximately 48.5% ownership inthe merged entity, or an aggregate 9,378,199 shares of Contura common stock. Prior to the closing of the transaction, the Alpha Companies stockholders alsoreceived a special cash dividend (the “Dividend”) in an amount equal to $2.725 for each Class C-1 share and each share of common stock of Holdings they owned.Each outstanding share of Class C-2 common stock of ANR (held exclusively by Holdings) was canceled. The fair value of the issued Contura common stock wasequal to the $75.00 closing price of Contura’s common stock on the day of acquisition.
During 2018, the Company recorded $3,918 as a reduction to equity for costs incurred in connection with the submission of the registration statement on FormS-4 related to (i) legal fees for drafting the registration statement and other legal advice directly related to the registration statement, (ii) financial reportingadvisory fees directly related to the registration statement including preparation of the pro forma financial statements and other financial information included inthe registration statement and (iii) and other registration related fees.
Purchase Price
The following table presents the details of the preliminary purchase price allocation of $688,534 :
Provisional as of March 31,2019 (3)
Fair value of common stock issued $ 703,365Issued and redeemed equity awards (1) 32,217Net balances due to Alpha deemed effectively settled (47,048)
Purchase Price (2) $ 688,534
(1) Amount includes $20,681 of tax withholdings related to share settlements of option exercises, $1,905 paid to certain former ANR employees pursuant tochange in control provisions, $6,570 of shares repurchased from certain former ANR directors pursuant to the Merger Agreement, $3,056 of pre-Merger serviceperiod value of RSU ANR employee awards and $5 in cash paid in lieu of fractional shares of Contura common stock issued pursuant to the MergerAgreement. Of these amounts, $24,074 were obligations assumed and paid by Contura.
(2) Purchase price of $688,534 is comprised of equity consideration of $664,460 and cash consideration of $24,074 .(3) There were no measurement-period adjustments recorded during the period from the acquisition date to March 31, 2019 that impacted the purchase price.
Preliminary Allocation of Purchase Price
As of March 31, 2019 , the fair value allocation for the acquisition is preliminary and will be finalized when the valuation and the related internal controls overfinancial reporting are completed. Differences between the preliminary and final allocation could be material. The Company’s estimates and assumptions aresubject to change during the measurement period (up to one year from the closing of the acquisition), as the Company finalizes the accounting for the purchaseprice of the assets acquired and liabilities assumed. The primary areas of the purchase price allocation that are not yet finalized relate to the areas of property plantand equipment, owned and leased mineral rights, inventory, acquired intangibles, goodwill, asset retirement obligations, taxes, accounts payable, certain actuarialliabilities and other contingencies. The Company continues to review the significant amount of data and assumptions used in these areas which could cause areallocation of the purchase price. The below table is a preliminary allocation of the assets acquired and the liabilities the Company assumed in the acquisition asof November 9, 2018, the date of the acquisition, along with adjustments through the first quarter of 2019 resulting in the preliminary allocation as of March 31,2019 .
17

Table of ContentsCONTURA ENERGY, INC. AND SUBSIDIARIES
Notes to Condensed Consolidated Financial Statements(Unaudited, amounts in thousands except share and per share data)
The total purchase price has been preliminarily allocated to the net tangible and intangible assets of Alpha Companies as follows:
Provisional as ofNovember 9, 2018 Adjustments
Provisional as of March 31,2019
Cash and cash equivalents $ 29,939 $ — $ 29,939Trade and other receivables 60,714 — 60,714Inventories 85,635 — 85,635Short-term restricted cash 10,592 — 10,592Other current assets 38,495 (367) 38,128Property, plant, and equipment, net 504,852 (1,216) 503,636Owned and leased mineral rights 516,201 (966) 515,235Other intangible assets 154,041 — 154,041Long-term restricted cash 182,049 — 182,049Long-term restricted investments 28,809 — 28,809Other non-current assets 68,022 — 68,022
Total assets $ 1,679,349 $ (2,549) $ 1,676,800
Accounts payable 69,049 (1,358) 67,691Accrued expenses and other current liabilities 76,774 2,028 78,802Long-term debt, including current portion 144,832 — 144,832Acquisition related obligations 74,346 — 74,346Pension obligations 158,005 — 158,005Asset retirement obligation, including current portion 163,636 12,718 176,354Deferred income taxes, including current portion 134,924 (4,027) 130,897Other intangible liabilities 57,219 — 57,219Other non-current liabilities 207,654 — 207,654
Total liabilities $ 1,086,439 $ 9,361 $ 1,095,800
Goodwill $ 95,624 $ 11,910 $ 107,534
Allocation of purchase price $ 688,534 $ — $ 688,534
During the three months ended March 31, 2019 , the Company recorded measurement-period adjustments to the provisional opening balance sheet as shown inthe table above. Adjustments were made primarily to reflect updated estimates of asset retirement obligations and the deferred tax impacts of all adjustments made.There were no material measurement-period adjustments impacting current-period earnings that would have been recorded in the previous reporting period if theadjustments to the provisional amounts had been recognized as of the acquisition date.
In connection with Merger, the Company originally recorded provisional goodwill of $95,624 , which represented the excess of the purchase price over theestimated fair value of tangible and intangible asset acquired, net of liabilities assumed. As a result of measurement-period adjustments recorded during the threemonths ended March 31, 2019, the provisional amount of goodwill increased by $11,910 resulting in provisional goodwill of $107,534 as of March 31, 2019 . Thegoodwill is attributed primarily to the following factors: (i) anticipated operating and administrative synergies, and (ii) deferred income taxes arising from thedifferences between the preliminary purchase price allocated to the assets and liabilities acquired based on fair value and the tax basis of these assets and liabilities.The goodwill is not deductible for tax purposes. The Company’s provisional estimate of goodwill is not yet finalized and has been allocated to the Company’sCAPP-Met reportable segment.
The following table represents the intangible assets and the weighted-average amortization periods as of the acquisition date:
18

Table of ContentsCONTURA ENERGY, INC. AND SUBSIDIARIES
Notes to Condensed Consolidated Financial Statements(Unaudited, amounts in thousands except share and per share data)
Provisional Amount
Weighted-AverageAmortization Period
( In Years )Mining permits $ 153,306 11.60Above-market coal supply agreements 735 1.03Below-market coal supply agreements (57,219) 2.10
Total acquired intangibles: $ 96,822 9.51
The Condensed Consolidated Statements of Operations include acquisition related expenses (on a pre-tax basis) of $831 and $315 in merger related costs forthe three months ended March 31, 2019 and 2018, respectively. Acquisition related expenses include professional fees related to legal, tax, advisory integrationservices and contract related matters.
The following unaudited pro forma information has been prepared for illustrative purposes only and assumes the Merger occurred on January 1, 2017. Theunaudited pro forma results have been prepared based on estimates and assumptions, which the Company believes are reasonable; however, they are notnecessarily indicative of the consolidated results of operations had the Merger occurred on January 1, 2017, or of future results of operations.
Three Months Ended March 31, 2018
As reported Pro formaTotal revenues $ 482,332 $ 626,749Income from continuing operations $ 58,300 $ 73,434
Basic income per common share: Income from continuing operations $ 6.11 $ 3.88
Diluted income per common share: Income from continuing operations $ 5.66 $ 3.73
Weighted average shares - basic 9,548,613 18,926,812Weighted average shares - diluted 10,292,607 19,670,806
These amounts have been calculated after applying the Company's accounting policies and adjusting the results of ANR to reflect the additional depreciation,amortization, depletion, and cost of coal sales that would have been charged assuming the fair value adjustments to property, plant and equipment, as well asintangibles, asset retirement obligations, and inventory had been applied at January 1, 2017, together with the consequential tax effects.
The pro forma results for the three months ended March 31, 2018 include $460 of merger-related costs primarily related to professional service fees.
( 3 ) Discontinued Operations
The discontinued operations include the Company’s former PRB segment. On December 8, 2017, the Company closed a transaction (“PRB Transaction”) withBlackjewel L.L.C. (“Blackjewel”) to sell the Eagle Butte and Belle Ayr mines located in the PRB. During the permit transfer period, the Company will maintainthe required reclamation bonds and related collateral. As of March 31, 2019 , the Company had outstanding surety bonds with a total face amount of $237,310 tosecure various obligations and commitments related to the PRB. The Powder River Basin Resource Council filed objections to the permit transfer with theWyoming Environmental Quality Council on November 16, 2018. The objections are scheduled to be heard on May 15 and 16, 2019. The Company currentlybelieves the objections are without merit. Once the permits have been transferred, the Company estimates approximately $9,100 comprised of short-term restrictedcash and short-term deposits will be returned to operating cash. If the permit transfer process is not completed as expected, it could have material, adverse effectson the Company.
19

Table of ContentsCONTURA ENERGY, INC. AND SUBSIDIARIES
Notes to Condensed Consolidated Financial Statements(Unaudited, amounts in thousands except share and per share data)
The major components of net income (loss) from discontinued operations in the Condensed Consolidated Statements of Operations are as follows:
Three Months Ended March 31,
2019 2018Revenues:
Total revenues (1) $ 96 $ 933
Costs and expenses: Other expenses $ 1,590 $ 1,299
Other non-major expense items, net $ 96 $ 993(1) Total revenues for the three months ended March 31, 2019 and 2018 consisted entirely of other revenues.
Refer to Note 6 for earnings (loss) per share information related to discontinued operations.
The major components of asset and liabilities that are classified as discontinued operations in the Condensed Consolidated Balance Sheets are as follows:
March 31, 2019 December 31, 2018Assets: Accounts Receivable $ 883 $ 5Prepaid expenses and other current assets $ 21,923 $ 22,470
Liabilities:
Trade accounts payable, accrued expenses and other current liabilities $ 21,854 $ 21,892Other non-current liabilities $ 95 $ 94
As of March 31, 2019 , the residual assets and liabilities related to the discontinued operations are primarily comprised of taxes for which Contura isconsidered to be the primary obligor but which the Buyer is contractually obligated to pay. The Company has recorded the taxes as a liability with an offsettingreceivable from the Buyer.
There were no major components of cash flows related to discontinued operations for the three months ended March 31, 2019 and 2018.
Blackjewel Surety Bonding
During the third quarter of 2018, Blackjewel L.L.C. (“Blackjewel”) procured surety bonds for a total of $220,500 to facilitate the transfer of record by theState of Wyoming of the Belle Ayr and Eagle Butte mine permits from Contura Coal West, LLC to Blackjewel as required by that certain Asset PurchaseAgreement dated as of December 7, 2017, among Blackjewel, Contura Energy, Inc. (“Contura”), Contura Coal West, LLC, Contura Wyoming Land, LLC, ConturaCoal Sales, LLC, and Contura Energy Services, LLC.
Contura agreed to backstop a total of $44,800 of Blackjewel’s bonding obligations with respect to the Belle Ayr and Eagle Butte permits by entering intosecondary general indemnification agreements and providing letters of credit totaling $18,800 to the sureties as collateral for Contura’s indemnificationobligations. This arrangement provides cost reimbursement for the issuing sureties. Indemnity bonds were issued by a third-party insurer in favor of Contura in atotal amount of $26,000 to insure Blackjewel’s performance obligations to Contura with respect to cancellation of the general indemnification agreements andreturn of the letters of credit.
Blackjewel agreed that, by June 30, 2019, it will (i) enter into financing arrangements of $44,800 to be held as collateral by the sureties and (ii) cause eachsurety to release and return each letter of credit and cancel the Contura general indemnification agreements.
20

Table of ContentsCONTURA ENERGY, INC. AND SUBSIDIARIES
Notes to Condensed Consolidated Financial Statements(Unaudited, amounts in thousands except share and per share data)
Blackjewel’s performance obligations are also collateralized by a security interest in mobile equipment granted to Contura under 8.6(c) of the Asset PurchaseAgreement. Further, in connection with this arrangement, approximately $8,000 in surety cash collateral previously supporting reclamation bonds was returned toContura by certain of its sureties.
During the third quarter of 2018, the Company recorded a guarantee within discontinued operations to account for the Blackjewel surety bonding arrangementwith no material impact on the Company's Condensed Consolidated Financial Statements.
( 4 ) Revenue
Revenue Recognition Accounting Policy
The Company adopted ASC 606, with a date of initial application of January 1, 2018, using the modified retrospective method. Refer to Note 2 “Summary ofSignificant Accounting Policies” and Note 5 “Revenue” in the Company’s Annual Report on Form 10-K for the year ended December 31, 2018 for the Company’spolicies regarding revenue recognition.
Disaggregation of Revenue from Contracts with Customers
ASC 606 requires that entities disclose disaggregated revenue information in categories (such as type of good or service, geography, market, type of contract,etc.) that depict how the nature, amount, timing, and uncertainty of revenue and cash flow are affected by economic factors. ASC 606 explains that the extent towhich an entity’s revenue is disaggregated depends on the facts and circumstances that pertain to the entity’s contracts with customers and that some entities mayneed to use more than one type of category to meet the objective for disaggregating revenue.
The Company earns revenues primarily through the sale of coal produced at Company operations and coal purchased from third parties. The Companyextracts, processes and markets met and thermal coal from surface and deep mines for sale to electric utilities, steel and coke producers, and industrial customers.The Company conducts mining operations only in the United States with mines in Northern and Central Appalachia. The Company has four reportable segments:CAPP - Met, CAPP - Thermal, NAPP, and Trading and Logistics. In addition to the four reportable segments, the All Other category includes general corporateoverhead and corporate assets and liabilities, the elimination of certain intercompany activity, and the Company’s discontinued operations. Refer to Note 20 forfurther segment information.
The following tables disaggregate the Company’s coal revenues by segment and by met and thermal coal to depict how the nature, amount, timing, anduncertainty of the Company’s coal revenues and cash flows are affected by economic factors:
Three Months Ended March 31, 2019
CAPP - Met CAPP - Thermal NAPP Trading andLogistics Consolidated
Met $ 335,720 $ 6,414 $ 1,935 $ 53,588 $ 397,657Thermal 10,101 50,901 68,920 2,197 132,119Freight and handling fulfillment revenues — — — 77,184 77,184Total coal revenues $ 345,821 $ 57,315 $ 70,855 $ 132,969 $ 606,960
Three Months Ended March 31, 2018
CAPP - Met CAPP - Thermal NAPP Trading andLogistics Consolidated
Met $ 133,432 $ — $ 6,546 $ 206,672 $ 346,650Thermal 1,137 — 54,912 — 56,049Freight and handling fulfillment revenues — — — 75,666 75,666Total coal revenues $ 134,569 $ — $ 61,458 $ 282,338 $ 478,365
Performance Obligations
21
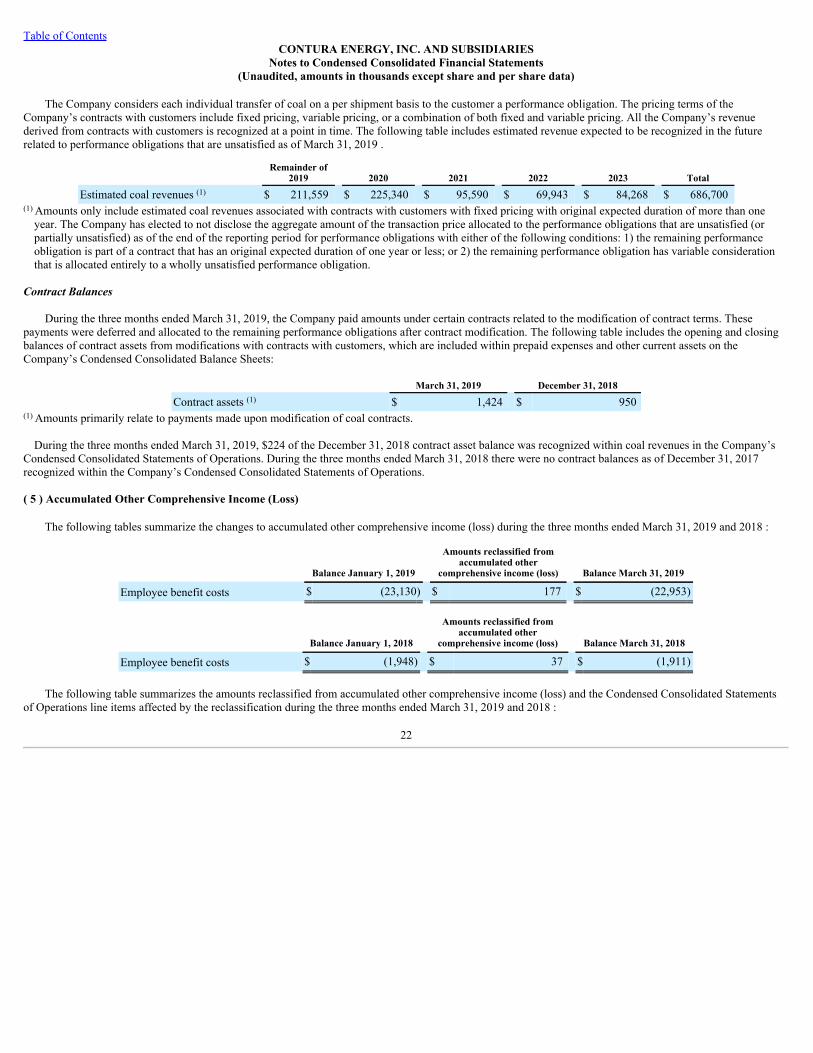
Table of ContentsCONTURA ENERGY, INC. AND SUBSIDIARIES
Notes to Condensed Consolidated Financial Statements(Unaudited, amounts in thousands except share and per share data)
The Company considers each individual transfer of coal on a per shipment basis to the customer a performance obligation. The pricing terms of theCompany’s contracts with customers include fixed pricing, variable pricing, or a combination of both fixed and variable pricing. All the Company’s revenuederived from contracts with customers is recognized at a point in time. The following table includes estimated revenue expected to be recognized in the futurerelated to performance obligations that are unsatisfied as of March 31, 2019 .
Remainder of
2019 2020 2021 2022 2023 Total
Estimated coal revenues (1) $ 211,559 $ 225,340 $ 95,590 $ 69,943 $ 84,268 $ 686,700(1) Amounts only include estimated coal revenues associated with contracts with customers with fixed pricing with original expected duration of more than one
year. The Company has elected to not disclose the aggregate amount of the transaction price allocated to the performance obligations that are unsatisfied (orpartially unsatisfied) as of the end of the reporting period for performance obligations with either of the following conditions: 1) the remaining performanceobligation is part of a contract that has an original expected duration of one year or less; or 2) the remaining performance obligation has variable considerationthat is allocated entirely to a wholly unsatisfied performance obligation.
Contract Balances
During the three months ended March 31, 2019, the Company paid amounts under certain contracts related to the modification of contract terms. Thesepayments were deferred and allocated to the remaining performance obligations after contract modification. The following table includes the opening and closingbalances of contract assets from modifications with contracts with customers, which are included within prepaid expenses and other current assets on theCompany’s Condensed Consolidated Balance Sheets:
March 31, 2019 December 31, 2018
Contract assets (1) $ 1,424 $ 950(1) Amounts primarily relate to payments made upon modification of coal contracts.
During the three months ended March 31, 2019, $224 of the December 31, 2018 contract asset balance was recognized within coal revenues in the Company’sCondensed Consolidated Statements of Operations. During the three months ended March 31, 2018 there were no contract balances as of December 31, 2017recognized within the Company’s Condensed Consolidated Statements of Operations.
( 5 ) Accumulated Other Comprehensive Income (Loss)
The following tables summarize the changes to accumulated other comprehensive income (loss) during the three months ended March 31, 2019 and 2018 :
Balance January 1, 2019
Amounts reclassified fromaccumulated other
comprehensive income (loss) Balance March 31, 2019
Employee benefit costs $ (23,130) $ 177 $ (22,953)
Balance January 1, 2018
Amounts reclassified fromaccumulated other
comprehensive income (loss) Balance March 31, 2018
Employee benefit costs $ (1,948) $ 37 $ (1,911)
The following table summarizes the amounts reclassified from accumulated other comprehensive income (loss) and the Condensed Consolidated Statementsof Operations line items affected by the reclassification during the three months ended March 31, 2019 and 2018 :
22

Table of ContentsCONTURA ENERGY, INC. AND SUBSIDIARIES
Notes to Condensed Consolidated Financial Statements(Unaudited, amounts in thousands except share and per share data)
Details about accumulated other comprehensiveincome (loss) components
Amounts reclassified from accumulated othercomprehensive income (loss)
Affected line item in the CondensedConsolidated Statements of Operations
Three Months Ended March 31,
2019 2018
Employee benefit costs: Amortization of actuarial loss $ 239 $ 37 (1) Miscellaneous income, netIncome tax expense (62) — Income tax benefit (expense)
Total, net of income tax $ 177 $ 37 (1) These accumulated other comprehensive income (loss) components are included in the computation of net periodic benefit costs for black lung and life
insurance. Refer to Note 16 .
( 6 ) Earnings (Loss) Per Share
The number of shares used to calculate basic earnings per common share is based on the weighted average number of the Company’s outstanding commonshares during the respective period. The number of shares used to calculate diluted earnings per common share is based on the number of common shares used tocalculate basic earnings per share plus the dilutive effect of stock options and other stock-based instruments held by the Company’s employees and directors duringthe period, and the Company’s outstanding Series A warrants. The warrants become dilutive for earnings per common share calculations when the market price ofthe Company’s common stock exceeds the exercise price. For the three months ended March 31, 2019 117,689 stock options and 161,707 restricted stock unitswere excluded, respectively, from the computation of dilutive earnings per share because they would have been anti-dilutive. For the three months ended March31, 2018, 129,520 stock options were excluded from the computation of dilutive earnings per share because they would have been anti-dilutive. These potentialshares could dilute earnings per share in the future.
The following table presents the net income (loss) per common share for the three months ended March 31, 2019 and 2018 :
23

Table of ContentsCONTURA ENERGY, INC. AND SUBSIDIARIES
Notes to Condensed Consolidated Financial Statements(Unaudited, amounts in thousands except share and per share data)
Three Months Ended March 31,
2019 2018
Net income Income from continuing operations $ 7,990 $ 58,300Loss from discontinued operations (1,175) (1,359)
Net income $ 6,815 $ 56,941
Basic
Weighted average common shares outstanding - basic 18,894,315 9,548,613 Basic income (loss) per common share:
Income from continuing operations $ 0.42 $ 6.11Loss from discontinued operations (0.06) (0.15)
Net income $ 0.36 $ 5.96
Diluted
Weighted average common shares outstanding - basic 18,894,315 9,548,613Diluted effect of warrants 216,043 246,672Diluted effect of stock options 205,634 274,878Diluted effect of restricted share units, restricted stock shares and performance-based restricted share units 222,637 222,444
Weighted average common shares outstanding - diluted 19,538,629 10,292,607
Diluted income (loss) per common share:
Income from continuing operations $ 0.41 $ 5.66Loss from discontinued operations (0.06) (0.13)
Net income $ 0.35 $ 5.53
( 7 ) Inventories, net
Inventories, net consisted of the following:
March 31, 2019 December 31, 2018
Raw coal $ 34,700 $ 33,607Saleable coal 85,011 63,767Materials, supplies and other, net 25,347 24,591
Total inventories, net $ 145,058 $ 121,965
( 8 ) Goodwill and Acquired Intangibles
Goodwill
In connection with the Merger, the Company recorded provisional goodwill. Refer to Note 2 for information on goodwill.
Acquired Intangibles
The Company has recognized assets for acquired above market-priced coal supply agreements and acquired mine permits and liabilities for acquired belowmarket-priced coal supply agreements. The coal supply agreements were valued based on the present value of the difference between the expected net contractualcash flows based on the stated contract terms, and the estimated net contractual cash flows derived from applying forward market prices at the Merger oracquisition date for new contracts of similar terms and conditions. The acquired mine permits were valued based on the replacement cost and lost profits
24

Table of ContentsCONTURA ENERGY, INC. AND SUBSIDIARIES
Notes to Condensed Consolidated Financial Statements(Unaudited, amounts in thousands except share and per share data)
method as of the Merger date. Coal supply agreement assets and acquired mine permits are reported in other acquired intangibles, net within the CondensedConsolidated Balance Sheets and coal supply agreement liabilities are reported in other non-current liabilities within the Condensed Consolidated Balance Sheets.
The following tables summarize the acquired intangibles as of March 31, 2019 and 2018:
December 31, 2018 Write-off of fully
amortized contracts Amortization March 31, 2019Assets: Above-market coal supply agreements $ 21,545 $ (48) $ — $ 21,497Accumulated amortization (16,858) 48 (757) (17,567)Above-market coal supply agreements, net ofaccumulated amortization $ 4,687 $ — $ (757) $ 3,930
Acquired mine permits 153,306 — — $ 153,306Accumulated amortization (3,409) — (5,941) (9,350)Acquired mine permits, net of accumulatedamortization $ 149,897 $ — $ (5,941) $ 143,956
Liabilities: Below-market coal supply agreements 57,219 (30,598) — $ 26,621Accumulated amortization (23,307) 30,598 (13,381) (6,090)Below-market coal supply agreements, net ofaccumulated amortization $ 33,912 $ — $ (13,381) $ 20,531
December 31, 2017 Write-off of fully
amortized contracts Amortization March 31, 2018Assets: Above-market coal supply agreements $ 47,120 $ (16,950) $ — $ 30,170Accumulated amortization (28,662) 16,950 (10,206) (21,918)Above-market coal supply agreements, net ofaccumulated amortization $ 18,458 $ — $ (10,206) $ 8,252
The acquired mine permits are amortized over the estimated life of the associated mine. The coal supply agreement assets and liabilities are amortized over theactual number of tons shipped over the life of each contract. Amortization of mine permits acquired as a result of the Merger was $5,941 for the three monthsended March 31, 2019 which is reported within amortization of acquired intangibles, net in the Condensed Consolidated Statements of Operations. Amortization ofabove-market coal supply agreements was $757 and $10,206 , and amortization of below-market coal supply agreements was ($13,381) and $0 , resulting in a net(credit) expense of ($12,624) and $10,206 for the three months ended March 31, 2019 and 2018, respectively, which is reported within amortization of acquiredintangibles, net in the Condensed Consolidated Statements of Operations.
( 9 ) Leases
The Company adopted ASC 842, with a date of initial application of January 1, 2019, using the modified retrospective transition approach. Under thisapproach prior comparative periods are not restated as part of the transition.
Subsequent to the adoption of ASC 842, the Company recognizes right of use assets and lease liabilities on the balance sheet for all leases with a term longerthan 12 months. The discount rates used to determine the present value of the lease assets and liabilities are based on the Company’s incremental borrowing rate atthe lease commencement date and commensurate with the remaining lease term. For leases with a term of 12 months or less, no right of use assets or liabilities arerecognized on the
25

Table of ContentsCONTURA ENERGY, INC. AND SUBSIDIARIES
Notes to Condensed Consolidated Financial Statements(Unaudited, amounts in thousands except share and per share data)
balance sheet and the Company recognizes the lease expense on a straight-line basis over the lease term. Additionally, the Company recognizes variable leasepayments as an expense in the period incurred.
The Company made the accounting policy election to not separate non-lease components from lease components for all classes of underlying assets andinstead account for them as a single lease component subject to the recognition requirements under ASC 842.
The Company’s lease population consists primarily of vehicle and heavy equipment leases and leases for office equipment. The Company’s building and landleases relate to corporate office space and certain site offices. The Company determines whether a contract contains a lease based on whether the Company obtainsthe right to control the use of specifically identifiable property, plant, and equipment for a period of time in exchange for consideration. For the three months endedMarch 31, 2019 the Company identified no instances requiring significant judgment in determining whether any contract entered into during the period were orwere not leases. Additionally, the Company had no material sublease agreements within the scope of ASC 842 or lease agreements for which the Company was thelessor for the three months ended March 31, 2019.
Renewal options in the Company’s lease population primarily relate to month-to-month extensions on vehicle leases and are immaterial both individually andin the aggregate. The Company includes renewal options that are reasonably certain to be exercised in the measurement lease liabilities. As of March 31, 2019, theCompany does not intend to exercise any termination options on existing leases.
As of March 31, 2019, the Company had the following right-of-use assets and lease liabilities within the Company’s Condensed Consolidated Balance Sheets:
March 31, 2019
Assets Balance Sheet Classification Financing lease assets Property, plant, and equipment, net $ 8,977Operating lease right-of-use assets Operating lease right-of-use assets 13,025Total lease assets $ 22,002
Liabilities Balance Sheet Classification Financing lease liabilities - current Current portion of long-term debt $ 1,926Operating lease liabilities - current Operating lease liabilities - current 3,447Financing lease liabilities - long-term Long-term debt 4,098Operating lease liabilities - long-term Operating lease liabilities - long-term 9,578Total lease liabilities $ 19,049
Total lease costs and other lease information for the three months ended March 31, 2019 included the following:
26

Table of ContentsCONTURA ENERGY, INC. AND SUBSIDIARIES
Notes to Condensed Consolidated Financial Statements(Unaudited, amounts in thousands except share and per share data)
Three Months Ended March 31,
2019
Lease cost (1) Finance lease cost: Amortization of leased assets $ 640 Interest on lease liabilities 44Operating lease cost 1,139Short-term lease cost 439
Total lease cost $ 2,262
Other information Cash paid for amounts included in the measurement of lease liabilities $ 2,258 Operating cash flows from finance leases $ 44 Operating cash flows from operating leases $ 1,579 Financing cash flows from finance leases $ 635Right-of-use assets obtained in exchange for new finance lease liabilities $ 224
Lease Term and Discount Rate Weighted-average remaining lease term in months - finance leases 48.3Weighted-average remaining lease term in months - operating leases 80.4Weighted-average discount rate - finance leases 3.2%Weighted-average discount rate - operating leases 10.5%
(1) The Company had no variable lease costs or sublease income for the three months ended March 31, 2019.
The following table summarizes the maturity of our lease liabilities on an undiscounted cash flow basis and a reconciliation to the lease liabilities recognizedin the Company’s Consolidated Condensed Balance Sheet as of March 31, 2019:
Finance Leases Operating Leases
Lease cost Remainder of 2019 $ 1,659 $ 3,7552020 1,699 3,9672021 1,675 2,7422022 1,308 1,6042023 6 1,155Thereafter — 6,216Total future minimum lease payments $ 6,347 $ 19,439Imputed interest (323) (6,414)
Present value of future minimum lease payments $ 6,024 $ 13,025
As of March 31, 2019, the Company had no additional leases that had not yet commenced that created significant rights and obligations for the Company.
27

Table of ContentsCONTURA ENERGY, INC. AND SUBSIDIARIES
Notes to Condensed Consolidated Financial Statements(Unaudited, amounts in thousands except share and per share data)
( 10 ) Long-Term Debt
Long-term debt consisted of the following:
March 31, 2019 December 31, 2018
Term Loan Credit Facility - due November 2025 $ 543,125 $ 550,000LCC Note Payable 62,500 62,500LCC Water Treatment Obligation 11,875 11,875Other 7,861 8,395Debt discount and issuance costs (41,869) (44,758)
Total long-term debt 583,492 588,012Less current portion (43,105) (42,743)
Long-term debt, net of current portion $ 540,387 $ 545,269
Term Loan Credit Facility - due November 2025
On November 9, 2018, the Company entered into an Amended and Restated Credit Agreement with Jefferies Finance LLC, as administrative agent andcollateral agent, and the other lenders party thereto (as defined therein) that provides for a senior secured term loan facility in the aggregate amount of $550,000with a maturity date of November 9, 2025 (the “New Term Loan Credit Facility”). The Term Loan Credit Facility bears an interest rate per annum based on thecharacter of the loan (defined as either “Base Rate Loan” or “Eurocurrency Rate Loan”) plus an applicable rate of 4.00% to 5.00% depending on loan type (the“Applicable Rate”), payable bi-monthly in arrears. As of March 31, 2019 , the Term Loan Credit Facility was classified as a Eurocurrency Rate Loan with aninterest rate of 7.49% , calculated as the eurocurrency rate during the period plus an applicable rate of 5.00% . As of March 31, 2019 and December 31, 2018 , thecarrying value of the New Term Loan Credit Facility was $515,783 and $521,667 , with $20,625 and $20,625 classified as current, respectively within theCondensed Consolidated Balance Sheets.
The New Term Loan Credit Facility contains negative and affirmative covenants including certain financial covenants. The Company was in compliance withall covenants under this agreement as of March 31, 2019 . Commencing with the fiscal quarter ended March 31, 2019, the Company must make prepayments onthe term loan principal balance under the terms of the Amended and Restated Credit Agreement equal to the excess cash flow in any quarter, as defined in theagreement (the “Excess Cash Flow Payments”). Any payments shall be made no later than 70 days after the end of each fiscal quarter (or 130 days in the case ofthe last fiscal quarter of any fiscal year). The Company is not required to make an Excess Cash Flow Payment for the fiscal quarter ended March 31, 2019.
Asset-Based Revolving Credit Agreement
On November 9, 2018, the Company entered into the Amended and Restated Asset-Based Revolving Credit Agreement, with Citibank N.A. as administrativeagent, collateral agent, and swingline lender and the other lenders party thereto (the “Lenders”), and Citibank N.A., Barclays Bank PLC, BMO Harris Bank N.A.and Credit Suisse AG as letter of credit issuers (“LC Lenders”). The Amended and Restated Asset-Based Revolving Credit Agreement includes a senior securedasset-based revolving credit facility (the “ABL Facility”). As of March 31, 2019 , the Company had no borrowings and $28,700 letters of credit outstanding underthe ABL Facility.
The Amended and Restated Asset-Based Revolving Credit Agreement, as amended, and related documents contain negative and affirmative covenantsincluding certain financial covenants. The Company was in compliance with all covenants under these agreements as of March 31, 2019 .
LCC Note Payable
As a result of the Merger, the Company assumed a note payable to Lexington Coal Company (“LCC”) in the aggregate amount of $62,500 (the “LCC NotePayable”) and with a maturity date of July 26, 2022. The LCC Note Payable has no stated interest and an imputed interest rate of 12.45% . The carrying value ofthe LCC Note Payable was $50,966 and $49,361 , with
28

Table of ContentsCONTURA ENERGY, INC. AND SUBSIDIARIES
Notes to Condensed Consolidated Financial Statements(Unaudited, amounts in thousands except share and per share data)
$17,500 and $17,500 reported within the current portion of long-term debt as of March 31, 2019 and December 31, 2018, respectively.
LCC Water Treatment Stipulation
As a result of the Merger, the Company assumed an obligation to contribute $12,500 into Lexington Coal Company’s water treatment restricted cash accounts(the “LCC Water Treatment Stipulation”). The LCC Water Treatment Stipulation has no stated interest and an imputed interest rate of 13.12% . The carrying valueof the LCC Water Treatment Stipulation was $8,882 and $8,589 , with $2,500 and $1,875 reported within the current portion of long-term debt as of March 31,2019 and December 31, 2018, respectively.
Finance Leases
The Company entered into financing leases for certain property and other equipment during 2019 and 2018 . The Company’s liability for financing leases was$6,024 and $6,423 , with $1,926 and $2,110 reported within the current portion of long-term debt as of March 31, 2019 and December 31, 2018 , respectively.Refer to Note 9 for additional information on leases.
( 11 ) Acquisition-Related Obligations
Acquisition-related obligations consisted of the following:
March 31, 2019 December 31, 2018
Contingent Revenue Obligation $ 61,816 $ 59,880Environmental Settlement Obligations 19,305 19,306Reclamation Funding Liability 22,000 22,000Retiree Committee VEBA Funding Settlement Liability 1,000 3,500UMWA Funds Settlement Liability 6,000 6,000Discount (8,781) (10,356)
Total acquisition-related obligations - long-term 101,340 100,330Less current portion (26,122) (27,334)
Acquisition-related obligations, net of current portion $ 75,218 $ 72,996
Contingent Revenue Obligation
As a result of the Merger, the Company assumed a contingent revenue payment obligation (the “Contingent Revenue Obligation”) to certain of the AlphaCompanies creditors pursuant to the terms stipulated within the bankruptcy settlement previously entered into by the Alpha Companies. As of March 31, 2019 andDecember 31, 2018 the carrying value of the Contingent Revenue Obligation was $61,816 and $59,880 , with $9,621 and $9,459 classified as current, respectively,classified as an acquisition-related obligation in the Condensed Consolidated Balance Sheets. Refer to Note 13 for further disclosures related to the fair valueassignment and methods used.
During the second quarter of 2019 the Company paid $9,628 pursuant to terms of the Contingent Revenue Obligation.
Environmental Settlement Obligations
As a result of the Merger, the Company assumed certain environmental settlement obligations (the “Environmental Settlement Obligations”) pursuant to theterms stipulated within the bankruptcy settlement previously entered into by the Alpha Companies. As of March 31, 2019 and December 31, 2018, the carryingvalue of the Environmental Settlement Obligations was $15,249 and $14,768 , net of discounts of $4,056 and $4,538 , with $3,375 and $3,375 classified as current,respectively, all of which was classified as an acquisition-related obligation in the Condensed Consolidated Balance Sheets.
Reclamation Funding Agreement
Pursuant to the Reclamation Funding Agreement dated July 12, 2016, the Company must pay the aggregate amount of $50,000 into the various RestrictedCash Reclamation Accounts as follows: $8,000 immediately upon the effective date of the
29

Table of ContentsCONTURA ENERGY, INC. AND SUBSIDIARIES
Notes to Condensed Consolidated Financial Statements(Unaudited, amounts in thousands except share and per share data)
agreement; $10,000 on the anniversary of the effective date in each of 2017, 2018, and 2019; and $12,000 on the anniversary of the effective date in 2020. As ofMarch 31, 2019 and December 31, 2018, the carrying value of the Funding of Restricted Cash Reclamation liability was $18,961 and $18,106 , net of discounts of$3,039 and $3,894 , with $10,000 and $10,000 classified as current, respectively, all of which was classified as an acquisition-related obligation in the CondensedConsolidated Balance Sheets.
( 12 ) Asset Retirement Obligations
The following table summarizes the changes in asset retirement obligations for the three months ended March 31, 2019 :
Total asset retirement obligations at December 31, 2018 $ 228,448Measurement-period adjustments (1) 12,718Accretion for the period 6,218Revisions in estimated cash flows (19)Expenditures for the period (5,817)Total asset retirement obligations at March 31, 2019 241,548Less current portion (26,133)
Long-term portion $ 215,415(1) Refer to Note 2 for additional information on the Merger and related measurement-period adjustments recorded during the three months ended March 31, 2019.
( 13 ) Fair Value of Financial Instruments and Fair Value Measurements
The estimated fair values of financial instruments are determined based on relevant market information. These estimates involve uncertainty and cannot bedetermined with precision.
The carrying amounts for cash and cash equivalents, trade accounts receivable, net, prepaid expenses and other current assets, short-term and long-termrestricted cash, short-term and long-term deposits, trade accounts payable, and accrued expenses and other current liabilities approximate fair value as of March 31,2019 and December 31, 2018 due to the short maturity of these instruments.
The following tables set forth by level, within the fair value hierarchy, the Company’s long-term debt at fair value as of March 31, 2019 and December 31,2018 :
March 31, 2019
Carrying
Amount (1) Total FairValue
Quoted Pricesin ActiveMarkets(Level 1)
SignificantOther
ObservableInputs(Level 2)
SignificantUnobservable
Inputs(Level 3)
Term Loan Credit Facility - due November 2025 $ 515,783 $ 536,336 $ 536,336 $ — $ —LCC Note Payable 50,966 50,929 — — 50,929LCC Water Treatment Obligation 8,882 8,928 — — 8,928
Total long-term debt $ 575,631 $ 596,193 $ 536,336 $ — $ 59,857
30

Table of ContentsCONTURA ENERGY, INC. AND SUBSIDIARIES
Notes to Condensed Consolidated Financial Statements(Unaudited, amounts in thousands except share and per share data)
December 31, 2018
Carrying
Amount (1) Total FairValue
Quoted Pricesin ActiveMarkets(Level 1)
SignificantOther
ObservableInputs(Level 2)
SignificantUnobservable
Inputs(Level 3)
Term Loan Credit Facility - due November 2025 $ 521,667 $ 540,375 $ 540,375 $ — $ —LCC Note Payable 49,361 50,606 — — 50,606LCC Water Treatment Obligation 8,589 8,827 — — 8,827
Total long-term debt $ 579,617 $ 599,808 $ 540,375 $ — $ 59,433(1) Net of debt discounts and debt issuance costs.
The following tables set forth by level, within the fair value hierarchy, the Company’s acquisition-related obligations at fair value as of March 31, 2019 andDecember 31, 2018 :
March 31, 2019
Carrying
Amount (1) Total Fair Value
Quoted Prices in Active Markets (Level 1)
SignificantOther
Observable Inputs (Level 2)
Significant Unobservable
Inputs (Level 3)
Retiree Committee VEBA Funding Settlement Liability $ 875 $ 917 $ — $ — $ 917UMWA Funds Settlement Liability 4,439 4,905 — — 4,905Reclamation Funding Liability 18,961 19,936 — — 19,936Environmental Settlement Obligations 15,249 15,514 — — 15,514
Total acquisition-related obligations $ 39,524 $ 41,272 $ — $ — $ 41,272
December 31, 2018
Carrying
Amount (1) Total Fair Value
Quoted Prices in Active Markets (Level 1)
SignificantOther
Observable Inputs (Level 2)
Significant Unobservable
Inputs (Level 3)
Retiree Committee VEBA Funding Settlement Liability $ 3,337 $ 3,391 $ — $ — $ 3,391UMWA Funds Settlement Liability 4,239 4,729 — — 4,729Reclamation Funding Liability 18,106 19,362 — — 19,362Environmental Settlement Obligations 14,768 14,936 — — 14,936
Total acquisition-related obligations $ 40,450 $ 42,418 $ — $ — $ 42,418(1) Net of discounts.
The following table sets forth by level, within the fair value hierarchy, the Company’s financial and non-financial assets and liabilities that were accounted forat fair value on a recurring basis as of March 31, 2019 and December 31, 2018 . Financial and non-financial assets and liabilities are classified in their entiretybased on the lowest level of input that is significant to the fair value measurement. The Company’s assessment of the significance of a particular input to the fairvalue measurement requires judgment, and may affect the determination of fair value for assets and liabilities and their placement within the fair value hierarchylevels.
March 31, 2019
Total Fair Value
Quoted Pricesin Active Markets
(Level 1)
Significant Other
Observable Inputs (Level 2)
SignificantUnobservableInputs (Level 3)
Contingent Revenue Obligation $ 61,816 $ — $ — $ 61,816
31

Table of ContentsCONTURA ENERGY, INC. AND SUBSIDIARIES
Notes to Condensed Consolidated Financial Statements(Unaudited, amounts in thousands except share and per share data)
December 31, 2018
Total Fair Value
Quoted Pricesin Active Markets
(Level 1)
Significant Other
Observable Inputs (Level 2)
SignificantUnobservableInputs (Level 3)
Contingent Revenue Obligation $ 59,880 $ — $ — $ 59,880
The following table is a reconciliation of the financial and non-financial assets and liabilities that were accounted for at fair value on a recurring basis and thatwere categorized within Level 3 of the fair value hierarchy:
December 31,
2018 Acquisitions
Loss (Gain)Recognized inEarnings
Transfer In (Out) ofLevel 3 Fair Value
Hierarchy March 31, 2019
Contingent Revenue Obligation $ 59,880 $ — $ 1,936 $ — $ 61,816
The following methods and assumptions were used to estimate the fair values of the assets and liabilities in the tables above:
Level 1 Fair Value Measurements
Term Loan Credit Facility - due November 2025 - The fair value is based on observable market data.
Level 3 Fair Value Measurements
LCC Note Payable, LCC Water Treatment Obligation, Retiree Committee VEBA Funding Settlement Liability, UMWA Funds Settlement Liability,Environmental Settlement Obligations and Reclamation Funding Liability - Observable transactions are not available to aid in determining the fair value of theseitems. Therefore, the fair value was derived by using the expected present value approach in which estimated cash flows are discounted using a risk-free interestrate adjusted for market risk.
Contingent Revenue Obligation - The fair value of the contingent revenue obligation was estimated using a Black-Scholes pricing model and is marked tomarket at each reporting period with changes in value reflected in earnings. The inputs included in the Black-Scholes pricing model are the Company's forecastedfuture revenue, the stated royalty rate, the remaining periods in the obligation; annual risk-free interest rate based on the US Constant Maturity Treasury Curve andannualized volatility. The annualized volatility was calculated by observing volatilities for comparable companies with adjustments for the Company's size andleverage.
Acquisition accounting - The Company accounts for business combinations under the acquisition method of accounting. The total cost of acquisitions isallocated to the underlying identifiable net tangible and intangible assets based on their respective estimated fair values. Determining the fair value of assetsacquired and liabilities assumed requires management’s judgment, the utilization of independent valuation experts and often involves the use of significantestimates and assumptions with respect to the timing and amounts of future cash inflows and outflows, discount rates, market prices and asset lives, among otheritems. A combination of income, market and cost approaches are used for the valuation where appropriate, depending on the assets or liabilities being valued. Thevaluation inputs in these models and analyses give consideration to market participant assumptions.
( 14 ) Warrants
As of March 31, 2019 , of the 810,811 warrants that were originally issued, 801,726 remain outstanding, with a total of 921,985 shares underlying the un-exercised warrants. For the three months ended March 31, 2019 , the Company issued 5 shares of common stock resulting from exercises of its Series A Warrants,and, pursuant to the terms of the Warrants Agreement, withheld 1 of the issued shares in satisfaction of the Warrant Exercise Price, which was subsequentlyreclassified as treasury stock.
( 15 ) Income Taxes
For the three months ended March 31, 2019 , the Company recorded income tax benefit of $4,778 on income from continuing operations before income taxesof $3,212 . The income tax benefit differs from the expected statutory amount primarily due to the impact of the percentage depletion allowance, the permanentimpact of stock-based compensation deductions, and the reduction in the valuation allowance. As of March 31, 2019, the Company anticipates that no Federalincome tax liability will be generated in 2019. For the three months ended March 31, 2018, the Company recorded income tax expense of $66 on income fromcontinuing operations before income taxes of $58,366 . The income tax expense differs from the expected statutory amount primarily due to the impact of thepercentage depletion allowance and the reduction in the valuation allowance, partially offset by the impact of state income taxes, net of federal tax impact.
32

Table of ContentsCONTURA ENERGY, INC. AND SUBSIDIARIES
Notes to Condensed Consolidated Financial Statements(Unaudited, amounts in thousands except share and per share data)
During the three months ended March 31, 2019 , the Company recorded a decrease of $382 to its deferred tax asset valuation allowance. The decrease invaluation allowance results from the generation of income from continuing operations before income taxes that allowed for the realization of deferred tax assetssince the prior reporting date of December 31, 2018. The valuation allowance associated with those deferred tax assets was therefore released during the threemonths ended March 31, 2019. The Company currently is relying primarily on the reversal of taxable temporary differences, along with consideration of taxableincome via carryback to prior years and tax planning strategies, to support the realization of deferred tax assets. For each reporting period, the Company updates itsassessment regarding the realizability of its deferred tax assets, including scheduling the reversal of its deferred tax assets and liabilities, to determine the amountof valuation allowance needed. Scheduling the reversal of deferred tax asset and liability balances requires judgment and estimation. The Company believes thedeferred tax liabilities relied upon as future taxable income in its assessment will reverse in the same period and jurisdiction and are of the same character as thetemporary differences giving rise to the deferred tax assets that will be realized. The valuation allowance recorded represents the portion of deferred tax assets forwhich the Company is unable to support realization through the methods described above.
( 16 ) Employee Benefit Plans
The Company provides several types of benefits for its employees, including postemployment life insurance, defined benefit and defined contribution pensionplans, and workers’ compensation and black lung benefits. The Company does not participate in any multi-employer plans.
Pension
The Company had $179,444 and $180,802 of pension liability as of March 31, 2019 and December 31, 2018 , respectively, with $0 of this liability classifiedas current as of March 31, 2019 and December 31, 2018.
The following table details the components of the net periodic benefit cost for pension obligations:
Three Months Ended March 31, 2019
Interest cost $ 6,616Expected return on plan assets (7,006)Amortization of net actuarial loss 208
Net periodic benefit $ (182)
The components of net periodic benefit cost are included in the line item miscellaneous income, net in the Condensed Consolidated Statements of Operations.As the Company assumed these pension obligations in connection with the Merger, there was no net periodic benefit cost for the three months ended March 31,2018.
Black Lung
The Company had $91,783 and $92,208 of black lung liability as of March 31, 2019 and December 31, 2018 , respectively, with $8,133 of this liabilityclassified as current as of March 31, 2019 and December 31, 2018.
The following table details the components of the net periodic benefit cost for black lung obligations:
Three Months Ended March 31,
2019 2018
Service cost $ 404 $ 196Interest cost 910 172Expected return on plan assets (16) —Amortization of net actuarial loss 45 48
Net periodic expense $ 1,343 $ 416
33

Table of ContentsCONTURA ENERGY, INC. AND SUBSIDIARIES
Notes to Condensed Consolidated Financial Statements(Unaudited, amounts in thousands except share and per share data)
The components of net periodic benefit cost other than the service cost component are included in the line item miscellaneous income, net in the CondensedConsolidated Statements of Operations.
Life Insurance Benefits
The Company had $11,363 and $11,368 of life insurance benefits liability as of March 31, 2019 and December 31, 2018 , respectively, with $787 of thisliability classified as current as of March 31, 2019 and December 31, 2018.
The following table details the components of the net periodic benefit cost for life insurance benefit obligations:
Three Months Ended March 31,
2019 2018
Interest cost $ 106 $ 97Amortization of net actuarial gain (26) (11)
Net periodic expense $ 80 $ 86
The components of net periodic benefit cost are included in the line item miscellaneous income, net in the Condensed Consolidated Statements of Operations.
Defined Contribution and Profit Sharing Plans
The Company sponsors defined contribution plans to assist its eligible employees in providing for retirement. Generally, under the terms of these plans,employees make voluntary contributions through payroll deductions and the Company makes matching and/or discretionary contributions, as defined by each plan.The Company’s total contributions to these plans for the three months ended March 31, 2019 and 2018 was $15,536 and $5,511 , respectively.
Self-Insured Medical Plan
The Company is self-insured for health insurance coverage for all of its active employees. Estimated liabilities for health and medical claims are recordedbased on the Company’s historical experience and include a component for incurred but not paid claims. During the three months ended March 31, 2019 and 2018 ,the Company incurred total expenses of $19,038 and $7,162 , respectively, which primarily includes claims processed and an estimate for claims incurred but notpaid.
( 17 ) Stock-Based Compensation Awards
The Management Incentive Plan (the “MIP”) is currently authorized for the issuance of awards of up to 1,201,202 shares of common stock, and as ofMarch 31, 2019 , there were 119,009 shares of common stock available for grant under the MIP. The Long-Term Incentive Plan (the “LTIP”) is currentlyauthorized for the issuance of awards of up to 1,000,000 shares of common stock, and as of March 31, 2019 , there were 722,377 shares of common stock availablefor grant under the LTIP. Pursuant to the Merger Agreement, the Company assumed the ANR Inc. 2017 Equity Incentive Plan (the “ANR EIP”), which hadunderlying ANR shares which were converted to 89,766 Contura shares. The ANR EIP is no t authorized for additional issuance of awards of shares of commonstock, and as of March 31, 2019 , there were no shares of common stock available for grant under the ANR EIP.
During the three months ended March 31, 2019 , the Company granted certain key employees 81,065 relative total shareholder return performance-basedrestricted stock units that are valued relative to the median stock price performance of a comparator group and had a grant date fair value of $65.70 based on aMonte Carlo simulation, and 27,042 absolute total shareholder return performance-based restricted stock units that are valued based on the Company’s stock priceperformance with a grant date fair value of $50.60 based on a Monte Carlo simulation. These performance-based restricted stock units cliff vest on the thirdanniversary of the date of the grant, subject to continued employment and the satisfaction of the performance criteria. These performance-based restricted stockunits have the potential to be distributed from 0% to 400% for the relative total shareholder return units, and 0% to 200% for the absolute total shareholder returnunits, of the awarded amount, depending on actual results versus the pre-established performance criteria over the three -year period. The Monte Carlo simulationsincorporate the assumptions as presented in the following tables:
34

Table of ContentsCONTURA ENERGY, INC. AND SUBSIDIARIES
Notes to Condensed Consolidated Financial Statements(Unaudited, amounts in thousands except share and per share data)
Relative performance-based restricted stock units Start price (1) $ 66.06Dividend adjusted stock price (2) $ 61.27Expected volatility (3) 29.98%Risk-free interest rate (4) 2.42%Expected dividend yield (5) —%
(1) The start price for the Company represents the average closing stock price over the ten trading days ending on December 31, 2018, assuming dividendsdistributed during this period were reinvested in additional shares of the Company’s stock on the ex-dividend date.
(2) The dividend adjusted stock price represents the closing price on the grant date assuming dividends distributed during the period since December 17, 2018,were reinvested in additional shares of the Company’s stock on the ex-dividend date.
(3) The expected volatility assumption is based on the historical volatility of the price of the Company’s stock.(4) The annual risk-free interest rate equals the yield on zero coupon U.S. Treasury Separate Trading of Registered Interest and Principal of Securities (“STRIPS”)
that have a term equal to the length of the remaining performance measurement period as of the valuation date.(5) The expected dividend yield represents the investments return to a share of the Company’s stock that is not available to the holder of an absolute performance-
based stock unit.
Absolute performance-based restricted stock units Valuation date stock price $ 61.27Expected volatility (1) 29.98%Risk-free interest rate (2) 2.42%Expected dividend yield (3) —%
(1) The expected volatility assumption is based on the historical volatility of the price of the Company’s stock.(2) The annual risk-free interest rate equals the yield on zero coupon U.S. Treasury STRIPS that have a term equal to the length of the remaining performance
measurement period as of the valuation date.(3) The expected dividend yield represents the investments return to a share of the Company’s stock that is not available to the holder of an absolute performance-
based stock unit.
At March 31, 2019 , the Company had four types of stock-based awards outstanding: time-based restricted stock shares, time-based restricted share units,performance-based restricted stock units, and stock options. Stock-based compensation expense totaled $5,319 and $4,811 for the three months ended March 31,2019 and 2018 , respectively. For the three months ended March 31, 2019 and 2018 , approximately 69% and 95% , respectively, of stock-based compensationexpense was reported as selling, general and administrative expenses and the remainder was recorded as cost of coal sales. The Company’s liability for alloutstanding liability awards totaled $0 and $1,058 as of March 31, 2019 and December 31, 2018 , respectively.
The Company is authorized to repurchase common shares from employees (upon the election by the employee) to satisfy the employees’ statutory taxwithholdings upon the vesting of stock grants. Shares that are repurchased to satisfy the employees’ statutory tax withholdings are recorded in treasury stock atcost. During the three months ended March 31, 2019 , the Company repurchased 71,036 shares of its common stock issued pursuant to awards under the MIP,LTIP, and ANR EIP for a total purchase amount of $4,171 , or $58.72 average price paid per share. During the three months ended March 31, 2018 , the Companyrepurchased 70,834 shares of its common stock issued pursuant to awards under the MIP for a total purchase amount of $4,816 , or $67.99 average price paid pershare.
( 18 ) Related Party Transactions
There were no material related party transactions for the three months ended March 31, 2019 .
35

Table of ContentsCONTURA ENERGY, INC. AND SUBSIDIARIES
Notes to Condensed Consolidated Financial Statements(Unaudited, amounts in thousands except share and per share data)
( 19 ) Commitments and Contingencies
(a) General
Estimated losses from loss contingencies are accrued by a charge to income when information available indicates that it is probable that an asset has beenimpaired or a liability has been incurred and the amount of the loss can be reasonably estimated.
If a loss contingency is not probable or reasonably estimable, disclosure of the loss contingency is made in the Condensed Consolidated Financial Statementswhen it is at least reasonably possible that a loss may be incurred and that the loss could be material.
(b) Commitments and Contingencies
Commitments
The Company leases coal mining and other equipment under long-term financing and operating leases with varying terms. Refer to Note 9 for furtherinformation on leases. In addition, the Company leases mineral interests and surface rights from land owners under various terms and royalty rates.
Coal royalty expense was $23,946 and $5,973 for the three months ended March 31, 2019 and 2018. Refer to Note 9 for further information on leases.
Other Commitments
The Company has obligations under certain coal purchase agreements that contain minimum quantities to be purchased in the remainder of 2019 and 2020totaling an estimated $295,667 and $13,090 , respectively, which includes an estimated $74,970 in 2019 related to contractually committed variable priced tonsfrom vendors with historical performance resulting in less than 20% of the committed tonnage being delivered. The Company has obligations under certain coaltransportation agreements that contain minimum quantities to be shipped in 2019 and 2020 totaling $3,450 and $15,473 , respectively. The Company also hasobligations under certain equipment purchase agreements that contain minimum quantities to be purchased in the remainder of 2019 and 2020, totaling $40,262and $283 , respectively.
Contingencies
Extensive regulation of the impacts of mining on the environment and of maintaining workplace safety has had and is expected to continue to have asignificant effect on the Company’s costs of production and results of operations. Further regulations, legislation or litigation in these areas may also cause theCompany’s sales or profitability to decline by increasing costs or by hindering the Company’s ability to continue mining at existing operations or to permit newoperations.
During the normal course of business, contract-related matters arise between the Company and its customers. When a loss related to such matters is consideredprobable and can reasonably be estimated, the Company records a liability.
Per terms of the Back-to-Back Coal Supply Agreements, the Company is required to purchase and sell coal in the remainder of 2019 and 2020 totaling$12,205 and $9,175 , respectively. For the three months ended March 31, 2019 , the Company purchased and sold 369 tons, totaling $3,881 , under the Back-to-Back Coal Supply Agreements. For the three months ended March 31, 2018 , the Company purchased and sold 3,164 tons, totaling $33,749 under the Back-to-Back Coal Supply Agreements.
In October 2018, the State of Wyoming Department of Revenue invoiced Blackjewel for approximately $7,800 in severance taxes owed by Blackjewel inconnection with the Wyoming properties it previously acquired from the Company. The transfer of mining permits associated with these properties is pending. Inconnection with this invoice, the Department purported to assert liens over Contura Coal West, LLC, one of the Company’s subsidiaries. The Company believesthat, in light of the sale of the Wyoming properties to Blackjewel, neither the Company nor its subsidiary is obligated to pay these severance taxes. On October 28,2018, Blackjewel entered into a payment plan agreement with the State of Wyoming Department of Revenue to address the severance taxes owed by Blackjewel.
36

Table of ContentsCONTURA ENERGY, INC. AND SUBSIDIARIES
Notes to Condensed Consolidated Financial Statements(Unaudited, amounts in thousands except share and per share data)
Future Federal Income Tax Refunds
As of March 31, 2019, the Company has recorded $68,774 of federal income tax receivable and $68,774 of federal deferred tax asset related to AMTCredits. In addition, the Company has recorded a non-current federal income tax receivable of $43,770 related to an NOL carryback claim. Because the federalgovernment was a creditor in the Alpha Natural Resources, Inc. (“Predecessor Alpha”) bankruptcy proceedings, it is possible that the federal government couldwithhold some or all of the tax refund attributable to the NOL carryback claim and the refundable AMT Credits and assert a right to setoff the tax refund andrefundable credits against its prepetition bankruptcy claims.
(c) Guarantees and Financial Instruments with Off-Balance Sheet Risk
In the normal course of business, the Company is a party to certain guarantees and financial instruments with off-balance sheet risk, such as bank letters ofcredit, performance or surety bonds, and other guarantees and indemnities related to the obligations of affiliated entities which are not reflected in the Company’sCondensed Consolidated Balance Sheets. However, the underlying liabilities that they secure, such as asset retirement obligations, workers’ compensationliabilities, and royalty obligations, are reflected in the Company’s Condensed Consolidated Balance Sheets.
The Company is required to provide financial assurance in order to perform the post-mining reclamation required by its mining permits, pay its federalproduction royalties, pay workers’ compensation claims under workers’ compensation laws in various states, pay federal black lung benefits, and perform certainother obligations. In order to provide the required financial assurance, the Company generally uses surety bonds for post-mining reclamation and workers’compensation obligations. The Company can also use bank letters of credit to collateralize certain obligations.
As of March 31, 2019 , the Company had outstanding surety bonds with a total face amount of $579,934 to secure various obligations and commitments,including $237,310 related to the PRB. To secure the Company’s reclamation-related obligations, the Company currently has $125,348 of collateral supportingthese obligations. Once the permits associated with the PRB Transaction have been transferred, the Company estimates approximately $9,100 comprised of short-term restricted cash and short-term deposits will be returned to operating cash.
Amounts included in restricted cash represent cash deposits that are restricted as to withdrawal as required by certain agreements entered into by the Companyand provide collateral in the amounts of $95,506 , $31,160 , $85,455 , $28,155 , and $2,833 as of March 31, 2019 for securing the Company’s obligations undercertain worker’s compensation, black lung, reclamation-related obligations, general liabilities, and financial guarantees, respectively, which have been written onthe Company’s behalf. Additionally, the Company has $9,686 of short-term restricted cash held in escrow related to the Company’s contingent revenue obligation.Refer to Note 11 for further information regarding the contingent revenue obligation. The Company’s restricted cash is primarily invested in interest bearingaccounts. This restricted cash is classified as both short-term and long-term on the Company’s Condensed Consolidated Balance Sheets.
Amounts included in restricted investments consist of certificates of deposit, corporate bonds, and U.S. treasury bills that are restricted as to withdrawal asrequired by certain agreements entered into by the Company and provide collateral in the amounts of $1,888 and $28,438 as of March 31, 2019 for securing theCompany’s obligations under certain worker’s compensation and reclamation-related obligations, respectively, which have been written on the Company’s behalf.These restricted investments are classified as long-term on the Company’s Condensed Consolidated Balance Sheets.
Deposits represent cash deposits held at third parties as required by certain agreements entered into by the Company to provide cash collateral. At March 31,2019 , the Company had cash collateral in the form of deposits in the amounts of $11,456 and $3,156 to secure the Company’s obligations under reclamation-related obligations and various other operating agreements, respectively. These deposits are classified as both short-term and long-term on the Company’sCondensed Consolidated Balance Sheets.
As of March 31, 2019 , the Company had real property collateralizing $26,749 of reclamation bonds.
The Company meets frequently with its surety providers and has discussions with certain providers regarding the extent of and the terms of their participationin the program. These discussions may cause the Company to shift surety bonds between providers or to alter the terms of their participation in our program. To theextent that surety bonds become unavailable or the Company’s surety bond providers require additional collateral, the Company would seek to secure itsobligations with letters of
37

Table of ContentsCONTURA ENERGY, INC. AND SUBSIDIARIES
Notes to Condensed Consolidated Financial Statements(Unaudited, amounts in thousands except share and per share data)
credit, cash deposits or other suitable forms of collateral. The Company’s failure to maintain, or inability to acquire, surety bonds or to provide a suitablealternative would have a material adverse effect on its liquidity. These failures could result from a variety of factors including lack of availability, higher cost orunfavorable market terms of new surety bonds, and the exercise by third-party surety bond issuers of their right to refuse to renew the surety.
WVDEP Settlement Agreement
On November 6, 2018, Contura, the Alpha Companies and the West Virginia Department of Environmental Protection (the “WVDEP”) entered into a bindingterm sheet agreement (the “Term Sheet”) to resolve certain issues related to the issuance of the Dividend under the Permitting and Reclamation Plan SettlementAgreement for the State of West Virginia dated as of July 12, 2016 (amended by the First Amendment dated July 25, 2016 and by the Second Amendment datedOctober 23, 2017, the “Amended Settlement Agreement”).
Pursuant to the Term Sheet, the WVDEP provided its consent to the Dividend. The Term Sheet also provides for the extension of the first lien mortgage anddeed of trust in an office and associated real estate in Julian, West Virginia previously granted by ANR to the WVDEP to secure ANR’s obligations under theAmended Settlement Agreement until ANR and Contura complete the payments required under the Reclamation Funding Agreement dated as of July 12, 2016, byand among, ANR, Contura, WVDEP, and the regulatory agencies of Illinois, Tennessee, Kentucky and Virginia (the “Amended Reclamation FundingAgreement”). Contura is also obligated under the Term Sheet to continue to hold subject to the applicable Deposit Account Control Agreements referenced in theAmendment of Agreements dated as of October 23, 2017 by and between Contura and the WVDEP approximately $2,800 of certain cash collateral until ANR andContura complete the payments required of them under the Amended Reclamation Funding Agreement.
Concurrent with ANR’s issuance of the Dividend on November 8, 2018, pursuant to the Term Sheet, Contura posted cash collateral with WVDEP in theamount of $9,000 , to secure Contura’s and ANR’s payment obligations under the Amended Reclamation Funding Agreement and the Amended SettlementAgreement (the “Payment Obligations”) until a performance bond was issued as described in the following sentence. During the fourth quarter of 2018, as requiredunder the Term Sheet, Contura issued a performance bond to WVDEP in the amount of $35,000 to secure the Payment Obligations. The amount of suchperformance bond will decrease on a dollar to dollar basis after the Payment Obligations fall below $35,000 . Upon issuance of the performance bond, the $9,000cash collateral was released to Contura within the first quarter of 2019.
Letters of Credit
As of March 31, 2019 , the Company had $28,700 letters of credit outstanding under the Amended and Restated Asset-Based Revolving Credit Agreement.Additionally, as of March 31, 2019 , the Company had $135,746 letters of credit outstanding under the Amended and Restated Letter of Credit Agreement datedNovember 9, 2018 between ANR, Inc. and Citibank, N.A. and $11,876 letters of credit outstanding under the Credit and Security Agreement dated June 30, 2017,and related amendments, between ANR, Inc. and First Tennessee Bank National Association.
(d) Legal Proceedings
The Company is party to legal proceedings from time to time. These proceedings, as well as governmental examinations, could involve various business unitsand a variety of claims including, but not limited to, contract disputes, personal injury claims, property damage claims (including those resulting from blasting,trucking and flooding), environmental and safety issues, securities-related matters and employment matters. While some legal matters may specify the damagesclaimed by the plaintiffs, many seek an unquantified amount of damages. Even when the amount of damages claimed against the Company or its subsidiaries isstated, (i) the claimed amount may be exaggerated or unsupported; (ii) the claim may be based on a novel legal theory or involve a large number of parties; (iii)there may be uncertainty as to the likelihood of a class being certified or the ultimate size of the class; (iv) there may be uncertainty as to the outcome of pendingappeals or motions; and/or (v) there may be significant factual issues to be resolved. As a result, if such legal matters arise in the future, the Company may beunable to estimate a range of possible loss for matters that have not yet progressed sufficiently through discovery and development of important factual informationand legal issues. The Company records accruals based on an estimate of the ultimate outcome of these matters, but these estimates can be difficult to determine andinvolve significant judgment.
( 20 ) Segment Information
38

Table of ContentsCONTURA ENERGY, INC. AND SUBSIDIARIES
Notes to Condensed Consolidated Financial Statements(Unaudited, amounts in thousands except share and per share data)
The Company extracts, processes and markets met and thermal coal from surface and deep mines for sale to electric utilities, steel and coke producers, andindustrial customers. The Company conducts mining operations only in the United States with mines in Northern and Central Appalachia. The Company has fourreportable segments: CAPP - Met, CAPP - Thermal, NAPP, and Trading and Logistics. CAPP - Met consists of eight active mines and two preparation plants inVirginia, seventeen active mines and six preparation plants in West Virginia, as well as expenses associated with certain closed mines. CAPP - Thermal consists ofsix active mines and three preparation plants in West Virginia. NAPP consists of one active mine in Pennsylvania and one preparation plant, as well as expensesassociated with one closed mine. The Trading and Logistics segment primarily engages in coal trading activities and coal terminal services. Prior to the Merger, theCompany had three reportable segments: CAPP, NAPP, and Trading and Logistics.
In addition to the four reportable segments, the All Other category includes general corporate overhead and corporate assets and liabilities and the eliminationof certain intercompany activity.
The operating results of these reportable segments are regularly reviewed by the Chief Operating Decision Maker (“CODM”), who is the Chief ExecutiveOfficer of the Company.
Segment operating results and capital expenditures for the three months ended March 31, 2019 were as follows:
Three Months Ended March 31, 2019
CAPP - Met CAPP - Thermal NAPP Trading andLogistics All Other Consolidated
Total revenues $ 346,499 $ 57,607 $ 71,701 $ 132,603 $ 704 $ 609,114Depreciation, depletion, and amortization $ 36,673 $ 14,112 $ 6,627 $ — $ 3,859 $ 61,271Amortization of acquired intangibles, net $ 4,786 $ 1,155 $ — $ (12,624) $ — $ (6,683)Adjusted EBITDA $ 91,703 $ (4,283) $ 4,754 $ 9,929 $ (18,721) $ 83,382Capital expenditures $ 29,586 $ 2,469 $ 7,999 $ — $ 1,030 $ 41,084
Segment operating results and capital expenditures for the three months ended March 31, 2018 were as follows:
Three Months Ended March 31, 2018
CAPP - Met CAPP - Thermal NAPP Trading andLogistics All Other Consolidated
Total revenues $ 134,836 $ — $ 63,137 $ 283,019 $ 1,340 $ 482,332Depreciation, depletion, and amortization $ 6,236 $ — $ 5,168 $ — $ 184 $ 11,588Amortization of acquired intangibles, net $ — $ — $ — $ 10,206 $ — $ 10,206Adjusted EBITDA $ 57,920 $ — $ 9,290 $ 42,758 $ (10,968) $ 99,000Capital expenditures $ 7,672 $ — $ 11,769 $ — $ — $ 19,441
39

Table of ContentsCONTURA ENERGY, INC. AND SUBSIDIARIES
Notes to Condensed Consolidated Financial Statements(Unaudited, amounts in thousands except share and per share data)
The following table presents a reconciliation of net income (loss) to Adjusted EBITDA for the three months ended March 31, 2019 :
Three Months Ended March 31, 2019
CAPP - Met CAPP - Thermal NAPP Trading andLogistics All Other Consolidated
Net income (loss) from continuing operations $ 53,135 $ (25,129) $ (2,879) $ 22,267 $ (39,404) $ 7,990Interest expense 28 4 1 — 15,122 15,155Interest income (4) — (12) — (1,920) (1,936)Income tax benefit — — — — (4,778) (4,778)Depreciation, depletion and amortization 36,673 14,112 6,627 — 3,859 61,271Merger related costs — — — — 831 831Non-cash stock compensation expense 117 52 — 286 4,816 5,271Mark-to-market adjustment - acquisition-related obligations — — — — 1,936 1,936Accretion on asset retirement obligations 2,333 2,065 1,017 — 817 6,232Cost impact of coal inventory fair valueadjustment (1) 3,718 3,458 — — — 7,176Gain on assets acquired in an exchangetransaction (2) (9,083) — — — — (9,083)Amortization of acquired intangibles, net 4,786 1,155 — (12,624) — (6,683)
Adjusted EBITDA $ 91,703 $ (4,283) $ 4,754 $ 9,929 $ (18,721) $ 83,382(1) The cost impact of the coal inventory fair value adjustment as a result of the Alpha Merger is expected to have short-term impact.(2) During the three months ended March 31, 2019 , the Company entered into an exchange transaction which primarily included the release of the PRB overridingroyalty interest owed to the Company in exchange for met coal reserves which resulted in a gain of $9,083 .
40

Table of ContentsCONTURA ENERGY, INC. AND SUBSIDIARIES
Notes to Condensed Consolidated Financial Statements(Unaudited, amounts in thousands except share and per share data)
The following table presents a reconciliation of net income (loss) to Adjusted EBITDA for the three months ended March 31, 2018 :
Three Months Ended March 31, 2018
CAPP - Met CAPP - Thermal NAPP Trading andLogistics All Other Consolidated
Net income (loss) from continuing operations $ 49,860 $ — $ 3,115 $ 32,552 $ (27,227) $ 58,300Interest expense 309 — 68 — 8,828 9,205Interest income (4) — (2) — (125) (131)Income tax expense — — — — 66 66Depreciation, depletion and amortization 6,236 — 5,168 — 184 11,588Merger related costs — — — — 460 460Management restructuring costs (1) — — — — 2,659 2,659Non-cash stock compensation expense — — — — 4,479 4,479Gain on settlement of acquisition-relatedobligations — — — — (292) (292)Accretion on asset retirement obligations 1,519 — 941 — — 2,460Amortization of acquired intangibles, net — — — 10,206 — 10,206
Adjusted EBITDA $ 57,920 $ — $ 9,290 $ 42,758 $ (10,968) $ 99,000(1) Management restructuring costs are related to severance expense associated with senior management changes in the three months ended March 31, 2018 .
No asset information has been provided for these reportable segments as the CODM does not regularly review asset information by reportable segment.
The Company markets produced, processed and purchased coal to customers in the United States and in international markets, primarily India, Brazil,Netherlands, France, and Sweden. Export coal revenues were the following:
Three Months Ended March 31,
2019 2018
Total coal revenues (1) $ 606,960 $ 478,365Export coal revenues (1) (2) $ 343,306 $ 421,555Export coal revenues as % of total coal revenues (1) 57% 88%
(1) Amounts include freight and handling revenues.(2) The amounts for the three months ended March 31, 2019 include $125,598 of export coal revenues, including freight and handling revenues, from external
customers in India, recorded within the CAPP - Met, CAPP - Thermal, and Trading and Logistics segments. The amounts for the three months ended March 31,2018 include $166,284 and $66,606 of export coal revenues, including freight and handling revenues, from external customers in India and Brazil, respectively,recorded within the CAPP - Met, NAPP, and Trading and Logistics segments. Revenue is tracked within the Company’s accounting records based on theproduct destination.
The Company sold 720 and 1,522 tons of coal purchased from third parties, excluding tons sold related to the Back-to-Back Coal Supply Agreements, for thethree months ended March 31, 2019 and 2018 , respectively, representing approximately 12% and 40% , respectively, of total coal sales volume during suchperiods. The Company purchased 1,099 tons of this coal from Alpha during the three months ended March 31, 2018 .
Additionally, two of the Company’s customers had outstanding balances each in excess of 10% of the total accounts receivable balance as of March 31, 2019,and two of the Company’s customers had outstanding balances each in excess of 10% of the total accounts receivable balance as of December 31, 2018.
41

Table of ContentsCONTURA ENERGY, INC. AND SUBSIDIARIES
Notes to Condensed Consolidated Financial Statements(Unaudited, amounts in thousands except share and per share data)
( 21 ) Investment in Unconsolidated Affiliate
Dominion Terminal Associates (“DTA”)
On March 31, 2017, the Company acquired a portion of another partner’s interest in DTA for $13,293 thereby increasing its ownership in DTA to sixty-fivepercent . DTA is reliant upon continuous cash contributions from the partners to fund its operating costs. The Company’s cash contributions totaled $3,536 for thethree months ended March 31, 2019 . The capital contributions which increase the capital accounts of the respective partners are a form of future subordinatedfinancial support required by DTA to finance its activities. As a result, the Company has concluded DTA does not have sufficient equity investment to finance itsactivities without the support from the equity partners and is a variable interest entity. Prior to the purchase of the additional interest in DTA, no single party held amajority ownership interest in DTA. After the transaction, there are two remaining owners and Contura holds a sixty-five percent voting ownership interest inDTA. However, two representatives must be present for business to be conducted and consent and unanimous approval of both the members is required fordecisions to be taken. Further, there are no provisions that allow either party to override or otherwise unilaterally make a decision. As a result, the Company hasconcluded that it does not have the power to direct the activities that most significantly impact its economic performance and therefore is not the primarybeneficiary. Accordingly, the Company continues to apply the equity method of accounting.
The Company recorded equity method losses, before taxes, from DTA of ($484) and ($63) for the three months ended March 31, 2019 and 2018 , respectively.As of March 31, 2019 and December 31, 2018 , the Company’s investment in DTA was $18,288 and $15,236 , respectively, and is recorded within other non-current assets within the Company’s Condensed Consolidated Balance Sheets.
Condensed income statement information for the three months ended March 31, 2019 and 2018 for DTA is presented in the following table:
Three Months Ended March 31,
2019 2018
Operating expenses $ 6,734 $ 6,217Other income, net $ (5,287) $ (5,364)Total expenses, net $ 1,447 $ 853Contributions from partners to fund continuing operations $ 5,464 $ 788Expenses (over)/under contributions $ 4,017 $ (65)Depreciation and amortization $ 1,344 $ 1,396
( 22 ) Subsequent Events
On May 15, 2019, the Company executed a commitment letter with certain of the Company’s existing shareholders who have committed to provide a new 5 -year First Lien Facility (the “Facility”) with an aggregate principal amount of $555,000 to refinance the Company’s existing Term Loan Credit Facility. Theexisting Term Loan Credit Facility has $17,072 of unamortized discount and $10,270 of unamortized debt issuance costs as of March 31, 2019 that will beanalyzed to determine if some or all of these amounts should be written off as part of the refinancing. The new Facility is expected to have an original issuediscount of 3.00% of the aggregate principal amount, a commitment fee of 2.00% of the aggregate principal amount and other customary fees. The interest rate onthe new Facility is expected to be LIBOR plus 700 basis points for the first two years after closing, increased to LIBOR plus 800 basis points thereafter, with aLIBOR floor of 2.00% . The closing of the Facility is subject to customary closing conditions.
42

Table of Contents
GLOSSARY
Acquisition. Refers to the transaction by which Contura acquired certain of Alpha’s core coal operations as part of the Alpha Restructuring.
Alpha. Alpha Natural Resources, Inc.
Alpha’s Plan of Reorganization. Alpha’s plan of reorganization approved on July 7, 2016 and effective as of July 26, 2016.
Alpha Restructuring. The series of bankruptcy restructuring transactions which led to Alpha’s emergence from Chapter 11 bankruptcy on July 26, 2016.
Ash. Impurities consisting of iron, alumina and other incombustible matter that are contained in coal. Since ash increases the weight of coal, it adds to the costof handling and can affect the burning characteristics of coal.
Back-to-Back Coal Supply Agreement. An agreement with Blackjewel (the “Buyer”) under the terms of the asset purchase agreement associated with the saleof PRB under which the Buyer will supply, deliver and sell to the Company, and the Company will accept, purchase and pay for, all coal that the Company isobligated to supply, deliver and sell under PRB coal supply agreements existing as of the transaction closing date that did not transfer to the Buyer at closing.
British Thermal Unit or BTU. A measure of the thermal energy required to raise the temperature of one pound of pure liquid water one degree Fahrenheit atthe temperature at which water has its greatest density (39 degrees Fahrenheit).
Central Appalachia or CAPP. Coal producing area in eastern Kentucky, Virginia, southern West Virginia and a portion of eastern Tennessee.
Coal seam. Coal deposits occur in layers. Each layer is called a “seam.”
Coke. A hard, dry carbon substance produced by heating coal to a very high temperature in the absence of air. Coke is used in the manufacture of iron andsteel. Its production results in a number of useful byproducts.
Longwall mining. The most productive underground mining method in the United States. A rotating drum is trammed mechanically across the face of coal,and a hydraulic system supports the roof of the mine while the drum advances through the coal. Chain conveyors then move the loosened coal to a standardunderground mine conveyor system for delivery to the surface.
Metallurgical coal. The various grades of coal suitable for carbonization to make coke for steel manufacture. Also known as “met” coal, its quality dependson four important criteria: volatility, which affects coke yield; the level of impurities including sulfur and ash, which affect coke quality; composition, whichaffects coke strength; and basic characteristics, which affect coke oven safety. Met coal typically has a particularly high BTU but low ash and sulfur content.
Northern Appalachia or NAPP. Coal producing area in Maryland, Ohio, Pennsylvania and northern West Virginia.
Operating Margin. Coal revenues less cost of coal sales and freight and handling costs.
Powder River Basin or PRB. Coal producing area in northeastern Wyoming and southeastern Montana.
Predecessor. Contura on a carve-out basis using Predecessor Alpha’s historical basis and our assets, liabilities and operating results while they were underPredecessor Alpha’s ownership
Preparation plant. A preparation plant is a facility for crushing, sizing and washing coal to remove impurities and prepare it for use by a particular customer.The washing process has the added benefit of removing some of the coal’s sulfur content. A preparation plant is usually located on a mine site, although one plantmay serve several mines.
Probable reserves. Reserves for which quantity and grade and/or quality are computed from information similar to that used for proven reserves, but the sitesfor inspection, sampling and measurement are farther apart or are otherwise less adequately spaced. The degree of assurance, although lower than that for provenreserves, is high enough to assume continuity between points of observation.
43

Table of Contents
Productivity. As used in this report, refers to clean metric tons of coal produced per underground man hour worked, as published by the MSHA.
Proven reserves. Reserves for which quantity is computed from dimensions revealed in outcrops, trenches, workings or drill holes; grade and/or quality arecomputed from the results of detailed sampling; and the sites for inspection, sampling and measurement are spaced so closely and the geologic character is so welldefined that size, shape, depth and mineral content of reserves are well-established.
Reclamation. The process of restoring land and the environment to their original state following mining activities. The process commonly includes“recontouring” or reshaping the land to its approximate original appearance, restoring topsoil and planting native grass and ground covers. Reclamation operationsare usually underway before the mining of a particular site is completed. Reclamation is closely regulated by both state and federal law.
Reserve. That part of a mineral deposit that could be economically and legally extracted or produced at the time of the reserve determination.
Roof. The stratum of rock or other mineral above a coal seam; the overhead surface of a coal working place.
Sulfur. One of the elements present in varying quantities in coal that contributes to environmental degradation when coal is burned. Sulfur dioxide is producedas a gaseous by-product of coal combustion.
Surface mine. A mine in which the coal lies near the surface and can be extracted by removing the covering layer of soil.
Thermal coal. Coal used by power plants and industrial steam boilers to produce electricity, steam or both. It generally is lower in BTU heat content andhigher in volatile matter than metallurgical coal.
Tons. A “short” or net ton is equal to 2,000 pounds. A “long” or British ton is equal to 2,240 pounds; a “metric” ton (or “ tonne ”) is approximately 2,205pounds. Tonnage amounts in this prospectus are stated in short tons, unless otherwise indicated.
Underground mine. Also known as a “deep” mine. Usually located several hundred feet below the earth’s surface, an underground mine’s coal is removedmechanically and transferred by shuttle car and conveyor to the surface.
44

Table of Contents
Item 2. Management ’ s Discussion and Analysis of Financial Condition and Results of Operations
The following discussion and analysis provides a narrative of our results of operations and financial condition for the three months ended March 31, 2019and 2018 . The following discussion and analysis should be read in conjunction with our Condensed Consolidated Financial Statements and related notes includedelsewhere in this Quarterly Report on Form 10-Q and our Consolidated Financial Statements and related notes and risk factors contained in our Annual Report onForm 10-K for the year ended December 31, 2018.
Non-GAAP Financial Measures
The discussion below contains “non-GAAP financial measures.” These are financial measures which either exclude or include amounts that are not excludedor included in the most directly comparable measures calculated and presented in accordance with generally accepted accounting principles in the United States(“GAAP”). Specifically, we make use of the non-GAAP financial measure “Adjusted EBITDA” and “Adjusted Cost of Produced Coal Sold.” We use AdjustedEBITDA to measure the operating performance of our segments and allocate resources to the segments. Adjusted EBITDA does not purport to be an alternative tonet income (loss) as a measure of operating performance. We use Adjusted Cost of Produced Coal Sold to distinguish the cost of captive produced coal from theeffects of purchased coal, idle costs and acquisition accounting requirements. The presentation of these measures should not be considered in isolation, or as asubstitute for analysis of our results as reported under GAAP.
Management uses non-GAAP financial measures to supplement GAAP results to provide a more complete understanding of the factors and trends affectingthe business than GAAP results alone. The definition of these non-GAAP measures may be changed periodically by management to adjust for significant itemsimportant to an understanding of operating trends. Because not all companies use identical calculations, the presentations of these measures may not be comparableto other similarly titled measures of other companies and can differ significantly from company to company depending on long-term strategic decisions regardingcapital structure, the tax jurisdictions in which companies operate, and capital investments.
Included below are reconciliations of non-GAAP financial measures to GAAP financial measures.
Formation
Contura was incorporated in the State of Delaware on June 10, 2016 to acquire and operate certain of Alpha’s core coal operations, as part of the AlphaRestructuring. Contura began operations on July 26, 2016, when a consortium of former Alpha creditors acquired our common stock in exchange for a partialrelease of their creditor claims pursuant to the Alpha Restructuring. Furthermore, pursuant to an asset purchase agreement between Contura and Alpha, wepurchased certain former core coal operations of Alpha.
Overview
We are a large-scale provider of met and thermal coal to a global customer base, operating high-quality, cost-competitive coal mines across two major U.S.coal basins (CAPP and NAPP) along with a robust Trading and Logistics business. As of March 31, 2019 , our operations consisted of thirty-two active mines andtwelve coal preparation and load-out facilities, with approximately 4,490 employees. We produce, process, and sell met coal and thermal coal from operationslocated in Virginia, West Virginia and Pennsylvania. We also sell coal produced by others, some of which is processed and/or blended with coal produced from ourmines prior to resale, with the remainder purchased for resale by our trading operations. As of December 31, 2018, we had 1.3 billion tons of reserves, including885.5 million tons of proven reserves and 462.9 million tons of probable reserves.
We began operations on July 26, 2016, with mining operations in NAPP, the PRB, and CAPP. Through the Acquisition, Contura acquired a significant reservebase. We also acquired Alpha’s 40.6% interest in the DTA coal export terminal in eastern Virginia, and on March 31, 2017, we acquired a portion of anotherpartner’s ownership stake and increased our interest to 65.0%. On December 8, 2017, the Company closed a transaction to sell the Eagle Butte and Belle Ayr mineslocated in the PRB, Wyoming, along with related coal reserves, equipment, infrastructure and other real properties. The PRB results of operations and financialposition are reported as discontinued operations in the Condensed Consolidated Financial Statements. Refer to Note 3 for further information on discontinuedoperations. The Merger with Alpha Natural Resources Holdings, Inc. and ANR, Inc. was completed on November 9, 2018. Refer to Note 2 for information onterms of the Merger Agreement.
45

Table of Contents
For the three months ended March 31, 2019 and 2018 , sales of met coal were 3.1 million tons and 2.5 million tons, respectively, and accounted forapproximately 52.4% and 65.0% , respectively, of our coal sales volume. Sales of thermal coal were 2.8 million tons and 1.3 million tons, respectively, andaccounted for approximately 47.6% and 35.0% , respectively, of our coal sales volume. These results include sales from our Trading and Logistics business.
Our sales of met coal were made primarily to steel companies in the northeastern and midwestern regions of the United States and in several countries inEurope, Asia and the Americas. Our sales of thermal coal were made primarily to large utilities and industrial customers throughout the United States. For the threemonths ended March 31, 2019 and 2018 approximately 56.6% and 88.1%, respectively, of our total coal revenues, including freight and handling fulfillmentrevenues, were derived from coal sales made to customers outside the United States.
In addition, we generate other revenues from equipment sales, rentals, terminal and processing fees, coal and environmental analysis fees, royalties and thesale of natural gas. We also record freight and handling fulfillment revenue within coal revenues for freight and handling services provided in delivering coal tocertain customers, which are a component of the contractual selling price.
Our primary expenses are operating supply costs, repair and maintenance expenditures, cost of purchased coal, royalties, wages and benefits, post-employmentbenefits, freight and handling costs, and taxes incurred in selling our coal. Historically, our cost of coal sales per ton is lower for sales of our produced andprocessed coal than for sales of purchased coal that we do not process prior to resale.
As of March 31, 2019 , we have four reportable segments: CAPP - Met, CAPP - Thermal, NAPP, and Trading and Logistics. Refer to Note 20 for moreinformation about our reportable segments. CAPP - Met consists of twenty-five active mines, including four mines in Virginia operated by third-party contractors,four mines operated by us in Virginia, and seventeen mines operated by us in West Virginia. CAPP - Met operations also include two preparation plants inVirginia, six preparation plants in West Virginia, as well as expenses associated with certain idled and closed mines. The coal produced by the CAPP - Metsegment is predominantly met coal with some amounts of thermal coal being produced as a byproduct of mining. CAPP - Thermal consists of six active mines andthree preparation plants in West Virginia, as well as expenses associated with certain idle and closed mines. The coal produced by the CAPP - Thermal segment ispredominantly thermal coal with some met coal byproduct. NAPP consists of one active mine in Pennsylvania and one preparation plant, as well as expensesassociated with one closed mine. Our NAPP segment produces primarily thermal coal, however, we are also able to sell part of our Cumberland coal productioninto the met coal market as High-Vol. B, achieving higher realized pricing than if sold as thermal coal. The Trading and Logistics segment focuses primarily oncoal trading and coal terminal facility services. Our All Other category includes general corporate overhead and corporate assets and liabilities and the eliminationof certain intercompany activity.
Business Developments
Merger with Alpha Natural Resources Holdings, Inc. and ANR, Inc.
The Merger with ANR, Inc. (“ANR”) and Alpha Natural Resources Holdings, Inc. (“Holdings”, and, together with ANR, the "Alpha Companies”) wascompleted on November 9, 2018 (the “Merger” or the “Alpha Merger”) and the Alpha Companies’ financial results are not included in the CondensedConsolidated Financial Statements in periods prior to November 9, 2018. Refer to Note 2 for information on Alpha Merger and terms of the Merger Agreement.
Upon the consummation of the transactions contemplated by the Merger Agreement, our common stock began trading on the New York Stock Exchangeunder the ticker “CTRA.”
Sale of PRB Operations
On December 8, 2017, we closed a transaction with Blackjewel L.L.C. (“Buyer”) to sell the Eagle Butte and Belle Ayr mines located in the Power River Basin(“PRB”). During the permit transfer period, we will maintain the required reclamation bonds and related collateral. As of March 31, 2019 , we had outstandingsurety bonds with a total face amount of $237.3 million to secure various obligations and commitments related to the PRB. A citizens’ organization filed objectionsto the permit transfer with the Wyoming Environmental Quality Council on November 16, 2018. The objections are scheduled to be heard on May 15 and 16,2019. We believe the objections are without merit. Once the permits have been transferred, we estimate approximately $9.1 million comprised of short-termrestricted cash and short-term deposits will be returned to operating cash. If the permit transfer process is not completed as expected, it could have material,adverse effects on us.
46

Table of Contents
The PRB results of operations and financial position are reported as discontinued operations in the Condensed Consolidated Financial Statements. Thediscontinued operations include our former PRB segment. To conform with the Condensed Consolidated Financial Statements and accompanying Notes, theformer PRB segment information for the discontinued operation has been eliminated. Refer to Note 3 for further information on discontinued operations.
Per terms of the Back-to-Back Coal Supply Agreements, we are required to purchase and sell coal in the remainder of 2019 and 2020 totaling $12.2 millionand $9.2 million , respectively. For the three months ended March 31, 2019 , we purchased and sold 0.4 million tons, totaling $3.9 million , under the Back-to-Back Coal Supply Agreements. For the three months ended March 31, 2018 , we purchased and sold 3.2 million tons, totaling $33.7 million , under the Back-to-Back Coal Supply Agreements.
During the third quarter of 2018, Blackjewel L.L.C. (“Blackjewel”) procured surety bonds for a total of $220.5 million to facilitate the transfer of record bythe State of Wyoming of the Belle Ayr and Eagle Butte mine permits from Contura Coal West, LLC to Blackjewel as required by the Asset Purchase Agreementdated as of December 7, 2017, among Blackjewel, Contura Energy, Inc. (“Contura”), Contura Coal West, LLC, Contura Wyoming Land, LLC, Contura Coal Sales,LLC, and Contura Energy Services, LLC.
Contura agreed to backstop a total of $44.8 million of Blackjewel’s bonding obligations with respect to the Belle Ayr and Eagle Butte permits by entering intosecondary general indemnification agreements and providing letters of credit totaling $18.8 million to the sureties as collateral for Contura’s indemnificationobligations. This arrangement provides cost reimbursement for the issuing sureties. Indemnity bonds were issued by a third-party insurer in favor of Contura in atotal amount of $26.0 million to insure Blackjewel’s performance obligations to Contura with respect to cancellation of the general indemnification agreements andreturn of the letters of credit.
Blackjewel agreed that, by June 30, 2019, it will (i) enter into financing arrangements of $44.8 million to be held as collateral by the sureties and (ii) causeeach surety to release and return each letter of credit and cancel the Contura general indemnification agreements.
Blackjewel’s performance obligations are also collateralized by a security interest in mobile equipment granted to Contura under 8.6(c) of the Asset PurchaseAgreement. Further, in connection with this arrangement, approximately $8.0 million in surety cash collateral previously supporting reclamation bonds wasreturned to Contura by certain of its sureties.
During the third quarter of 2018, we recorded a guarantee within discontinued operations to account for the Blackjewel surety bonding arrangement with nomaterial impact on our Condensed Consolidated Financial Statements.
Factors Affecting Our Results of Operations
Sales Volume. We earn revenues primarily through the sale of coal produced at our operations and resale of coal purchased from third parties. During the threemonths ended March 31, 2019 , we sold 3.1 million tons of met coal, including 0.4 million tons from our Trading and Logistics business, and 2.8 million tons ofthermal coal, including 0.1 million tons from our Trading and Logistics business. During the three months ended March 31, 2018 , we sold 2.5 million tons of metcoal, including 1.5 million tons from our Trading and Logistics business, and 1.3 million tons of thermal coal.
Sales Agreements
We manage our commodity price risk for coal sales through the use of coal supply agreements. As of May 7, 2019, we expect to ship on sales commitments ofapproximately 7.2 million tons of NAPP coal for 2019, 98% of which is priced at an average realized price per ton of $43.12, 9.8 million tons of CAPP - Met coalfor 2019, 79% of which is priced at an average realized price per ton of $125.68, and 4.4 million tons of CAPP - Thermal coal for 2019, 100% of which is priced atan average realized price per ton of $55.16.
Realized Pricing . Our realized price per ton of coal is influenced by many factors that vary by region, including (i) coal quality, which includes energy (heatcontent), sulfur, ash, volatile matter and moisture content; (ii) differences in market conventions concerning transportation costs and volume measurement; and(iii) regional supply and demand.
• Coal Quality. The energy content or heat value of thermal coal is a significant factor influencing coal prices as higher energy coal is more desirable toconsumers and typically commands a higher price in the market. The heat value of coal is commonly measured in British thermal units or the amount ofheat needed to raise the temperature of one pound of water by one degree Fahrenheit. Coal from the eastern and midwest regions of the United Statestends to
47
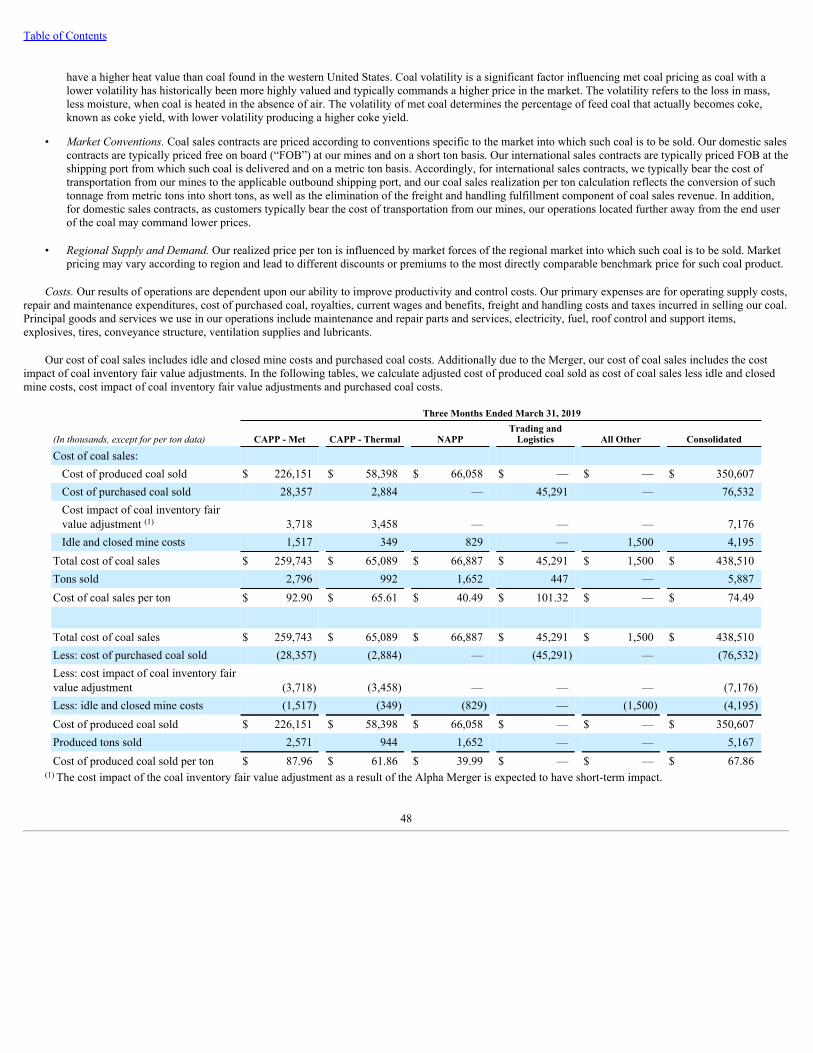
Table of Contents
have a higher heat value than coal found in the western United States. Coal volatility is a significant factor influencing met coal pricing as coal with alower volatility has historically been more highly valued and typically commands a higher price in the market. The volatility refers to the loss in mass,less moisture, when coal is heated in the absence of air. The volatility of met coal determines the percentage of feed coal that actually becomes coke,known as coke yield, with lower volatility producing a higher coke yield.
• Market Conventions. Coal sales contracts are priced according to conventions specific to the market into which such coal is to be sold. Our domestic salescontracts are typically priced free on board (“FOB”) at our mines and on a short ton basis. Our international sales contracts are typically priced FOB at theshipping port from which such coal is delivered and on a metric ton basis. Accordingly, for international sales contracts, we typically bear the cost oftransportation from our mines to the applicable outbound shipping port, and our coal sales realization per ton calculation reflects the conversion of suchtonnage from metric tons into short tons, as well as the elimination of the freight and handling fulfillment component of coal sales revenue. In addition,for domestic sales contracts, as customers typically bear the cost of transportation from our mines, our operations located further away from the end userof the coal may command lower prices.
• Regional Supply and Demand. Our realized price per ton is influenced by market forces of the regional market into which such coal is to be sold. Marketpricing may vary according to region and lead to different discounts or premiums to the most directly comparable benchmark price for such coal product.
Costs. Our results of operations are dependent upon our ability to improve productivity and control costs. Our primary expenses are for operating supply costs,repair and maintenance expenditures, cost of purchased coal, royalties, current wages and benefits, freight and handling costs and taxes incurred in selling our coal.Principal goods and services we use in our operations include maintenance and repair parts and services, electricity, fuel, roof control and support items,explosives, tires, conveyance structure, ventilation supplies and lubricants.
Our cost of coal sales includes idle and closed mine costs and purchased coal costs. Additionally due to the Merger, our cost of coal sales includes the costimpact of coal inventory fair value adjustments. In the following tables, we calculate adjusted cost of produced coal sold as cost of coal sales less idle and closedmine costs, cost impact of coal inventory fair value adjustments and purchased coal costs.
Three Months Ended March 31, 2019
(In thousands, except for per ton data) CAPP - Met CAPP - Thermal NAPP Trading andLogistics All Other Consolidated
Cost of coal sales: Cost of produced coal sold $ 226,151 $ 58,398 $ 66,058 $ — $ — $ 350,607Cost of purchased coal sold 28,357 2,884 — 45,291 — 76,532Cost impact of coal inventory fairvalue adjustment (1) 3,718 3,458 — — — 7,176Idle and closed mine costs 1,517 349 829 — 1,500 4,195
Total cost of coal sales $ 259,743 $ 65,089 $ 66,887 $ 45,291 $ 1,500 $ 438,510Tons sold 2,796 992 1,652 447 — 5,887Cost of coal sales per ton $ 92.90 $ 65.61 $ 40.49 $ 101.32 $ — $ 74.49
Total cost of coal sales $ 259,743 $ 65,089 $ 66,887 $ 45,291 $ 1,500 $ 438,510Less: cost of purchased coal sold (28,357) (2,884) — (45,291) — (76,532)Less: cost impact of coal inventory fairvalue adjustment (3,718) (3,458) — — — (7,176)Less: idle and closed mine costs (1,517) (349) (829) — (1,500) (4,195)Cost of produced coal sold $ 226,151 $ 58,398 $ 66,058 $ — $ — $ 350,607Produced tons sold 2,571 944 1,652 — — 5,167Cost of produced coal sold per ton $ 87.96 $ 61.86 $ 39.99 $ — $ — $ 67.86
(1) The cost impact of the coal inventory fair value adjustment as a result of the Alpha Merger is expected to have short-term impact.
48

Table of Contents
Three Months Ended March 31, 2018
(In thousands, except for per ton data) CAPP - Met CAPP - Thermal NAPP Trading andLogistics All Other Consolidated
Cost of coal sales: Cost of produced coal sold $ 66,646 $ — $ 53,077 $ — $ — $ 119,723Cost of purchased coal sold 9,034 — — 164,524 — 173,558Idle and closed mine costs 1,068 — 729 — — 1,797
Total cost of coal sales $ 76,748 $ — $ 53,806 $ 164,524 $ — $ 295,078Tons sold 954 — 1,414 1,449 — 3,817Cost of coal sales per ton $ 80.45 $ — $ 38.05 $ 113.54 $ — $ 77.31
Total cost of coal sales $ 76,748 $ — $ 53,806 $ 164,524 $ — $ 295,078Less: cost of purchased coal sold (9,034) — — (164,524) — (173,558)Less: idle and closed mine costs (1,068) — (729) — — (1,797)Cost of produced coal sold $ 66,646 $ — $ 53,077 $ — $ — $ 119,723Produced tons sold 880 — 1,414 — — 2,294Cost of produced coal sold per ton $ 75.73 $ — $ 37.54 $ — $ — $ 52.19
Our management strives to aggressively control costs and improve operating performance to mitigate external cost pressures. We experience volatility inoperating costs related to fuel, explosives, steel, tires, contract services and healthcare, among others, and take measures to mitigate the increases in these costs atall operations. We have a centralized sourcing group for major supplier contract negotiation and administration, for the negotiation and purchase of major capitalgoods, and to support the business units. We promote competition between suppliers and seek to develop relationships with suppliers that focus on lowering ourcosts. We seek suppliers who identify and concentrate on implementing continuous improvement opportunities within their area of expertise. To the extent upwardpressure on costs exceeds our ability to realize sales increases, or if we experience unanticipated operating or transportation difficulties, our operating marginswould be negatively impacted. We may also experience difficult geologic conditions, delays in obtaining permits, labor shortages, unforeseen equipment problems,and unexpected shortages of critical materials such as tires, fuel and explosives that may result in adverse cost increases and limit our ability to produce atforecasted levels.
Results of Operations
Our results of operations for the three months ended March 31, 2019 and 2018 are discussed in these “Results of Operations” presented below.
Three Months Ended March 31, 2019 Compared to the Three Months Ended March 31, 2018
The following tables summarize certain financial information relating to our operating results that have been derived from our Condensed ConsolidatedFinancial Statements for the three months ended March 31, 2019 and 2018 .
49

Table of Contents
Revenues
Three Months Ended March 31, Increase (Decrease)
(In thousands, except for per ton data) 2019 2018 $ or Tons %
Revenues: Coal revenues:
Met $ 397,657 $ 346,650 $ 51,007 14.7 %Thermal 132,119 56,049 76,070 135.7 %Freight and handling fulfillment revenues (1) 77,184 75,666 1,518 2.0 %
Other revenues 2,154 3,967 (1,813) (45.7)%
Total revenues $ 609,114 $ 482,332 $ 126,782 26.3 %
Tons sold: Met 3,088 2,481 607 24.5 %Thermal 2,799 1,336 1,463 109.5 %
Total 5,887 3,817 2,070 54.2 %
Coal sales realization per ton (2) : Met $ 128.77 $ 139.72 $ (10.95) (7.8)%Thermal $ 47.20 $ 41.95 $ 5.25 12.5 %Average $ 89.99 $ 105.50 $ (15.51) (14.7)%
Three Months Ended March 31, Increase (Decrease)
(In thousands, except for per ton data) 2019 2018 $ or Tons %
Coal revenues (2) : CAPP - Met operations $ 345,821 $ 134,569 $ 211,252 157.0 %CAPP - Thermal operations 57,315 — 57,315 100.0 %NAPP operations 70,855 61,458 9,397 15.3 %Trading and Logistics operations 55,785 206,672 (150,887) (73.0)%
Total coal revenues $ 529,776 $ 402,699 $ 127,077 31.6 %
Tons sold: CAPP - Met operations 2,796 954 1,842 193.1 %CAPP - Thermal operations 992 — 992 100.0 %NAPP operations 1,652 1,414 238 16.8 %Trading and Logistics operations 447 1,449 (1,002) (69.2)%
Coal sales realization per ton (2) : CAPP - Met operations $ 123.68 $ 141.06 $ (17.38) (12.3)%CAPP - Thermal operations $ 57.78 $ — $ 57.78 100.0 %NAPP operations $ 42.89 $ 43.46 $ (0.57) (1.3)%Trading and Logistics operations $ 124.80 $ 142.63 $ (17.83) (12.5)%Average $ 89.99 $ 105.50 $ (15.51) (14.7)%
(1) Pursuant to the adoption of Accounting Standards Codification 606, freight and handling fulfillment revenues for the three months ended March 31, 2019 and2018 are included within coal revenues. Refer to Note 4 .
(2) Does not include $77.2 million and $75.7 million of freight and handling fulfillment revenues for the three months ended March 31, 2019 and 2018 ,respectively.
50

Table of Contents
Total revenues. Total revenues increased $126.8 million , or 26.3% , for the three months ended March 31, 2019 compared to the prior year period. Theincrease in total revenues was due to increased coal revenues of $127.1 million and increased freight and handling fulfillment revenues of $1.5 million , partiallyoffset by decreased other revenues of $1.8 million .
Coal revenues. Coal revenues increased $127.1 million , or 31.6% , for the three months ended March 31, 2019 compared to the prior year period. Theincrease in coal revenues was due primarily to increased revenues of 157.0% and 15.3% for CAPP - Met and NAPP, respectively, and the addition of revenuesfrom the CAPP - Thermal operations during the current year period, partially offset by decreased revenues of 73.0% for our Trading and Logistics operations.
The increase in CAPP - Met revenues was primarily due to higher coal sales volume of 1.8 million tons, partially offset by lower coal sales realization of$17.38 per ton. CAPP - Thermal revenues consisted of 1.0 million tons sold at a coal sales realization of $57.78 per ton. The increase in NAPP revenues wasprimarily due to higher coal sales volumes of 0.2 million tons, partially offset by lower coal sales realization of $0.57 per ton. Trading and Logistics coal revenuesdecreased due to lower sales volumes of 1.0 million tons and lower coal sales realization of $17.83 per ton, primarily related to decreased sales of coal purchasedfrom the Alpha Companies during the current period as a result of the Merger.
Our sales mix of met coal and thermal coal based on volume was 52.4% and 47.6% , respectively, for the three months ended March 31, 2019 compared to65.0% and 35.0% , respectively, in the prior year period. Our sales mix of met coal and thermal coal based on coal revenues, excluding freight and handlingfulfillment revenues, was 75.1% and 24.9%, respectively, for the three months ended March 31, 2019 compared to 86.1% and 13.9%, respectively, for the prioryear period.
Met coal volumes increased 0.6 million tons due to increased domestic met sales during the current period related to properties acquired in the Merger, andaverage coal realization per ton decreased $10.95 . Thermal coal volumes increased 1.5 million tons due to increased domestic thermal sales during the currentperiod related to properties acquired in the Merger, and average coal realization per ton increased $5.25 . The increase in coal revenues consisted of increased metcoal revenue of $51.0 million , or 14.7% and increased thermal coal revenue of $76.1 million , or 135.7% .
Freight and handling fulfillment revenues were $77.2 million for the three months ended March 31, 2019 , an increase of $1.5 million , or 2.0% , compared tothe prior year period. This increase was primarily due to increased shipping rates during the current period.
Other revenues. Other revenues were $2.2 million for the three months ended March 31, 2019 , a decrease of $1.8 million , or 45.7% , compared to the prioryear period, primarily attributable to a $0.6 million decrease in coal royalty revenues, a $0.6 million decrease in terminal revenues, and a $0.9 million decrease inrail transportation rebates.
Costs and Expenses
Three Months Ended March 31, Increase (Decrease)
(In thousands, except for per ton data) 2019 2018 $ or Tons %
Cost of coal sales (exclusive of items shown separately below) $ 438,510 $ 295,078 $ 143,432 48.6 %Freight and handling costs 77,184 75,666 1,518 2.0 %Depreciation, depletion and amortization 61,271 11,588 49,683 428.7 %Accretion on asset retirement obligations 6,232 2,460 3,772 153.3 %Amortization of acquired intangibles, net (6,683) 10,206 (16,889) (165.5)%Selling, general and administrative expenses (exclusive ofdepreciation, depletion and amortization shown separately above) 20,951 19,157 1,794 9.4 %Merger related costs 831 460 371 80.7 %Total other operating (income) loss: Mark-to-market adjustment for acquisition-related obligations 1,936 — 1,936 100.0 %Other income (8,899) (99) (8,800) (8,888.9)%
Total costs and expenses 591,333 414,516 176,817 42.7 %Other income (expense):
51

Table of Contents
Interest expense (15,155) (9,205) (5,950) (64.6)%Interest income 1,936 131 1,805 1,377.9 %Equity loss in affiliates (484) (63) (421) (668.3)%Miscellaneous income, net (866) (313) (553) (176.7)%
Total other expense, net (14,569) (9,450) (5,119) (54.2)%Income tax benefit (expense) 4,778 (66) 4,844 7,339.4 %Net income from continuing operations $ 7,990 $ 58,300 $ (50,310) (86.3)%
Cost of coal sales: CAPP - Met operations $ 259,743 $ 76,748 $ 182,995 238.4 %CAPP - Thermal operations $ 65,089 $ — $ 65,089 100.0 %NAPP operations $ 66,887 $ 53,806 $ 13,081 24.3 %Trading and Logistics operations $ 45,291 $ 164,524 $ (119,233) (72.5)%
Tons sold: CAPP - Met operations 2,796 954 1,842 193.1 %CAPP - Thermal operations 992 — 992 100.0 %NAPP operations 1,652 1,414 238 16.8 %Trading and Logistics operations 447 1,449 (1,002) (69.2)%
Cost of coal sales per ton: CAPP - Met operations $ 92.90 $ 80.45 $ 12.45 15.5 %CAPP - Thermal operations $ 65.61 $ — $ 65.61 100.0 %NAPP operations $ 40.49 $ 38.05 $ 2.44 6.4 %Trading and Logistics operations $ 101.32 $ 113.54 $ (12.22) (10.8)%
Coal margin per ton (1) : CAPP - Met operations $ 30.78 $ 60.61 $ (29.83) (49.2)%CAPP - Thermal operations $ (7.83) $ — $ (7.83) (100.0)%NAPP operations $ 2.40 $ 5.41 $ (3.01) (55.6)%Trading and Logistics operations $ 23.48 $ 29.09 $ (5.61) (19.3)%
(1) Coal margin per ton for our reportable segments is calculated as coal sales realization per ton for our reportable segments less cost of coal sales per ton for ourreportable segments. Coal margin per ton is not shown for our All Other category since it has no coal sales or coal production related to our continuingoperations.
Cost of coal sales. Cost of coal sales increased $143.4 million , or 48.6% , for the three months ended March 31, 2019 compared to the prior year period. Theincrease was primarily driven by salaries and wages expense and supplies and maintenance expense related to properties acquired in the Merger, partially offset bydecreased costs of purchased coal during the current period.
Freight and handling costs. Freight and handling costs increased $1.5 million , or 2.0% , for the three months ended March 31, 2019 compared to the prioryear period. This increase was primarily due to increased shipping rates during the current period.
Depreciation, depletion and amortization. Depreciation, depletion and amortization increased $49.7 million , or 428.7% , for the three months ended March31, 2019 compared to the prior year period. The increase in depreciation, depletion and amortization primarily related to increased purchases of machinery andequipment, increased asset development during the current period, and additions of property, plant and equipment and owned and leased mineral rights as a resultof the Merger.
52

Table of Contents
Accretion on asset retirement obligations. Accretion on asset retirement obligations increased $3.8 million , or 153.3% , for the three months ended March 31,2019 compared to the prior year period. This increase was primarily due to an increase in our asset retirement obligations as a result of the Merger.
Amortization of acquired intangibles, net. Amortization of acquired intangibles, net decreased $16.9 million , or 165.5% , for the three months ended March31, 2019 compared to the prior year period. The decrease was primarily driven by the current period amortization related to below-market acquired intangiblesacquired as a result of the Merger.
Selling, general and administrative. Selling, general and administrative expenses increased $1.8 million , or 9.4% for the three months ended March 31, 2019compared to the prior year period. This increase in expense was primarily related to increases of $1.9 million in wages and benefits expense, $1.9 million inprofessional fees, partially offset by decreases of $2.7 million in severance pay during the current period.
Acquisition-related obligations. For the three months ended March 31, 2019 we recorded a mark-to-market adjustment for acquisition-related obligations of$1.9 million related to the Contingent Revenue Obligation.
Other income. Other income increased $8.8 million for the three months ended March 31, 2019 compared to the prior year period. This increase primarilyrelated to the gain on assets acquired in an exchange transaction of $9.1 million recorded during the three months ended March 31, 2019.
Interest expense. Interest expense increased $6.0 million , or 64.6% , for the three months ended March 31, 2019 compared to the prior year period, primarilydue to higher interest costs associated with Company debt as a result of the prior year debt refinance. Refer to Note 10 for additional information.
Income taxes. Income tax benefit of $4.8 million was recorded for the three months ended March 31, 2019 on income from continuing operations beforeincome taxes of $3.2 million . The effective tax rate is lower than the federal statutory rate of 21% primarily due to the impact of the percentage depletionallowance, the permanent impact of stock-based compensation deductions, and the reduction in the valuation allowance.
Income tax expense of $0.1 million was recorded for the three months ended March 31, 2018 on income from continuing operations before income taxes of$58.4 million . The effective tax rate is lower than the federal statutory rate of 21% primarily due to the impact of the percentage depletion allowance and thereduction in the valuation allowance, partially offset by the impact of state income taxes, net of federal tax impact. Refer to Note 15 for additional information.
Segment Adjusted EBITDA
Segment Adjusted EBITDA for our reportable segments is a financial measure. This non-GAAP financial measure is presented as a supplemental measure andis not intended to replace financial performance measures determined in accordance with GAAP. Moreover, this measure is not calculated identically by allcompanies and therefore may not be comparable to similarly titled measures used by other companies. Segment Adjusted EBITDA is presented becausemanagement believes it is a useful indicator of the financial performance of our coal operations. The following tables presents a reconciliation of net income (loss)to Adjusted EBITDA for the three months ended March 31, 2019 and 2018:
53

Table of Contents
Three Months Ended March 31, 2019
(In thousands) CAPP - Met CAPP - Thermal NAPP Trading andLogistics All Other Consolidated
Net income (loss) from continuing operations $ 53,135 $ (25,129) $ (2,879) $ 22,267 $ (39,404) $ 7,990Interest expense 28 4 1 — 15,122 15,155Interest income (4) — (12) — (1,920) (1,936)Income tax benefit — — — — (4,778) (4,778)Depreciation, depletion and amortization 36,673 14,112 6,627 — 3,859 61,271Merger related costs — — — — 831 831Non-cash stock compensation expense 117 52 — 286 4,816 5,271Mark-to-market adjustment - acquisition-related obligations — — — — 1,936 1,936Accretion on asset retirement obligations 2,333 2,065 1,017 — 817 6,232Cost impact of coal inventory fair valueadjustment (1) 3,718 3,458 — — — 7,176Gain on assets acquired in an exchangetransaction (2) (9,083) — — — — (9,083)Amortization of acquired intangibles, net 4,786 1,155 — (12,624) — (6,683)
Adjusted EBITDA $ 91,703 $ (4,283) $ 4,754 $ 9,929 $ (18,721) $ 83,382(1) The cost impact of the coal inventory fair value adjustment as a result of the Alpha Merger is expected to have short-term impact.(2) During the three months ended March 31, 2019 , the Company entered into an exchange transaction which primarily included the release of the PRB overridingroyalty interest owed to the Company in exchange for met coal reserves which resulted in a gain of $9.1 million .
Three Months Ended March 31, 2018
(In thousands) CAPP - Met CAPP - Thermal NAPP Trading andLogistics All Other Consolidated
Net income (loss) from continuing operations $ 49,860 $ — $ 3,115 $ 32,552 $ (27,227) $ 58,300Interest expense 309 — 68 — 8,828 9,205Interest income (4) — (2) — (125) (131)Income tax expense — — — — 66 66Depreciation, depletion and amortization 6,236 — 5,168 — 184 11,588Merger related costs — — — — 460 460Management restructuring costs (1) — — — — 2,659 2,659Non-cash stock compensation expense — — — — 4,479 4,479Gain on settlement of acquisition-relatedobligations — — — — (292) (292)Accretion on asset retirement obligations 1,519 — 941 — — 2,460Amortization of acquired intangibles, net — — — 10,206 — 10,206
Adjusted EBITDA $ 57,920 $ — $ 9,290 $ 42,758 $ (10,968) $ 99,000(1) Management restructuring costs are related to severance expense associated with senior management changes in the three months ended March 31, 2018 .
54

Table of Contents
The following table summarizes Adjusted EBITDA for our three reportable segments and All Other category:
Three Months Ended March 31, Increase (Decrease)
(In thousands) 2019 2018 $ or Tons %
Adjusted EBITDA CAPP - Met operations $ 91,703 $ 57,920 $ 33,783 58.3 %CAPP - Thermal operations (4,283) — (4,283) (100.0)%NAPP operations 4,754 9,290 (4,536) (48.8)%Trading and Logistics operations 9,929 42,758 (32,829) (76.8)%All Other (18,721) (10,968) (7,753) (70.7)%
Total $ 83,382 $ 99,000 $ (15,618) (15.8)%
CAPP - Met operations. Adjusted EBITDA increased $33.8 million , or 58.3% , for the three months ended March 31, 2019 compared to the prior year period.The increase in Adjusted EBITDA was primarily driven by increased sales volumes during the current period as a result of the Merger, partially offset by increasedcosts associated with purchased coal during the period.
CAPP - Thermal operations. Adjusted EBITDA for the CAAP - Thermal operations was ($4.3) million for the three months ended March 31, 2019 . The prioryear period did not have any activity in this segment and therefore the current year results explain the entire amount of change. The primary driver for adjustedEBITDA related to ventilation factors negatively impacting production during the current period.
NAPP operations. Adjusted EBITDA decreased $4.5 million , or 48.8% , for the three months ended March 31, 2019 compared to the prior year period. Thedecrease in Adjusted EBITDA was primarily due to decreased met coal sales in the current year period and decreased coal margin per ton of $3.01 . The decreasein coal margin per ton consisted of increased average cost of coal sales per ton of $2.44 , or approximately 6.4% , and decreased average sales realization per ton of$0.57 , or approximately 1.3% .
Trading and Logistics operations. Adjusted EBITDA decreased $32.8 million , or 76.8% , for the three months ended March 31, 2019 compared to the prioryear period. The decrease in Adjusted EBITDA was primarily due to decreased sales of coal purchased from the Alpha Companies during the current period as aresult of the Merger and decreased coal margin per ton of $5.61 , or approximately 19.3% .
All Other category. Adjusted EBITDA decreased $7.8 million , or 70.7% , for the three months ended March 31, 2019 compared to the prior year period. Thedecrease in Adjusted EBITDA was primarily driven by increases in costs associated with idled properties acquired in the Merger and loss on sale of assets duringthe current period.
Liquidity and Capital Resources
Our primary liquidity and capital resource requirements stem from the cost of our coal production and purchases, our capital expenditures, our debt service,our reclamation obligations, our regulatory costs and settlements and associated costs. Our primary sources of liquidity are derived from sales of coal, our debtfinancing and miscellaneous revenues.
We believe that cash on hand and cash generated from our operations will be sufficient to meet our working capital requirements, anticipated capitalexpenditures, debt service requirements, acquisition-related obligations, and reclamation obligations for the next 12 months. We have relied on a number ofassumptions in budgeting for our future activities. These include the costs for mine development to sustain capacity of our operating mines, our cash flows fromoperations, effects of regulation and taxes by governmental agencies, mining technology improvements and reclamation costs. These assumptions are inherentlysubject to significant business, political, economic, regulatory, environmental and competitive uncertainties, contingencies and risks, all of which are difficult topredict and many of which are beyond our control. We may need to raise additional funds more quickly if market conditions deteriorate, and we may not be able todo so in a timely fashion, or at all; or one or more of our assumptions proves to be incorrect or if we choose to expand our acquisition, exploration, appraisal, ordevelopment efforts or any other activity more rapidly than we presently anticipate. We may decide to raise additional funds before we need them if the conditionsfor raising capital are favorable. We may seek to sell equity or debt securities or obtain additional bank credit facilities. The sale of equity securities could result indilution to our stockholders. The incurrence of additional indebtedness could result in increased fixed obligations and additional covenants that could restrict ouroperations.
At March 31, 2019 , we had total liquidity of $378.3 million, including cash and cash equivalents of $182.0 million and $196.3 million of unusedcommitments available under the Amended and Restated Asset-Based Revolving Credit Agreement,
55
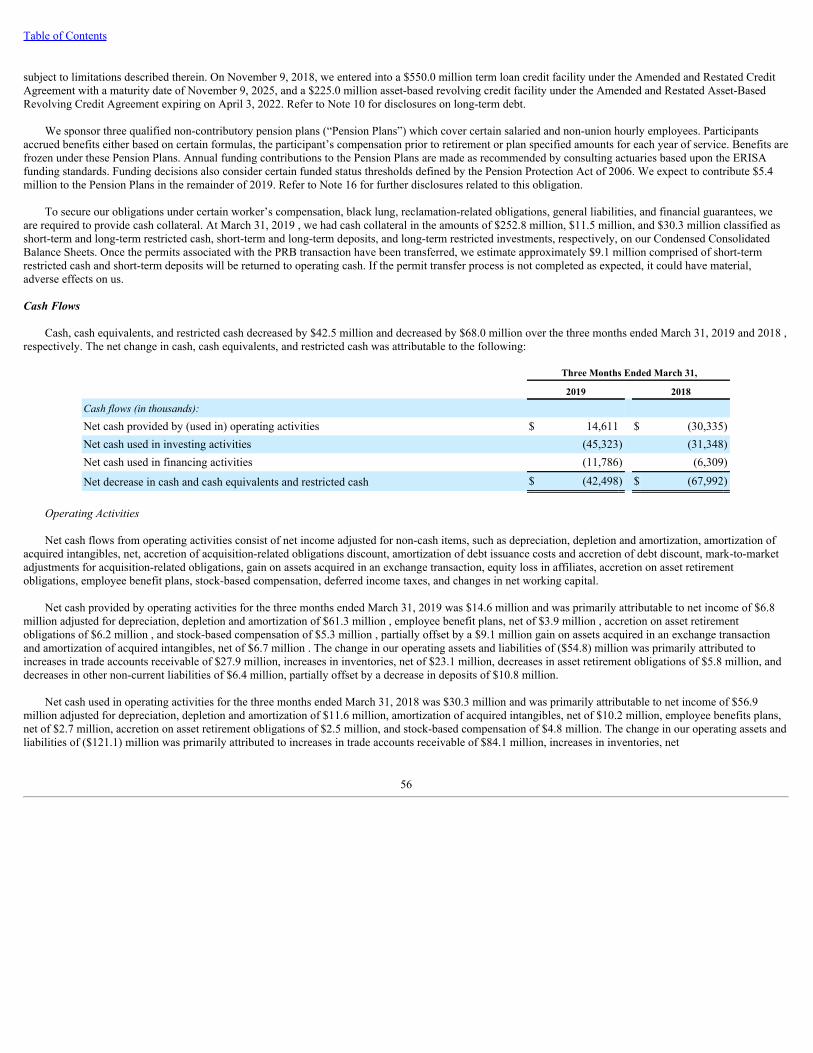
Table of Contents
subject to limitations described therein. On November 9, 2018, we entered into a $550.0 million term loan credit facility under the Amended and Restated CreditAgreement with a maturity date of November 9, 2025, and a $225.0 million asset-based revolving credit facility under the Amended and Restated Asset-BasedRevolving Credit Agreement expiring on April 3, 2022. Refer to Note 10 for disclosures on long-term debt.
We sponsor three qualified non-contributory pension plans (“Pension Plans”) which cover certain salaried and non-union hourly employees. Participantsaccrued benefits either based on certain formulas, the participant’s compensation prior to retirement or plan specified amounts for each year of service. Benefits arefrozen under these Pension Plans. Annual funding contributions to the Pension Plans are made as recommended by consulting actuaries based upon the ERISAfunding standards. Funding decisions also consider certain funded status thresholds defined by the Pension Protection Act of 2006. We expect to contribute $5.4million to the Pension Plans in the remainder of 2019. Refer to Note 16 for further disclosures related to this obligation.
To secure our obligations under certain worker’s compensation, black lung, reclamation-related obligations, general liabilities, and financial guarantees, weare required to provide cash collateral. At March 31, 2019 , we had cash collateral in the amounts of $252.8 million, $11.5 million, and $30.3 million classified asshort-term and long-term restricted cash, short-term and long-term deposits, and long-term restricted investments, respectively, on our Condensed ConsolidatedBalance Sheets. Once the permits associated with the PRB transaction have been transferred, we estimate approximately $9.1 million comprised of short-termrestricted cash and short-term deposits will be returned to operating cash. If the permit transfer process is not completed as expected, it could have material,adverse effects on us.
Cash Flows
Cash, cash equivalents, and restricted cash decreased by $42.5 million and decreased by $68.0 million over the three months ended March 31, 2019 and 2018 ,respectively. The net change in cash, cash equivalents, and restricted cash was attributable to the following:
Three Months Ended March 31,
2019 2018
Cash flows (in thousands): Net cash provided by (used in) operating activities $ 14,611 $ (30,335)Net cash used in investing activities (45,323) (31,348)Net cash used in financing activities (11,786) (6,309)
Net decrease in cash and cash equivalents and restricted cash $ (42,498) $ (67,992)
Operating Activities
Net cash flows from operating activities consist of net income adjusted for non-cash items, such as depreciation, depletion and amortization, amortization ofacquired intangibles, net, accretion of acquisition-related obligations discount, amortization of debt issuance costs and accretion of debt discount, mark-to-marketadjustments for acquisition-related obligations, gain on assets acquired in an exchange transaction, equity loss in affiliates, accretion on asset retirementobligations, employee benefit plans, stock-based compensation, deferred income taxes, and changes in net working capital.
Net cash provided by operating activities for the three months ended March 31, 2019 was $14.6 million and was primarily attributable to net income of $6.8million adjusted for depreciation, depletion and amortization of $61.3 million , employee benefit plans, net of $3.9 million , accretion on asset retirementobligations of $6.2 million , and stock-based compensation of $5.3 million , partially offset by a $9.1 million gain on assets acquired in an exchange transactionand amortization of acquired intangibles, net of $6.7 million . The change in our operating assets and liabilities of ($54.8) million was primarily attributed toincreases in trade accounts receivable of $27.9 million, increases in inventories, net of $23.1 million, decreases in asset retirement obligations of $5.8 million, anddecreases in other non-current liabilities of $6.4 million, partially offset by a decrease in deposits of $10.8 million.
Net cash used in operating activities for the three months ended March 31, 2018 was $30.3 million and was primarily attributable to net income of $56.9million adjusted for depreciation, depletion and amortization of $11.6 million, amortization of acquired intangibles, net of $10.2 million, employee benefits plans,net of $2.7 million, accretion on asset retirement obligations of $2.5 million, and stock-based compensation of $4.8 million. The change in our operating assets andliabilities of ($121.1) million was primarily attributed to increases in trade accounts receivable of $84.1 million, increases in inventories, net
56

Table of Contents
of $27.1 million, decreases in acquisition-related obligations of $3.5 million, and decreases in other non-current liabilities of $3.1 million.
Investing Activities
Net cash used in investing activities for the three months ended March 31, 2019 was $45.3 million , primarily driven by capital expenditures of $41.1 million ,purchases of investment securities - held to maturity of $4.3 million , and capital contributions to equity affiliates of $3.5 million , partially offset by maturity ofinvestment securities - held to maturity of $3.2 million .
Net cash used in investing activities for the three months ended March 31, 2018 was $31.3 million, primarily driven by capital expenditures of $19.4 millionand payments on disposal of assets of $10.0 million.
Financing Activities
Net cash used in financing activities for the three months ended March 31, 2019 was $11.8 million , primarily attributable to principal repayments of debt of$6.9 million and common stock repurchases and related expenses of $4.2 million .
Net cash used in financing activities for the three months ended March 31, 2018 was $6.3 million, primarily attributable to principal repayments of debt of$1.0 million and common stock repurchases and related expenses of $4.8 million.
Long-Term Debt
On May 15, 2019, we executed a commitment letter with certain of our existing shareholders who have committed to provide a new 5-year First Lien Facility(the “Facility”) with an aggregate principal amount of $555 million to refinance our existing Term Loan Credit Facility. The existing Term Loan Credit Facilityhas $17.1 million of unamortized discount and $10.3 million of unamortized debt issuance costs as of March 31, 2019 that will be analyzed to determine if some orall of these amounts should be written off as part of the refinancing. The new Facility is expected to have an original issue discount of 3.00% of the aggregateprincipal amount, a commitment fee of 2.00% of the aggregate principal amount and other customary fees. The interest rate on the new Facility is expected to beLIBOR plus 700 basis points for the first two years after closing, increased to LIBOR plus 800 basis points thereafter, with a LIBOR floor of 2.00%. The closing ofthe Facility is subject to customary closing conditions.
Refer to Note 10 for additional disclosures on long-term debt.
Analysis of Material Debt Covenants
We were in compliance with all covenants under the Amended and Restated Credit Agreement and the Amended and Restated Asset-Based Revolving CreditAgreement, as of March 31, 2019 . A breach of the covenants in the Amended and Restated Credit Agreement and the Amended and Restated Asset-BasedRevolving Credit Agreement could result in a default under the terms of the agreement and the respective lenders could elect to declare all amounts borrowed dueand payable.
Pursuant to the Amended and Restated Asset-Based Revolving Credit Agreement, during any Liquidity Period (capitalized terms as defined in the Amendedand Restated Asset-Based Revolving Credit Agreement), our Fixed Charge Coverage Ratio cannot be less than 1.00 to 1.00 as of the last day of any Test Period,commencing with the Test Period ended immediately preceding the commencement of such Liquidity Period. The Fixed Charge Coverage Ratio is calculated as (a)Consolidated EBITDA of the Company and its Restricted Subsidiaries for such period, minus non-financed Capital Expenditures (including Capital Expendituresfinanced with the proceeds of any Loans) paid or payable currently in cash by the Company or any of its Subsidiaries for such period to (b) the Fixed Charges ofthe Company and its Restricted Subsidiaries during such period. As of March 31, 2019 , we were not in a Liquidity Period.
In the event that there shall be Excess Cash Flow for any fiscal quarter commencing with the fiscal quarter ended March 31, 2019 , pursuant to the Amendedand Restated Credit Agreement, we will, no later than 70 days after the end of such fiscal quarter (or 130 days in the case of the last fiscal quarter of any fiscalyear), prepay the loan amounts under the Amended and Restated Credit Agreement, based on the Total Leverage Ratio as follows:
57

Table of Contents
Total Leverage Ratio (1) Prepayment Amount (2)
Equal to or greater than 2.25 75% of Excess Cash FlowLess than 2.25 and greater than or equal to 1.00 50% of Excess Cash FlowLess than 1.00 25% of Excess Cash Flow
(1) Total Leverage Ratio is calculated as the ratio of (i) Consolidated Net Total Debt on such date to (ii) Consolidated EBITDA (capitalized terms as defined in theAmended and Restated Credit Agreement) for the period of the four consecutive fiscal quarters ending as of the date of the financial statements most recentlydelivered.
(2) % of Excess Cash Flow is reduced by voluntary repayments of the Amended and Restated Credit Agreement, as defined within the Amended and RestatedCredit Agreement.
Excess Cash Flow is calculated in accordance with our Amended and Restated Credit Agreement, and is equal to (i) the sum, without duplication, ofConsolidated Net Income, the aggregate amount of all non-cash charges, the amount of the decrease, if any, in Consolidated Working Capital and the amount ofnon-cash losses on the disposition of property to the extent deducted in arriving at Consolidated Net Income minus (ii) the sum, without duplication, of the amountof all non-cash credits included in arriving at Consolidated Net Income, certain capital expenditures, certain amounts of regularly scheduled principal payments ofIndebtedness made in cash, the amount of the increase, if any, in Consolidated Working Capital and the aggregate amount of non-cash gains on the disposition ofproperty to the extent included in arriving at Consolidated Net Income.
Consolidated Net Income is calculated in accordance with our Amended and Restated Credit Agreement and is equal to the net income determined inaccordance with GAAP, excluding, without duplication, noncash compensation expenses related to common stock and other equity securities issued to employees,extraordinary and non-recurring gains and loss, income or losses from discontinued operations or disposal of discontinued operations or costs and expenseassociated with the closure of any minds (including any reclamation or disposal obligations), any non-cash impairment charges or asset write-offs resulting fromthe application of certain ASC standards, net unrealized gains or losses resulting from non-cash foreign currency remeasurement gains or losses, net unrealizedgains or losses results in such period from certain derivatives, non-cash charges including non-cash charges due to cumulative effects of changes in accountingprinciples, any net income or loss of any person that is not a restricted subsidiary or that is accounted for by equity method accounting except to the extent thedividends or similar distributions are paid in cash to the specified person or restricted subsidiary, the net income (but not loss) of any restricted subsidiary to theextent that the declaration or payment of dividends or similar distributions by that restricted subsidiary of that net income is not at the date of determinationpermitted without any prior governmental approval (that has not been obtained) or, directly or indirectly, by operation of the terms of its charter or any agreement,instrument, judgment, decree, order, statute, rule or governmental regulation applicable to that restricted subsidiary or its stockholders (other than any restrictionthat has been waived or released), plus, without duplication, any cash dividends and/or distributions actually received by the Company or restricted subsidiary fromany unrestricted subsidiary and/or joint venture to the extent not already included therein.
Additionally, under the Amended and Restated Credit Agreement, our ability to engage in activities such as incurring additional indebtedness, makinginvestments and paying dividends is also tied to certain financial ratios, including Consolidated EBITDA as defined per the Amended and Restated CreditAgreement. Consolidated EBITDA is defined as EBITDA further adjusted to exclude certain non-cash items, non-recurring items, and other adjustments permittedin calculating covenant compliance under the Amended and Restated Credit Agreement. EBITDA, a measure used by management to evaluate our ongoingoperations for internal planning and forecasting purposes, is defined as net income (loss) from operations plus interest expense, income tax expense, amortizationof acquired intangibles, net and depreciation, depletion and amortization, less interest income and income tax benefit. EBITDA is not a financial measurerecognized under United States generally accepted accounting principles and does not purport to be an alternative to net income as a measure of operatingperformance or to cash flows from operating activities as a measure of liquidity. The amounts shown for EBITDA as presented may differ from amounts calculatedand may not be comparable to other similarly titled measures used by other companies.
Consolidated EBITDA is calculated in accordance with our Amended and Restated Credit Agreement, and is equal to Consolidated Net Income plus, withoutduplication (i) consolidated interest expense; (ii) to the extent deducted in computing such Consolidated Net Income, the sum of all income, franchise or similartaxes; (iii) depreciation, depletion, amortization (including, without limitation, amortization of intangibles, deferred financing fees and any amortization included inpension or other employee benefit expenses) and all other non-cash items reducing Consolidated Net Income (including, without limitation, write-downs andimpairment of property, plant, equipment and intangibles and other long-lived assets and the impact of acquisition accounting, but excluding, in each case, non-cash charges in a period which reflect cash expenses paid or to be paid in another period); (iv) non-recurring restructuring costs, expenses and charges, including,without limitation, all business optimization costs and expenses, facility opening, pre-opening and closing and consolidation costs and expenses, advisory andprofessional fees and stay and retention bonuses; provided that the amount of non-recurring restructuring costs, expenses and
58

Table of Contents
charges permitted to be added back pursuant to this clause (iv) for a four-quarter period shall not exceed 20% of Consolidated EBITDA for such period (calculatedbefore giving effect to such add-back); (v) any expenses, costs or charges related to any equity offering, Investment permitted, acquisition, disposition,recapitalization or Indebtedness permitted to be incurred by the indenture (whether or not successful); (vi) all non-recurring or unusual losses, charges andexpenses (and less all non-recurring or unusual gains); (vii) all non-cash charges and expenses; (viii) any debt extinguishment costs; (ix) any amount of assetretirement obligations expenses; (x) all Transaction Costs incurred in connection with the Transactions contemplated hereby; (xi) transaction costs, fees andexpenses incurred during such period in connection with any acquisition or disposition not prohibited hereunder or any issuance of debt or equity securities by thesurviving Parent, the Borrowers or any of its Restricted Subsidiaries, in each case, for such expenses; and (xii) commissions, premiums, discounts, fees or othercharges relating to performance bonds, bid bonds, appeal bonds, surety bonds, wage bonds, bonds issued in favor of any Governmental Authority, reclamation andcompletion guarantees and other similar obligations; provided that, with respect to any Restricted Subsidiary, such items will be added only to the extent and in thesame proportion that the relevant Restricted Subsidiary’s net income was included in calculating Consolidated Net Income.
The calculation of Consolidated EBITDA is based on our results of operations in accordance with the Amended and Restated Credit Agreement and therefore,is different from Adjusted EBITDA presented elsewhere in this report. The calculation of Consolidated EBITDA for purposes of the Excess Cash Flow calculationis performed at the end of each fiscal quarter (commencing with the fiscal quarter ending March 31, 2019). We are not required to make an Excess Cash FlowPayment for the fiscal quarter ended March 31, 2019.
Acquisition-Related Obligations
Refer to Note 11 for additional details and disclosures on acquisition-related obligations.
Off-Balance Sheet Arrangements
Refer to Note 19 , part (c) for disclosures on off-balance sheet arrangements.
Other
As a regular part of our business, we review opportunities for, and engage in discussions and negotiations concerning, the acquisition or disposition of coalmining and related infrastructure assets and interests in coal mining companies, and acquisitions or dispositions of, or combinations or other strategic transactionsinvolving companies with coal mining or other energy assets. When we believe that these opportunities are consistent with our strategic plans and our acquisitionor disposition criteria, we will make bids or proposals and/or enter into letters of intent and other similar agreements. These bids or proposals, which may bebinding or non-binding, are customarily subject to a variety of conditions and usually permit us to terminate the discussions and any related agreement if, amongother things, we are not satisfied with the results of due diligence. Any acquisition opportunities we pursue could materially affect our liquidity and capitalresources and may require us to incur indebtedness, seek equity capital or both. There can be no assurance that additional financing will be available on termsacceptable to us, or at all.
Contractual Obligations
Our contractual obligations are discussed in “ Management’s Discussion and Analysis of Financial Condition and Results of Operations ” in our AnnualReport on Form 10-K for the year ended December 31, 2018. Our long-term liabilities relating to asset retirement obligations increased during the three monthsended March 31, 2019 as a result of the measurement-period adjustments recorded. Refer to Note 2 for further information. The table below reflects the estimatedundiscounted cash flows for these obligations:
(in thousands)Remainder of
2019 2020 2021 2022 2023 After 2023 Total
Asset retirement obligation $ 21,428 $ 24,680 $ 26,663 $ 30,168 $ 32,056 $ 512,827 $ 647,822
Refer to Note 9 for information about our lease obligations. Refer to Note 19 for disclosures related to our other contractual obligations.
Critical Accounting Policies and Estimates
The preparation of financial statements in accordance with GAAP requires management to make estimates and assumptions that affect reported amounts ofassets, liabilities, revenues and expenses, and related disclosure of contingent assets and liabilities. We base our estimates on historical experience and on variousother factors and assumptions, including the current economic environment that we believe are reasonable under the circumstances, the results of which form thebasis for making judgments about the carrying values of assets and liabilities that are not readily apparent from other sources. We evaluate our estimates andassumptions on an ongoing basis and adjust such estimates and assumptions as facts and circumstances require. Foreign currency and energy markets, andfluctuations in demand for steel products have combined to increase the uncertainty inherent in such estimates and assumptions. As future events and their effectscannot be determined with precision, actual results may differ significantly from these estimates. Changes in these estimates resulting from continuing changes inthe economic environment will be reflected in the financial statements in future periods.
Our critical accounting policies are discussed in “ Management’s Discussion and Analysis of Financial Condition and Results of Operations ” in our AnnualReport on Form 10-K for the year ended December 31, 2018. Our critical accounting policies remain unchanged at March 31, 2019. Refer to Note 1 for disclosuresrelated to new accounting policies adopted.
59

Table of Contents
Item 3. Quantitative and Qualitative Disclosures about Market Risk
Commodity Price Risk
We manage our commodity price risk for coal sales through the use of coal supply agreements. As of May 7, 2019, we expect to ship on sales commitments ofapproximately 7.2 million tons of NAPP coal for 2019, 98% of which is priced, 9.8 million tons of CAPP - Met coal for 2019, 79% of which is priced, and 4.4million tons of CAPP - Thermal coal for 2019, 100% of which is priced.
We have exposure to price risk for supplies that are used directly or indirectly in the normal course of production such as diesel fuel, steel and other items suchas explosives. We manage our risk for these items through strategic sourcing contracts in normal quantities with our suppliers and may use derivative instrumentsin the future from time to time, primarily swap contracts with financial institutions, for a certain percentage of our monthly requirements. Swap agreements wouldessentially fix the price paid for our diesel fuel by requiring us to pay a fixed price and receive a floating price.
We expect to use approximately 18.8 million and 23.7 million gallons of diesel fuel in the remainder of 2019 and 2020, respectively.
Credit Risk
Our credit risk is primarily with electric power generators and steel producers. Our policy is to independently evaluate each customer’s creditworthiness priorto entering into transactions and to monitor outstanding accounts receivable against established credit limits. When appropriate (as determined by our creditmanagement function), we have taken steps to reduce our credit exposure to customers that do not meet our credit standards or whose credit has deteriorated. Thesesteps include obtaining letters of credit or cash collateral, obtaining credit insurance, requiring prepayments for shipments or establishing customer trust accountsheld for our benefit in the event of a failure to pay.
Interest Rate Risk
As of March 31, 2019 , we had exposure to changes in interest rates through the asset-based revolving credit facility under our Amended and Restated Asset-Based Revolving Credit Agreement, which bears interest based on the character of the loan (defined as either “Base Rate Loan” or “Eurocurrency Rate Loan”) plusan applicable rate ranging from 1.00% to 1.50% for Base Rate Loans and 2.00% to 2.50% for Eurocurrency Rate Loans, depending on the amount of creditavailable. As of March 31, 2019 , the Company had no borrowings under the Asset-Based Term Loan Credit Agreement.
As of March 31, 2019 , we also had exposure to changes in interest rates through the term loan under our Amended and Restated Credit Agreement, whichbears an interest rate per annum based on the character of the loan (defined as either “Base Rate Loan” or “Eurocurrency Rate Loan”) plus an applicable rate of4.00% to 5.00% depending on loan type (the “Applicable Rate”), payable bi-monthly in arrears. As of March 31, 2019 , a 50 basis point increase or decrease ininterest rates would increase or decrease our annual interest expense by approximately $2.6 million.
Item 4. Controls and Procedures
Evaluation of Disclosure Controls and Procedures
We maintain disclosure controls and procedures as that term is defined in Rules 13a-15(e) and 15d-15(e) under the Securities Exchange Act of 1934, asamended (the “Exchange Act”) that are designed to ensure that information required to be disclosed by the Company in reports that it files or submits under theExchange Act, is recorded, processed, summarized and reported within the time periods specified in the SEC’s rules and forms, and that such information isaccumulated and communicated to our management, including our Chief Executive Officer (“CEO”) and our Chief Financial Officer (“CFO”), as appropriate, toallow timely decisions regarding required disclosures. Any controls and procedures, no matter how well designed and operated, can provide only reasonableassurance of achieving the desired control objectives. In accordance with Rule 13a-15(b) of the Exchange Act, we have evaluated, under the supervision of ourCEO and our CFO, the effectiveness of disclosure controls and procedures as of March 31, 2019 . Based on this evaluation, our CEO and our CFO concluded thatour disclosure controls and procedures were effective as of March 31, 2019 at a reasonable assurance level.
Changes in Internal Control Over Financial Reporting
60

Table of Contents
There were no changes in our internal control over financial reporting (as defined in Rule 13a-15(f) under the Exchange Act) that occurred during the periodcovered by this Quarterly Report on Form 10-Q that have materially affected, or is reasonably likely to materially affect, our internal control over financialreporting.
Inherent Limitations on Effectiveness of Disclosure Controls and Procedures
Our Chief Executive Officer, our Chief Financial Officer and other members of management do not expect that our disclosure controls and procedures or ourinternal control over financial reporting will prevent all errors and all fraud. A control system, no matter how well designed and operated, can provide onlyreasonable, not absolute, assurance that the objectives of the control system are met. Because of its inherent limitations, internal control over financial reportingmay not prevent or detect misstatements. Also, projections of any evaluation of effectiveness to future periods are subject to the risk that controls may becomeinadequate because of changes in conditions, or that the degree of compliance with the policies or procedures may deteriorate.
Part II - Other Information
Item 1. Legal Proceedings
For a description of the Company’s legal proceedings, refer to Note 19 , part (d), to the unaudited Condensed Consolidated Financial Statements, which isincorporated herein by reference.
Item 1A. Risk Factors
In addition to the other information set forth in this report, you should carefully consider the factors discussed in the “ Risk Factors ” sections in theCompany’s Annual Report on Form 10-K for the year ended December 31, 2018, together with the cautionary statement under the caption “Cautionary NoteRegarding Forward Looking Statements” in this report. These described risks are not the only risks we face. Additional risks and uncertainties not currently knownto us or that we currently deem to be immaterial also may materially adversely affect our business, financial condition and/or operating results.
Item 2. Unregistered Sales of Equity Securities and Use of Proceeds
The following table summarizes information about shares of common stock that were repurchased during the first quarter of 2019.
Total Numberof Shares
Purchased (1) Average PricePaid per Share
Total Number ofShares Purchasedas Part of Publicly
Announced Share RepurchasePrograms
Approximate DollarValue of Sharesthat May Yet BePurchased Underthe Programs
January 1, 2019 through January 31, 2019 9,699 $ 64.03 — $ —February 1, 2019 through February 28, 2019 6,188 $ 61.27 — $ —March 1, 2019 through March 31, 2019 55,149 $ 57.50 — $ —
71,036 — $ —(1) The Company is authorized to repurchase common shares from employees (upon the election by the employee) to satisfy the employees’ statutory taxwithholdings upon the vesting of stock grants. Shares that are repurchased to satisfy the employees’ statutory tax withholdings are recorded in treasury stock atcost.
Refer to Note 14 for information about repurchases related to warrants during the current quarter.
Item 4. Mine Safety Disclosures
Information concerning mine safety violations or other regulatory matters required by Section 1503(a) of the Dodd-Frank Wall Street Reform and ConsumerProtection Act and Item 104 of Regulation S-K is included in Exhibit 95 to this Quarterly Report on Form 10-Q.
Item 6. Exhibits
Refer to the Exhibit Index following the signature page to this Quarterly Report on Form 10-Q.
61

Table of Contents
SIGNATURES
Pursuant to the requirements of Section 13 or 15(d) of the Securities Exchange Act of 1934, the registrant has duly caused this report to be signed on its behalfby the undersigned, thereunto duly authorized.
CONTURA ENERGY, INC.Date: May 15, 2019 By: /s/ Charles Andrew Eidson Name: Charles Andrew Eidson Title: Interim Co-Chief Executive Officer, Executive Vice President and Chief Financial Officer
(Principal Executive Officer, Principal Financial Officer and Principal AccountingOfficer)
62

Table of Contents
Exhibit Index
Exhibit No. Description of Exhibit3.1 Second Amended and Restated Certificate of Incorporation of Contura Energy, Inc. (incorporated by reference to Exhibit 3.1 to the
Registrant’s Registration Statement on Form S-4 filed with the Commission on August 21, 2018)3.2 Second Amended and Restated Bylaws of Contura Energy, Inc. (incorporated by reference to Exhibit 3.2 to the Registrant’s Registration
Statement on Form S-4 filed with the Commission on August 21, 2018)31* Certifications Pursuant to Rule 13a-14(a) under the Securities Exchange Act of 1934, as adopted pursuant to §302 of the Sarbanes-Oxley
Act of 200232* Certifications Pursuant to 18 U.S.C. §1350, As Adopted Pursuant to §906 of the Sarbanes-Oxley Act of 200295* Mine Safety Disclosure Exhibit101.INS* XBRL instance document101.SCH* XBRL taxonomy extension schema101.CAL* XBRL taxonomy extension calculation linkbase101.DEF* XBRL taxonomy extension definition linkbase101.LAB* XBRL taxonomy extension label linkbase101.PRE* XBRL taxonomy extension presentation linkbase
* Filed herewith
63

EXHIBIT 31
CERTIFICATIONS
CERTIFICATION OF PRINCIPAL EXECUTIVE OFFICER AND PRINCIPAL FINANCIAL OFFICER
Each of the officers below certifies that:1. I have reviewed this Quarterly Report on Form 10-Q (this “Report”) of Contura Energy, Inc. (the “Registrant”);2. Based on my knowledge, this Report does not contain any untrue statement of a material fact or omit to state a material fact necessary to make the statements
made, in light of the circumstances under which such statements were made, not misleading with respect to the period covered by this Report;3. Based on my knowledge, the financial statements, and other financial information included in this Report, fairly present in all material respects the financial
condition, results of operations and cash flows of the Registrant as of, and for, the periods presented in this Report;4. The Registrant's other certifying officer and I are responsible for establishing and maintaining disclosure controls and procedures (as defined in Exchange Act
Rules 13a-15(e) and 15d-15(e)) for the Registrant and have:a. Designed such disclosure controls and procedures, or caused such disclosure controls and procedures to be designed under our supervision, to ensure that
material information relating to the Registrant, including its consolidated subsidiaries, is made known to us by others within those entities, particularlyduring the period in which this Report is being prepared;
b. Evaluated the effectiveness of the Registrant's disclosure controls and procedures and presented in this Report our conclusions about the effectiveness ofthe disclosure controls and procedures, as of the end of the period covered by this Report based on such evaluation; and
c. Disclosed in this Report any change in the Registrant's internal control over financial reporting that occurred during the Registrant's most recent fiscalquarter (the Registrant's fourth fiscal quarter in the case of an annual report) that has materially affected, or is reasonably likely to materially affect, theRegistrant's internal control over financial reporting; and
5. The Registrant's other certifying officer and I have disclosed to the Registrant's auditors and the audit committee of the Registrant's board of directors (orpersons performing the equivalent functions):a. All significant deficiencies and material weaknesses in the design or operation of internal control over financial reporting which are reasonably likely to
adversely affect the Registrant's ability to record, process, summarize and report financial information; andb. Any fraud, whether or not material, that involves management or other employees who have a significant role in the Registrant's internal control over
financial reporting.
Date: May 15, 2019 By: /s/ Mark M. MannoMark M. MannoInterim Co-Chief Executive Officer, Executive Vice President, Chief Administrative & Legal Officer and Secretary(Principal Executive Officer)
Date: May 15, 2019 By: /s/ Charles Andrew EidsonCharles Andrew EidsonInterim Co-Chief Executive Officer, Executive Vice President and Chief Financial Officer(Principal Executive Officer, Principal Financial Officer and Principal Accounting Officer)

EXHIBIT 32
CERTIFICATION PURSUANT TO 18 U.S.C. SECTION 1350, AS ADOPTED PURSUANT TO SECTION 906 OF THE SARBANES-OXLEY ACT OF 2002
In connection with the Quarterly Report on Form 10-Q of Contura Energy, Inc. (the “Registrant”) for the period ended March 31, 2019 , as filed with the Securitiesand Exchange Commission on the date hereof (the “Report”), each of the undersigned officers of the Registrant certifies, pursuant to 18 U.S.C. Section 1350, asadopted pursuant to Section 906 of the Sarbanes-Oxley Act of 2002, that to his knowledge:
1) The Report fully complies with the requirements of Section 13(a) or 15(d) of the Securities Exchange Act of 1934; and2) The information contained in the Report fairly presents, in all material respects, the financial condition and results of operations of the Registrant.
Date: May 15, 2019
By: /s/ Mark M. MannoMark M. MannoInterim Co-Chief Executive Officer, Executive Vice President, Chief Administrative & Legal Officer and Secretary(Principal Executive Officer)
Date: May 15, 2019 By: /s/ Charles Andrew EidsonCharles Andrew EidsonInterim Co-Chief Executive Officer, Executive Vice President and Chief Financial Officer(Principal Executive Officer, Principal Financial Officer and Principal Accounting Officer)

Exhibit 95
Mine Safety and Health Administration Data
Our subsidiaries’ mining operations have consistently been recognized with numerous local, state and national awards over the years for outstanding safetyperformance.
Our behavior-based safety process involves all employees in accident prevention and continuous improvement. Safety leadership and training programs arebased upon the concepts of situational awareness and observation, changing behaviors and, most importantly, employee involvement. The core elements of oursafety training include identification of critical behaviors, frequency of those behaviors, employee feedback and removal of barriers for continuous improvement.
All employees are empowered to champion the safety process. Every person is challenged to identify hazards and initiate corrective actions, ensuring thathazards are addressed in a timely manner.
All levels of the organization are expected to be proactive and commit to perpetual improvement, implementing new safety processes that promote a safe andhealthy work environment.
Our subsidiaries operate multiple mining complexes in three states and are regulated by both the U.S. Mine Safety and Health Administration (“MSHA”) andstate regulatory agencies. As described in more detail in the “Environmental and Other Regulatory Matters” section of our Annual Report on Form 10-K for theyear ended December 31, 2018, the Federal Mine Safety and Health Act of 1977, as amended (the “Mine Act”), among other federal and state laws andregulations, imposes stringent safety and health standards on all aspects of mining operations. Regulatory inspections are mandated by these agencies withthousands of inspection shifts at our properties each year. Citations and compliance metrics at each of our mines and coal preparation facilities vary due to the sizeand type of the operation. We endeavor to conduct our mining and other operations in compliance with all applicable federal, state and local laws and regulations.However, violations occur from time to time. None of the violations identified or the monetary penalties assessed upon us set forth in the tables below has beenmaterial.

For purposes of reporting regulatory matters under Section 1503(a) of the Dodd-Frank Wall Street Reform and Consumer Protection Act (the “Dodd-FrankAct”), we include the following table that sets forth the total number of specific citations and orders and the total dollar value of the proposed civil penaltyassessments that were issued by MSHA during the current reporting period for each of our subsidiaries that is a coal mine operator, by individual mine. During thecurrent reporting period, none of the mines operated by our subsidiaries received written notice from MSHA of a pattern of violations under Section 104(e) of theMine Act.
MSHA Mine ID Operator
Significant andSubstantial
Citations Issued(Section 104 ofthe Mine Act)
*Excludes 104(d)citations/ orders
Failure to AbateOrders (Section104(b) of theMine Act)
UnwarrantableFailureCitations/
Orders Issued(Section 104(d)of the Mine Act)
FlagrantViolations(Section
110(b)(2) of theMine Act)
ImminentDanger OrdersIssued (Section107(a) of theMine Act)
Dollar Value ofProposed Civil
PenaltyAssessments (inThousands) (1)
Mining RelatedFatalities
3605018 CumberlandContura, LLC 13 — — — — $32.51 —
4405270 ParamontContura, LLC — — — — — $0.48 —
4405311
Dickenson-Russell Contura,LLC 1 — — — — $1.09 —
4407163 ParamontContura, LLC — — — — — $0.27 —
4407223 ParamontContura, LLC 5 — — — — $13.41 —
4407308 ParamontContura, LLC 2 — — — — $3.78 —
4407381 ParamontContura, LLC 2 — — — — $— —
4601544 Spartan MiningCompany, LLC 13 — 2 — — $93.25 —
4603317 Mammoth CoalCo. — — — — — $0.52 —
4604343 Kingston MiningInc. 4 — — — — $— —
4605086 Bandmill Coal,LLC — — — — — $1.07 —
4605317 Goals CoalCompany — — — — — $0.12 —
4605649 Delbarton MiningCompany, LLC 3 — — — — $1.55 —
4605992
Black CastleMining CompanyLLC 1 — — — — $— —
4606263 Brooks Run SouthMining, LLC 5 — — — — $7.14 —
4606558 Highland MiningCompany — — — — — $0.12 —
4607938
Black CastleMining Company,LLC — — — — — $0.24 —
4608159 Mammoth CoalCo. — — — — — $0.86 —
4608315 Marfork CoalCompany, LLC 5 — — — — $25.44 —
4608374 Marfork CoalCompany, LLC 1 — — — — $0.74 —
4608625 Kingston Mining,Inc. 11 — — — — $88.66 —

4608655 Marfork CoalCompany, Inc. — — — — — $0.12 —
4608787 Nicholas ConturaLLC 3 — — — — $2.36 —
4608801 Aracoma CoalCompany, LLC 5 — — — — $9.98 —
4608802 Aracoma CoalCompany, LLC — — — — — $0.72 —
4608808 Spartan MiningCompany, LLC 5 — — — — $15.39 —
4608837 Marfork CoalCompany, LLC 3 — — — — $1.18 —
4608932 Kingston Mining,Inc. 4 — — — — $33.42 —
4609026 Republic EnergyLLC 1 — — — — $0.68 —
4609048 Marfork CoalCompany, LLC 21 — 1 — — $52.07 —
4609054 Republic EnergyLLC 1 — — — — $1.41 —
4609091 Marfork CoalCompany, LLC 14 — — — — $180.99 —
4609092 Marfork CoalCompany, LLC 10 — — — — $76.00 —
4609148 Mammoth CoalCo — — — — — $1.34 —
4609204 Highland MiningCompany 4 — — — — $9.97 —
4609212 Marfork CoalCompany 3 — — — — $58.12 —
4609221 Mammoth CoalCo. 6 — — — — $23.03 —
4609361 Aracoma CoalCompany, LLC 6 — — — — $1.48 —
4609475 Republic EnergyLLC — — — — — $3.97 —
4609522 Spartan MiningCompany, LLC — — — — — $0.12 —
4609550 Marfork CoalCompany, LLC 3 — — — — $— —

For purposes of reporting regulatory matters under Section 1503(a) of the Dodd-Frank Act, we include the following table that sets forth a list of legal actionspending before the Federal Mine Safety and Health Review Commission, including the Administrative Law Judges thereof, pursuant to the Mine Act, and otherrequired information, for each of our subsidiaries that is a coal mine operator, by individual mine including legal actions and other required information.
Mine ID OperatorName
MSHAPendingLegal
Actions (asof lastday of
reportingperiod) (1)
New MSHADockets
commencedduring
reportingperiod
MSHAdockets inwhichfinalorderswere
entered (not
appealed)during
reportingperiod
Contests ofCitations/Orders
referencedin
Subpart B,29 CFRPart 2700
Contests ofProposedPenaltiesreferenced
inSubpart C,29 CFRPart 2700
Complaintsfor
compensationreferenced
inSubpart D,29 CFRPart 2700
Complaintsfor
discharge,discrimination,
orinterferencereferenced
in Subpart E,29 CFRPart 2700
Applicationsfor
temporaryrelief
referencedin
Subpart F29 CFRPart 2700
Appeals ofjudges’decisions
ororders toFMSHRCreferenced
inSubpart H29 CFRPart 2700
3605018 CumberlandContura, LLC 1 1 — — 1 — — — —
4405311
Dickenson-RussellContura, LLC — — 1 — — — — — —
4407223 ParamontContura, LLC — — 2 — — — — — —
4605317 Goals CoalCompany 1 — — — 1 — — — —
4608315 Marfork CoalCompany, LLC — — 1 — — — — — —
4608625 KingstonMining, Inc. 2 4 5 — 2 — — — —
4608808 Spartan MiningCompany, LLC — — 1 — — — — — —
4608837 Marfork CoalCompany, LLC — — 2 — — — — — —
4608932 KingstonMining, Inc. 2 3 2 — 2 — — — —
4609026 RepublicEnergy LLC — — 1 — — — — — —
4609048 Marfork CoalCompany, LLC 3 3 2 — 3 — — — —
4609054 RepublicEnergy LLC 1 — — — 1 — — — —
4609204
HighlandMiningCompany 3 2 — — 3 — — — —
4609212 Marfork CoalCompany, LLC 2 2 1 — 2 — — — —
4609091 Marfork CoalCompany, LLC 2 2 2 — 2 — — — —
4609092 Marfork CoalCompany, LLC 4 3 2 — 4 — — — —
4606263
Brooks RunSouth Mining,LLC 1 1 3 — 1 — — — —

4601544 Spartan MiningCompany, LLC 7 1 1 1 6 — — — —
(1) The MSHA proposed assessments issued during the current reporting period do not necessarily relate to the citations or orders issued by MSHA during the current reporting period or to thepending Legal Actions reported herein.