Commodity Profile for Rice-March, 2019agricoop.nic.in/sites/default/files/Rice profile_March... ·...
9
1 | Commodity Profile for Rice-March, 2019. (As on 04-04-2019) Commodity Profile for Rice-March, 2019 Contents 1. Rice Estimates for India (Crop Year: October 2018- September 2019) ............................................ 2 2. Rice Estimates for World ................................................................................................................... 2 3. India’s Rice Production and Area under Cultivation ......................................................................... 3 4. Global Production .............................................................................................................................. 3 5. Major Exporting and Importing Countries of Rice in the world ........................................................ 4 6. India’s Major Export Destinations for Basmati as well as Non-basmati Rice ................................... 5 7. India’s Trade Flow for Rice during 2010-11 to 2017-18 .................................................................. 5 8. Domestic and International Price Movement for Long White Rice 25% Broken ............................. 6 9. Minimum Support Price (MSP) for Rice during 2014-15 to 2018-19 ............................................... 7 10.1 Rice arrivals in Major Domestic Mandis ......................................................................................... 7 10.2 Price Movement for Rice in Major Domestic Mandis ....................................................................... 8 11. Future Prices for Rice .......................................................................................................................... 8 12.Trade Policy .......................................................................................................................................... 9 12.1 Export Policy ..................................................................................................................................... 9 12.2 Import Policy ..................................................................................................................................... 9 13. Significant Changes for the Month…………………………………………………………………………………………………..9
Transcript of Commodity Profile for Rice-March, 2019agricoop.nic.in/sites/default/files/Rice profile_March... ·...
1 | C o m m o d i t y P r o f i l e f o r R i c e - M a r c h , 2 0 1 9 .
(As on 04-04-2019)
Commodity Profile for Rice-March, 2019
Contents
1. Rice Estimates for India (Crop Year: October 2018- September 2019) ............................................ 2
2. Rice Estimates for World ................................................................................................................... 2
3. India’s Rice Production and Area under Cultivation ......................................................................... 3
4. Global Production .............................................................................................................................. 3
5. Major Exporting and Importing Countries of Rice in the world ........................................................ 4
6. India’s Major Export Destinations for Basmati as well as Non-basmati Rice ................................... 5
7. India’s Trade Flow for Rice during 2010-11 to 2017-18 .................................................................. 5
8. Domestic and International Price Movement for Long White Rice 25% Broken ............................. 6
9. Minimum Support Price (MSP) for Rice during 2014-15 to 2018-19 ............................................... 7
10.1 Rice arrivals in Major Domestic Mandis ......................................................................................... 7
10.2 Price Movement for Rice in Major Domestic Mandis ....................................................................... 8
11. Future Prices for Rice .......................................................................................................................... 8
12.Trade Policy .......................................................................................................................................... 9
12.1 Export Policy ..................................................................................................................................... 9
12.2 Import Policy ..................................................................................................................................... 9
13. Significant Changes for the Month…………………………………………………………………………………………………..9

2 | C o m m o d i t y P r o f i l e f o r R i c e - M a r c h , 2 0 1 9 .
1. Rice Estimates for India(Crop Year: October 2018- September 2019)
(Unit: Million Tonnes)
2017-18 Particular March, 2019 Source
16.31 Opening Stock ( beginning of the crop year) 22.79 FCI
111.52** Production 115.60** D&ES
0 Total Imports 0.00* DoC
127.83 Availability 138.39
11.08# Total Export 10.57* DoC
14.45# Ending Stock in Central Pool 26.39*** FCI
100.93 Total Available for domestic consumption 101.43
Source: Department of Food & Public Distribution (DoF&PD), Department of Commerce (DoC), Directorate of
Economics & Statistics (D&ES), Department of Agriculture & Cooperation (DAC).
o *: The figure of export and import is for April 2018- Feb2019.
o **:Production as per 2nd advance estimate for 2018-19 released on 28.02.2019 by DES.
o ***: FCI stocks ending in March, 2019 are 26.39millionTons against 23.27million Tons in corresponding period
last year.
o Availability: opening stock in central pool plus production plus Imports; Total Availability for Domestic
Consumption: Availability minus (total export plus ending stock in central pool).
o # Last 3 years Average.
2. Rice Estimates for World
(Unit: Million Tonnes)
Source: International Grains Council (IGC)
The outlook for global 2018/19 rice output is raised by 5 million tons m/m, to a record 500 million
tons, a 1% y/y rise. Although uptake is lifted, most of the net increase in supplies is channeled to
stocks, pegged 4 million tons higher m/m, at 157 million tons, a 4% y/y gain. World trade in 2019 is
predicted little-changed, at 47 million tons.
Table-2: Production, Trade, Consumption and Stock of Rice
Particulars 2016-17
2017-18
(Estimate)
(2018-19)
Forecast
28.03.2019
Production 487 490 500 Trade 48 48 47 Consumption 486 487 493 Carry Over Stock 123 126 157
3 | C o m m o d i t y P r o f i l e f o r R i c e - M a r c h , 2 0 1 9 .
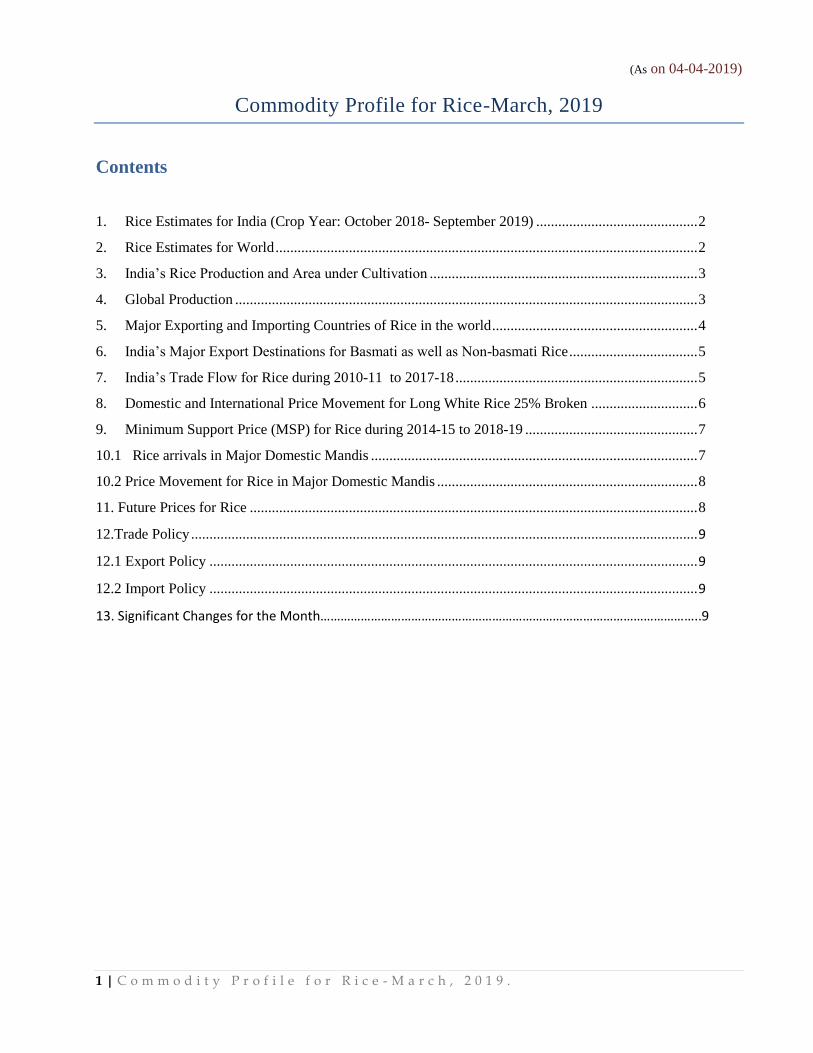
3. India’s Rice Production and Area under Cultivation
Source: Directorate of Economics & Statistics (DES)
*2ndadvance estimates
India’s rice production has increased at CAGR of 1.43 percent during 2002-03 and 2018-19
Area under rice cultivation has not increased substantially during same period.
4. Global Production
S
ource: United State Department of Agriculture
China was the leading rice producer followed by India, Indonesia and Bangladesh in 2018-19.
4 | C o m m o d i t y P r o f i l e f o r R i c e - M a r c h , 2 0 1 9 .
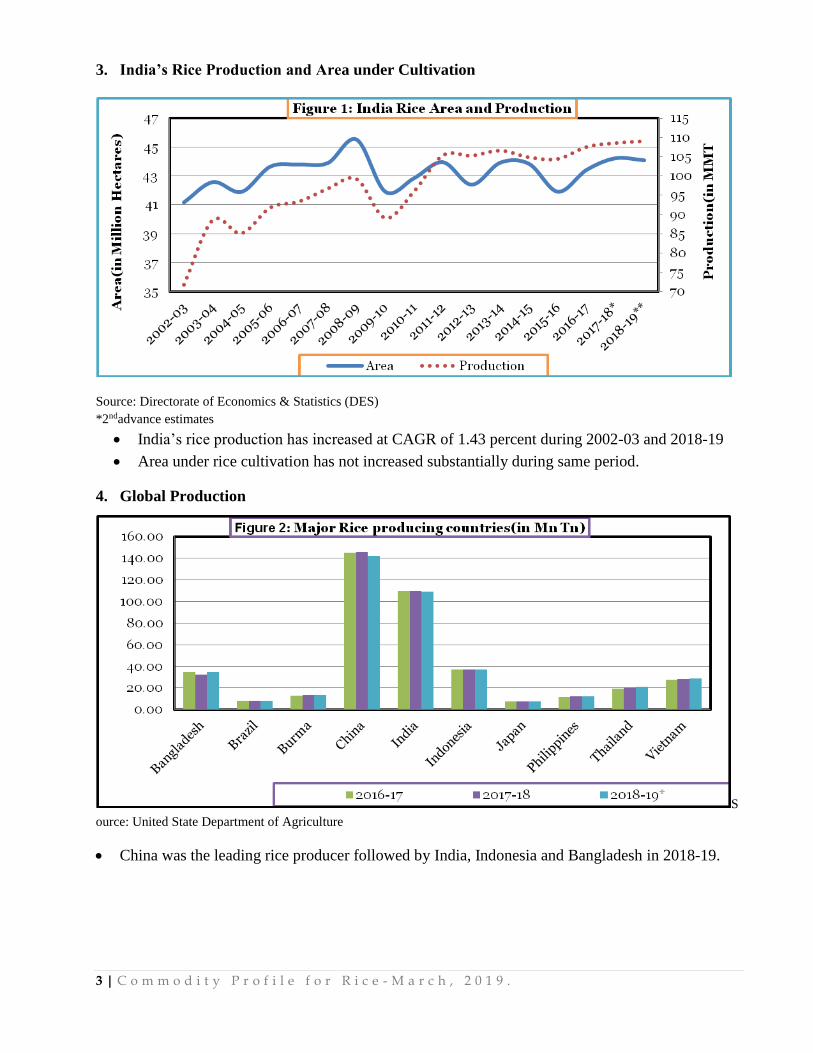
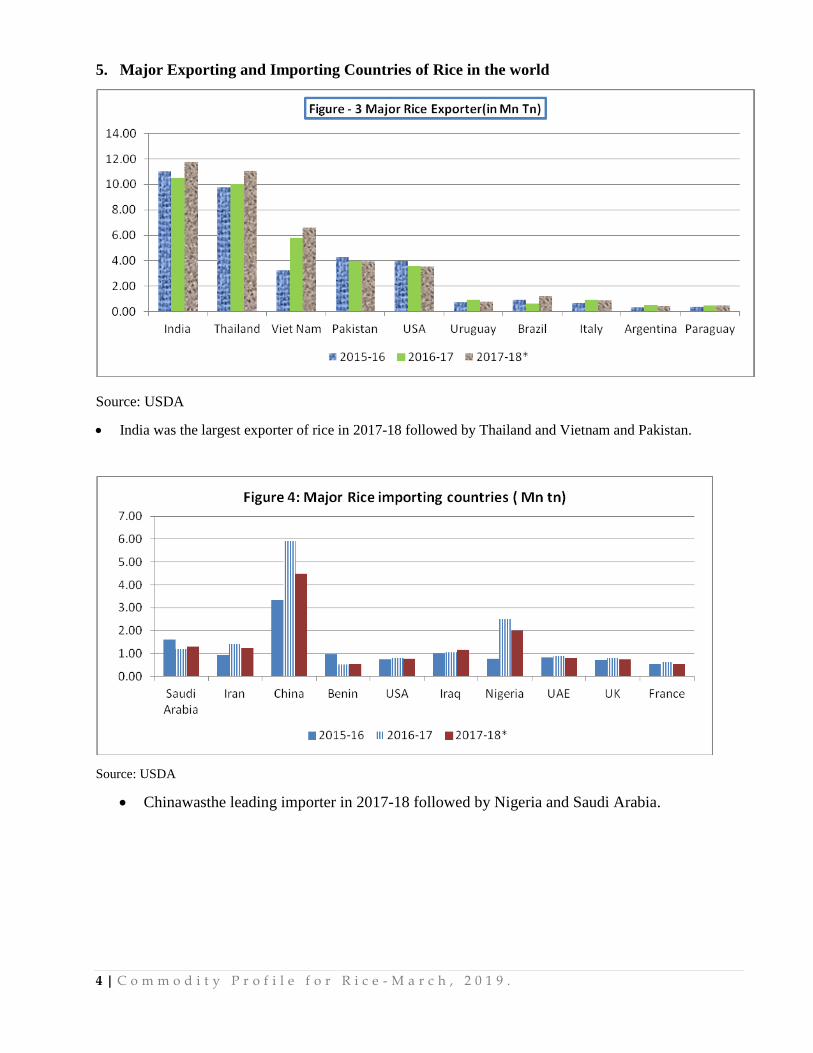
5. Major Exporting and Importing Countries of Rice in the world
Source: USDA
India was the largest exporter of rice in 2017-18 followed by Thailand and Vietnam and Pakistan.
Source: USDA
Chinawasthe leading importer in 2017-18 followed by Nigeria and Saudi Arabia.
5 | C o m m o d i t y P r o f i l e f o r R i c e - M a r c h , 2 0 1 9 .
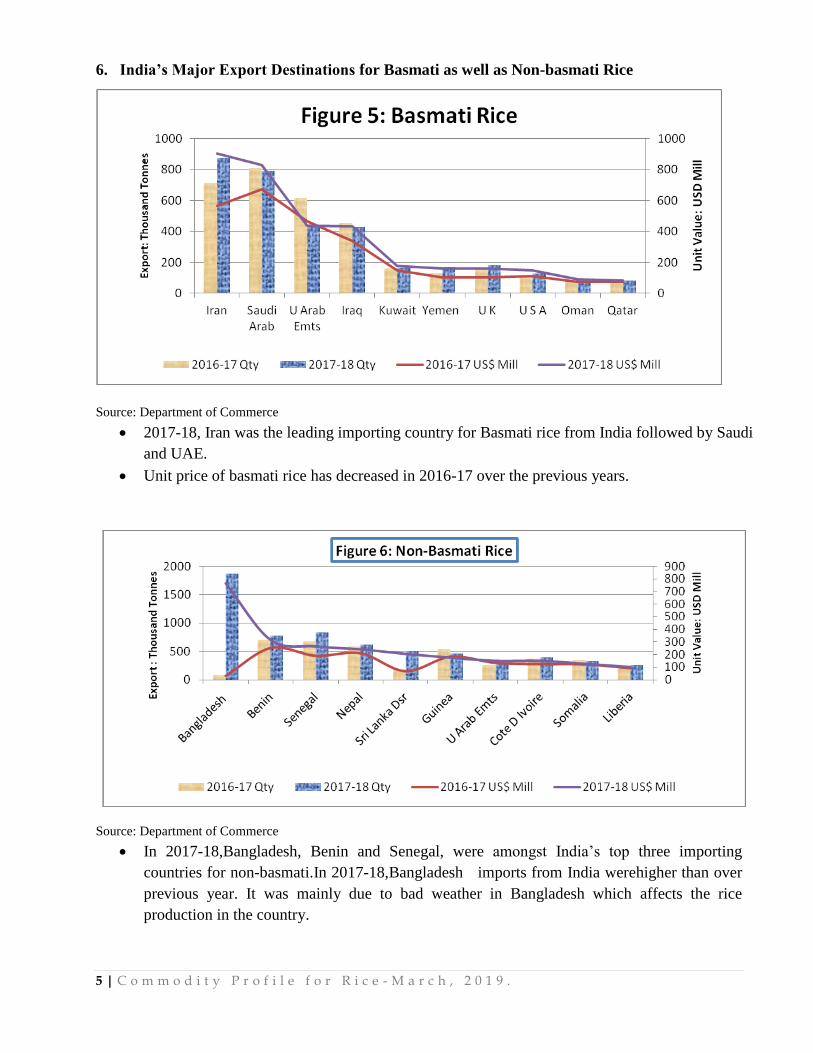
6. India’s Major Export Destinations for Basmati as well as Non-basmati Rice
Source: Department of Commerce
2017-18, Iran was the leading importing country for Basmati rice from India followed by Saudi
and UAE.
Unit price of basmati rice has decreased in 2016-17 over the previous years.
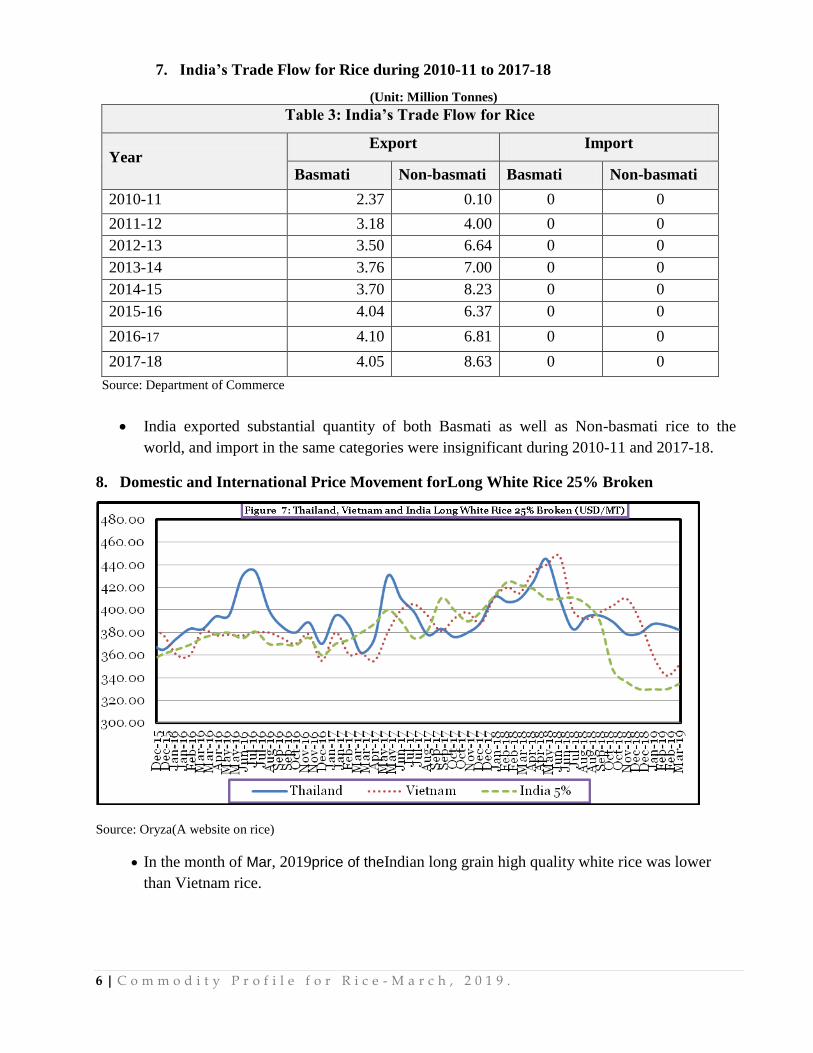
Source: Department of Commerce
In 2017-18,Bangladesh, Benin and Senegal, were amongst India’s top three importing
countries for non-basmati.In 2017-18,Bangladesh imports from India werehigher than over
previous year. It was mainly due to bad weather in Bangladesh which affects the rice
production in the country.
6 | C o m m o d i t y P r o f i l e f o r R i c e - M a r c h , 2 0 1 9 .
7. India’s Trade Flow for Rice during 2010-11 to 2017-18
(Unit: Million Tonnes)
Table 3: India’s Trade Flow for Rice
Year Export Import
Basmati Non-basmati Basmati Non-basmati
2010-11 2.37 0.10 0 0
2011-12 3.18 4.00 0 0
2012-13 3.50 6.64 0 0
2013-14 3.76 7.00 0 0
2014-15 3.70 8.23 0 0
2015-16 4.04 6.37 0 0
2016-17 4.10 6.81 0 0
2017-18 4.05 8.63 0 0
Source: Department of Commerce
India exported substantial quantity of both Basmati as well as Non-basmati rice to the
world, and import in the same categories were insignificant during 2010-11 and 2017-18.
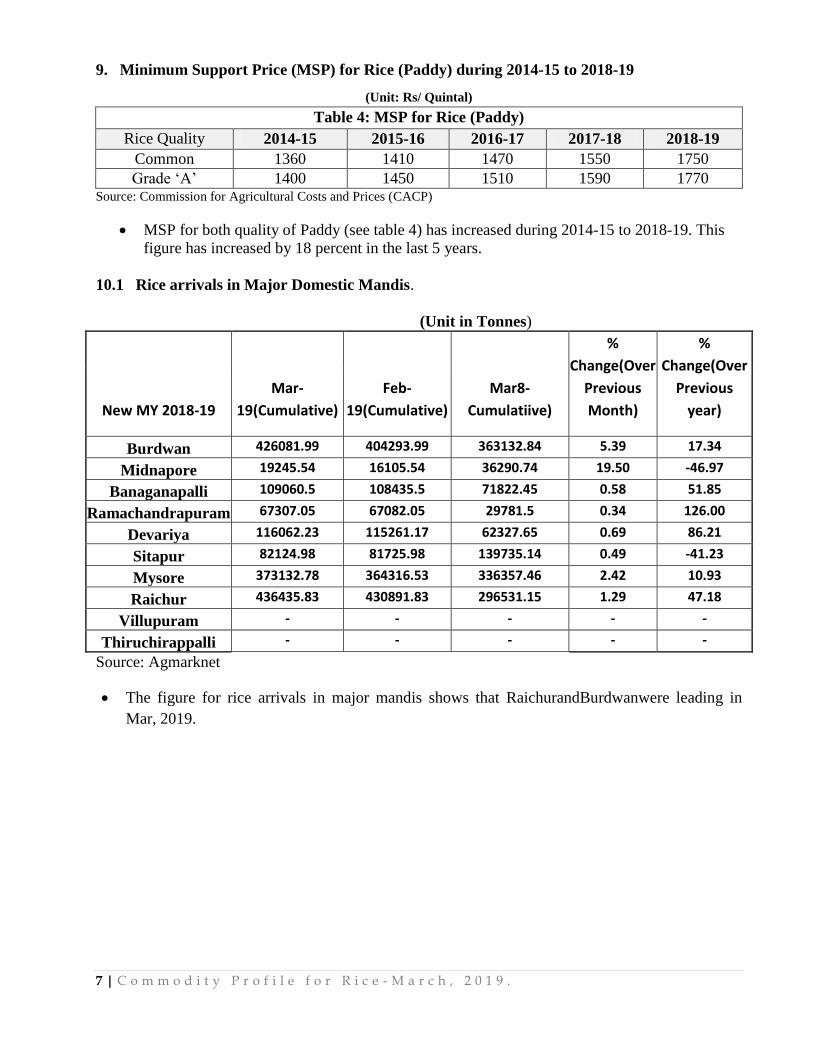
8. Domestic and International Price Movement forLong White Rice 25% Broken
Source: Oryza(A website on rice)
In the month of Mar, 2019price of theIndian long grain high quality white rice was lower
than Vietnam rice.
7 | C o m m o d i t y P r o f i l e f o r R i c e - M a r c h , 2 0 1 9 .
9. Minimum Support Price (MSP) for Rice (Paddy) during 2014-15 to 2018-19
(Unit: Rs/ Quintal)
Table 4: MSP for Rice (Paddy)
Rice Quality 2014-15 2015-16 2016-17 2017-18 2018-19
Common 1360 1410 1470 1550 1750
Grade ‘A’ 1400 1450 1510 1590 1770 Source: Commission for Agricultural Costs and Prices (CACP)
MSP for both quality of Paddy (see table 4) has increased during 2014-15 to 2018-19. This
figure has increased by 18 percent in the last 5 years.
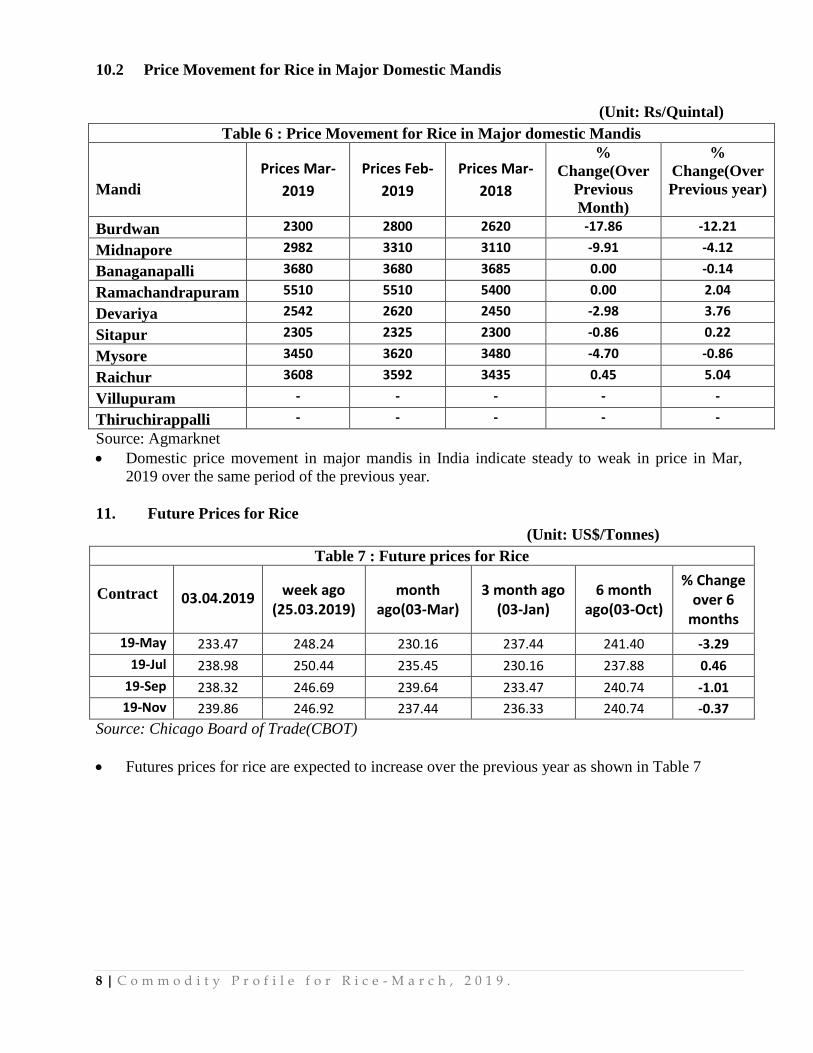
10.1 Rice arrivals in Major Domestic Mandis.
(Unit in Tonnes)
New MY 2018-19
Mar-
19(Cumulative)
Feb-
19(Cumulative)
Mar8-
Cumulatiive)
%
Change(Over
Previous
Month)
%
Change(Over
Previous
year)
Burdwan 426081.99 404293.99 363132.84 5.39 17.34
Midnapore 19245.54 16105.54 36290.74 19.50 -46.97
Banaganapalli 109060.5 108435.5 71822.45 0.58 51.85
Ramachandrapuram 67307.05 67082.05 29781.5 0.34 126.00
Devariya 116062.23 115261.17 62327.65 0.69 86.21
Sitapur 82124.98 81725.98 139735.14 0.49 -41.23
Mysore 373132.78 364316.53 336357.46 2.42 10.93
Raichur 436435.83 430891.83 296531.15 1.29 47.18
Villupuram - - - - -
Thiruchirappalli - - - - -
Source: Agmarknet
The figure for rice arrivals in major mandis shows that RaichurandBurdwanwere leading in
Mar, 2019.
8 | C o m m o d i t y P r o f i l e f o r R i c e - M a r c h , 2 0 1 9 .
10.2 Price Movement for Rice in Major Domestic Mandis
(Unit: Rs/Quintal)
Table 6 : Price Movement for Rice in Major domestic Mandis
Mandi
Prices Mar-
2019
Prices Feb-
2019
Prices Mar-
2018
%
Change(Over
Previous
Month)
%
Change(Over
Previous year)
Burdwan 2300 2800 2620 -17.86 -12.21
Midnapore 2982 3310 3110 -9.91 -4.12
Banaganapalli 3680 3680 3685 0.00 -0.14
Ramachandrapuram 5510 5510 5400 0.00 2.04
Devariya 2542 2620 2450 -2.98 3.76
Sitapur 2305 2325 2300 -0.86 0.22
Mysore 3450 3620 3480 -4.70 -0.86
Raichur 3608 3592 3435 0.45 5.04
Villupuram - - - - -
Thiruchirappalli - - - - -
Source: Agmarknet
Domestic price movement in major mandis in India indicate steady to weak in price in Mar,
2019 over the same period of the previous year.
11. Future Prices for Rice
(Unit: US$/Tonnes)
Table 7 : Future prices for Rice
Contract
03.04.2019
week ago (25.03.2019)
month ago(03-Mar)
3 month ago (03-Jan)
6 month ago(03-Oct)
% Change over 6
months
19-May 233.47 248.24 230.16 237.44 241.40 -3.29
19-Jul 238.98 250.44 235.45 230.16 237.88 0.46
19-Sep 238.32 246.69 239.64 233.47 240.74 -1.01
19-Nov 239.86 246.92 237.44 236.33 240.74 -0.37
Source: Chicago Board of Trade(CBOT)
Futures prices for rice are expected to increase over the previous year as shown in Table 7
9 | C o m m o d i t y P r o f i l e f o r R i c e - M a r c h , 2 0 1 9 .
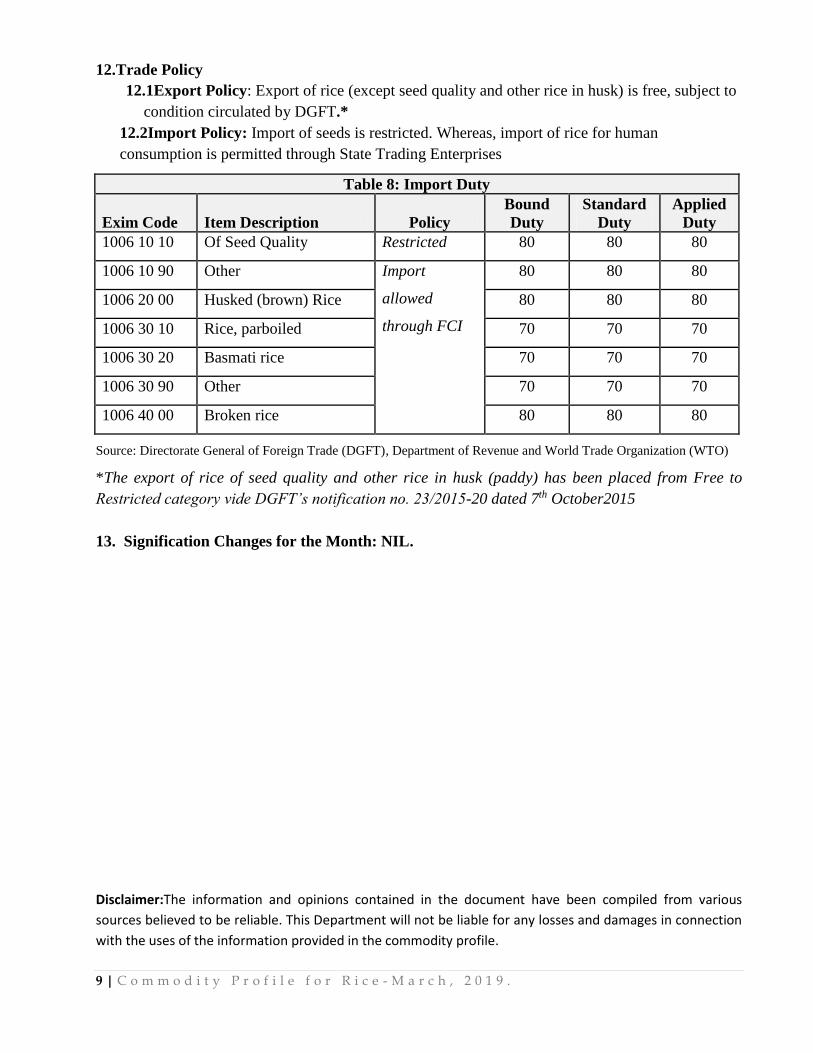
12.Trade Policy
12.1Export Policy: Export of rice (except seed quality and other rice in husk) is free, subject to
condition circulated by DGFT.*
12.2Import Policy: Import of seeds is restricted. Whereas, import of rice for human
consumption is permitted through State Trading Enterprises
Table 8: Import Duty
Exim Code Item Description Policy
Bound
Duty
Standard
Duty
Applied
Duty
1006 10 10 Of Seed Quality Restricted 80 80 80
1006 10 90 Other Import
allowed
through FCI
80 80 80
1006 20 00 Husked (brown) Rice 80 80 80
1006 30 10 Rice, parboiled 70 70 70
1006 30 20 Basmati rice 70 70 70
1006 30 90 Other 70 70 70
1006 40 00 Broken rice 80 80 80
Source: Directorate General of Foreign Trade (DGFT), Department of Revenue and World Trade Organization (WTO)
*The export of rice of seed quality and other rice in husk (paddy) has been placed from Free to
Restricted category vide DGFT’s notification no. 23/2015-20 dated 7th October2015
13. Signification Changes for the Month: NIL.
Disclaimer:The information and opinions contained in the document have been compiled from various
sources believed to be reliable. This Department will not be liable for any losses and damages in connection
with the uses of the information provided in the commodity profile.