Comments on the role of a surface water mission in the context of global water issues Dennis P....
18
Comments on the role of a surface water mission in the context of global water issues Dennis P. Lettenmaier Department of Civil and Environmental Engineering University of Washington Seattle, WA CNES/NASA Surface Water Working Group Meeting Toulouse November 16, 2004
-
Upload
arleen-thornton -
Category
Documents
-
view
216 -
download
2
Transcript of Comments on the role of a surface water mission in the context of global water issues Dennis P....

Comments on the role of a surface water mission in the context of global water
issuesDennis P. Lettenmaier
Department of Civil and Environmental EngineeringUniversity of Washington
Seattle, WA
CNES/NASA Surface Water Working Group Meeting
Toulouse
November 16, 2004


• Domestic consumptive use (U.S.) is ~200-250 liters/day
• Compare with drinking water requirement (about 5 l/day). U.S. domestic consumption has declined slightly over the last two decades. Much of difference between potable water requirement and use is sanitation, laundry, etc.
• Industrial requirement in developed world is of same order as domestic
• Total water withdrawals are about 6000 km3/yr• Compare with global (land) precip ~150,000
km3/yr (or global runoff ~0.4 x runoff)

Table courtesy Peter Gleick

Table courtesy Peter Gleick
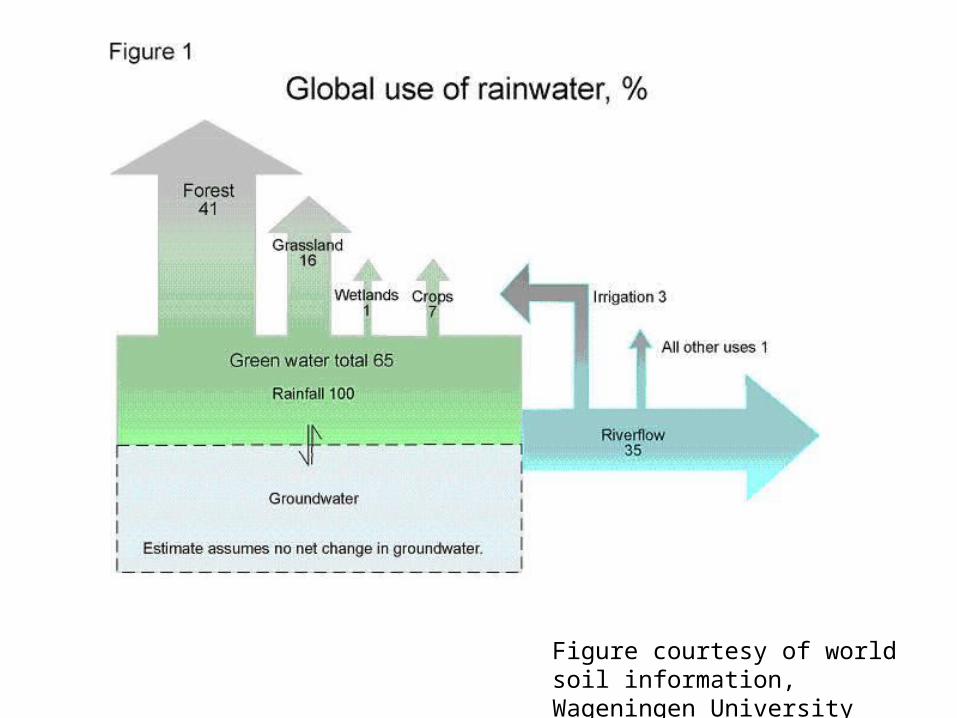
Figure courtesy of world soil information, Wageningen University

Figure courtesy of world soil information, Wageningen University

(Oki, et. al, 2002, IHE-UNESCO)
CaribbeanCaribbean
NorthNorth AmericaAmerica
Central Central AmericaAmerica
South South AmericaAmerica
WestWest
AfricaAfrica
OceaniaOceania
East &East &South East AsiaSouth East Asia
SouthSouth
AsiaAsia
USSRUSSR
North WestNorth WestAfricaAfrica
WesternWesternEuropeEurope
MiddleMiddle
EastEast
1~5 5~10 10~15 15~20 20~30 30~50 50<
Importer based, over 5 km3/y
km3/y
(Based on Statistics from FAO etc., for 2000)
78.5
33.5
46.2
57.538.8
36.4
An Adaptation Strategy to Cope with Scarcity? “Virtual Water” flow in 2000 (cereals only)

Global Reservoir DatabaseGlobal Reservoir DatabaseLocation (lat./lon.), Storage capacity, Area of water surface, Purpose of dam, Year of construction, …
13,382dams,

Global Water System Project
IGBP – IHDP – WCRP - Diversitas

Global Water System Project
IGBP – IHDP – WCRP - Diversitas
Human modificationof hydrological systems
Regulated Flow
Historic Naturalized Flow
Estimated Range of Naturalized FlowWith 2040’s Warming
Figure 1: mean seasonal hydrographs of the Columbia River prior to (blue) and after the completion of reservoirs that now have storage capacity equal to about one-third of the river’s mean annual flow (red), and the projected range of impacts on naturalized flows predicted to result from a range of global warming scenarios over the next century. Climate change scenarios IPCC Data and Distribution Center, hydrologic simulations courtesy of A. Hamlet, University of Washington.

0
100
200
300
400
500
600
700
800
Up to1900
1901-1910
1911-1920
1921-1930
1931-1940
1941-1950
1951-1960
1961-1970
1971-1980
1981-1990
1990-1998
Nu
mb
er
of
Re
se
rvo
irs
.
Australia/New Zealand
Africa
Asia
Europe
Central and South America
North America
Reservoir construction has slowed.
All reservoirs larger than 0.1 km3

Visual from Palmieri, NAS Sackler symposium, 2004

The Global Picture● Water resource issues will have large effects on
many of the world’s major decisions in the next 50 years.
● 1 billion people live on less than $1/day.
● More than 1.2 billion have inadequate drinking water (poor quality, insufficient quantity, but still priced beyond the means of the poorest), and twice that many (2.5 billion) lack sanitation facilities.
● Poorly handled: could result in wars and will result in premature deaths, poor quality of life for many, and widespread degradation of aquatic ecosystems.
● Well handled: opportunities for scientific and political creativity, international collaboration, promoting cooperation rather than discord.

Unmet Basic Human Needs for Water
• 1.1 billion people lack access to adequate drinking water (mostly in Africa and Asia).
• 2.4 billion people lack access to adequate sanitation services.
• 2.2 to 5 million die annually from preventable water-related diseases.

Gleick 2001
The link between water use and economic growth can be broken
0
1000
2000
3000
4000
5000
6000
7000
8000
1900 1910 1920 1930 1940 1950 1960 1970 1980 1990 2000
$199
6 U
.S. G
NP
0
100
200
300
400
500
600
700
800
900
1000
Wat
er W
ithd
raw
als
(km3 /y
r)

Widespread efficiency improvements are possible, in all sectors
•1930s: 200 tons of water per ton of steel
•1980s: 20-30 tons of water per ton of steel
•2002: 2-3 tons of water per ton of steel(and we are changing the structure of our economy…)
•Agricultural water use can drop and yields can increase with better irrigation technology.

Possible role and implications of a global surface water mission
• Free and open exchange of global hydrologic data (which presently does not exist)
• Understanding how reservoirs are operated (presently there is no coherent data base for reservoir storage)
• Water and human health (2 billion incidences of waterborne diseases per year globally!)