COMMENTS INC Chapter 5 Exhibit E 10 to 18 rev May2016.v2
28
Lake Powell Pipeline Project 5-787 4/30/16 Exhibit E 5.3.17 Air Quality 5.3.17.1 Affected Environment Area of Potential Effect. The area of potential effect for air quality includes areas of potential cultural sensitivity, tourism, environmental sensitivity, special status species, sensitive wildlife habitats, locations of economic or perceived aesthetic value, relatively dense population areas, WAs and WSAs, eligible wild and scenic river segments, and national recreation areas, monuments and parks. Air Quality Conditions. The air quality conditions in the area of potential effect have been evaluated based on general regional studies and site-specific areas that have been monitored. Limited information is available about local historical background air quality levels outside of populated areas; however, it is assumed the existing air quality conditions in the area of potential effect are typical of high desert, rural areas with low pollutant levels and occasional fugitive dust storms. 5.3.17.1.2.1 Dense Population Areas. Densely populated areas consist of the St. George metropolitan area (approximate population of 138,530 in 2012) (GOPB 2013). All other areas along the LPP Project alignments are either sparsely populated or run through small rural towns with populations of less than 15,000. 5.3.17.1.2.2 Historical Air Quality. Nearly all areas in the region are classified as attainment areas. There are minimal local data and the regional air quality research is focused on St. George and the surrounding area. A recent air quality concern in St. George is particulate matter, specifically PM 2.5 , as levels have increased. Monitoring of PM 2.5 has been performed in the St. George area; however, no violations of the 24-hour or annual standard have occurred. Utah Department of Air Quality (UDAQ) continues to monitor the air quality in St. George and the area is described as “unclassifiable” (UDAQ 2007). Data for the area of potential effect and region are detailed in Table 5-146. These data represent maximum background levels for the calculations and modeling because they are likely the highest levels in the southwest Utah region.
Transcript of COMMENTS INC Chapter 5 Exhibit E 10 to 18 rev May2016.v2
Lake Powell Pipeline Project 5-787 4/30/16 Exhibit E
5.3.17 Air Quality
5.3.17.1 Affected Environment
Area of Potential Effect.
The area of potential effect for air quality includes areas of potential cultural sensitivity, tourism, environmental sensitivity, special status species, sensitive wildlife habitats, locations of economic or perceived aesthetic value, relatively dense population areas, WAs and WSAs, eligible wild and scenic river segments, and national recreation areas, monuments and parks.
Air Quality Conditions.
The air quality conditions in the area of potential effect have been evaluated based on general regional studies and site-specific areas that have been monitored. Limited information is available about local historical background air quality levels outside of populated areas; however, it is assumed the existing air quality conditions in the area of potential effect are typical of high desert, rural areas with low pollutant levels and occasional fugitive dust storms.
5.3.17.1.2.1 Dense Population Areas.
Densely populated areas consist of the St. George metropolitan area (approximate population of 138,530 in 2012) (GOPB 2013). All other areas along the LPP Project alignments are either sparsely populated or run through small rural towns with populations of less than 15,000.
5.3.17.1.2.2 Historical Air Quality.
Nearly all areas in the region are classified as attainment areas. There are minimal local data and the regional air quality research is focused on St. George and the surrounding area. A recent air quality concern in St. George is particulate matter, specifically PM2.5, as levels have increased. Monitoring of PM2.5 has been performed in the St. George area; however, no violations of the 24-hour or annual standard have occurred. Utah Department of Air Quality (UDAQ) continues to monitor the air quality in St. George and the area is described as “unclassifiable” (UDAQ 2007).
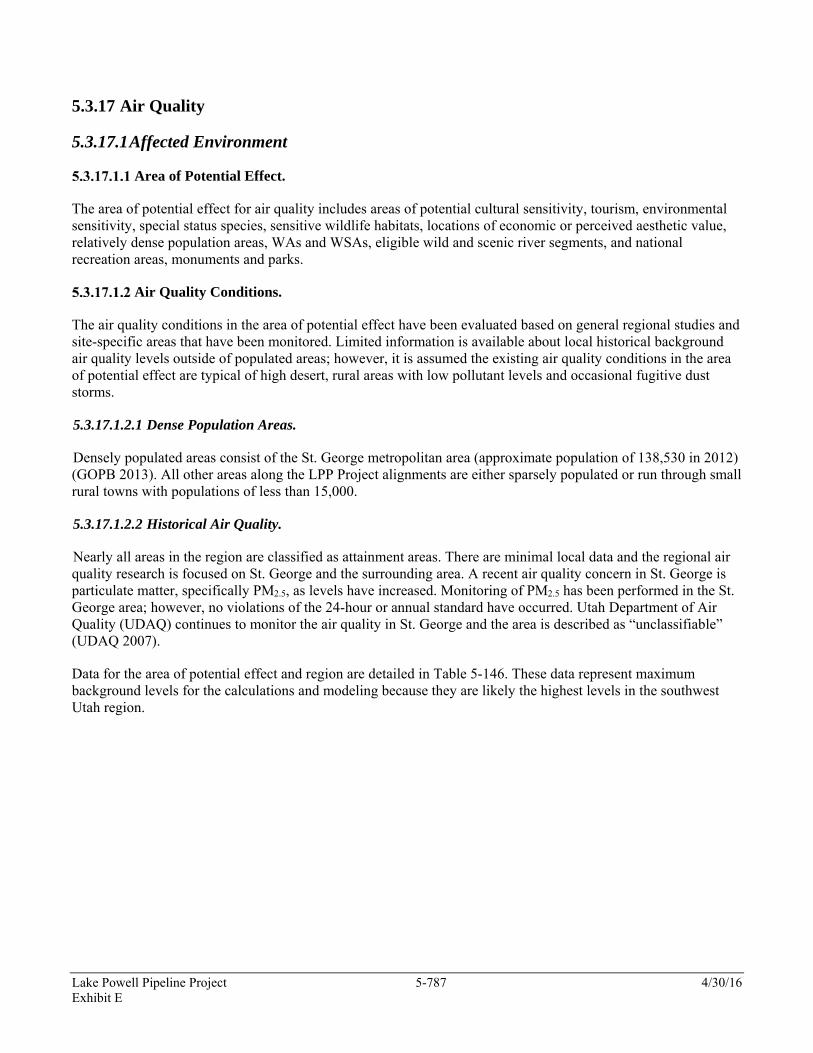
Data for the area of potential effect and region are detailed in Table 5-146. These data represent maximum background levels for the calculations and modeling because they are likely the highest levels in the southwest Utah region.
Lake Powell Pipeline Project 5-788 4/30/16 Exhibit E
Table 5-146
Regional Air Quality Data
Location Pollutant Averaging
Time Highest Concentration
Average
National Ambient Air Quality Standards
Grand Junction, CO CO 8-hour 8,000 µg/m3 10,000 µg/m3 1-hour 14,000 µg/m3 40,000 µg/m3
Kanab NO2 Annual 0.91 µg/m3 100 µg/m3
Kanab O3 8-hour 0.046 ppm 0.08 ppm 1-hour No data 0.12 ppm
St. George PM2.5
Annual Arithmetic
Mean <15 µg/m3 15 µg/m3
24-hour <35 µg/m3 35 µg/m3
St. George PM10 Annual 31 µg/m3 50 µg/m3 24-hour 123 µg/m3 150 µg/m3
Kanab SO2 Annual 0.43 µg/m3 80 µg/m3 24-hour No data 365 µg/m3 3-hour No data 1,300 µg/m3
Kane County SO2 Annual 4 µg/m3 80 µg/m3 1-hour 31 µg/m3 NA 24-hour 7 µg/m3 365 µg/m3 Kane County NO2 Annual 23 µg/m3 100 µg/m3 1-hour 37 µg/m3 NA Kane County PM10 Annual 83 µg/m3 50 µg/m3 1-hour 22 µg/m3 NA Kane County PM2.5 Annual 18 µg/m3 15 µg/m3 1-hour 10 µg/m3 NA Kane County CO 8-hour 2.8ppm 10,000 µg/m3 1-hour 4.2 ppm 40,000 µg/m3 Washington County SO2 Annual 99 µg/m3 80 µg/m3 1-hour 19 µg/m3 NA 24-hour 8 µg/m3 365 µg/m3 Washington County NO2 Annual 47 µg/m3 100 µg/m3 1-hour 75 µg/m3 NA Washington County PM10 Annual 86 µg/m3 50 µg/m3 1-hour 36 µg/m3 NA Washington County PM2.5 Annual 18 µg/m3 15 µg/m3 1-hour 8 µg/m3 NA Washington County CO 1-hour 19.5 ppm 10,000 µg/m3 8-hour 5.7 ppm 40,000 µg/m3 Note: NA = Not Applicable
Lake Powell Pipeline Project 5-789 4/30/16 Exhibit E
5.3.17.1.2.3 Meteorological Characteristics.
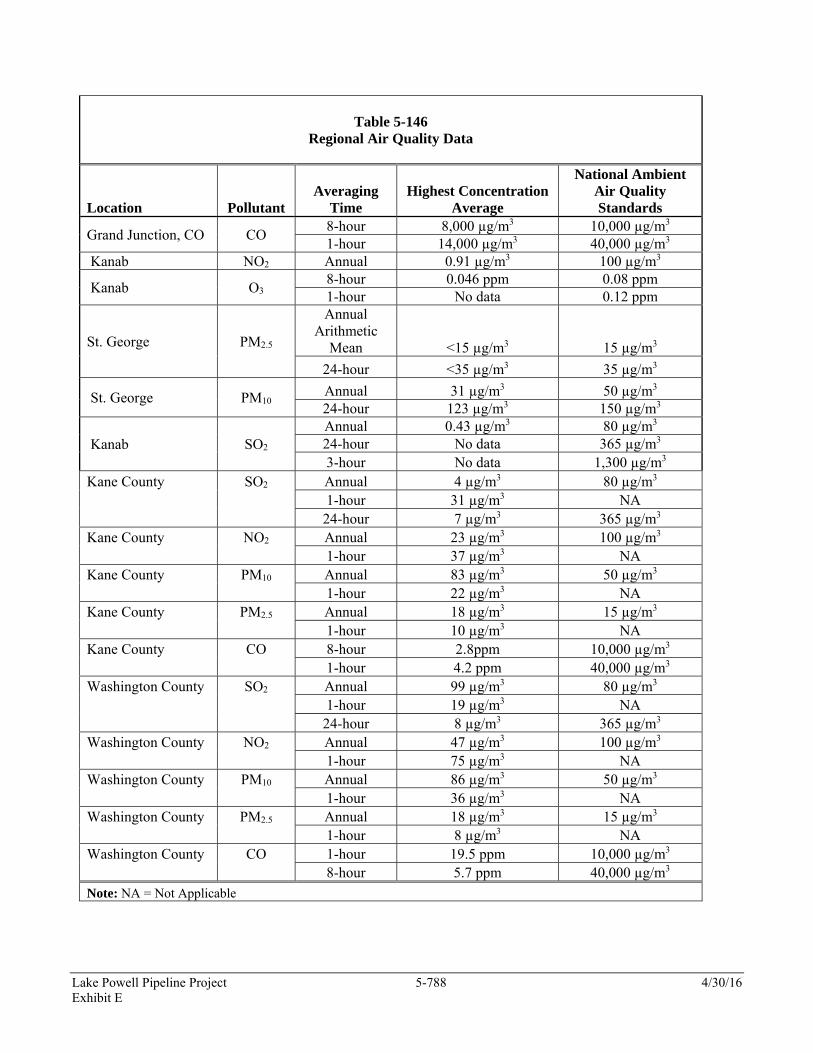
Much of the region has an arid to semi-arid climate. Precipitation ranges from approximately 8.3 inches per year near St. George to 13.5 inches per year in Kanab. Inversions, which create stagnant air in valleys and tend to increase air quality issues by confining pollutants, are not common, but can occur in the region from time to time, especially near St. George. Prevailing winds are generally from the west and southwest, although they can vary locally, seasonally and in connection with weather conditions. Temperatures can be extreme in this region with maximum temperatures over 100 degrees Fahrenheit in the summer and minimum temperatures below 0 degrees Fahrenheit in the winter. Local climate data are included in Tables 5-147 and 5-148.
Table 5-147 St. George Climate Data
Month
Average Max.
Temperature (F)
Average Min.
Temperature (F)
Average Total
Precipitation (in.)
Average Total
Snowfall (in.)
Average Wind Speed (mph)
Prevailing Wind
Direction January 53.6 25.8 1.07 1.3 3.4 E February 59.9 30.6 1.02 0.6 4.6 ENE March 67.9 36.3 0.93 0.2 5.8 ENE April 76.7 43.1 0.53 0 7.7 W May 86.1 51.1 0.39 0 8.3 W June 96.2 59.1 0.19 0 8.5 W July 101.7 66.5 0.67 0 7.8 W August 99.5 65.2 0.76 0 7.3 ENE September 92.6 55.4 0.6 0 6.2 ENE October 80.2 43.3 0.68 0 4.7 ENE November 64.8 32 0.64 0.2 3.4 E December 54 25.9 0.77 0.9 3.2 E Annual 77.8 44.5 8.25 3.2 5.9
Table 5-148 Kanab Climate Data
Month
Average Max. Temperature
(F)
Average Min. Temperature
(F)
Average Total Precipitation
(in.) Average Total Snowfall (in.)
Average Snow Depth
(in.) January 47.3 22 1.53 7.3 1 February 52.1 25.7 1.5 4.2 1 March 59.2 29.8 1.49 2.6 0 April 67.8 35.7 1.01 1.4 0 May 77.5 43 0.62 0 0 June 87.5 50.5 0.35 0 0 July 92.7 58.2 1.04 0 0 August 90.2 57.2 1.42 0 0 September 83.8 50.1 1.18 0 0 October 72.2 39.6 1.07 0.2 0 November 58.8 30.1 1.03 1.5 0 December 48.5 23.3 1.23 5.2 1 Annual 69.8 38.8 13.49 22.5 0
Lake Powell Pipeline Project 5-790 4/30/16 Exhibit E
5.3.17.1.2.4 Air Pollutants of Concern.
Following review of existing information and direct contacts with ADEQ and UDEQ staff, tribal and other officials, the primary air quality concerns were identified for the LPP Project (AAQD 2010a; AAQD 2010b; AAQD 2010c; BLM 2009; SGU 2009; FCAOG 2010; ICA 2010; Kaibab Tribe 2009; KCP&Z 2010; MCDPH 2010; NPS 2010; and UDAQ 2010b). The criteria air pollutants includes fugitive dust (PM10 and PM2.5), NO2, SO2, Pb, CO and O3. However, the primary air quality concern along the LPP Project alternative alignments is fugitive dust emissions during construction, and in particular throughout the St. George metropolitan area. Small emission sources are a concern to the state agencies and the regulations regarding small stationary source emissions would apply if the exemption criteria are exceeded (UDAQ 2010a). In general, the pipeline and associated facilities would be constructed in rural areas that are not likely to affect residents during short periods of NAAQS exceedance at or near the construction sites. Ozone NAAQS limit was revised in October of 2015 and should be also considered an air quality pollutant of concern and should be monitored during construction. Additional monitoring for ozone has been performed in both St. George and Zion National Park in recent years.
Fugitive Dust
Fugitive dust is a type of nonpoint source air pollution with small airborne particulate matter (PM) that does not originate from a specific point such as a gravel quarry or grain mill. Fugitive dust originates in small quantities over large areas. Fugitive dust can originate in large amounts also, although this is usually short-term (except during wind events). The PM in fugitive dust is generally a mixture of dust from various sources (soot is from combustion emissions but is also a PM) and is usually labeled as PM10 or PM2.5. PM10 and PM2.5 are defined as matter with diameters of 10 micrometers and less and 2.5 micrometers and less, respectively. Sources include, but are not limited to, unpaved roads, agricultural cropland, desert areas and construction sites.
Recent research indicates that there may be significant health considerations resulting from overexposure to PM (EPA 2011). These particles are so small that they can become imbedded in human lung tissue, causing or exacerbating respiratory diseases and cardiovascular problems. Other negative effects include reduced visibility and accelerated deterioration of buildings.
The LPP Project area is designated as an attainment area for all criteria pollutants, including fugitive dust (PM10 and PM25). St. George is currently designated as unclassified and UDEQ is monitoring the St. George air quality further to determine the appropriate designation for PM. Results from past surveys in St. George have indicated there have been no violations of either the 24-hour or annual PM standards. For purposes of this analysis, it is assumed that the St. George area would remain as an Unclassified or Attainment area. Kane and Washington counties in Utah and Coconino and Mohave counties in Arizona are designated as unclassified.
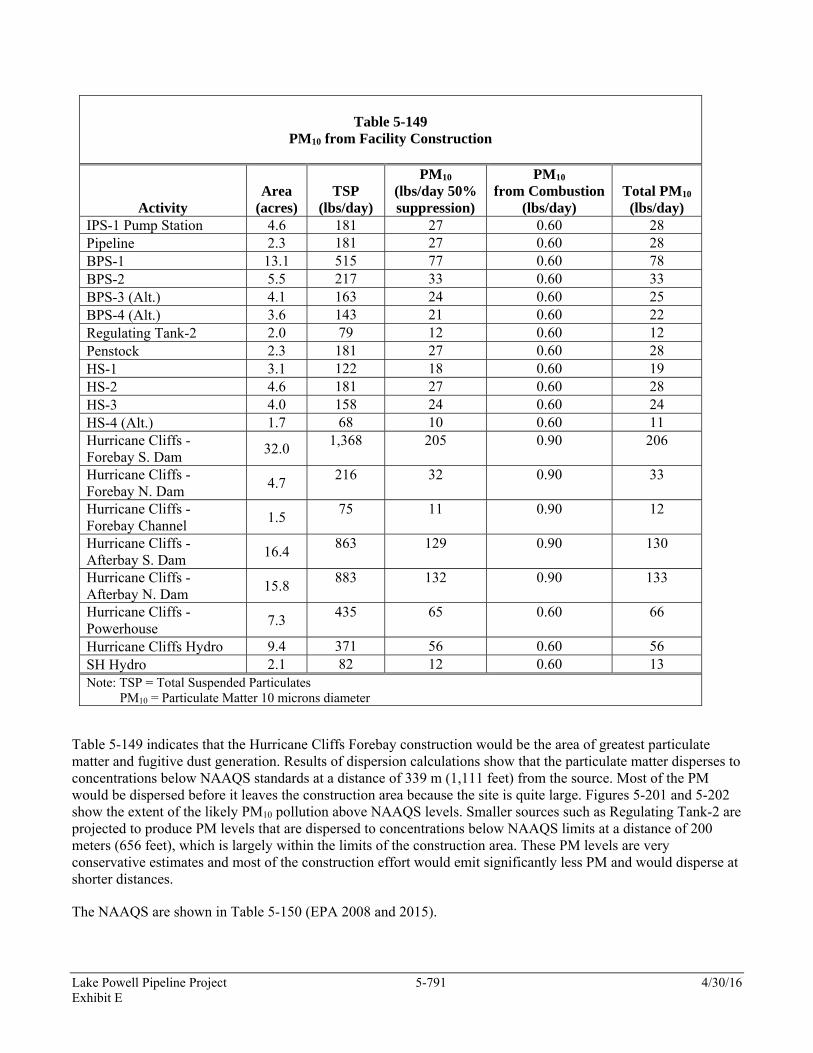
Table 5-149 shows the calculated PM emissions from the various construction activities.
Lake Powell Pipeline Project 5-791 4/30/16 Exhibit E
Table 5-149
PM10 from Facility Construction
Activity Area
(acres) TSP
(lbs/day)
PM10
(lbs/day 50% suppression)
PM10 from Combustion
(lbs/day) Total PM10 (lbs/day)
IPS-1 Pump Station 4.6 181 27 0.60 28 Pipeline 2.3 181 27 0.60 28 BPS-1 13.1 515 77 0.60 78 BPS-2 5.5 217 33 0.60 33 BPS-3 (Alt.) 4.1 163 24 0.60 25 BPS-4 (Alt.) 3.6 143 21 0.60 22 Regulating Tank-2 2.0 79 12 0.60 12 Penstock 2.3 181 27 0.60 28 HS-1 3.1 122 18 0.60 19 HS-2 4.6 181 27 0.60 28 HS-3 4.0 158 24 0.60 24 HS-4 (Alt.) 1.7 68 10 0.60 11 Hurricane Cliffs - Forebay S. Dam
32.0 1,368 205 0.90 206
Hurricane Cliffs - Forebay N. Dam
4.7 216 32 0.90 33
Hurricane Cliffs - Forebay Channel
1.5 75 11 0.90 12
Hurricane Cliffs - Afterbay S. Dam
16.4 863 129 0.90 130
Hurricane Cliffs - Afterbay N. Dam
15.8 883 132 0.90 133
Hurricane Cliffs - Powerhouse
7.3 435 65 0.60 66
Hurricane Cliffs Hydro 9.4 371 56 0.60 56 SH Hydro 2.1 82 12 0.60 13 Note: TSP = Total Suspended Particulates PM10 = Particulate Matter 10 microns diameter
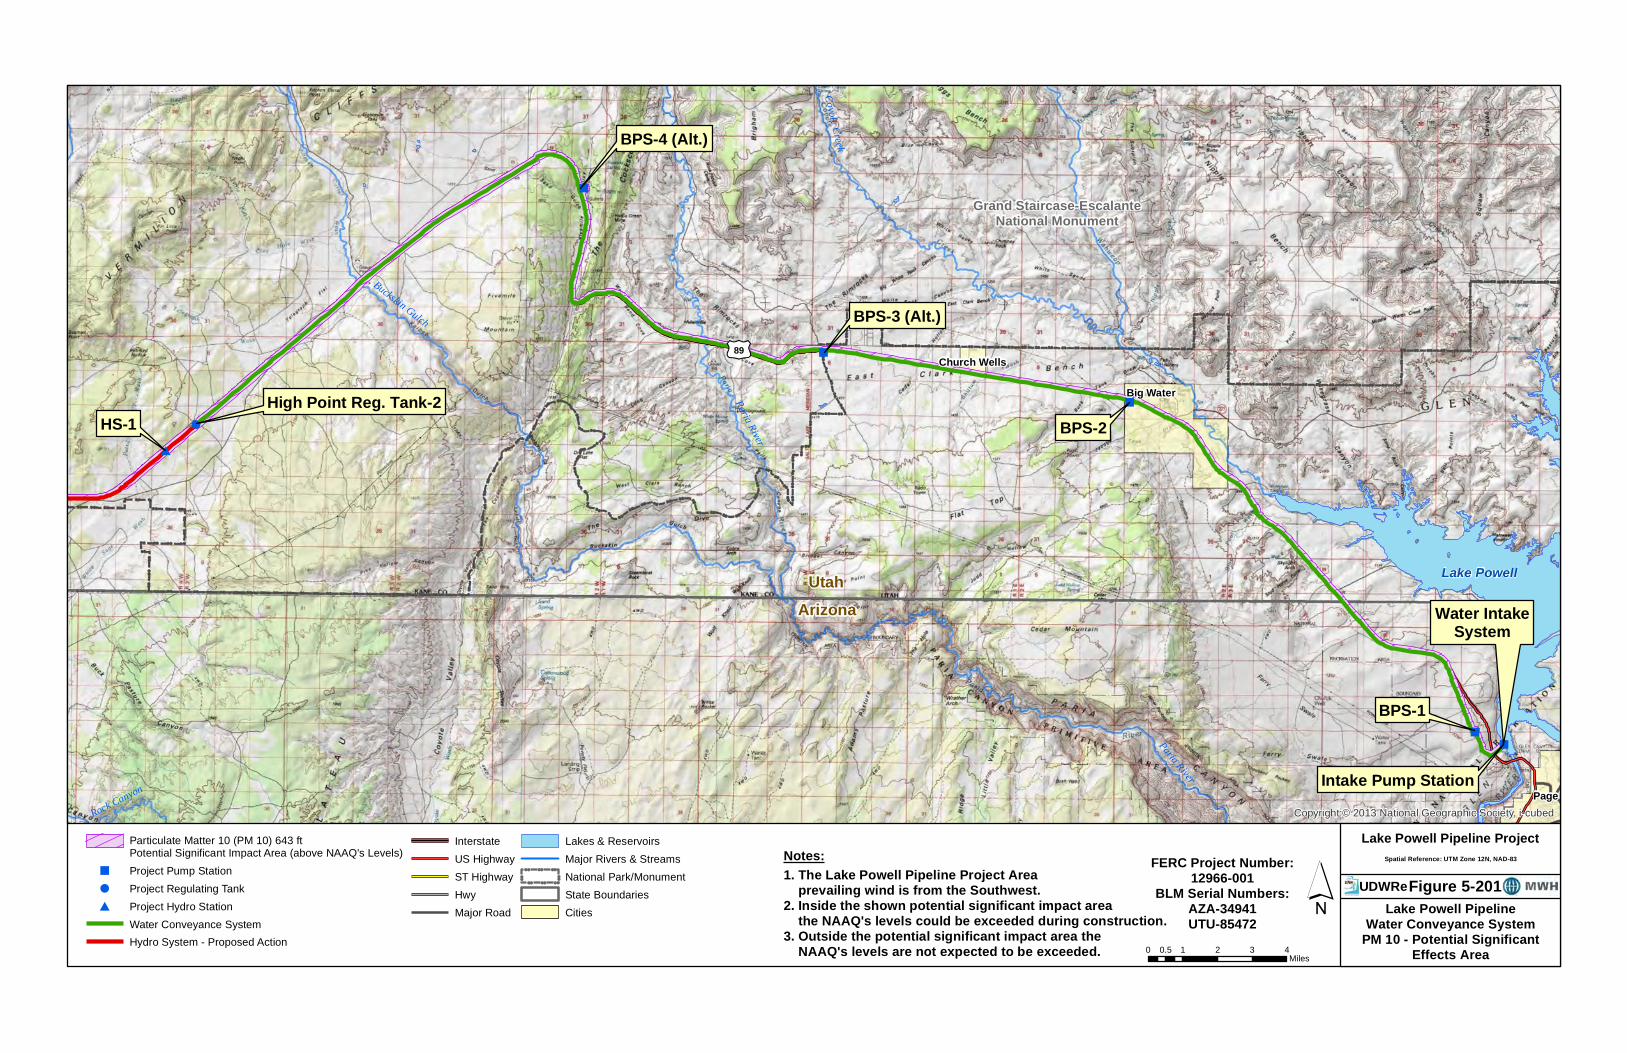
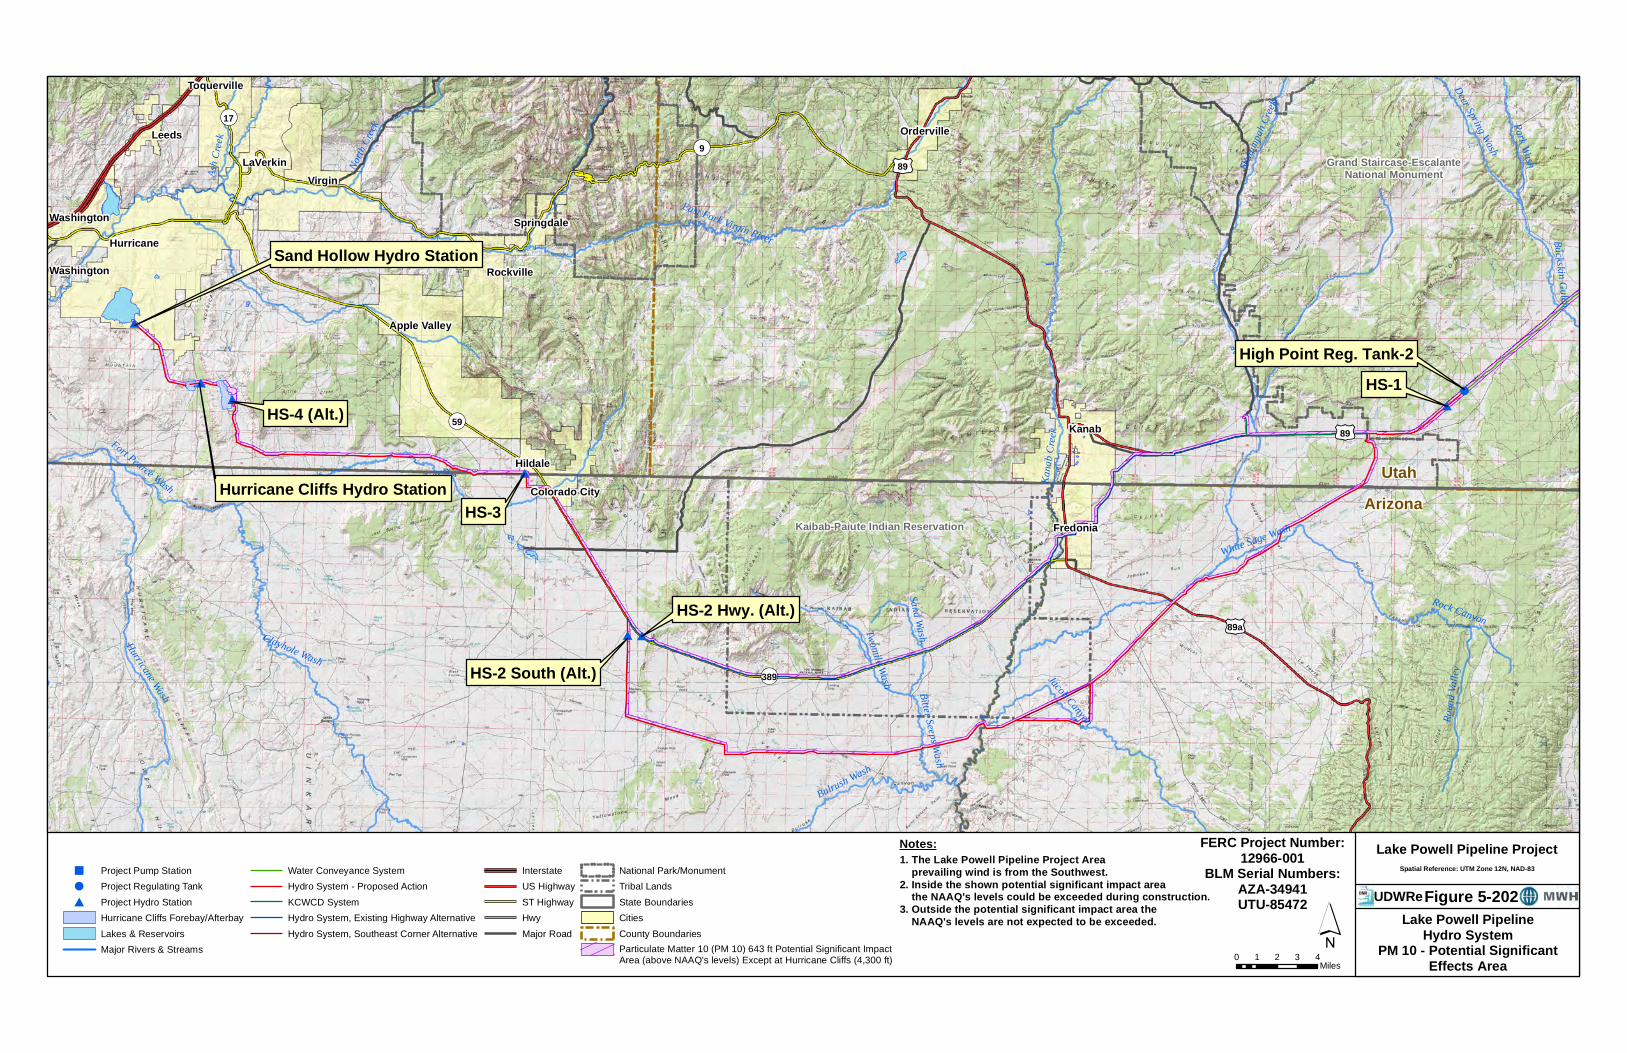
Table 5-149 indicates that the Hurricane Cliffs Forebay construction would be the area of greatest particulate matter and fugitive dust generation. Results of dispersion calculations show that the particulate matter disperses to concentrations below NAAQS standards at a distance of 339 m (1,111 feet) from the source. Most of the PM would be dispersed before it leaves the construction area because the site is quite large. Figures 5-201 and 5-202 show the extent of the likely PM10 pollution above NAAQS levels. Smaller sources such as Regulating Tank-2 are projected to produce PM levels that are dispersed to concentrations below NAAQS limits at a distance of 200 meters (656 feet), which is largely within the limits of the construction area. These PM levels are very conservative estimates and most of the construction effort would emit significantly less PM and would disperse at shorter distances.
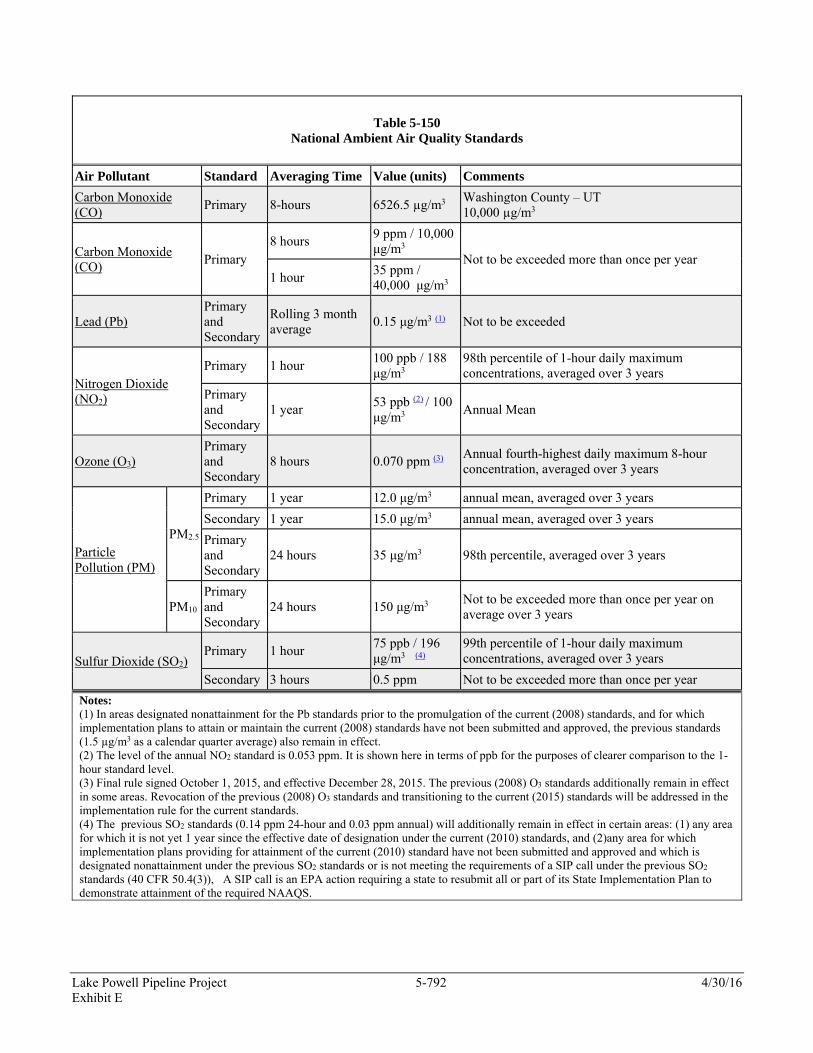
The NAAQS are shown in Table 5-150 (EPA 2008 and 2015).
Lake Powell Pipeline Project 5-792 4/30/16 Exhibit E
Notes: (1) In areas designated nonattainment for the Pb standards prior to the promulgation of the current (2008) standards, and for which implementation plans to attain or maintain the current (2008) standards have not been submitted and approved, the previous standards (1.5 µg/m3 as a calendar quarter average) also remain in effect. (2) The level of the annual NO2 standard is 0.053 ppm. It is shown here in terms of ppb for the purposes of clearer comparison to the 1-hour standard level. (3) Final rule signed October 1, 2015, and effective December 28, 2015. The previous (2008) O3 standards additionally remain in effect in some areas. Revocation of the previous (2008) O3 standards and transitioning to the current (2015) standards will be addressed in the implementation rule for the current standards. (4) The previous SO2 standards (0.14 ppm 24-hour and 0.03 ppm annual) will additionally remain in effect in certain areas: (1) any area for which it is not yet 1 year since the effective date of designation under the current (2010) standards, and (2)any area for which implementation plans providing for attainment of the current (2010) standard have not been submitted and approved and which is designated nonattainment under the previous SO2 standards or is not meeting the requirements of a SIP call under the previous SO2 standards (40 CFR 50.4(3)), A SIP call is an EPA action requiring a state to resubmit all or part of its State Implementation Plan to demonstrate attainment of the required NAAQS.
Table 5-150
National Ambient Air Quality Standards
Air Pollutant Standard Averaging Time Value (units) Comments
Carbon Monoxide (CO)
Primary 8-hours 6526.5 µg/m3 Washington County – UT 10,000 µg/m3
Carbon Monoxide (CO)
Primary 8 hours
9 ppm / 10,000 μg/m3
Not to be exceeded more than once per year 1 hour
35 ppm / 40,000 μg/m3
Lead (Pb)
Primary and Secondary
Rolling 3 month average
0.15 μg/m3 (1) Not to be exceeded
Nitrogen Dioxide (NO2)
Primary 1 hour 100 ppb / 188 μg/m3
98th percentile of 1-hour daily maximum concentrations, averaged over 3 years
Primary and Secondary
1 year 53 ppb (2) / 100 μg/m3 Annual Mean
Ozone (O3)
Primary and Secondary
8 hours 0.070 ppm (3) Annual fourth-highest daily maximum 8-hour concentration, averaged over 3 years
Particle Pollution (PM)
PM2.5
Primary 1 year 12.0 μg/m3 annual mean, averaged over 3 years
Secondary 1 year 15.0 μg/m3 annual mean, averaged over 3 years
Primary and Secondary
24 hours 35 μg/m3 98th percentile, averaged over 3 years
PM10 Primary and Secondary
24 hours 150 μg/m3 Not to be exceeded more than once per year on average over 3 years
Sulfur Dioxide (SO2)
Primary 1 hour 75 ppb / 196 μg/m3 (4)
99th percentile of 1-hour daily maximum concentrations, averaged over 3 years
Secondary 3 hours 0.5 ppm Not to be exceeded more than once per year
#
!
"
""
"
"
BPS-1
High Point Reg. Tank-2
Intake Pump Station
UtahArizona
Grand Staircase-EscalanteNational Monument
BPS-2
Paria River
Water IntakeSystem
Lake Powell
BPS-3 (Alt.)
BPS-4 (Alt.)
HS-1Big Water
Page
Church Wells
Paria River
Buckskin Gulch
Coyote Creek
Rock Canyon
£¤89
Copyright:© 2013 National Geographic Society, i-cubed
Particulate Matter 10 (PM 10) 643 ft Potential Significant Impact Area (above NAAQ's Levels)
" Project Pump Station
! Project Regulating Tank
# Project Hydro Station
Water Conveyance System
Hydro System - Proposed Action
Interstate
US Highway
ST Highway
Hwy
Major Road
Lakes & Reservoirs
Major Rivers & Streams
!!!!!!!!
!! !! !!
!! National Park/Monument
State Boundaries
Cities
0 1 2 3 40.5Miles
´Spatial Reference: UTM Zone 12N, NAD-83
Lake Powell Pipeline Project
Lake Powell PipelineWater Conveyance System
PM 10 - Potential SignificantEffects Area
Figure 5-201UDWReFERC Project Number:
12966-001BLM Serial Numbers:
AZA-34941UTU-85472
1. The Lake Powell Pipeline Project Area prevailing wind is from the Southwest.2. Inside the shown potential significant impact area the NAAQ's levels could be exceeded during construction.3. Outside the potential significant impact area the NAAQ's levels are not expected to be exceeded.
Notes:
#
##
#
#
#
#!
High Point Reg. Tank-2
Grand Staircase-EscalanteNational Monument
UtahArizona
HS-1
HS-3
HS-2 South (Alt.)
Sand Hollow Hydro Station
Hurricane Cliffs Hydro Station
HS-2 Hwy. (Alt.)
¬«59HS-4 (Alt.)
Kaibab-Paiute Indian Reservation
Hurricane
Virgin
Apple Valley
Kanab
LaVerkin
Toquerville
Rockville
Hildale
Orderville
Fredonia
Leeds
Springdale
Colorado City
Washington
Washington
Kana
b Cree
k
Clayhole Wash
Hurricane Wash
East Fork Virgin River
Rock Canyon
Jacob Canyon Roun
d Vall
ey
Bulrush Wash
Park Wash
Ash C
reek
North
Creek
Deer Spring Wash
Sand Wash
Fort Pearce Wash
Twomile Wash
Buckskin Gulch
Skutum
pah C
reek
Bitter Seeps Wash
White Sage Wash
£¤89a
£¤89
£¤89
¬«389
¬«9
¬«17
" Project Pump Station
! Project Regulating Tank
# Project Hydro Station
Hurricane Cliffs Forebay/Afterbay
Lakes & Reservoirs
Major Rivers & Streams
Water Conveyance System
Hydro System - Proposed Action
KCWCD System
Hydro System, Existing Highway Alternative
Hydro System, Southeast Corner Alternative
Interstate
US Highway
ST Highway
Hwy
Major Road
!!!!!!
!! !! !! !
! National Park/Monument
Tribal Lands
State Boundaries
Cities
County Boundaries
Particulate Matter 10 (PM 10) 643 ft Potential Significant ImpactArea (above NAAQ's levels) Except at Hurricane Cliffs (4,300 ft) 0 1 2 3 4
Miles
Spatial Reference: UTM Zone 12N, NAD-83
Lake Powell Pipeline Project
Lake Powell PipelineHydro System
PM 10 - Potential SignificantEffects Area
UDWReFigure 5-202
´
FERC Project Number:12966-001
BLM Serial Numbers:AZA-34941UTU-85472
1. The Lake Powell Pipeline Project Area prevailing wind is from the Southwest.2. Inside the shown potential significant impact area the NAAQ's levels could be exceeded during construction.3. Outside the potential significant impact area the NAAQ's levels are not expected to be exceeded.
Notes:
Lake Powell Pipeline Project 5-795 4/30/16 Exhibit E
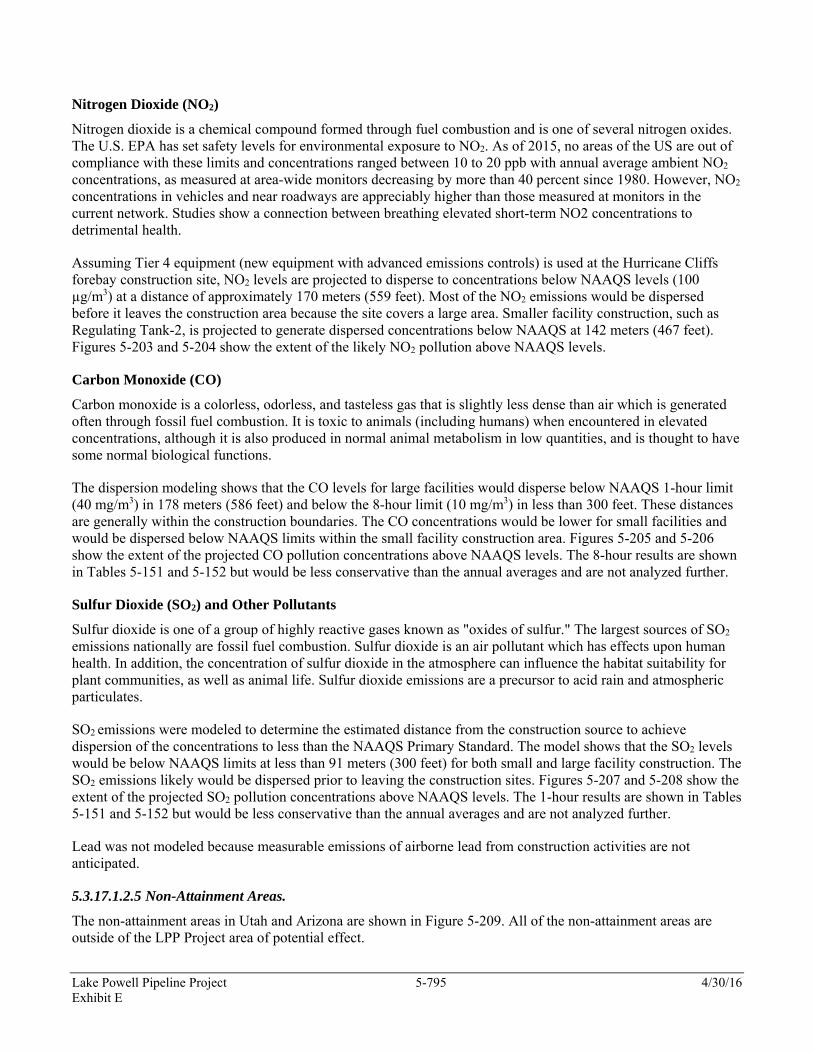
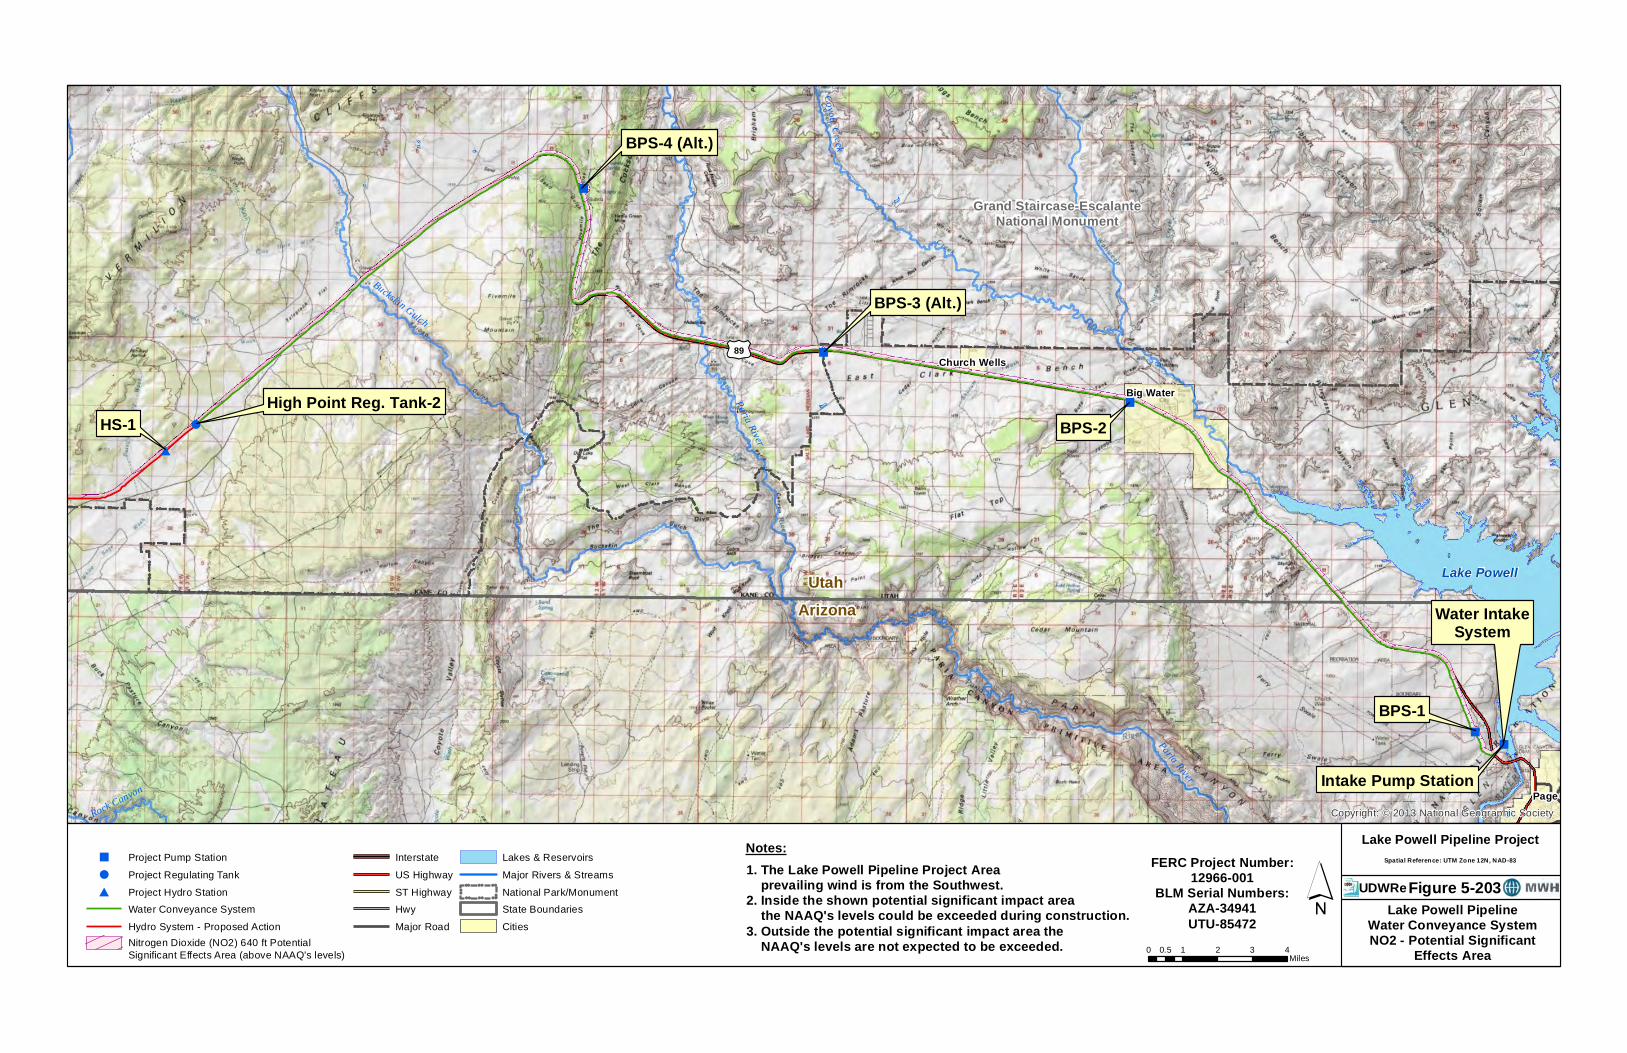
Nitrogen Dioxide (NO2)
Nitrogen dioxide is a chemical compound formed through fuel combustion and is one of several nitrogen oxides. The U.S. EPA has set safety levels for environmental exposure to NO2. As of 2015, no areas of the US are out of compliance with these limits and concentrations ranged between 10 to 20 ppb with annual average ambient NO2 concentrations, as measured at area-wide monitors decreasing by more than 40 percent since 1980. However, NO2 concentrations in vehicles and near roadways are appreciably higher than those measured at monitors in the current network. Studies show a connection between breathing elevated short-term NO2 concentrations to detrimental health.
Assuming Tier 4 equipment (new equipment with advanced emissions controls) is used at the Hurricane Cliffs forebay construction site, NO2 levels are projected to disperse to concentrations below NAAQS levels (100 µg/m3) at a distance of approximately 170 meters (559 feet). Most of the NO2 emissions would be dispersed before it leaves the construction area because the site covers a large area. Smaller facility construction, such as Regulating Tank-2, is projected to generate dispersed concentrations below NAAQS at 142 meters (467 feet). Figures 5-203 and 5-204 show the extent of the likely NO2 pollution above NAAQS levels.
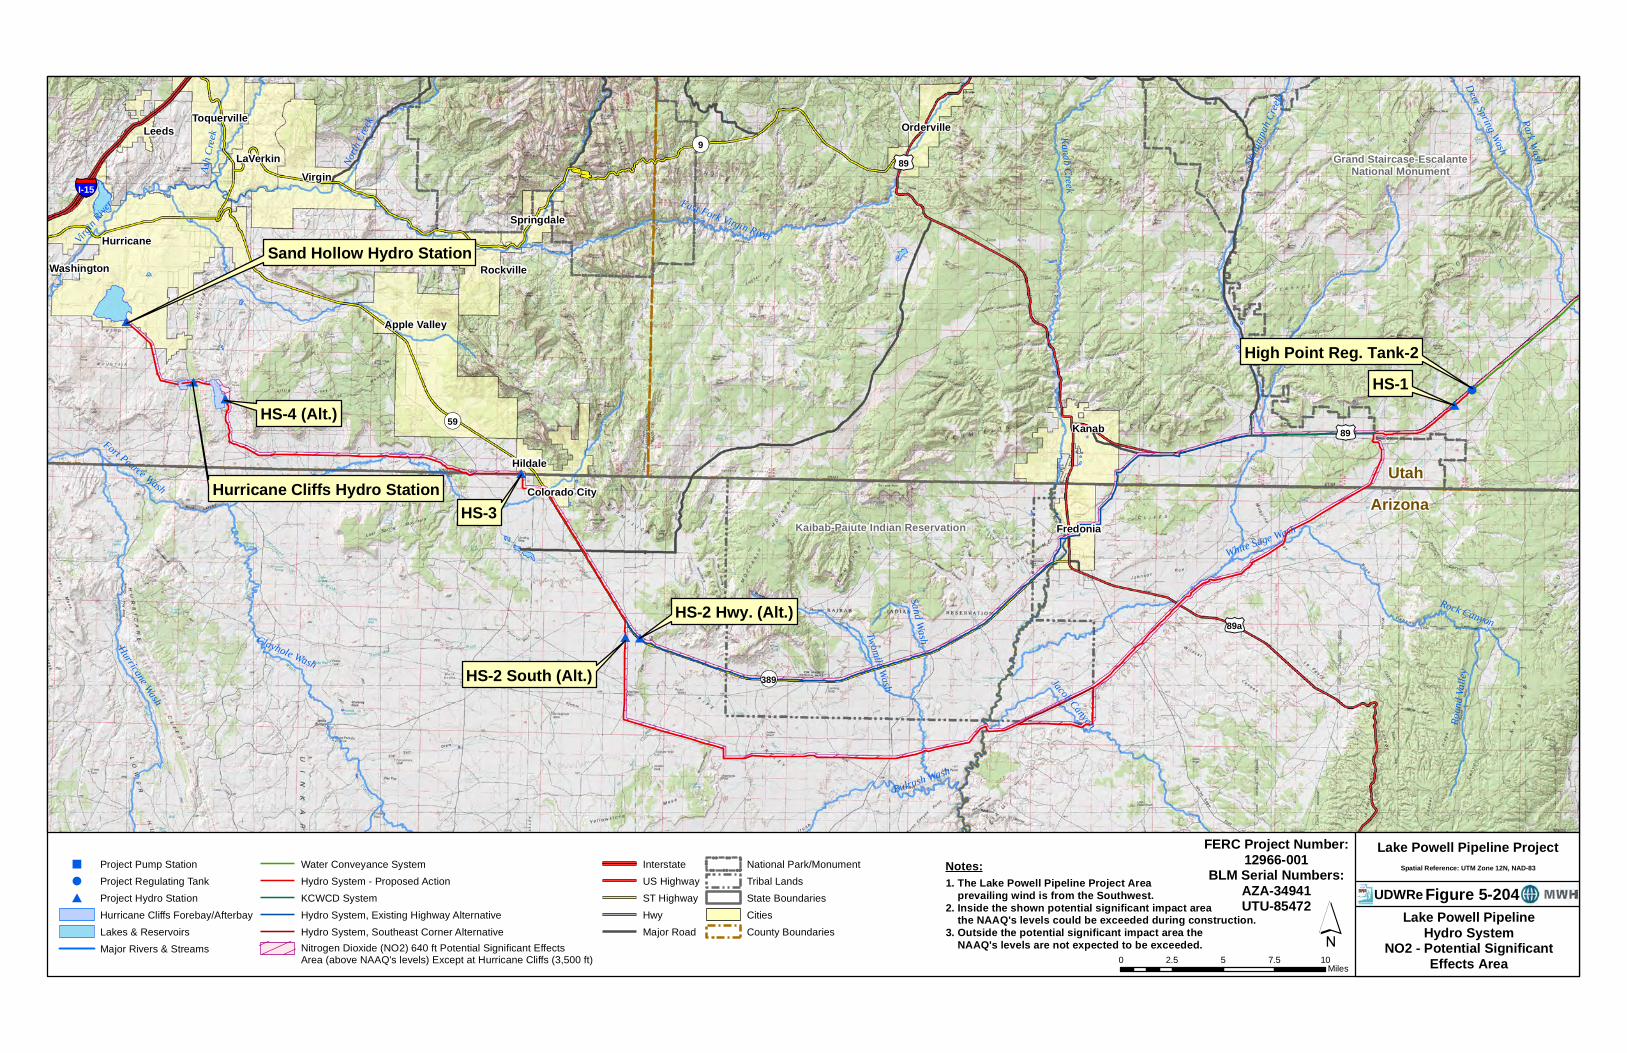
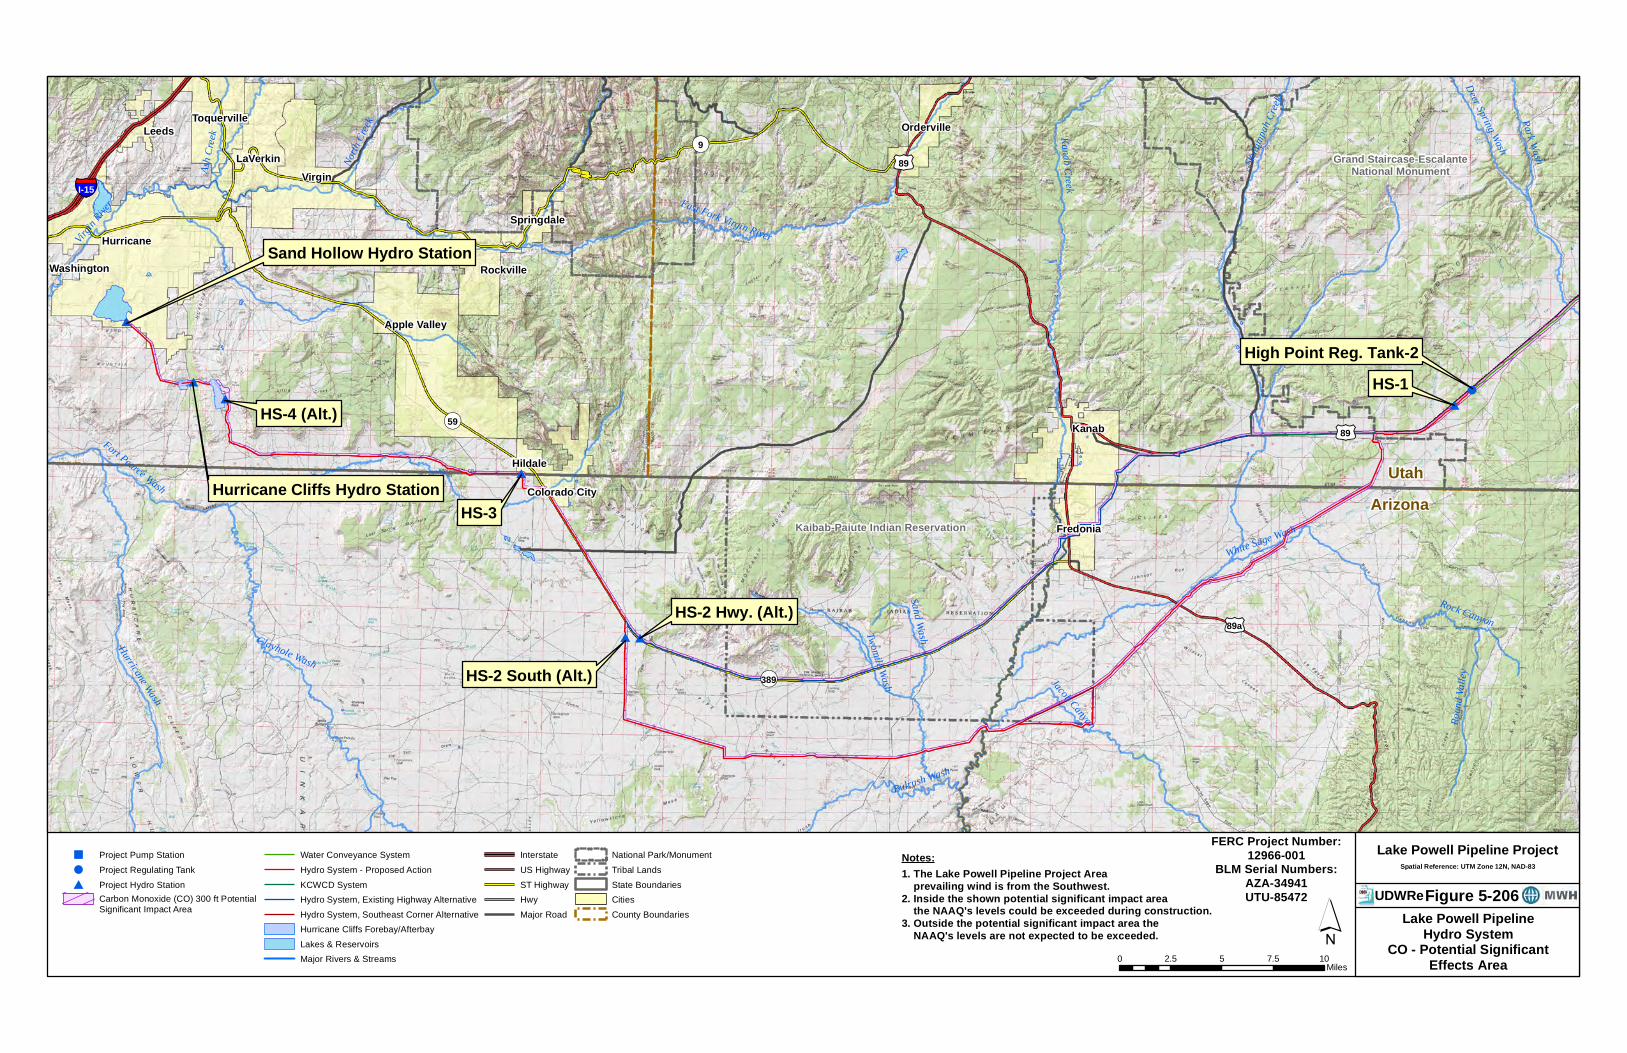
Carbon Monoxide (CO)
Carbon monoxide is a colorless, odorless, and tasteless gas that is slightly less dense than air which is generated often through fossil fuel combustion. It is toxic to animals (including humans) when encountered in elevated concentrations, although it is also produced in normal animal metabolism in low quantities, and is thought to have some normal biological functions.
The dispersion modeling shows that the CO levels for large facilities would disperse below NAAQS 1-hour limit (40 mg/m3) in 178 meters (586 feet) and below the 8-hour limit (10 mg/m3) in less than 300 feet. These distances are generally within the construction boundaries. The CO concentrations would be lower for small facilities and would be dispersed below NAAQS limits within the small facility construction area. Figures 5-205 and 5-206 show the extent of the projected CO pollution concentrations above NAAQS levels. The 8-hour results are shown in Tables 5-151 and 5-152 but would be less conservative than the annual averages and are not analyzed further.
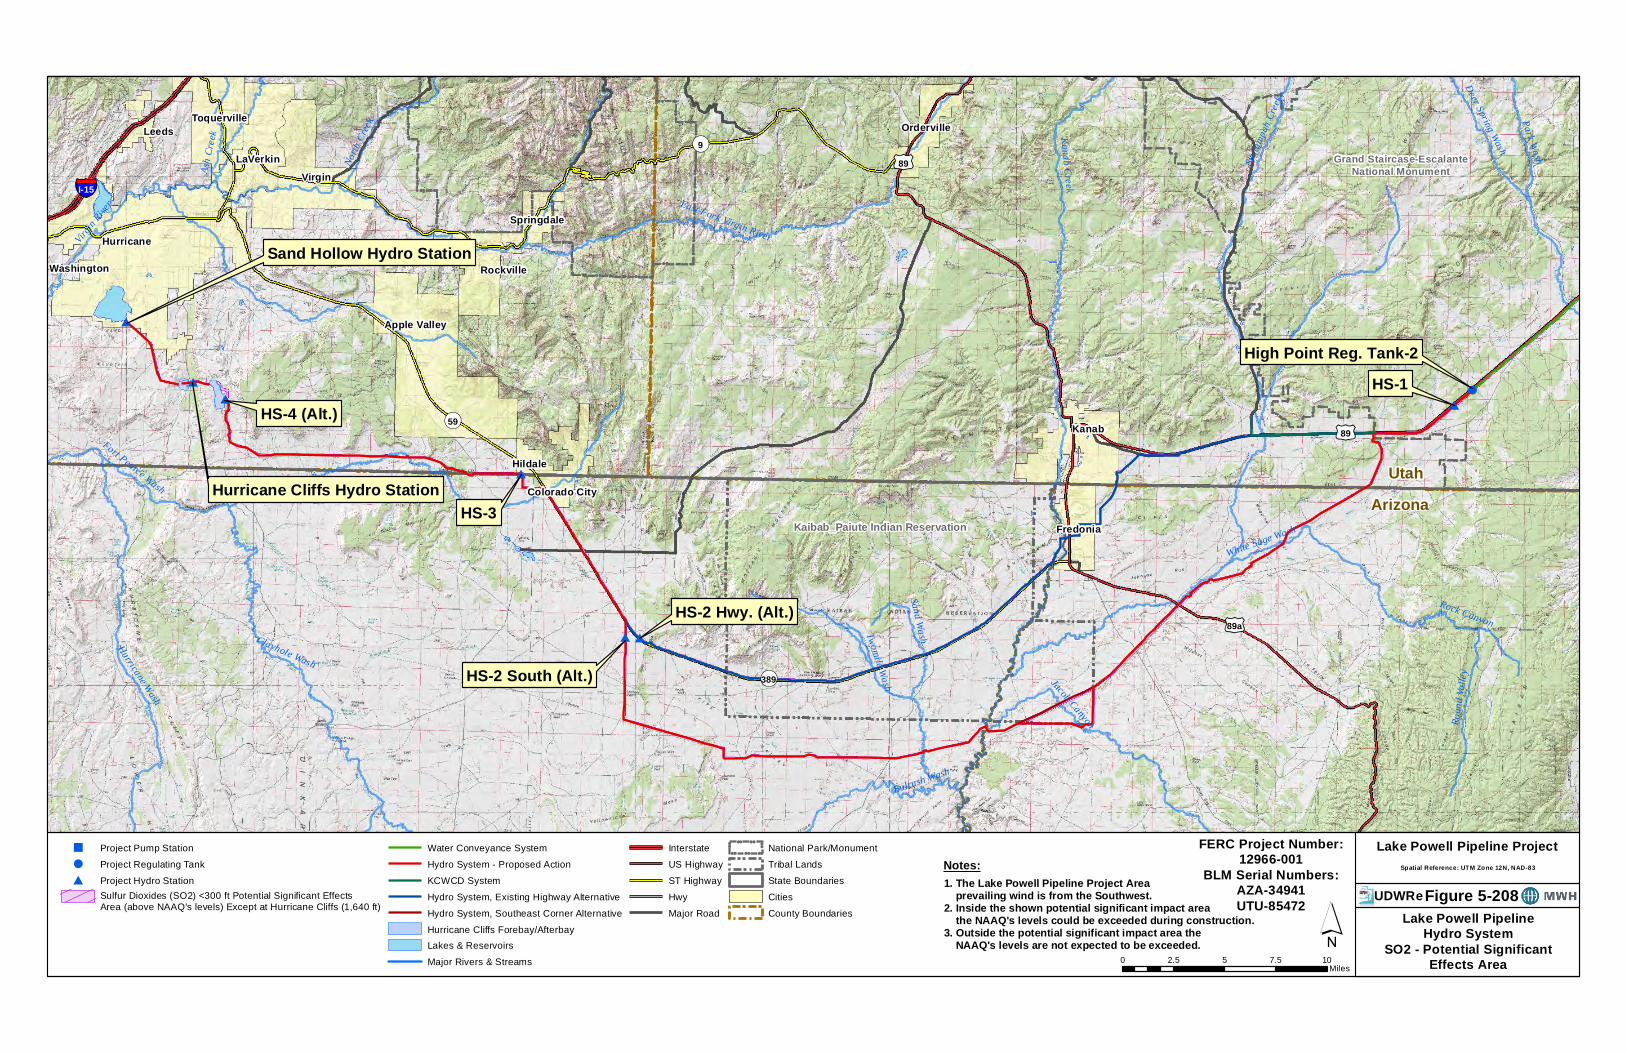
Sulfur Dioxide (SO2) and Other Pollutants
Sulfur dioxide is one of a group of highly reactive gases known as "oxides of sulfur." The largest sources of SO2
emissions nationally are fossil fuel combustion. Sulfur dioxide is an air pollutant which has effects upon human health. In addition, the concentration of sulfur dioxide in the atmosphere can influence the habitat suitability for plant communities, as well as animal life. Sulfur dioxide emissions are a precursor to acid rain and atmospheric particulates.
SO2 emissions were modeled to determine the estimated distance from the construction source to achieve dispersion of the concentrations to less than the NAAQS Primary Standard. The model shows that the SO2 levels would be below NAAQS limits at less than 91 meters (300 feet) for both small and large facility construction. The SO2 emissions likely would be dispersed prior to leaving the construction sites. Figures 5-207 and 5-208 show the extent of the projected SO2 pollution concentrations above NAAQS levels. The 1-hour results are shown in Tables 5-151 and 5-152 but would be less conservative than the annual averages and are not analyzed further.
Lead was not modeled because measurable emissions of airborne lead from construction activities are not anticipated.
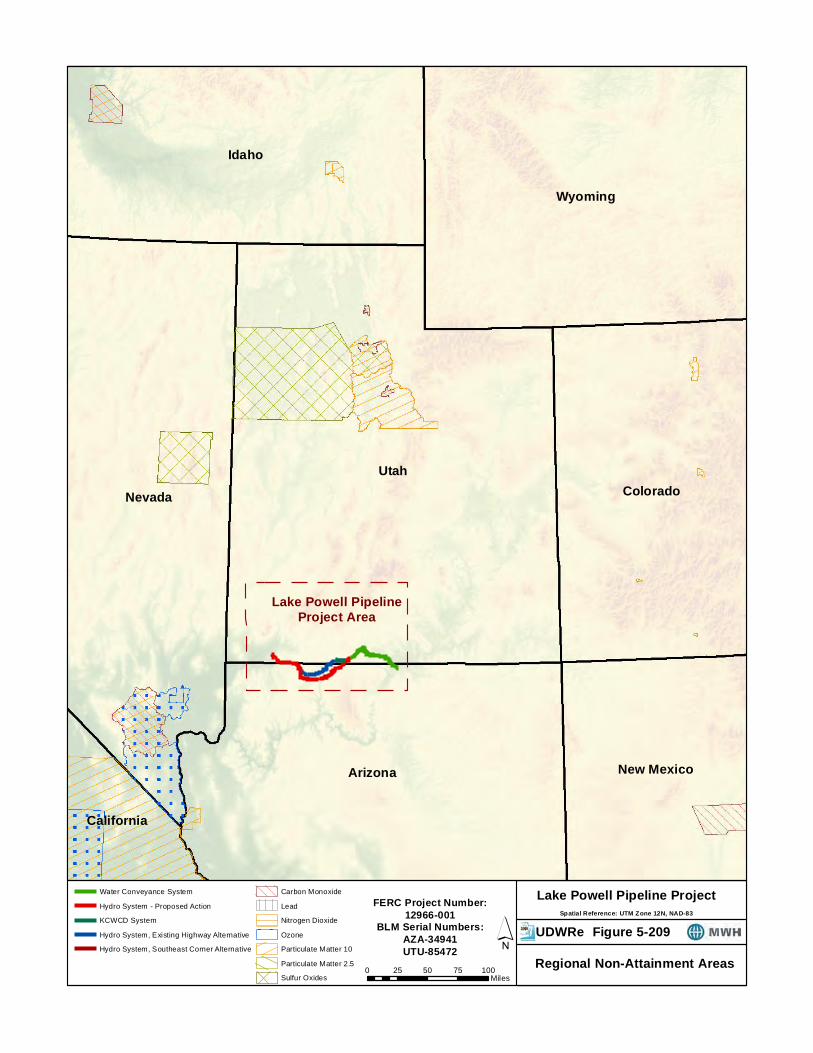
5.3.17.1.2.5 Non-Attainment Areas.
The non-attainment areas in Utah and Arizona are shown in Figure 5-209. All of the non-attainment areas are outside of the LPP Project area of potential effect.
#
!
"
""
"
"
BPS-1
High Point Reg. Tank-2
Intake Pump Station
UtahArizona
Grand Staircase-EscalanteNational Monument
BPS-2
Paria River
Water IntakeSystem
Lake Powell
BPS-3 (Alt.)
BPS-4 (Alt.)
HS-1Big Water
Page
Church Wells
Paria River
Buckskin Gulch
Coyote Creek
Rock Canyon
£¤89
Copyright: © 2013 National Geographic Society
" Project Pump Station
! Project Regulating Tank
# Project Hydro Station
Water Conveyance System
Hydro System - Proposed Action
Nitrogen Dioxide (NO2) 640 ft Potential Significant Effects Area (above NAAQ's levels)
Interstate
US Highway
ST Highway
Hwy
Major Road
Lakes & Reservoirs
Major Rivers & Streams
!!!!!!!!
!! !! !!
!! National Park/Monument
State Boundaries
Cities
0 1 2 3 40.5Miles
´Spatial Reference: UTM Zone 12N, NAD-83
Lake Powell Pipeline Project
Lake Powell PipelineWater Conveyance SystemNO2 - Potential Significant
Effects Area
Figure 5-203UDWReFERC Project Number:
12966-001BLM Serial Numbers:
AZA-34941UTU-85472
1. The Lake Powell Pipeline Project Area prevailing wind is from the Southwest.2. Inside the shown potential significant impact area the NAAQ's levels could be exceeded during construction.3. Outside the potential significant impact area the NAAQ's levels are not expected to be exceeded.
Notes:
#
# #
#
#
#
#!
High Point Reg. Tank-2
Grand Staircase-EscalanteNational Monument
UtahArizona
HS-1
HS-3
HS-2 South (Alt.)
Sand Hollow Hydro Station
Hurricane Cliffs Hydro Station
HS-2 Hwy. (Alt.)
¬«59HS-4 (Alt.)
Kaibab-Paiute Indian Reservation
Hurricane
Virgin
Apple Valley
Kanab
LaVerkin
Rockville
Toquerville
Hildale
Orderville
Fredonia
Leeds
Springdale
Colorado City
Washington
Kanab Creek
Virgin R
iver
Clayhole Wash
Hurricane Wash
East Fork Virgin River
Rock Canyon
Jacob Canyon Roun
d Vall
ey
Park Wash
Bulrush Wash
Ash C
reek
North
Creek
Deer Spring Wash
Sand WashTwomile Wash
Fort Pearce Wash
Skutum
pah C
reek
White Sage Wash
§̈¦I-15
£¤89a
£¤89
£¤89
¬«389
¬«9
" Project Pump Station
! Project Regulating Tank
# Project Hydro Station
Hurricane Cliffs Forebay/Afterbay
Lakes & Reservoirs
Major Rivers & Streams
Water Conveyance System
Hydro System - Proposed Action
KCWCD System
Hydro System, Existing Highway Alternative
Hydro System, Southeast Corner Alternative
Nitrogen Dioxide (NO2) 640 ft Potential Significant EffectsArea (above NAAQ's levels) Except at Hurricane Cliffs (3,500 ft)
Interstate
US Highway
ST Highway
Hwy
Major Road
!!!!!!
!!
!! !! !!! National Park/Monument
Tribal Lands
State Boundaries
Cities
County Boundaries
0 2.5 5 7.5 10Miles
Spatial Reference: UTM Zone 12N, NAD-83
Lake Powell Pipeline Project
Lake Powell PipelineHydro System
NO2 - Potential SignificantEffects Area
UDWRe Figure 5-204
´
FERC Project Number:12966-001
BLM Serial Numbers:AZA-34941UTU-85472
1. The Lake Powell Pipeline Project Area prevailing wind is from the Southwest.2. Inside the shown potential significant impact area the NAAQ's levels could be exceeded during construction.3. Outside the potential significant impact area the NAAQ's levels are not expected to be exceeded.
Notes:
#
!
"
""
"
"
BPS-1
High Point Reg. Tank-2
Intake Pump Station
UtahArizona
Grand Staircase-EscalanteNational Monument
BPS-2
Paria River
Water IntakeSystem
Lake Powell
BPS-3 (Alt.)
BPS-4 (Alt.)
HS-1Big Water
Page
Church Wells
Paria River
Buckskin Gulch
Coyote Creek
Rock Canyon
£¤89
Copyright: © 2013 National Geographic Society
" Project Pump Station
! Project Regulating Tank
# Project Hydro Station
Carbon Monoxide (CO) 528 ft Potential Significant Effects Area
Water Conveyance System
Hydro System - Proposed Action
Interstate
US Highway
ST Highway
Hwy
Major Road
Lakes & Reservoirs
Major Rivers & Streams
!!!!!!!!
!! !! !! !! National Park/Monument
State Boundaries
Cities
0 1 2 3 40.5Miles
´Spatial Reference: UTM Zone 12N, NAD-83
Lake Powell Pipeline Project
Lake Powell PipelineWater Conveyance SystemCO - Potential Significant
Effects Area
Figure 5-205UDWReFERC Project Number:
12966-001BLM Serial Numbers:
AZA-34941UTU-85472
1. The Lake Powell Pipeline Project Area prevailing wind is from the Southwest.2. Inside the shown potential significant impact area the NAAQ's levels could be exceeded during construction.3. Outside the potential significant impact area the NAAQ's levels are not expected to be exceeded.
Notes:
#
# #
#
#
#
#!
High Point Reg. Tank-2
Grand Staircase-EscalanteNational Monument
UtahArizona
HS-1
HS-3
HS-2 South (Alt.)
Sand Hollow Hydro Station
Hurricane Cliffs Hydro Station
HS-2 Hwy. (Alt.)
¬«59HS-4 (Alt.)
Kaibab-Paiute Indian Reservation
Hurricane
Virgin
Apple Valley
Kanab
LaVerkin
Rockville
Toquerville
Hildale
Orderville
Fredonia
Leeds
Springdale
Colorado City
Washington
Kanab Creek
Virgin R
iver
Clayhole Wash
Hurricane Wash
East Fork Virgin River
Rock Canyon
Jacob Canyon Roun
d Vall
ey
Park Wash
Bulrush Wash
Ash C
reek
North
Creek
Deer Spring Wash
Sand WashTwomile Wash
Fort Pearce Wash
Skutum
pah C
reek
White Sage Wash
§̈¦I-15
£¤89a
£¤89
£¤89
¬«389
¬«9
" Project Pump Station
! Project Regulating Tank
# Project Hydro Station
Carbon Monoxide (CO) 300 ft Potential Significant Impact Area
Water Conveyance System
Hydro System - Proposed Action
KCWCD System
Hydro System, Existing Highway Alternative
Hydro System, Southeast Corner Alternative
Hurricane Cliffs Forebay/Afterbay
Lakes & Reservoirs
Major Rivers & Streams
Interstate
US Highway
ST Highway
Hwy
Major Road
!!!!!!
!! !! !!
!! National Park/Monument
Tribal Lands
State Boundaries
Cities
County Boundaries
0 2.5 5 7.5 10Miles
Spatial Reference: UTM Zone 12N, NAD-83Lake Powell Pipeline Project
Lake Powell PipelineHydro System
CO - Potential SignificantEffects Area
UDWReFigure 5-206
´
FERC Project Number:12966-001
BLM Serial Numbers:AZA-34941UTU-85472
1. The Lake Powell Pipeline Project Area prevailing wind is from the Southwest.2. Inside the shown potential significant impact area the NAAQ's levels could be exceeded during construction.3. Outside the potential significant impact area the NAAQ's levels are not expected to be exceeded.
Notes:

#
!
"
""
"
"
BPS-1
High Point Reg. Tank-2
Intake Pump Station
UtahArizona
Grand Staircase-EscalanteNational Monument
BPS-2
Paria River
Water IntakeSystem
Lake Powell
BPS-3 (Alt.)
BPS-4 (Alt.)
HS-1Big Water
Page
Church Wells
Paria River
Buckskin Gulch
Coyote CreekRock Canyon
£¤89
Copyright: © 2013 National Geographic Society
" Project Pump Station
! Project Regulating Tank
# Project Hydro Station
Water Conveyance System
Hydro System - Proposed Action
Sulfur Dioxides (SO2) <300 ft Potential Significant Effects Area
Interstate
US Highway
ST Highway
Hwy
Major Road
Lakes & Reservoirs
Major Rivers & Streams
!!!!!!
!!
!! !! !! !
!!! National Park/Monument
State Boundaries
Cities
0 1 2 3 40.5Miles
´Spatial Reference: UTM Zone 12N, NAD-83
Lake Powell Pipeline Project
Lake Powell PipelineWater Conveyance SystemSO2 - Potential Significant
Effects Area
Figure 5-207UDWReFERC Project Number:
12966-001BLM Serial Numbers:
AZA-34941UTU-85472
1. The Lake Powell Pipeline Project Area prevailing wind is from the Southwest.2. Inside the shown potential significant impact area the NAAQ's levels could be exceeded during construction.3. Outside the potential significant impact area the NAAQ's levels are not expected to be exceeded.
Notes:
#
# #
#
#
#
#!
High Point Reg. Tank-2
Grand Staircase-EscalanteNational Monument
UtahArizona
HS-1
HS-3
HS-2 South (Alt.)
Sand Hollow Hydro Station
Hurricane Cliffs Hydro Station
HS-2 Hwy. (Alt.)
¬«59HS-4 (Alt.)
Kaibab_Paiute Indian Reservation
Hurricane
Virgin
Apple Valley
Kanab
LaVerkin
Rockville
Toquerville
Hildale
Orderville
Fredonia
Leeds
Springdale
Colorado City
Washington
Kanab Creek
Virgin
River
Clayhole Wash
Hurricane Wash
East Fork Virgin River
Rock Canyon
Jacob Canyon Roun
d Vall
ey
Park Wash
Bulrush Wash
Ash C
reek
North
Creek
Deer Spring Wash
Sand WashTwomile Wash
Fort Pearce Wash
Skutum
pah C
reek
White Sage Wash
§̈¦I-15
£¤89a
£¤89
£¤89
¬«389
¬«9
" Project Pump Station
! Project Regulating Tank
# Project Hydro Station
Sulfur Dioxides (SO2) <300 ft Potential Significant EffectsArea (above NAAQ's levels) Except at Hurricane Cliffs (1,640 ft)
Water Conveyance System
Hydro System - Proposed Action
KCWCD System
Hydro System, Existing Highway Alternative
Hydro System, Southeast Corner Alternative
Hurricane Cliffs Forebay/Afterbay
Lakes & Reservoirs
Major Rivers & Streams
Interstate
US Highway
ST Highway
Hwy
Major Road
!!!!!!
!! !! !! !
!
National Park/Monument
Tribal Lands
State Boundaries
Cities
County Boundaries
0 2.5 5 7.5 10Miles
Spatial Reference: UTM Zone 12N, NAD-83
Lake Powell Pipeline Project
Lake Powell PipelineHydro System
SO2 - Potential SignificantEffects Area
UDWReFigure 5-208
´
FERC Project Number:12966-001
BLM Serial Numbers:AZA-34941UTU-85472
Notes:1. The Lake Powell Pipeline Project Area prevailing wind is from the Southwest.2. Inside the shown potential significant impact area the NAAQ's levels could be exceeded during construction.3. Outside the potential significant impact area the NAAQ's levels are not expected to be exceeded.
Spatial Reference: UTM Zone 12N, NAD-83
Lake Powell Pipeline Project
Regional Non-Attainment Areas
UtahNevada
Idaho
Arizona
Wyoming
Colorado
New Mexico
California
Water Conveyance System
Hydro System - Proposed Action
KCWCD System
Hydro System, Existing Highway Alternative
Hydro System, Southeast Corner Alternative
Carbon Monoxide
Lead
Nitrogen Dioxide
Ozone
Particulate Matter 10
Particulate Matter 2.5
Sulfur Oxides0 25 50 75 100
Miles
´ UDWReFERC Project Number:
12966-001BLM Serial Numbers:
AZA-34941UTU-85472
Figure 5-209
Lake Powell PipelineProject Area
Lake Powell Pipeline Project 5-803 4/30/16 Exhibit E
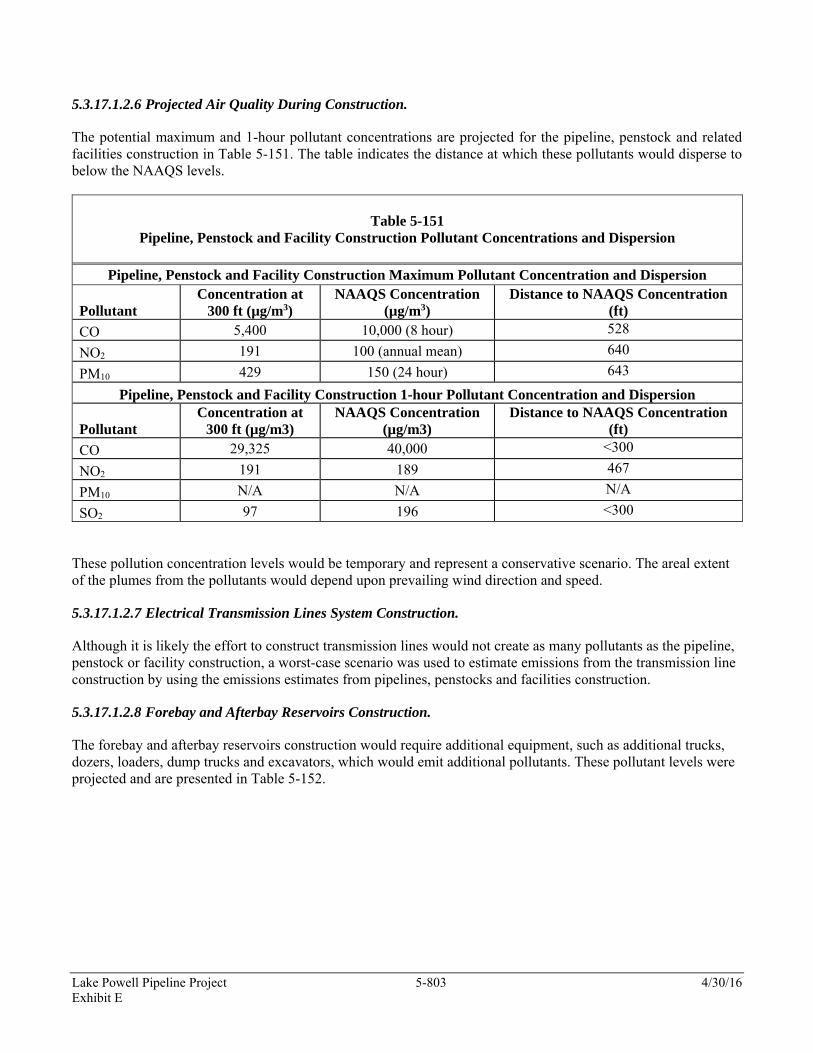
5.3.17.1.2.6 Projected Air Quality During Construction.
The potential maximum and 1-hour pollutant concentrations are projected for the pipeline, penstock and related facilities construction in Table 5-151. The table indicates the distance at which these pollutants would disperse to below the NAAQS levels.
Table 5-151
Pipeline, Penstock and Facility Construction Pollutant Concentrations and Dispersion
Pipeline, Penstock and Facility Construction Maximum Pollutant Concentration and Dispersion
Pollutant Concentration at
300 ft (µg/m3) NAAQS Concentration
(µg/m3) Distance to NAAQS Concentration
(ft)
CO 5,400 10,000 (8 hour) 528
NO2 191 100 (annual mean) 640
PM10 429 150 (24 hour) 643
Pipeline, Penstock and Facility Construction 1-hour Pollutant Concentration and Dispersion
Pollutant Concentration at
300 ft (µg/m3) NAAQS Concentration
(µg/m3) Distance to NAAQS Concentration
(ft)
CO 29,325 40,000 <300
NO2 191 189 467
PM10 N/A N/A N/A
SO2 97 196 <300
These pollution concentration levels would be temporary and represent a conservative scenario. The areal extent of the plumes from the pollutants would depend upon prevailing wind direction and speed.
5.3.17.1.2.7 Electrical Transmission Lines System Construction.
Although it is likely the effort to construct transmission lines would not create as many pollutants as the pipeline, penstock or facility construction, a worst-case scenario was used to estimate emissions from the transmission line construction by using the emissions estimates from pipelines, penstocks and facilities construction.
5.3.17.1.2.8 Forebay and Afterbay Reservoirs Construction.
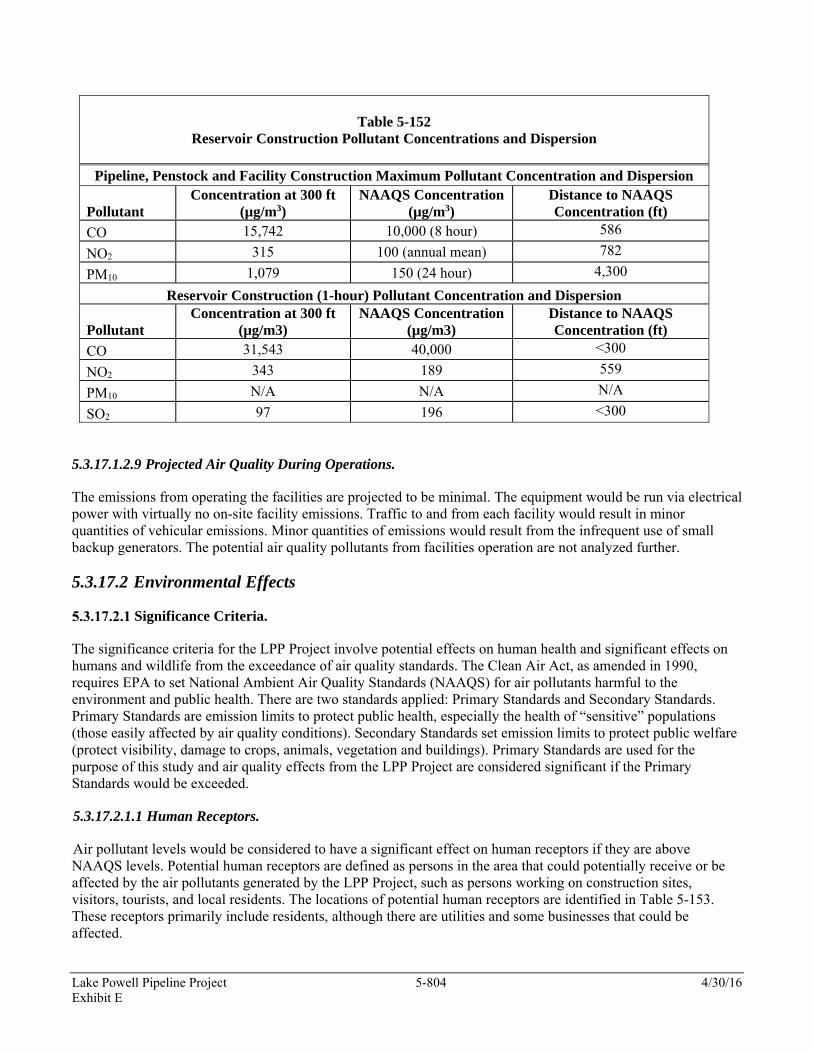
The forebay and afterbay reservoirs construction would require additional equipment, such as additional trucks, dozers, loaders, dump trucks and excavators, which would emit additional pollutants. These pollutant levels were projected and are presented in Table 5-152.
Lake Powell Pipeline Project 5-804 4/30/16 Exhibit E
Table 5-152
Reservoir Construction Pollutant Concentrations and Dispersion
Pipeline, Penstock and Facility Construction Maximum Pollutant Concentration and Dispersion
Pollutant Concentration at 300 ft
(µg/m3) NAAQS Concentration
(µg/m3) Distance to NAAQS Concentration (ft)
CO 15,742 10,000 (8 hour) 586
NO2 315 100 (annual mean) 782
PM10 1,079 150 (24 hour) 4,300
Reservoir Construction (1-hour) Pollutant Concentration and Dispersion
Pollutant Concentration at 300 ft
(µg/m3) NAAQS Concentration
(µg/m3) Distance to NAAQS Concentration (ft)
CO 31,543 40,000 <300
NO2 343 189 559
PM10 N/A N/A N/A
SO2 97 196 <300
5.3.17.1.2.9 Projected Air Quality During Operations.
The emissions from operating the facilities are projected to be minimal. The equipment would be run via electrical power with virtually no on-site facility emissions. Traffic to and from each facility would result in minor quantities of vehicular emissions. Minor quantities of emissions would result from the infrequent use of small backup generators. The potential air quality pollutants from facilities operation are not analyzed further.
5.3.17.2 Environmental Effects
Significance Criteria.
The significance criteria for the LPP Project involve potential effects on human health and significant effects on humans and wildlife from the exceedance of air quality standards. The Clean Air Act, as amended in 1990, requires EPA to set National Ambient Air Quality Standards (NAAQS) for air pollutants harmful to the environment and public health. There are two standards applied: Primary Standards and Secondary Standards. Primary Standards are emission limits to protect public health, especially the health of “sensitive” populations (those easily affected by air quality conditions). Secondary Standards set emission limits to protect public welfare (protect visibility, damage to crops, animals, vegetation and buildings). Primary Standards are used for the purpose of this study and air quality effects from the LPP Project are considered significant if the Primary Standards would be exceeded.
5.3.17.2.1.1 Human Receptors.
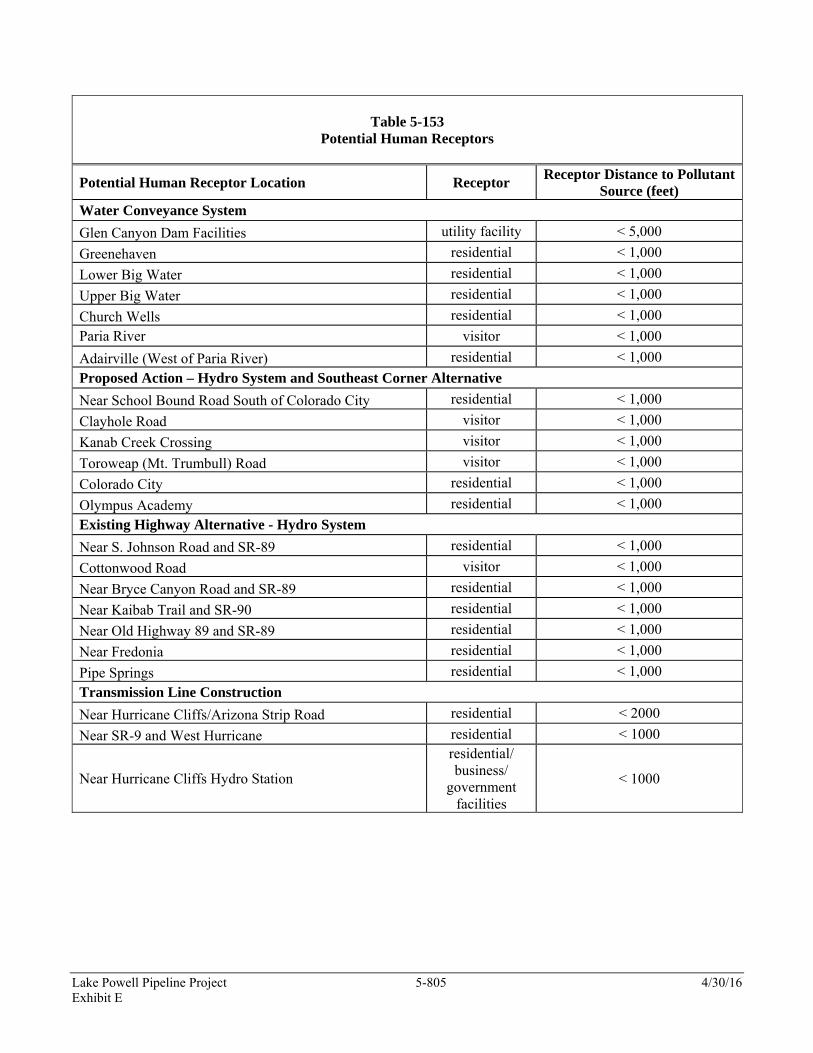
Air pollutant levels would be considered to have a significant effect on human receptors if they are above NAAQS levels. Potential human receptors are defined as persons in the area that could potentially receive or be affected by the air pollutants generated by the LPP Project, such as persons working on construction sites, visitors, tourists, and local residents. The locations of potential human receptors are identified in Table 5-153. These receptors primarily include residents, although there are utilities and some businesses that could be affected.
Lake Powell Pipeline Project 5-805 4/30/16 Exhibit E
Table 5-153
Potential Human Receptors
Potential Human Receptor Location Receptor Receptor Distance to Pollutant
Source (feet) Water Conveyance System
Glen Canyon Dam Facilities utility facility < 5,000
Greenehaven residential < 1,000
Lower Big Water residential < 1,000
Upper Big Water residential < 1,000
Church Wells residential < 1,000
Paria River visitor < 1,000
Adairville (West of Paria River) residential < 1,000
Proposed Action – Hydro System and Southeast Corner Alternative
Near School Bound Road South of Colorado City residential < 1,000
Clayhole Road visitor < 1,000
Kanab Creek Crossing visitor < 1,000
Toroweap (Mt. Trumbull) Road visitor < 1,000
Colorado City residential < 1,000
Olympus Academy residential < 1,000
Existing Highway Alternative - Hydro System
Near S. Johnson Road and SR-89 residential < 1,000
Cottonwood Road visitor < 1,000
Near Bryce Canyon Road and SR-89 residential < 1,000
Near Kaibab Trail and SR-90 residential < 1,000
Near Old Highway 89 and SR-89 residential < 1,000
Near Fredonia residential < 1,000
Pipe Springs residential < 1,000
Transmission Line Construction
Near Hurricane Cliffs/Arizona Strip Road residential < 2000
Near SR-9 and West Hurricane residential < 1000
Near Hurricane Cliffs Hydro Station
residential/ business/
government facilities
< 1000
Lake Powell Pipeline Project 5-806 4/30/16 Exhibit E
5.3.17.2.1.2 Wildlife Receptors.
Effects of air quality on wildlife are difficult to quantify as most studies pertain to air pollution effects on human receptors; therefore, it is assumed that significant effects on humans would be significant effects on wildlife in the area of potential effect.
It is anticipated that most large wildlife would temporarily abandon the areas near construction sites because of the general disturbance of construction activities, and wildlife would not be affected by construction emissions.
The construction is temporary in nature with pipeline and penstock construction near most areas being completed within several weeks. Any wildlife that temporarily disperse away from construction areas are expected to return back into the area following construction completion, and are not expected to be significantly affected by potential air pollutants.
Potential Effects Eliminated From Further Analysis.
The following potential effects were deleted from further analysis:
Facility operations involving electric power supplied from transmission lines were eliminated from further analysis because they would not generate measurable air quality pollutants.
Pollutants generated by operations vehicles are unlikely to be measurable because of the infrequent nature of facility inspection visits and maintenance during facility operations. These potential air quality effects are not analyzed further.
Effects from ozone were eliminated because: 1) the area of potential effect is in an attainment area, and 2) ozone is uniquely formed from precursor compounds (volatile organic compounds and nitrogen oxides) that are emitted. A photochemical reaction occurs after an emission creates ozone, often several hours later. Ozone would likely form several miles downwind of the source and would be dispersed below NAAQS limits by the time it could form.
Annual effects from pipeline construction sources were eliminated from further analysis. Temporary direct effects are considered in the effects analysis because the pipeline, penstocks and transmission line construction locations would constantly change.
Particulate matter resulting from blasting was eliminated because each blast is a one-time emission, with substantial time periods between blasts. Most dust generated by blasts settles within or just outside the blast zone. Typically very little PM10 remains suspended from bedrock blasting.
Short-term exposure of construction personnel and persons in the area from construction emissions would not create effects on human health in the immediate construction area because of the temporary nature of the construction activities and the accomplishment of work in accordance within OSHA guidelines. Most potential human receptors would be indoors and not potentially affected. Exposure of construction workers and persons in the immediate area to emissions as an air quality effect was eliminated from further consideration.
NAAQS exceedances are possible but if standards are exceeded within the general construction boundary it is not considered a violation but a construction safety issue. If exceedances extend beyond the construction boundary then additional mitigation measures would be needed. After mitigation measures are applied and the air quality still does not meet NAAQS standards, this would be considered an unavoidable effect.
Air quality emissions and potential construction night lighting within the LPP Project area would not interfere with any national parks for starry night observations.
Lake Powell Pipeline Project 5-807 4/30/16 Exhibit E
Air Quality Effects.
The direct and indirect air quality effects of the Proposed Action and alternatives are described in the following sections.
5.3.17.2.3.1 Proposed Action.
The Proposed Action from the water intake system to The Cockscomb would be aligned near several residential areas and could temporarily affect human receptors during construction. Most residential areas are outside the pollutant dispersion zone and would not be measurably affected. Residents living within the dispersion zone could be temporarily affected from pollutant levels above NAAQS, but these direct effects would be mitigated by implementing the protection and mitigation measures. In addition, many of the NAAQS are based on annual mean values or other averaged values, thereby reducing the effect of temporary construction emissions. Wildlife receptors in the area of potential effect are expected to temporarily disperse into surrounding areas and would not be measurably affected by LPP Project emissions. Wildlife resources are expected to return to the constructed areas following construction completion.
Residential areas were not identified along the Proposed Action from The Cockscomb to GSENM west boundary and from the Shinarump Cliffs to the intersection of Yellowstone Road with Highway 389; therefore, human receptors would not be affected by construction emissions along this penstock alignment. Wildlife receptors in the area are expected to temporarily disperse and would not be measurably affected by LPP Project construction emissions. Wildlife resources are expected to return to the constructed areas following construction completion.
The Proposed Action penstock alignment from the Yellowstone Road-Highway 389 intersection to Sand Hollow Reservoir includes several rural residential areas. Residents could be temporarily affected from exposure to levels of pollutants above NAAQS, although significant effects are not expected because BMPs would be implemented to mitigate the direct air quality effects and most residential areas are outside of the pollutant dispersion zone. Those residential areas within the pollutant dispersion zone could be temporarily affected, but the direct air quality effects would be mitigated by implementing protection and mitigation measures. In addition, many of the NAAQS are based on annual mean values or other averaged values, thereby reducing the effect of temporary construction emissions.
5.3.17.2.3.2 Existing Highway Alternative.
The Existing Highway Alternative construction air quality effects on sensitive receptors from the water intake system to The Cockscomb would be the same as described for the Proposed Action in Section 5.3.17.2.3.1.
Existing Highway Alternative construction air quality effects from The Cockscomb to the west GSENM boundary along Highway 89 would occur on wildlife receptors. The wildlife are expected to temporarily disperse to undisturbed habitat and would not be measurably affected by LPP Project construction emissions. Wildlife resources are expected to return to the constructed areas following construction completion.
The Existing Highway Alternative would be constructed near residential areas from GSENM west boundary to Fredonia and in the Pipe Springs area on the Kaibab-Paiute Indian Reservation. Residents could be temporarily affected from exposure to levels of pollutants above NAAQS, although significant effects are not expected because BMPs would be implemented to mitigate the direct air quality effects and most residential areas are outside of the pollutant dispersion zone. Those residential areas within the pollutant dispersion zone could be temporarily affected, but the direct air quality effects would be mitigated by implementing protection and mitigation measures. In addition, many of the NAAQS are based on annual mean values or other averaged values, thereby reducing the effect of temporary construction emissions. No significant air quality effects are expected to occur.
Lake Powell Pipeline Project 5-808 4/30/16 Exhibit E
The Existing Highway Alternative penstock alignment from the Yellowstone Road-Highway 389 intersection to Sand Hollow Reservoir includes several rural residential areas. Residents could be temporarily affected from exposure to levels of pollutants above NAAQS, although significant effects are not expected because BMPs would be implemented to mitigate the direct air quality effects and most residential areas are outside of the pollutant dispersion zone. Those residential areas within the pollutant dispersion zone could be temporarily affected, but the direct air quality effects would be mitigated by implementing protection and mitigation measures. In addition, many of the NAAQS are based on annual mean values or other averaged values, thereby reducing the effect of temporary construction emissions.
5.3.17.2.3.3 Southeast Corner Alternative.
The Southeast Corner Alternative construction air quality effects would be the same as described for the Proposed Action in Section 5.3.17.2.3.1.
5.3.17.2.3.4 Electrical Transmission Lines System.
The electrical transmission lines system would be aligned near several residential areas and direct effects on human and wildlife receptors would be similar to the Proposed Action effects near residential areas. Emissions from transmission line construction are not expected to be measurable because the temporary construction activities would disturb small land areas such as transmission tower bases, substation sites and access roads. Fugitive dust emissions from these small land areas would be controlled by implementing BMPs to minimize particulate matter generation and dispersion. No significant effects are expected to occur.
5.3.17.2.3.5 No Lake Powell Water Alternative.
Air quality would be affected by non-irrigated landscape construction activities resulting from eliminating outdoor residential irrigation as part of the No Lake Powell Water Alternative. Converting traditional residential landscapes to non-irrigated landscapes would increase the disturbed land area within residential communities in the St. George metropolitan area, potentially exposing residents to particulates dispersed by the wind during construction activities. The particulate concentrations could exceed NAAQS beyond dispersion zones, and could result in significant indirect air quality effects. These indirect effects may be partially mitigated by implementing BMPs; however, M&I water could not be used to control dust because the water would not be available for outdoor watering and dust control.
Air quality could be permanently affected by converting traditional residential landscapes to non-irrigated landscapes within the St. George metropolitan, resulting in increased airborne particulate matter generated from increased exposed soil areas. The particulate concentrations could occasionally exceed the NAAQS beyond dispersion zones during windstorms and affect human receptors, and could result in significant indirect air quality effects. The indirect effects could be partially mitigated by implementing BMPs, such as placing crushed stone or other natural materials over exposed soils; however, M&I water could not be used to control dust particles because the water would not be available for outdoor watering and dust control.
Additional power demand from the KCWCD No Lake Powell Water Alternative is likely negligible since this would involve pumping water from Kanab Creek watershed wells. However, the WCWCD would significantly increase power demand from the reverse osmosis water treatment facility, and the reduced power demand from decreasing outdoor culinary water use would not offset the new treatment power demand. The additional power demand is expected to be approximately 50 million kWh per year. This translates into additional emissions of 150 tons of SO2, 60 tons of NO2, 20 tons of CO, and 230 tons of particulate matter annually.
Lake Powell Pipeline Project 5-809 4/30/16 Exhibit E
5.3.17.2.3.6 No Action Alternative.
The No Action Alternative would not have any direct or indirect effects on air quality.
Air Quality Effects Resulting From Additional Power Demand.
Preliminary project design and meetings with local and regional power entities indicate that additional power generating facilities would not be needed to supply electricity for the LPP Project because there is currently enough power available to meet the projected power demands. The power required to pump water through the intake and the booster pump stations would be generated at existing power stations in Arizona and transmitted to the pump station sites. The proposed pumped storage hydro generating station at the Hurricane Cliffs would consume available electric power during off-peak hours to pump water into the forebay reservoir for storage and then release during peak demand hours to generate electricity; therefore, the LPP Project would not cause indirect air quality effects from new power generation emissions because new power generation facilities would not be needed.
5.3.17.3 Protection, Mitigation and Enhancement Measures
The direct and indirect air quality effects associated with the Proposed Action and alternatives would be caused by fugitive dust generated during construction activities and emissions from construction equipment. BMPs would be implemented to mitigate temporary air quality effects during construction to control fugitive dust and construction equipment emissions. The BMPs would help avoid or minimize direct and indirect air quality effects on human receptors. Persons and businesses near temporary construction activities would be notified of the construction efforts and potential short-term minor air quality and particulate matter effects.
LPP Project Air Quality Protection, Mitigation and Enhancement Measures.
Air emissions BMPs would be implemented for all construction activities, including pipeline and penstock construction, site-specific construction for pump stations and hydro stations, helicopter use for transmission line construction, and new and improved access roads. Mitigation of direct and indirect air quality effects caused by fugitive dust generated from construction activities would be accomplished using dust suppression methods such as physical coverings, spraying with water, or application of other liquid-based dust suppressants. Construction site restoration and revegetation would be performed as soon as feasible after the construction of pipeline, penstock and transmission line segments and site-specific pump stations and hydro stations has been completed. All dust suppression would be performed to meet federal, state and local requirements and according to standard construction practices. Mitigation of potential air quality effects caused by emitted pollutants would be accomplished by using construction equipment with diesel engines rated as Tier 3 or Tier 4 equipment, designed to control diesel combustion emissions.
Air quality monitoring would be performed during construction to make sure BMPs adequately mitigate temporary air quality effects from fugitive dust and construction equipment emissions. The temporary monitoring would be terminated after completing construction of pipeline, penstock and transmission line segments, site-specific pump stations and hydro stations, and construction use of improved access roads and staging areas.
No Lake Powell Water Alternative.
The indirect air quality effects resulting from the No Lake Powell Water Alternative could be partially mitigated by implementing BMPs including physical covers and other liquid-based dust suppressants throughout residential landscapes converted to non-irrigated landscapes. These mitigation measures are not expected to control all fugitive dust over the long-term and air quality effects from fugitive dust could continue to occur. Monitoring
Lake Powell Pipeline Project 5-810 4/30/16 Exhibit E
would be necessary to determine the effectiveness of dust suppression mitigation measures implemented on residential non-irrigated landscapes.
5.3.17.4 Cumulative Effects
Proposed Action.
The Proposed Action air quality effects would have no measurable cumulative effects when combined with the effects of the following actions:
• Colorado River Interim Guidelines for Lower Basin Shortages and Coordinated Operations for Lake Powell and Lake Mead EIS and ROD
• Operation of Glen Canyon Dam EIS and ROD
• Interim Surplus Criteria EIS and ROD
• Development and Implementation of a Protocol for High-Flow Experimental Releases from Glen Canyon Dam, Arizona, 2011 through 2020 EA
• Bureau of Reclamation and National Park Service LTEMP EIS
The Proposed Action would have short-term direct cumulative effects on air quality with the effects of the Southern Corridor Highway. The Proposed Action penstock would cross the Southern Corridor Highway through the future intersection of both alignments. The Proposed Action would have short-term indirect effects on air quality with the effects of the Southern Corridor Highway. Constructed areas reclaimed and planted for revegetation would be susceptible to wind erosion causing fugitive dust until the vegetation cover is established. The fugitive dust emissions from Proposed Action construction areas reclaimed and the Southern Corridor Highway construction areas reclaimed could combine near Sand Hollow Reservoir to cause increased fugitive dust emissions. These short-term cumulative effects could be moderate in the immediate area where the Proposed Action and Southern Corridor Highway intersect. Exceedances of the NAAQS particulate matter criteria are not expected.
Existing Highway Alternative.
The Existing Highway Alternative would have the same cumulative effects on air quality as described for the Proposed Action in Section 5.3.17.4.1.
Southeast Corner Alternative.
The Southeast Corner Alternative would have the same cumulative effects on air quality as described for the Proposed Action in Section 5.3.17.4.1.
No Lake Powell Water Alternative.
The No Lake Powell Water Alternative would have short-term and potential long-term direct cumulative effects on air quality with the effects of the Southern Corridor Highway. These cumulative effects would be most intense near the Washington Fields Diversion where the two actions would intersect at the sites of the No Lake Powell Water Alternative pump station, diversion pipeline, reverse osmosis water treatment facility, and Warner Valley Reservoir embankment dam. Fugitive dust could be generated from exposed soils from both projects that could locally exceed NAAQS particulate matter criteria.
Lake Powell Pipeline Project 5-811 4/30/16 Exhibit E
No Action Alternative.
The No Action Alternative would have no direct cumulative effects on air quality.
5.3.17.5 Unavoidable Adverse Effects
Proposed Action.
The Proposed Action would have minor short-term unavoidable adverse effects on air quality when fugitive dust emissions exceed NAAQS particulate matter criteria at the forebay reservoir construction site. Most of the fugitive dust would disperse to concentrations below the NAAQS particulate matter criteria within the construction site. These air quality effects would be short-term unavoidable adverse effects. Construction equipment emissions below the NAAQS criteria would have minimal short-term unavoidable adverse effects on air quality.
Existing Highway Alternative.
The Existing Highway Alternative would have the same unavoidable adverse effects on air quality as described for the Proposed Action in Section 5.3.17.5.1.
Southeast Corner Alternative.
The Southeast Corner Alternative would have the same unavoidable adverse effects on air quality as described for the Proposed Action in Section 5.3.17.5.1.
No Lake Powell Water Alternative.
The No Lake Powell Water Alternative could result in periodic unavoidable adverse effects on air quality during high wind events. Fugitive dust not controlled by BMPs would be mobilized beyond dispersion zones and occasionally exceed NAAQS.
No Action Alternative.
The No Action Alternative would result in no unavoidable adverse effects on air quality.
5.3.17.6 References
AAQD (see Arizona Department of Environmental Quality, Air Quality Division)
Arizona Department of Environmental Quality (ADEQ). 2010. Scoping Notice – Lake Powell Pipeline Project. January 2010.
Arizona Department of Environmental Quality (ADEQ), Air Quality Division (AQD). 2010a. Personal communication between Wayne Bixler (ADEQ, AQD) and Nickolas Smith (MWH).
__________. 2010b. Personal communication between Debra Martinkovic (ADEQ, AQD) and Nickolas Smith (MWH).
__________. 2010c. Personal communication between Diane Arnst (ADEQ, AQD) and Nickolas Smith (MWH).
Lake Powell Pipeline Project 5-812 4/30/16 Exhibit E
__________. 2011. Arizona Applicable State Implementation Plan (http://www.azdeq.gov/environ/air/plan/index.html).
BLM (See U.S. Department of the Interior, Bureau of Land Management)
City of St. George, Utah (SGU). 2009. Personal communication between Bill Swensen (SGU) and Nickolas Smith (MWH).
Dieselnet. Undated. Nonroad Diesel Engines (http://www.dieselnet.com/standards/us/nonroad.php).
EPA (see U.S. Environmental Protection Agency)
Five County Association of Governments (FCAOG). 2010. Personal communication between Kenneth Sizemore (FCAOG) and Nickolas Smith (MWH).
Grelinger, M. A. 1988. Gap filling PM-10 emission factors for selected open area dust sources. EPA-450/4-88-003, US EPA, Research Triangle Park, North Carolina. 1988.
Intertribal Council of Arizona (ICA). 2010. Personal communication between Maureen King (ICA) and Nickolas Smith (MWH).
Jenbacher. (Jenbacher). 2011. Jenbacher 620 Genset Specification Sheets. October 2011
Kaibab Band of Paiute Indians. 1999. Comprehensive Cultural Ecology Ordinance of the Kaibab Band of Paiute Indians, April 1999
Kaibab Band of Paiute Indians. 2009. Personal communication between LeAnn Skrzynski and Nickolas Smith (MWH).
Kane County Planning and Zoning (KCP&Z). 2010. Personal communication between Gary Smith (KCP&Z) and Nickolas Smith (MWH).
Meteorological Solutions Inc. (MSI). 2011. Emission Inventory Development and Dispersion Modeling Results for Montgomery Watson Harza Lake Powell Pipeline Project (Rev 3), December 2011
Miratech Corporation (Miratech). 2011. SCR Proposal Number OPI-11-1549 Rev (2), November 14, 2011
Mohave County Department of Public Health (MCDPH). 2010. Personal communication between Rachel Patterson (MCDPH) and Nickolas Smith (MWH).
MWH. 2009. Lake Powell Pipeline Wind Measurement Field Data, collected by Brian Liming July 21-24, 2009.
NPS (see U.S. Department of the Interior, National Park Service)
SGU (see City of St. George, Utah)
Southern Utah Air Quality Task Force (SUAQTF). 2009. Air Quality Regulations. September 2009.
UDAQ (see Utah Department of Environmental Quality, Division of Air Quality)
U.S. Code (U.S.C.). 2010. Clean Air Act. Title 42 U.S. Code, Sec. 7401.
Lake Powell Pipeline Project 5-813 4/30/16 Exhibit E
U.S. Congress. 1998. Public Law 105-355. Title II – Grand Staircase-Escalante National Monument. Section 202, Utility Corridor Designation, U.S. Route 89, Kane County, Utah. November 6, 1998.
U.S. Department of the Interior, Bureau of Land Management (BLM). 2008. Kanab Field Office Record of Decision and Approved Resource Management Plan. October 2008.
__________. 2009. Personal communication between Verlin Smith (BLM – Utah State Office) and Nickolas Smith (MWH).
U.S. Department of the Interior, National Park Service (NPS). 2006. Management Policies. U.S. Department of the Interior, National Park Service, Washington, DC: U.S. Government Printing Office.
__________. 2010. Personal communication between Debbie Miller (NPS) and Nickolas Smith (MWH).
U.S. Environmental Protection Agency (EPA). 1995. Compilation of air pollutant emission factors, AP-42, fifth edition, volume I: stationary point and area sources. NTIS Stock Number 055-000-00500-1. Washington, D.C.: Government Printing Office.
__________. 2016. National Ambient Air Quality Standards Table. https://www.epa.gov/criteria-air-pollutants/naaqs-table. Washington, D.C. Accessed March 2016.
Utah Division of Air Quality (UDEQ). 2011. Background Concentrations by County. May 2011
__________. 1997. Emission Standards Reference Guide for Heavy-Duty and Nonroad Engines. September 1997.
__________. 2005. Federal Register 40 CFR Part 51. November 2005.
__________. 2008. National Ambient Air Quality Standards (NAAQS). October 2008.
__________. 2009. Region 9 Federal Class 1 Areas – Air Quality Maps (http://www.epa.gov/region09/air/maps/r9_clss1.html). February 17, 2009.
__________. 2011. EPA Health and Environment (http://www.epa.gov/particles/health.html). March 16, 2011.
Utah Department of Environmental Quality (UDEQ), Division of Air Quality (DAQ). 2007. Area Designation Recommendation for the 2006 PM2.5 NAAQS.
__________. 2010a. Small Source Exemption. June 2010.
__________. 2010b. Personal communication between Regg Olsen (UDEQ, DAQ) and Nickolas Smith (MWH).
__________. 2011a. Dust Control and the Aggregate Industry (http://www.airquality.utah.gov/Permits/dust/index.htm). February 2, 2011.
__________. 2011b. Air Quality Data (http://www.airmonitoring.utah.gov/). January 31, 2011.
__________. 2011c. State Implementation Plan (http://www.airquality.utah.gov/Planning/SIP/index.htm). February 1, 2011.
Utah Division of Water Resources (UDWRe). 2009. Municipal and Industrial Water Supply and Uses in the Kanab Creek/Virgin River Basin (Data Collected for Calendar Year 2005). January 2009.
Lake Powell Pipeline Project 5-814 4/30/16 Exhibit E
__________. 2016. Lake Powell Pipeline Project, Final Water Needs Assessment. Prepared by MWH Americas, Inc. for Utah Division of Water Resources. April 2016.
Western Regional Climate Center (WRCC). 2006. Average Wind Speeds by State 1996- 2006, Average Wind Direction by State 1992-2002 (http://www.wrcc.dri.edu/CLIMATEDATA.html).