Vit D Chart booklet may2016
53
GrassrootsHealth Moving Research into Practice Moving Research into Practice www.grassrootshealth.net Garland, C.F., French, C.B., Baggerly, Leo L., Heaney, Rorbert P., (2011) Vitamin D Supplement Doses and Serum 25-Hydroxyvitamin D in the Range Associated with Cancer Prevention. ANTICANCER RESEARCH 31: 617-622. Serum Level vs Intake Vitamin D
-
Upload
ja-larson -
Category
Health & Medicine
-
view
22 -
download
0
Transcript of Vit D Chart booklet may2016

GrassrootsHealthMoving Research into Practice
Moving Research into Practice
www.grassrootshealth.net
Garland, C.F., French, C.B., Baggerly, Leo L., Heaney, Rorbert P., (2011) Vitamin D Supplement Doses and Serum 25-Hydroxyvitamin D in the Range Associated with Cancer Prevention. ANTICANCER RESEARCH 31: 617-622.
Serum Level vs Intake
Vitamin D

Moving Research into PracticeMay 2016
Ahepa University HospitalThessaloniki ,GreeceKalliopi Kotsa, MD, Ph.D.Spyridon Karras , MD, Ph.D.
Baxter InternationalMathew Mizwicki, Ph.D.
Boston University School of MedicineMichael F. Holick, Ph.D., M.D.
Creighton UniversityRobert P. Heaney, M.D. †Joan M. Lappe, Ph.D., R.N.
Emory UniversityVin Tangpricha, M.D., Ph.D.
Harvard UniversityCarlos A. Camargo, Jr., M.D., Dr. P.H.Edward Giovannucci, M.D., ScD.Walter C. Willett, Dr. P.H., M.D.
Inova Comprehensive Cancer and Research InstituteDonald L. Trump, M.D.
Institute VitaminDeltaRaimund von Helden, M.D.
McGill UniversityJohn H. White, Ph.D.
Medical University of Graz, AustriaStefan Pilz, M.D.
Medical University of South CarolinaBruce W. Hollis, Ph.D.Carol L. Wagner, M.D.
Mt. San Jacinto CollegeLaura P. Schoepf, Ph.D.
National Center for Global Health and MedicineTetsuya Mizoue, M.D., Ph.D.
Oregon State University, Linus Pauling InstituteAdrian F. Gombart, Ph.D.
Roswell Park Cancer InstituteCandace Johnson, Ph.D.
Royal National Orthopaedic Hospital, United KingdomBenjamin Jacobs, M.D.
Society For Medical Information and PreventionJoerg Spitz, M.D.
Sunlight, Nutrition and Health Research CenterWilliam B. Grant, Ph.D.
University of Albany - SUNYJoEllen Welsh, Ph.D.
University of AlbertaGerry Schwalfenberg, M.D., CCFP
University of Angers, FranceCedric Annweiler, M.D., Ph.D.
University of AucklandRobert Scragg, M.D., Ph.D.
University of BirminghamMartin Hewison, Ph.D.
University of California DavisBruce D. Hammock, Ph.D.Hari A. Reddy, Ph.D.Ray Rodriguez, Ph.D.
University of California Los AngelesJohn Adams, M.D.Milan Fiala, M.DH. Phillip Koeffler, M.D.Keith C. Norris, M.D.
University of California RiversideAnthony W. Norman, Ph.D.
University of California San DiegoRichard L. Gallo, M.D., Ph.D.Cedric F. Garland, Dr. P.H.Frank C. Garland, Ph.D. †Edward D. Gorham, Ph.D.Tissa Hata, M.D.
University of California San FranciscoDavid Gardner, M.S., M.D.Bernard P. Halloran, Ph.D.
University of SaskatchewanSusan J. Whiting, Ph.D.
University of Toronto, Mt Sinai HospitalReinhold Vieth, Ph.D.
Vienna Medical UniversityHeidi S. Cross, Ph.D.
Vitamin D CouncilJohn J. Cannell, M.D.
Wismar University of Applied SciencesAlexander Wunsch, M.D
International Scientists Panel
A Scientists’ Call to Action has been issued to alert the public to the importance to have vitamin D serum levels between 40 and 60 nanograms/milliliter (100-150 nanomoles/liter) to prevent these diseases. Implementing this level is safe and inexpensive.
The benefit of an adequate vitamin D level to each individual will be better overall health and a reduction in illnesses and, ultimately, a significant reduction in health care costs. The benefit of adequate vitamin D levels to society/businesses is a more productive workforce and, lower health care costs.
The D*action project has as its purpose to serve as a model for public health action on vitamin D. It is a test bed for techniques, and for providing outcome evaluation at a community level.
Revised 10/16/15
It is projected that the incidence of many of these diseases could be reduced by 20%-50% or more, if the occurrence of vitamin D deficiency and insufficiency were eradicated by increasing vitamin D intakes through increased UVB exposure, fortified foods or supplements. The appropriate intake of vitamin D required to effect a significant disease reduction depends on the individual’s age, race, lifestyle, and latitude of residence. The latest Institute of Medicine (IOM) report, 2010, indicates 10,000 IU/day is considered the NOAEL (no observed adverse effect level). 4000 IU/day can be considered a safe upper intake level for adults aged 19 and older.
It is well documented that the darker the skin, the greater the probability of a vitamin D deficiency. Even in southern climates, 55% of African Americans and 22% of Caucasians are deficient.
More than 1 billion people worldwide are affected at a tremendous cost to society.
40-75% of the world’s population is vitamin D deficient.
The causal link between severe vitamin D deficiency and rickets or the bone disease of osteomalacia is overwhelming, while the link between vitamin D insuffiency and osteoporosis with associated decreased muscle strength and increased risk of falls in osteoporotic humans is well documented by evidence-based intervention studies.
There are newly appreciated associations between vitamin D insufficiency and many other diseases, including tuberculosis, psoriasis, multiple sclerosis, inflammatory bowel disease, type-1 diabetes, high blood pressure, increased heart failure, myopathy, breast and other cancers which are believed to be linked to the non-calcemic actions of the parent vitamin D and its daughter steroid hormone.
Based on the evidence we now have at hand, action is urgent.
Scientists’ Call to D*action The Vitamin D Deficiency Epidemic
315 S. Coast Hwy 101, U-87, Encinitas, CA 92024www.grassrootshealth.net

GrassrootsHealthMoving Research into Practice
Dosing
www.grassrootshealth.net
Section 1

www.grassrootshealth.netGrassrootsHealth
Moving Research into Practice
Moving Research into PracticeMay 2016
Disease Incidence Prevention by Serum 25(OH)D Level Select Clinical Trials and Epidemiological Studies
Results from multiple studies regarding the association between 25(OH)D and various diseases were summarized according to a common reference level of 25 ng/ml, the average concentration in the US population.
The percent reductions represent what can be expected in the general population if concentrations were raised to the concentrations specified on the chart.
There were significant reductions in disease risk with increasing 25(OH)D concen-trations, especially at 40 ng/ml and above.
Chart Date: 3/23/10 ©2016 GrassrootsHealth.
Disease Incidence Prevention by Serum 25(OH)D LevelSerum 25(OH)D, ng/ml 6 8 10 12 14 16 18 20 22 24 26 28 30 32 34 36 38 40 42 44 46 48 50 52 54 56 58 60 62 64 66 68
Studies of Individuals
Cancers, all combined
Breast Cancer X X X X X X X XOvarian Cancer
Colon Cancer X X X XNon-Hodgkins Lymphoma
Type 1 Diabetes
Fractures, all combined
Falls, women
Multiple Sclerosis X X XHeart Attack (Men)
Natural Experiments
Kidney Cancer
Endometrial Cancer
Rickets
X X X
X X X X
72%
50%99%
37%
23% 49%
12% 17%
25% 66%
25%
12% 18%
31% 38% 60%
77% with calcium
Legend:All percentages reference a common baseline of 25 ng/ml as shown on the chart.%’s reflect the disease prevention % at the beginning and ending of available data. Example: Breast cancer incidence is reduced by 30% when the serum level is34 ng/ml vs the baseline of 25 ng/ml. There is an 83% reduction in incidence when the serum level is 50 ng/ml vs the baseline of 25 ng/ml. The x’s in the bars indicate ‘reasonable extrapolations’ from the data but are beyond existing data.
References:All Cancers: Lappe JM, et al. Am J Clin Nutr. 2007;85:1586-91. Breast: Garland CF, Gorham ED, Mohr SB, Grant WB, Garland FC. Breast cancer risk accordingto serum 25-Hydroxyvitamin D: Meta-analysis of Dose-Response (abstract).American Association for Cancer Research Annual Meeting, 2008. Reference serum 25(OH)D was 5 ng/ml. Garland, CF, et al. Amer Assoc Cancer Research Annual Mtg, April 2008,. Colon: Gorham ED, et al. Am J Prev Med. 2007;32:210-6. Diabetes: Hyppönen E, et al. Lancet 2001;358:1500-3. Endometrium: Mohr SB, et al. Prev Med. 2007;45:323-4. Falls: Broe KE, et al. J Am Geriatr Soc. 2007;55:234-9. Fractures: Bischoff-Ferrari HA, et al. JAMA. 2005;293:2257-64. Heart Attack: Giovannucci et al. Arch Intern Med/Vol 168 (No 11) June 9, 2008. Multiple Sclerosis: Munger KL, et al. JAMA. 2006;296:2832-8. Non-Hodgkin’s Lymphoma: Purdue MP, et al. Cancer Causes Control. 2007;18:989-99. Ovary: Tworoger SS, et al. Cancer Epidemiol Biomarkers Prev. 2007;16:783-8. Renal: Mohr SB, et al. Int J Cancer. 2006;119:2705-9. Rickets: Arnaud SB, et al. Pediatrics. 1976 Feb;57(2):221-5.
33% 54%46%
Seru
m R
efer
ence
Lev
el
Chart prepared by: Garland CF, Baggerly CA
Copyright GrassrootsHealth, 03/23/10 www.grassrootshealth.net
30% 83%
50%
30%
X X X X X X X X
40-60 ng/ml suggested range
Serum Level1
Only Rickets Prevented at 20 ng/ml
2
40-60 ng/ml to Prevent Majority of Diseases
3
1.1
www.grassrootshealth.netGrassrootsHealth
Moving Research into Practice
Moving Research into PracticeMay 2016
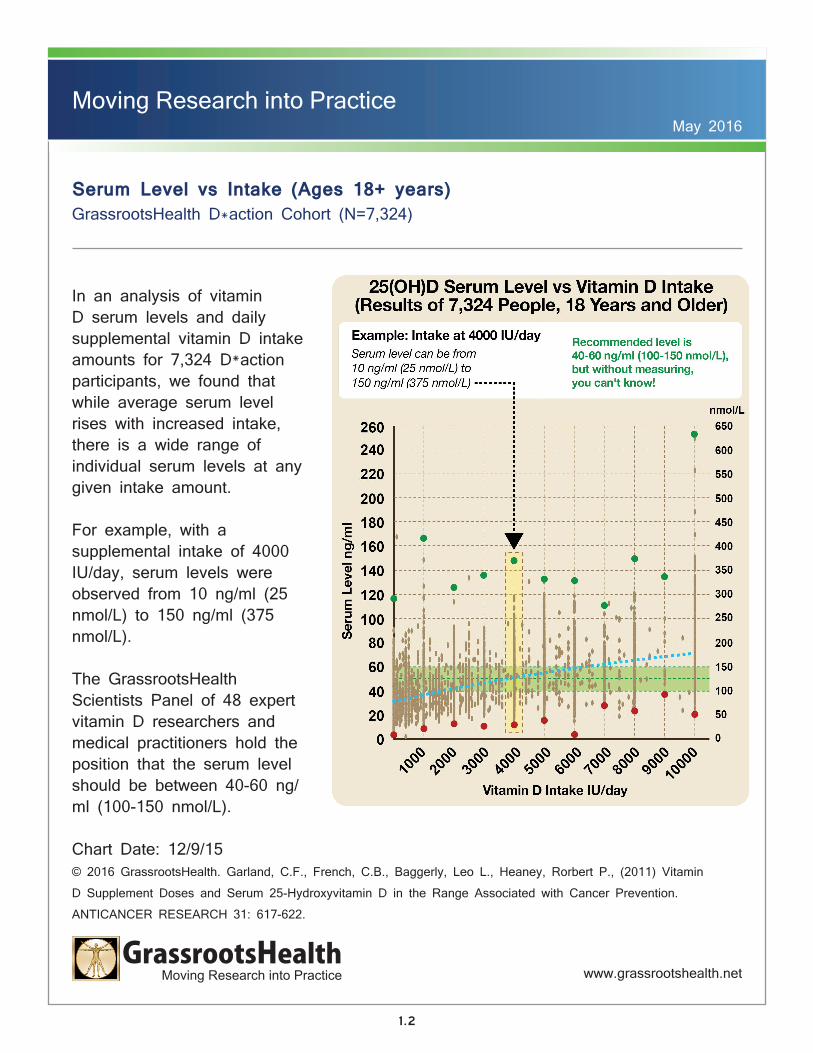
Serum Level vs Intake (Ages 18+ years)GrassrootsHealth D*action Cohort (N=7,324)
In an analysis of vitamin D serum levels and daily supplemental vitamin D intake amounts for 7,324 D*action participants, we found that while average serum level rises with increased intake, there is a wide range of individual serum levels at any given intake amount.
For example, with a supplemental intake of 4000 IU/day, serum levels were observed from 10 ng/ml (25 nmol/L) to 150 ng/ml (375 nmol/L).
The GrassrootsHealth Scientists Panel of 48 expert vitamin D researchers and medical practitioners hold the position that the serum level should be between 40-60 ng/ml (100-150 nmol/L).
Chart Date: 12/9/15© 2016 GrassrootsHealth. Garland, C.F., French, C.B., Baggerly, Leo L., Heaney, Rorbert P., (2011) Vitamin D Supplement Doses and Serum 25-Hydroxyvitamin D in the Range Associated with Cancer Prevention. ANTICANCER RESEARCH 31: 617-622.
1.2
www.grassrootshealth.netGrassrootsHealth
Moving Research into Practice
Moving Research into PracticeMay 2016
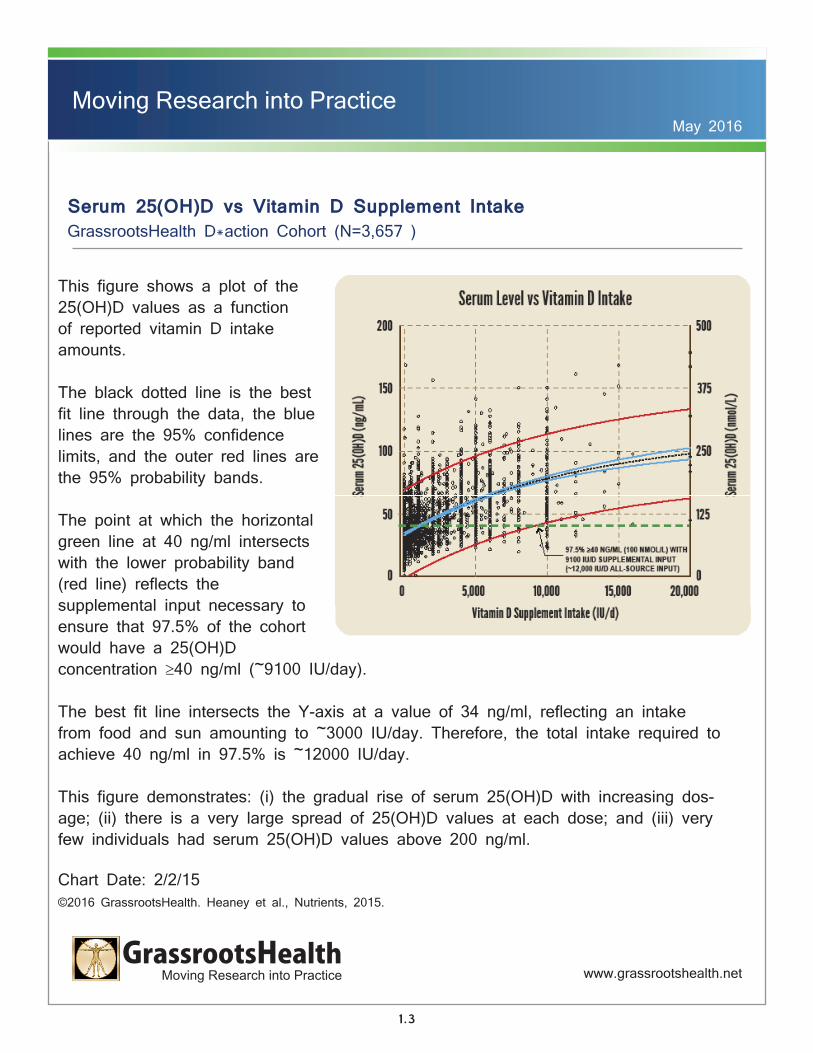
This figure shows a plot of the 25(OH)D values as a function of reported vitamin D intake amounts. The black dotted line is the best fit line through the data, the blue lines are the 95% confidence limits, and the outer red lines are the 95% probability bands.
The point at which the horizontal green line at 40 ng/ml intersects with the lower probability band (red line) reflects the supplemental input necessary to ensure that 97.5% of the cohort would have a 25(OH)D concentration ≥40 ng/ml (~9100 IU/day).
The best fit line intersects the Y-axis at a value of 34 ng/ml, reflecting an intake from food and sun amounting to ~3000 IU/day. Therefore, the total intake required to achieve 40 ng/ml in 97.5% is ~12000 IU/day.
This figure demonstrates: (i) the gradual rise of serum 25(OH)D with increasing dos-age; (ii) there is a very large spread of 25(OH)D values at each dose; and (iii) very few individuals had serum 25(OH)D values above 200 ng/ml.
Chart Date: 2/2/15 ©2016 GrassrootsHealth. Heaney et al., Nutrients, 2015.
Serum 25(OH)D vs Vitamin D Supplement Intake GrassrootsHealth D*action Cohort (N=3,657 )
1.3

www.grassrootshealth.netGrassrootsHealth
Moving Research into Practice
Moving Research into PracticeMay 2016
Vitamin D Supplement Intake Per Pound vs. Serum 25(OH)D Concentration (Ages 18+ Years) GrassrootsHealth D*action Cohort (N= 7,324)
This figure shows a plot of the 25(OH)D values as a function of reported vitamin D intake amounts per pound. The blue dotted line is the best fit line through the data.
Shown on the figure are the percent of participants who are at or above 40, 60, and 100 ng/ml for various vitamin D supplement intake amounts.
1% or less of participants have serum levels ≥100 ng/ml with 40 IU/pound/day or less.
Chart Date: 12/1/15 ©2016 GrassrootsHealth.
0
20
40
60
80
100
120
140
160
180
200
0 10 20 30 40 50 60
Seru
m 25
(OH)
D (ng
/ml)
Vitamin D Intake (IU/pound/day)
Vitamin D Intake Per Pound vs. Serum 25(OH)D
43% ≥60 ng/ml with 35 IU/pound/day
www.grassrootshealth.net
< 1% ≥100 ng/ml with 35 IU/pound/day
84% ≥40 ng/ml with 35 IU/pound/day
5% ≥100 ng/mlwith 60 IU/pound/day
50% ≥60 ng/ml with 40 IU/pound/day
< 1% ≥100 ng/ml with 20 IU/pound/day
1% ≥100 ng/ml with 40 IU/pound/day
24% ≥60 ng/ml with 20 IU/pound/day
72% ≥60 ng/ml with 60 IU/pound/day
66% ≥40 ng/ml with 20 IU/pound/day
88% ≥40 ng/ml with 40 IU/pound/day
95% ≥40 ng/ml with 60 IU/pound/day
Demonstrated level at which toxicity may occur
1.4
www.grassrootshealth.netGrassrootsHealth
Moving Research into Practice
Moving Research into PracticeMay 2016
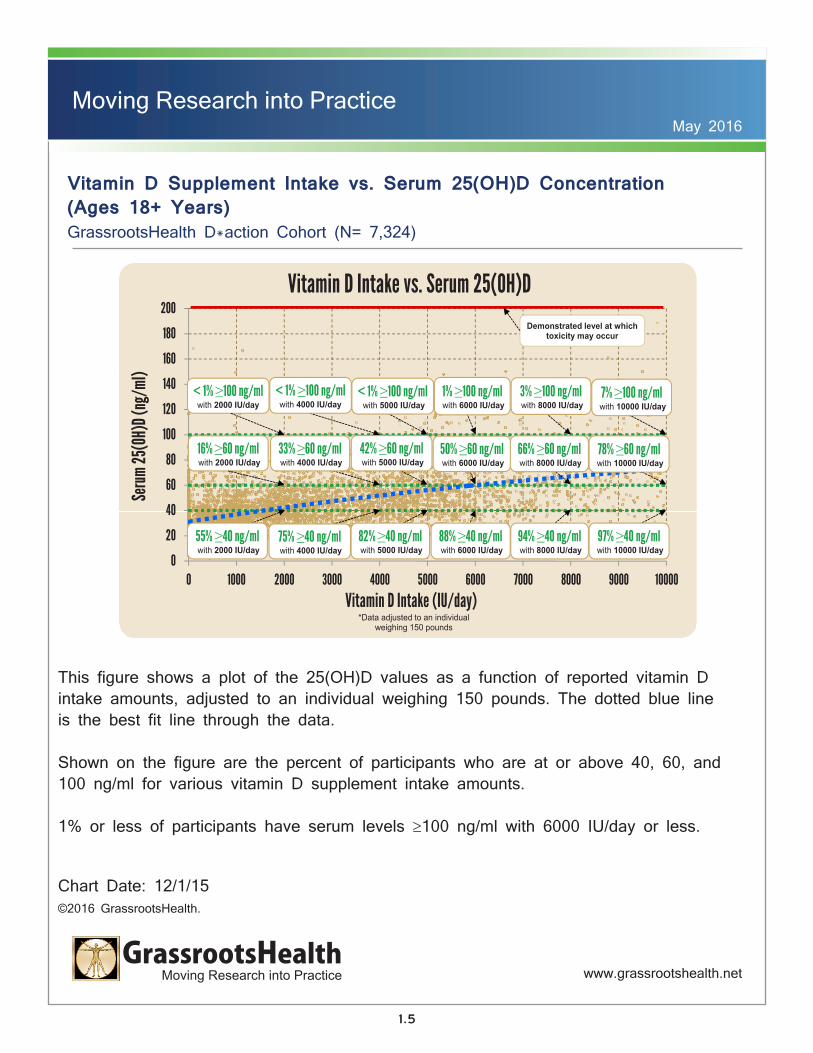
Vitamin D Supplement Intake vs. Serum 25(OH)D Concentration (Ages 18+ Years) GrassrootsHealth D*action Cohort (N= 7,324)
This figure shows a plot of the 25(OH)D values as a function of reported vitamin D intake amounts, adjusted to an individual weighing 150 pounds. The dotted blue line is the best fit line through the data.
Shown on the figure are the percent of participants who are at or above 40, 60, and 100 ng/ml for various vitamin D supplement intake amounts.
1% or less of participants have serum levels ≥100 ng/ml with 6000 IU/day or less.
Chart Date: 12/1/15 ©2016 GrassrootsHealth.
0
20
40
60
80
100
120
140
160
180
200
0 1000 2000 3000 4000 5000 6000 7000 8000 9000 10000
Seru
m 25
(OH)
D (ng
/ml)
Vitamin D Intake (IU/day)
Vitamin D Intake vs. Serum 25(OH)D
Chart Date 12/1/15 t h lth t
*Data adjusted to an individual weighing 150 pounds
16% ≥60 ng/mlwith 2000 IU/day
7% ≥100 ng/mlwith 10000 IU/day
3% ≥100 ng/mlwith 8000 IU/day
50% ≥60 ng/mlwith 6000 IU/day
55% ≥40 ng/mlwith 2000 IU/day
< 1% ≥100 ng/ml with 2000 IU/day
< 1% ≥100 ng/ml with 4000 IU/day
1% ≥100 ng/mlwith 6000 IU/day
33% ≥60 ng/mlwith 4000 IU/day
66% ≥60 ng/mlwith 8000 IU/day
78% ≥60 ng/mlwith 10000 IU/day
75% ≥40 ng/mlwith 4000 IU/day
88% ≥40 ng/mlwith 6000 IU/day
94% ≥40 ng/mlwith 8000 IU/day
97% ≥40 ng/mlwith 10000 IU/day
82% ≥40 ng/mlwith 5000 IU/day
42% ≥60 ng/mlwith 5000 IU/day
< 1% ≥100 ng/mlwith 5000 IU/day
Demonstrated level at which toxicity may occur
1.5

www.grassrootshealth.netGrassrootsHealth
Moving Research into Practice
Moving Research into PracticeMay 2016
Vitamin D Dose (IU) to Ensure 90% of Adults Achieve Specified 25(OH)D Concentration (Ages 18+ years)* GrassrootsHealth D*action Cohort (N=7,324)
Based on a plot of 25(OH)D values as a function of reported vitamin D intake amounts, the doses in this chart indicate the supplemental input (IU) necessary to ensure that 90% of the population would achieve the specified serum level increase (for an individual weighing 150 lbs, 68 kg).
Chart Date: 12/9/15 ©2016 GrassrootsHealth.
1.6
www.grassrootshealth.netGrassrootsHealth
Moving Research into Practice
Moving Research into PracticeMay 2016
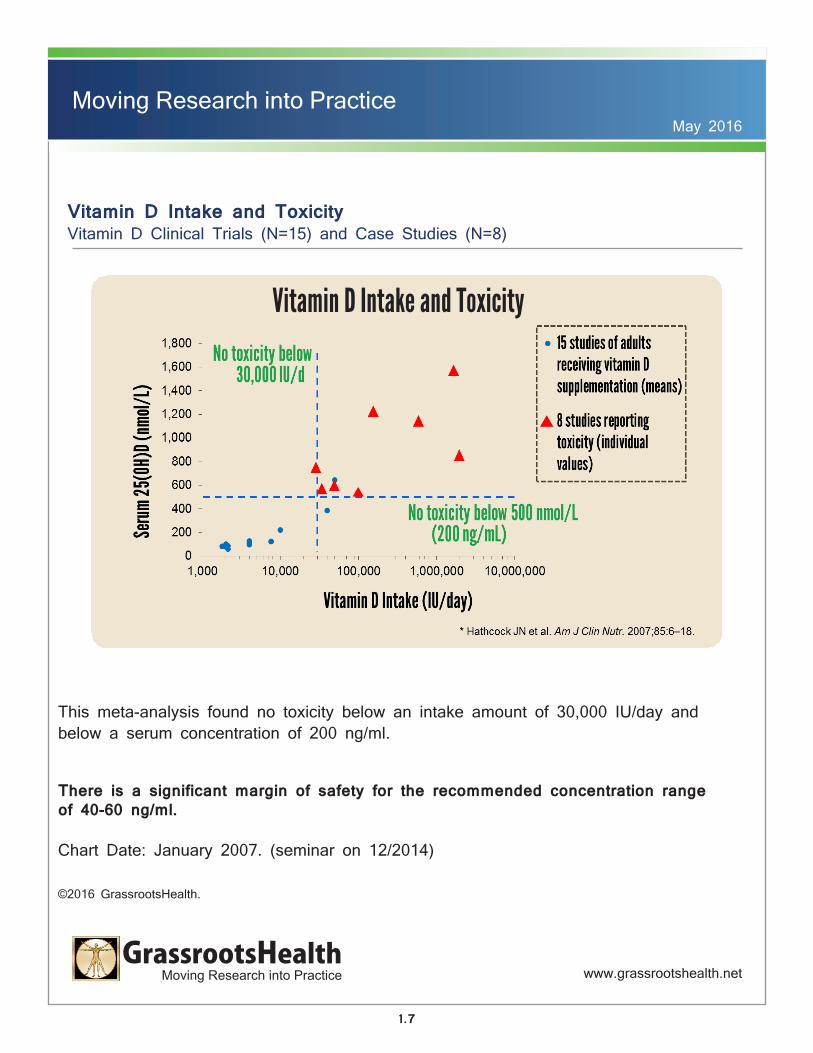
Vitamin D Intake and Toxicity Vitamin D Clinical Trials (N=15) and Case Studies (N=8)
This meta-analysis found no toxicity below an intake amount of 30,000 IU/day and below a serum concentration of 200 ng/ml.
There is a significant margin of safety for the recommended concentration range of 40-60 ng/ml.
Chart Date: January 2007. (seminar on 12/2014) ©2016 GrassrootsHealth.
Vitamin D Intake and Toxicity
1.7
GrassrootsHealthMoving Research into Practice
Pregnancy
www.grassrootshealth.net
Section 2

www.grassrootshealth.netGrassrootsHealth
Moving Research into Practice
Moving Research into PracticeMay 2016
Disease Incidence Prevention for Pregnancy Complications and Birth Outcomes Select Clinical Trials and Epidemiological Studies
Results from multiple studies regarding the association between 25(OH)D and pregnancy complications and birth outcomes were summarized according to a common reference level of 25 ng/ml, the average concentration in the US population.
The percent reductions represent what can be expected in the general population if concentrations were raised to the concentrations specified on the chart from 25 ng/ml.
There were significant reductions in adverse clinical outcomes related to pregnancy and childhood with increasing maternal 25(OH)D concentrations, especially at 40 ng/ml and above.
Chart Date: 2/1/15 ©2016 GrassrootsHealth.
Children
3
Pregnant Women
2
Disease Incidence Prevention - Pregnancyby Serum 25(OH)D Level
Serum 25(OH)D, ng/ml 16 18 20 22 24 26 28 30 32 34 36 38 40 42 44 46 48 50 52 54 56 58 60
Pregnant Women’s Outcomes
Preterm Birth1
Hypertensive Pregnancy Disorders1
Gestational Diabetes1
Bacterial Vaginosis1
Depression3
Impaired Muscle Strength2
Postpartum Depression2
Children’s Outcomes
Small for Gestational Age2
Common Cold (for baby)2
Ear Infection (for baby)2
Lung Inflammation (for baby)2
Asthma (for child)2
1Data from randomized controlled trial2Data from longitudinal study3Data from cross-sectional study
20%
43%
Seru
m R
efer
ence
Lev
el
Chart prepared by: Cuomo R, Aliano J, Baggerly C
39%
Legend:All percentages reference a common reference level of 25.0 ng/ml as shown on the chart. %’s reflect the disease prevention % at the beginning and ending of available data. Example: Gestational diabetes incidence is reduced by 11% when the serum level is 30.7 ng/ml vs the reference level of 25.0 ng/ml. There is a 33% reduction in incidence when the serum level is 41.9 ng/ml vs the reference level of 25.0 ng/ml.
References:Preterm Birth: Wagner CL, et al. 17th Workshop on Vitamin D; 2014 June 17-20. Hypertensive Pregnancy Disorders, Gestational Diabetes, and Bacterial Vaginosis: Wag-ner CL, et al. J Steroid Biochem Mol Biol. 2013;136:313-320. Depression: Huang JY, et al. J Womens Health. 2014;23(7):588-95. Impaired Muscle Strength: Kalliokoski P, et al. BMC Pregnancy Childbirth. 2013;13(237). Postpartum Depression: Gur EB, et al. Eur J Obstet Gynecol Reprod Biol. 2014;179:110-6. Small for Gestational Age: Gernand, AD, et al. Obstet Gynecol. 2014;123(1):40-8. Common Cold, Ear Infection, and Lung Inflammation: Shin YH, et al. Korean J Pediatr. 2013;56(10):439-445. Asthma: Magnus MC, et al. Paediatr Perinat Epidemiol. 2013;27(6).
100%
20%35%
24%
23%27%
28% 83%11%
23%
33%
67%
59%
40-60 ng/ml Recommended Range
4
Serum Level1
Copyright GrassrootsHealth, 02/1/15 www.grassrootshealth.net
2.1

www.grassrootshealth.netGrassrootsHealth
Moving Research into Practice
Moving Research into PracticeMay 2016
Fitted LOESS Curve of 25(OH)D Concentration within 6 Weeks of Delivery by Gestational Age (Weeks) at Birth NICHD & TRF Combined Cohort (N=509)
Using data from two supplementation trials conducted in South Carolina (NICHD and TRF), a plot of gestation week at birth as a function of 25(OH)D concentration with a fitted LOESS curve was constructed.
This figure shows a zoom on the fitted LOESS curve with confidence bounds showing gestational age at birth initially rising steadily with increasing 25(OH)D concentration and then plateauing at approximately 40 ng/ml.
After adjusting for race/ethnicity, maternal age, and insurance status, participants with 25(OH)D concentrations ≥40 ng/ml had a 59% lower risk of preterm birth than participants with concentrations ≤20 ng/ml.
Chart Date: 11/11/15 ©2016 GrassrootsHealth. Wagner et al. Post-hoc analysis of vitamin D status and reduced risk of preterm birth in two vitamin D pregnancy cohorts compared with South Carolina March of Dimes 2009–2011 rates. J Steroid Biochem Mol Biol, 2016. Jan;155(Pt B):245-51.
2.2
www.grassrootshealth.netGrassrootsHealth
Moving Research into Practice
Moving Research into PracticeMay 2016
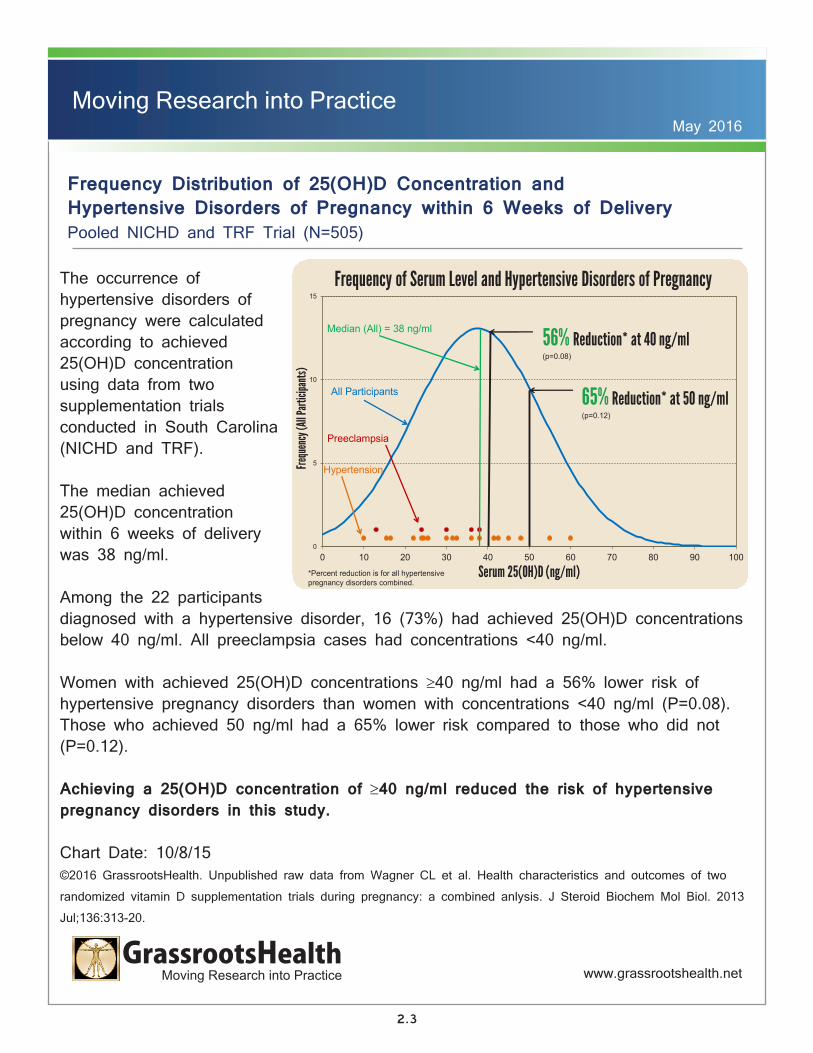
Frequency Distribution of 25(OH)D Concentration and Hypertensive Disorders of Pregnancy within 6 Weeks of Delivery Pooled NICHD and TRF Trial (N=505)
Frequency of Serum Level and Hypertensive Disorders of Pregnancy
0
5
10
15
0 10 20 30 40 50 60 70 80 90 100
Frequ
ency
(All P
artic
ipants
)
Serum 25(OH)D (ng/ml)
All Participants
Hypertension
56% Reduction* at 40 ng/ml (p=0.08)
Median (All) = 38 ng/ml
65% Reduction* at 50 ng/ml (p=0.12)
Preeclampsia
*Percent reduction is for all hypertensive pregnancy disorders combined.
The occurrence of hypertensive disorders of pregnancy were calculated according to achieved 25(OH)D concentration using data from two supplementation trials conducted in South Carolina (NICHD and TRF).
The median achieved 25(OH)D concentration within 6 weeks of delivery was 38 ng/ml.
Among the 22 participants diagnosed with a hypertensive disorder, 16 (73%) had achieved 25(OH)D concentrations below 40 ng/ml. All preeclampsia cases had concentrations <40 ng/ml.
Women with achieved 25(OH)D concentrations ≥40 ng/ml had a 56% lower risk of hypertensive pregnancy disorders than women with concentrations <40 ng/ml (P=0.08). Those who achieved 50 ng/ml had a 65% lower risk compared to those who did not (P=0.12).
Achieving a 25(OH)D concentration of ≥40 ng/ml reduced the risk of hypertensive pregnancy disorders in this study.
Chart Date: 10/8/15©2016 GrassrootsHealth. Unpublished raw data from Wagner CL et al. Health characteristics and outcomes of two randomized vitamin D supplementation trials during pregnancy: a combined anlysis. J Steroid Biochem Mol Biol. 2013 Jul;136:313-20.
2.3
www.grassrootshealth.netGrassrootsHealth
Moving Research into Practice
Moving Research into PracticeMay 2016
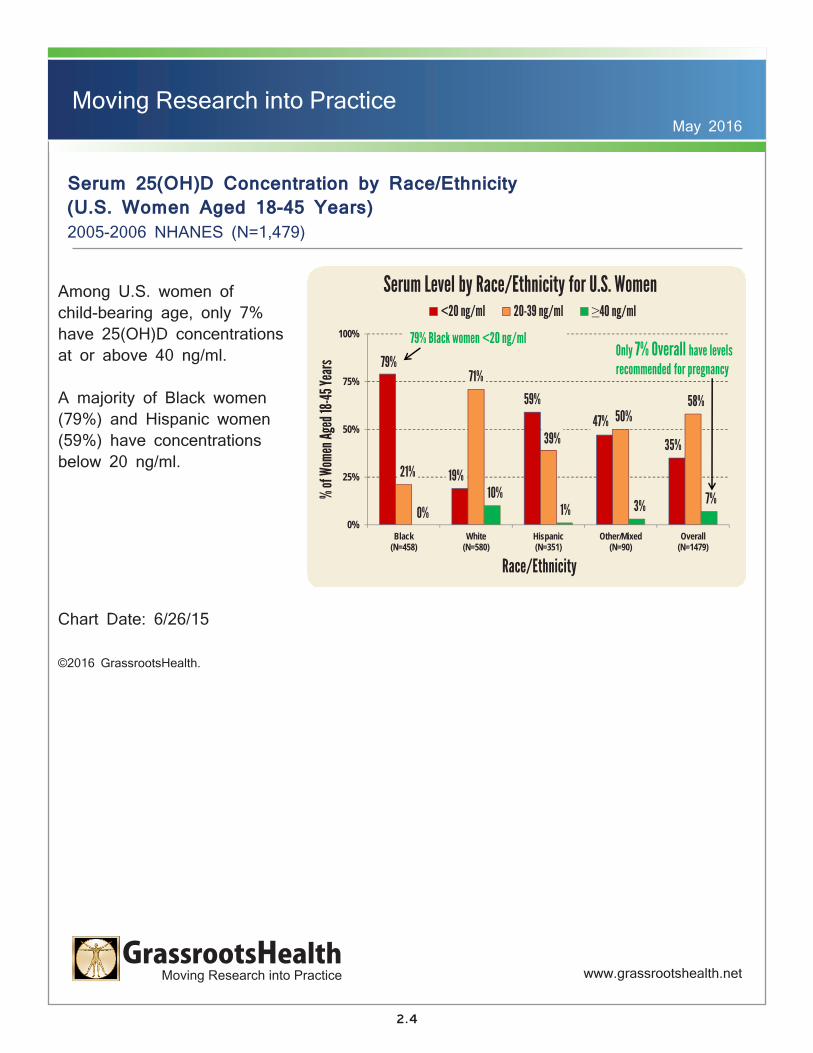
Serum 25(OH)D Concentration by Race/Ethnicity (U.S. Women Aged 18-45 Years) 2005-2006 NHANES (N=1,479)
Among U.S. women of child-bearing age, only 7% have 25(OH)D concentrations at or above 40 ng/ml.
A majority of Black women (79%) and Hispanic women (59%) have concentrations below 20 ng/ml.
Chart Date: 6/26/15 ©2016 GrassrootsHealth.
79%
19%
59%47%
35%
21%
71%
39%50%
58%
0%10%
1% 3% 7%
0%
25%
50%
75%
100%
Black(N=458)
White(N=580)
Hispanic(N=351)
Other/Mixed(N=90)
Overall(N=1479)
% of
Wome
n Age
d 18-4
5 Yea
rs
Race/Ethnicity
Serum Level by Race/Ethnicity for U.S. Women <20 ng/ml 20-39 ng/ml ≥40 ng/ml
79% Black women <20 ng/mlOnly 7% Overall have levels recommended for pregnancy
2.4

www.grassrootshealth.netGrassrootsHealth
Moving Research into Practice
Moving Research into PracticeMay 2016
Average Serum 25(OH)D Concentration by Gestation Weekand Treatment Group NICHD & TRF (N=509)
Using data from two supplementation trials conducted in South Carolina (NICHD and TRF), mean 25(OH)D concentrations were plotted by gestation week for the three vitamin D treatment groups: 400 IU/day, 2000 IU/day, and 4000 IU/day.
Average serum levels rose more quickly for the 4000 IU/day treatment group and ≥40 ng/ml was achieved within ~10 weeks.
Average serum levels did not reach and maintain ≥40 ng/ml for the 400 or 2000 IU/day treatment groups.
Chart Date: 9/2/15 ©2016 GrassrootsHealth. Unpublished raw data from Wagner CL et al. Health characteristics and outcomes of two randomized vitamin D supplementation trials during pregnancy: a combined anlysis. J Steroid Biochem Mol Biol. 2013 Jul;136:313-20.
20
25
30
35
40
45
50
12 16 20 24 28 32 36 40
Seru
m 25
(OH)
D (ng
/mL)
Gestation Week
Serum Level vs Gestation Week and Treatment GroupTarget: 40 ng/mL 400 IU 2000 IU 4000 IU
© 2015 GrassrootsHealth www.grassrootshealth.net
2.5
GrassrootsHealthMoving Research into Practice
Cancer
www.grassrootshealth.net
Section 3
www.grassrootshealth.netGrassrootsHealth
Moving Research into Practice
Moving Research into PracticeMay 2016
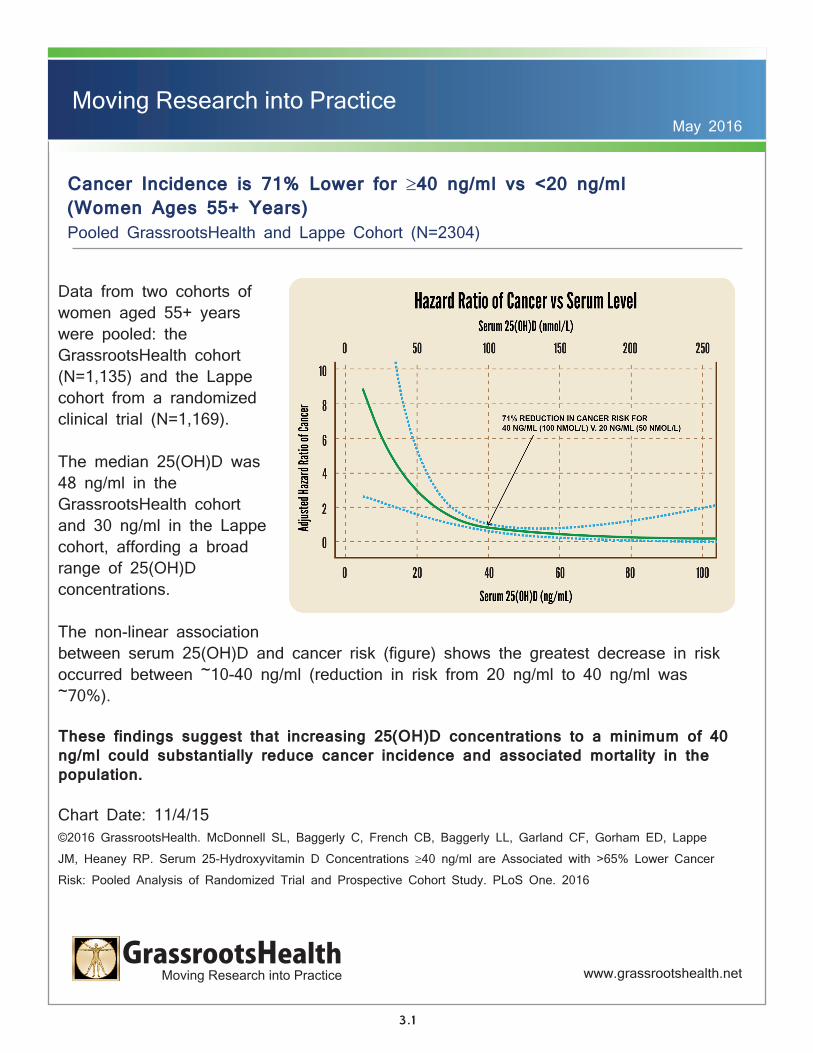
Cancer Incidence is 71% Lower for ≥40 ng/ml vs <20 ng/ml (Women Ages 55+ Years) Pooled GrassrootsHealth and Lappe Cohort (N=2304)
Data from two cohorts of women aged 55+ years were pooled: the GrassrootsHealth cohort (N=1,135) and the Lappe cohort from a randomized clinical trial (N=1,169).
The median 25(OH)D was 48 ng/ml in the GrassrootsHealth cohort and 30 ng/ml in the Lappe cohort, affording a broad range of 25(OH)D concentrations.
The non-linear association between serum 25(OH)D and cancer risk (figure) shows the greatest decrease in risk occurred between ~10-40 ng/ml (reduction in risk from 20 ng/ml to 40 ng/ml was ~70%).
These findings suggest that increasing 25(OH)D concentrations to a minimum of 40 ng/ml could substantially reduce cancer incidence and associated mortality in the population.
Chart Date: 11/4/15 ©2016 GrassrootsHealth. McDonnell SL, Baggerly C, French CB, Baggerly LL, Garland CF, Gorham ED, Lappe JM, Heaney RP. Serum 25-Hydroxyvitamin D Concentrations ≥40 ng/ml are Associated with >65% Lower Cancer Risk: Pooled Analysis of Randomized Trial and Prospective Cohort Study. PLoS One. 2016
3.1

www.grassrootshealth.netGrassrootsHealth
Moving Research into Practice
Moving Research into PracticeMay 2016
Frequency Distribution of 25(OH)D among Cases and Non-Cases of Breast Cancer (Women Aged 60+ Years)GrassrootsHealth D*action Cohort (N=844)
• 844 women at risk for breast cancer were followed prospectively for a median of 18 months.
• The median 25(OH)D concentration in this cohort was 50 ng/ml. • Five of these women reported being diagnosed with breast cancer during the
study period.• Four of the five cases had 25(OH)D concentrations below 50 ng/ml.• Those with concentrations ≥50 ng/ml had an 80% lower risk of breast cancer than
those with concentrations <50 ng/ml, adjusting for age and BMI.
These findings suggest that 25(OH)D concentrations above 50 ng/ml may provide additional benefit in the prevention of breast cancer.
Chart Date: 4/17/14
© 2016 GrassrootsHealth. McDonnell SL et al., 25(OH)D serum levels ≥50 ng/ml may provide additional reduction in breast cancer risk. American Society of Nutrition Conference. April 2014.
0
50
100
150
200
0 50 100 150 200
Median = 50 ng/mlNon-cases
Cases
80% Lower Risk at ≥50 ng/ml
Serum 25(OH)D ng/ml
Frequ
ency
Breast Cancer Cases vs Serum Level
3.2

www.grassrootshealth.netGrassrootsHealth
Moving Research into Practice
Moving Research into PracticeMay 2016
Non-Skin Cancer Cases in the GrassrootsHealth and Lappe Cohorts (Women Ages 55+ Years) GrassrootsHealth Cohort (N=1,135) and Lappe Cohort (N=1,169)
48 women in the Lappe cohort and 10 in the GrassrootsHealth cohort were diagnosed with cancer during the observation period.
The most common type of cancer was breast cancer.
Chart Date: 10/8/15 ©2016 GrassrootsHealth. McDonnell SL, Baggerly C, French CB, Baggerly LL, Garland CF, Gorham ED, Lappe JM, Heaney RP. Serum 25-Hydroxyvitamin D Concentrations ≥40 ng/ml are Associated with >65% Lower Cancer Risk: Pooled Analysis of Randomized Trial and Prospective Cohort Study. PLoS One. 2016
0 5 10 15 20
UrethralPancreatic
OvarianLaryngeal
ThyroidRenal
MyelomaUterine
LeukemiaLymphoma
ColonLung
Breast
Number of Cases Lappe (N=1169)GrassrootsHealth (N=1135)
Chart Date 10/8/15 © 2015 GrassrootsHealth Preliminary data, not yet published
www.grassrootshealth.net
Chart 1: Non-Skin Cancer Cases in GrassrootsHealth and Lappe Cohorts
3.3

www.grassrootshealth.netGrassrootsHealth
Moving Research into Practice
Moving Research into PracticeMay 2016
Non-Skin Cancer Incidence Rates: GrassrootsHealth vs. Lappe Cohorts (Women Ages 55+ Years) GrassrootsHealth Cohort (N=1,135) and Lappe Cohort (N=1,169)
Incidence rates of all non-skin cancers for the GrassrootsHealth cohort (median 25(OH)D = 48 ng/ml) and the Lappe cohort (median 25(OH)D = 30 ng/ml) were compared.
The incidence rate of cancer was 4.6 cases per 1,000 person-years in the GrassrootsHealth cohort and 11.3 cases per 1,000 person-years in the Lappe cohort (59% lower).
Chart Date: 10/1/15 ©2016 GrassrootsHealth. McDonnell SL, Baggerly C, French CB, Baggerly LL, Garland CF, Gorham ED, Lappe JM, Heaney RP. Serum 25-Hydroxyvitamin D Concentrations ≥40 ng/ml are Associated with >65% Lower Cancer Risk: Pooled Analysis of Randomized Trial and Prospective Cohort Study. PLoS One. 2016
11.3
4.6
0
5
10
15
Lappe(N=1169)
Median 25(OH)D = 30 ng/ml
D*action(N=1135)
Median 25(OH)D = 48 ng/ml
Incide
nce p
er 1,0
00 pe
rson-
year
s
Chart Date 10/1/15 © 2015 GrassrootsHealth Preliminary data, not yet published www.grassrootshealth.net
Chart 2: Non-Skin Cancer Incidence per 1,000 Person Years
59% Lower (p=0.005)
3.4

GrassrootsHealthMoving Research into Practice
Kidney Stones and Diabetes
www.grassrootshealth.net
Section 4

www.grassrootshealth.netGrassrootsHealth
Moving Research into Practice
Moving Research into PracticeMay 2016
Frequency Distribution of 25(OH)D among Cases and Non-Cases of Kidney StonesGrassrootsHealth D*action Cohort (N=2,012)
Of 2,012 D*action participants who had submitted at least two health questionnaires and vitamin D blood tests, 13 indicated an occurence of kidney stones after their first test.
Of the 13 cases, eight were below the median serum level of 50 ng/ml and five were above.
No association was found between serum 25(OH)D in the range of 20-100 ng/ml and incidence of kidney stones.
Individuals with a body mass index (BMI) of ≥ 30 had a 3-fold higher risk of developing kidney stones.
Chart Date: 10/1/13
© 2016 GrassrootsHealth. Nguyen, S., Baggerly, L.L., French, C., Heaney, R.P., Gorham, E.D., Garland, C.F. (2013) 25-Hydroxyvitamin D in the Range of 20 to 100 ng/mL and Incidence of Kidney Stones. American Journal of Public Health, online ahead of print, 10/17/2013.
4.1

www.grassrootshealth.netGrassrootsHealth
Moving Research into Practice
Moving Research into PracticeMay 2016
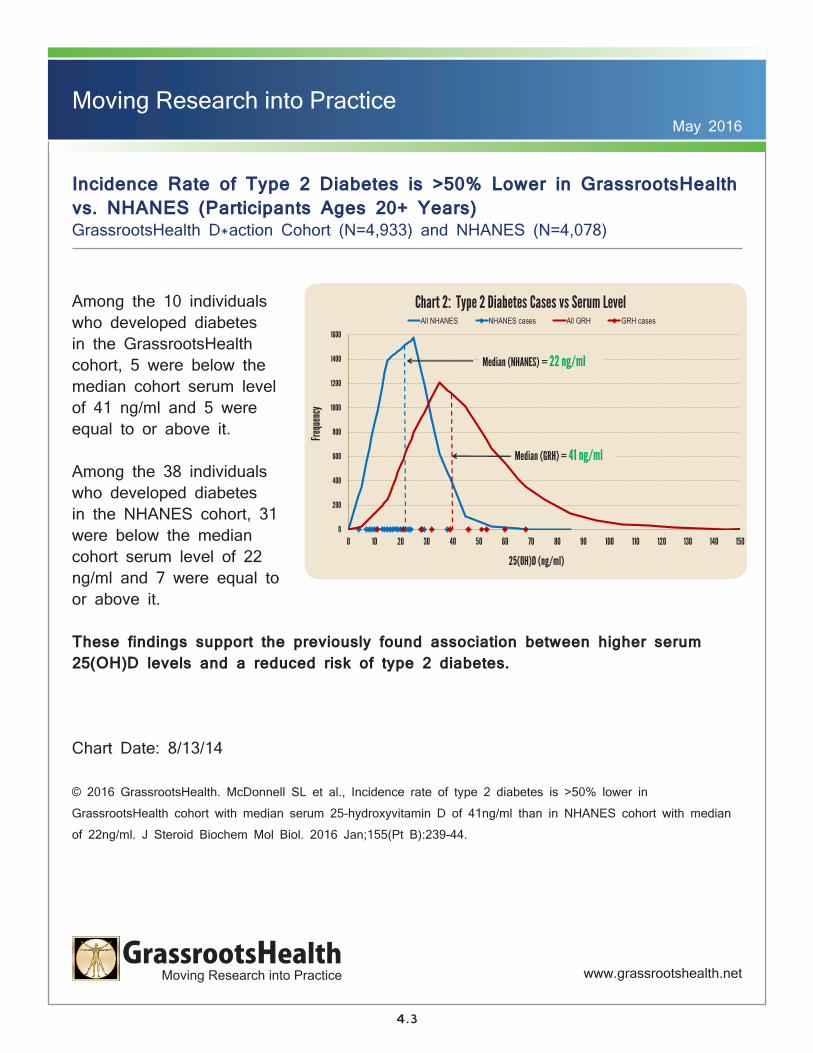
Incidence Rate of Type 2 Diabetes is >50% Lower in GrassrootsHealth vs. NHANES (Participants Ages 20+ Years) GrassrootsHealth (N=4,933) and NHANES (N=4,078)
This study compared incidence rates of type 2 diabetes among participants aged ≥20 years in two U.S. cohorts with markedly different median 25(OH)D concentrations.
The median 25(OH)D concentration in the GrassrootsHealth cohort was 41 ng/ml while in the 2005-6 NHANES it was 22 ng/ml.
The adjusted annual incidence rate of type 2 diabetes was 3.7 per 1,000 population in the GrassrootsHealth cohort, compared to 9.3 per 1,000 population in NHANES (60% lower).
Chart Date: 8/13/14 ©2016 GrassrootsHealth. McDonnell SL et al., Incidence rate of type 2 diabetes is >50% lower in GrassrootsHealth cohort with median serum 25-hydroxyvitamin D of 41ng/ml than in NHANES cohort with median of 22ng/ml. J Steroid Biochem Mol Biol. 2016 Jan;155(Pt B):239-44.
2.0 (95% CI = 1.0, 3.6)
9.3 (95% CI = 6.7, 12.6)
3.7 (95% CI = 1.9, 6.6)
0
2
4
6
8
10
12
UnadjustedGrassrootsHealth
NHANES AdjustedGrassrootsHealth*
Incide
nce p
er 1,0
00 po
pulat
ion
Chart 1: Incidence of Type 2 Diabetes
60% Lower
Chart Date 8/13/14 © 2016 GrassrootsHealth www.grassrootshealth.net
*Adjusted for age, gender, race, smoking status and BMI distribution differences between
4.2
www.grassrootshealth.netGrassrootsHealth
Moving Research into Practice
Moving Research into PracticeMay 2016
Incidence Rate of Type 2 Diabetes is >50% Lower in GrassrootsHealth vs. NHANES (Participants Ages 20+ Years) GrassrootsHealth D*action Cohort (N=4,933) and NHANES (N=4,078)
Among the 10 individuals who developed diabetes in the GrassrootsHealth cohort, 5 were below the median cohort serum level of 41 ng/ml and 5 were equal to or above it.
Among the 38 individuals who developed diabetes in the NHANES cohort, 31 were below the median cohort serum level of 22 ng/ml and 7 were equal to or above it.
These findings support the previously found association between higher serum 25(OH)D levels and a reduced risk of type 2 diabetes.
Chart Date: 8/13/14
© 2016 GrassrootsHealth. McDonnell SL et al., Incidence rate of type 2 diabetes is >50% lower in GrassrootsHealth cohort with median serum 25-hydroxyvitamin D of 41ng/ml than in NHANES cohort with median of 22ng/ml. J Steroid Biochem Mol Biol. 2016 Jan;155(Pt B):239-44.
0
200
400
600
800
1000
1200
1400
1600
0 10 20 30 40 50 60 70 80 90 100 110 120 130 140 150
Frequ
ency
25(OH)D (ng/ml)
Chart 2: Type 2 Diabetes Cases vs Serum Level All NHANES NHANES cases All GRH GRH cases
Median (NHANES) = 22 ng/ml
Chart Date 8/13/14 © 2014 GrassrootsHealth www.grassrootshealth.net
Median (GRH) = 41 ng/ml
4.3

GrassrootsHealthMoving Research into Practice
Symptoms
www.grassrootshealth.net
Section 5
www.grassrootshealth.netGrassrootsHealth
Moving Research into Practice
Moving Research into PracticeMay 2016
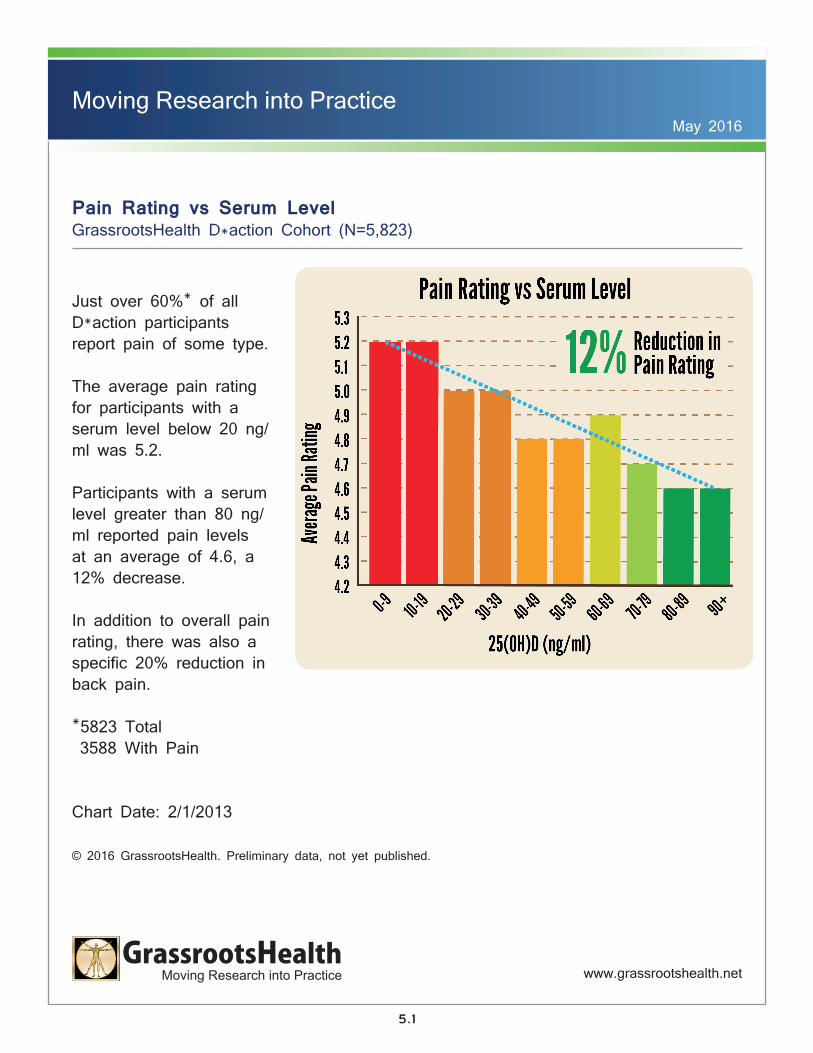
Pain Rating vs Serum LevelGrassrootsHealth D*action Cohort (N=5,823)
Just over 60%* of all D*action participants report pain of some type.
The average pain rating for participants with a serum level below 20 ng/ml was 5.2.
Participants with a serum level greater than 80 ng/ml reported pain levels at an average of 4.6, a 12% decrease.
In addition to overall pain rating, there was also a specific 20% reduction in back pain.
*5823 Total 3588 With Pain
Chart Date: 2/1/2013
© 2016 GrassrootsHealth. Preliminary data, not yet published.
5.1

www.grassrootshealth.netGrassrootsHealth
Moving Research into Practice
Moving Research into PracticeMay 2016
Experienced a Cold or Flu in Prior 6 Monthsby Vitamin D Status GrassrootsHealth D*action Cohort (N= 8,695)
33% of participants experienced a cold and 10% experienced a flu during the 6 months before their most recent test.
Participants with vitamin D levels ≥40 ng/ml reported 41% fewer cases of the flu and 15% fewer colds compared to participants with levels <20 ng/ml.
Chart Date: 8/31/15 ©2016 GrassrootsHealth. Preliminary data, not yet published.
36% 33%
30%
14% 11%
8%
0%
10%
20%
30%
40%
50%
<20 ng/ml (50 nmol/L)(N=453)
20-39 ng/ml(50-98 nmol/L)
(N=3266)
≥40 ng/ml (100 nmol/L) (N=4976)
Perc
ent o
f par
ticipa
nts
Vitamin D Status
Cold or Flu vs Vitamin D Status Cold Flu
YOUR DATA, YOUR ANSWERS
(Ptrend = 0.001) (Ptrend < 0.0001)
15% Reduction
41% Reduction
5.2

www.grassrootshealth.netGrassrootsHealth
Moving Research into Practice
Moving Research into PracticeMay 2016
Experienced a Broken Bone in Prior 6 Months by Vitamin D Status (Ages 65+ years) GrassrootsHealth D*action Cohort (N=1,659)
Those who broke a bone were more likely to have a serum level <40 ng/ml than ≥40 ng/ml.
Those with serum levels <20 ng/ml had 3 times the risk of breaking a bone compared to those ≥40 ng/ml.
Chart Date: 4/24/15 ©2016 GrassrootsHealth.
4.3%
2.8%
1.8% 1.6% 1.6%
0%
1%
2%
3%
4%
5%
< 20 ng/ml 20-29 ng/ml 30-39 ng/ml 40-49 ng/ml ≥ 50 ng/ml
% of
Parti
cipan
ts wi
th Br
oken
Bone
Vitamin D Status
Broken Bones vs Serum Level
Chart Date 4/24/15 © 2016 GrassrootsHealth Preliminary data, not yet published
www.grassrootshealth.net
YOUR DATA, YOUR ANSWERS
Ptrend = 0.10
63% Reduction
5.3
GrassrootsHealthMoving Research into Practice
Population Groups
www.grassrootshealth.net
Section 6

www.grassrootshealth.netGrassrootsHealth
Moving Research into Practice
Moving Research into PracticeMay 2016
Initial 25(OH)D Measurements and Vitamin D Intake for Medical Staff Members Medical Staff (N=48)
A majority (88%) of the medical staff had 25(OH)D concentrations <40 ng/ml on their initial test.
Also, a majority (90%) of the medical staff reported not taking vitamin D supplements.
Chart Date: 10/12/15 ©2016 GrassrootsHealth.
0
500
1000
1500
2000
2500
3000
3500
4000
4500
0
10
20
30
40
50
60
70
1 2 3 4 5 6 7 8 9 10 11 12 13 14 15 16 17 18 19 20 21 22 23 24 25 26 27 28 29 30 31 32 33 34 35 36 37 38 39 40 41 42 43 44 45 46 47 48
Vitam
in D I
ntak
e (IU/
day)
Seru
m 25
(OH)
D (ng
/mL)
Medical Staff Number Vitamin D intake (IU/ day)
Chart Date 10/12/2015 © 2015 GrassrootsHealth Preliminary data, not yet published www.grassrootshealth.net
Target Level: 40-60 ng/ml
Serum Levels and Vitamin D Intake for Medical Staff
88% Below 40ng/ml
6.1

www.grassrootshealth.netGrassrootsHealth
Moving Research into Practice
Moving Research into PracticeMay 2016
Initial 25(OH)D Concentrations and Vitamin D Intake Amounts for “Vitamin D for Public Health” Seminar Participants GrassrootsHealth December 2014 Seminar Participants (N=24)
Less than half of the seminar participants (42%) had 25(OH)D concentrations ≥40 ng/ml on their initial test.
The median vitamin D supplement intake amount was 1500 IU/day.
Chart Date: 9/22/15 ©2016 GrassrootsHealth.
0
2000
4000
6000
8000
10000
12000
0
10
20
30
40
50
60
70
80
Vitam
in D I
ntak
e (IU/
day)
Seru
m 25
(OH)
D (ng
/ml)
Serum Levels and Vitamin D Intake for Seminar Participants
Vitamin D Intake (IU/day)
Chart Date 9/22/15 © 2015 GrassrootsHealth Preliminary data, not yet published www.grassrootshealth.net
Target Level: 40-60 ng/ml
42% at or above 40 ng/ml
6.2

www.grassrootshealth.netGrassrootsHealth
Moving Research into Practice
Moving Research into PracticeMay 2016
End of Summer 25(OH)D Measurements for Southern California Lifeguards Southern California Lifeguards (N=13)
A majority of the lifeguards (69%) had 25(OH)D concentrations ≥40 ng/ml.
All of the lifeguards reported not taking any vitamin D supplements.
Chart Date: 10/28/15 ©2016 GrassrootsHealth.
0
10
20
30
40
50
60
70Se
rum
25(O
H)D (
ng/m
l)
Serum Levels of California Lifeguards
YOUR DATA, YOUR ANSWERS
Chart Date 10/28/15 © 2015 GrassrootsHealth Preliminary data, not yet published www.grassrootshealth.net
Target Level: 40-60 ng/ml
69% at or above 40 ng/ml
6.3
GrassrootsHealthMoving Research into Practice
Extended Characteristics
www.grassrootshealth.net
Section 7

www.grassrootshealth.netGrassrootsHealth
Moving Research into Practice
Moving Research into PracticeMay 2016
Serum 25(OH)D3 Increase for Each Food Source GrassrootsHealth D*action Cohort (N=640)
From 780 non-supplement taking, adult, D*action participants who completed a limited questionnaire on dietary intake along with a lifestyle questionnaire, some food sources were found to be associated with vitamin D serum levels: eggs, whole milk cottage cheese, red meat and total protein. 25(OH)D3 rose by about 1 ng/ml for each weekly serving of whole milk cottage cheese (3 oz) and each daily serving of one of the following: eggs (1 egg), red meat (3 oz) and total protein (3 oz).
Non-food factors associated with vitamin D serum levels (not shown in the chart)were indoor tanning use, sun exposure, body mass index (BMI), and percent of work performed outdoors. The ability of non-food and food sources to explain inter-individual variability was limited, therefore supplementation will likely be key to improving vitamin D status on a population level.
Chart Date: 12/1/13© 2016 GrassrootsHealth. McDonnell, S.L., French, C.B., Heaney, R.P. (2013) “Quantifying the non-food sources of basal vitamin d input” and “Quantifying the food sources of basal vitamin d input” J Steroid Biochem Mol Biol., online ahead of print 10/28/13 and 11/1/13, respectively.
7.1
www.grassrootshealth.netGrassrootsHealth
Moving Research into Practice
Moving Research into PracticeMay 2016
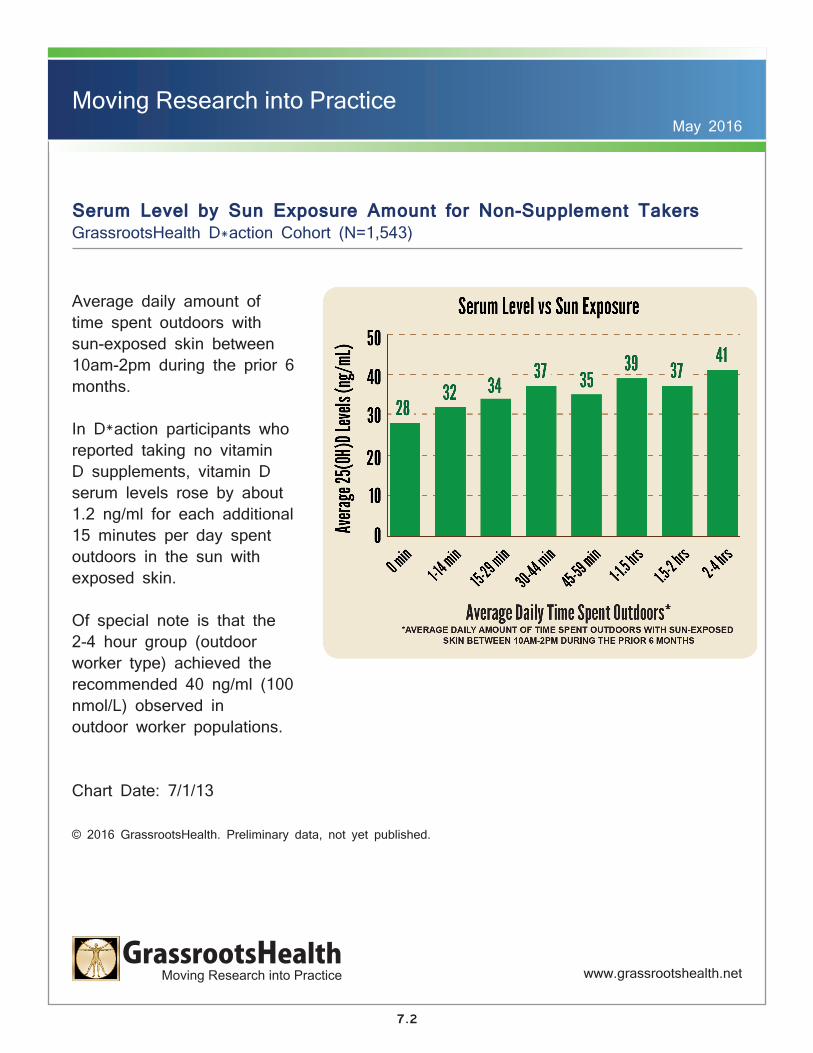
Serum Level by Sun Exposure Amount for Non-Supplement Takers GrassrootsHealth D*action Cohort (N=1,543)
Average daily amount of time spent outdoors with sun-exposed skin between 10am-2pm during the prior 6 months.
In D*action participants who reported taking no vitamin D supplements, vitamin D serum levels rose by about 1.2 ng/ml for each additional 15 minutes per day spent outdoors in the sun with exposed skin. Of special note is that the 2-4 hour group (outdoor worker type) achieved the recommended 40 ng/ml (100 nmol/L) observed inoutdoor worker populations.
Chart Date: 7/1/13
© 2016 GrassrootsHealth. Preliminary data, not yet published.
7.2
www.grassrootshealth.netGrassrootsHealth
Moving Research into Practice
Moving Research into PracticeMay 2016
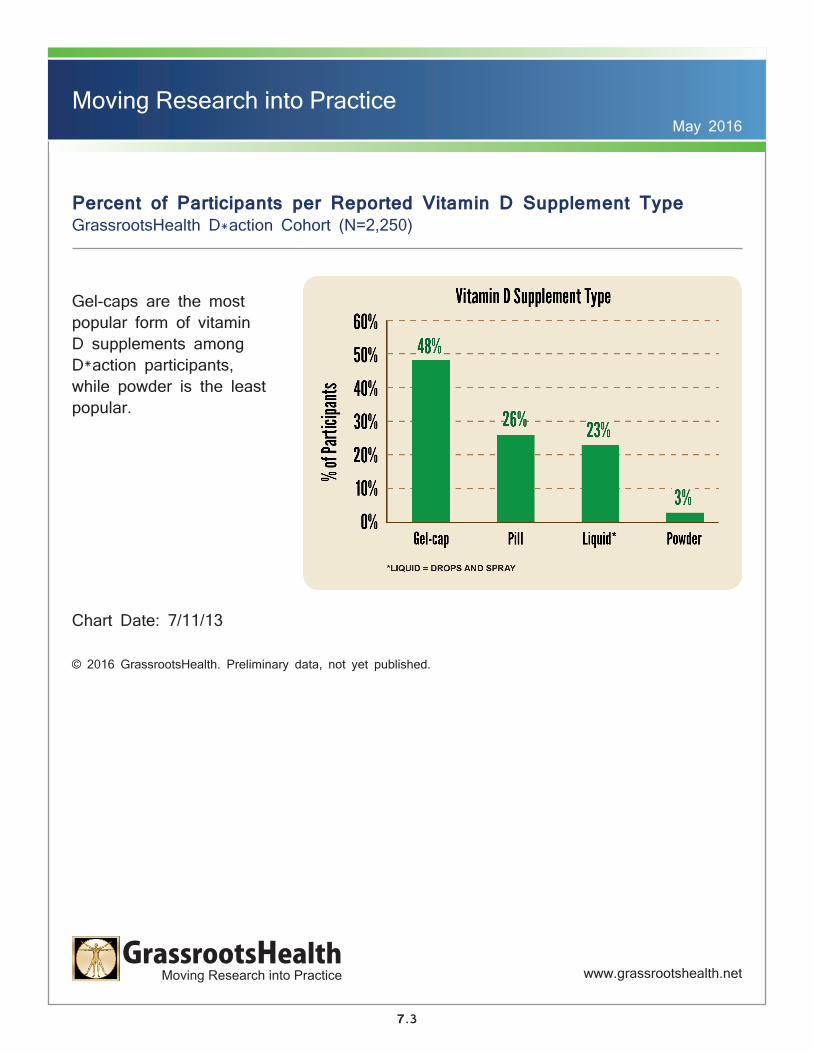
Percent of Participants per Reported Vitamin D Supplement Type GrassrootsHealth D*action Cohort (N=2,250)
Gel-caps are the most popular form of vitamin D supplements among D*action participants, while powder is the least popular.
Chart Date: 7/11/13
© 2016 GrassrootsHealth. Preliminary data, not yet published.
7.3
www.grassrootshealth.netGrassrootsHealth
Moving Research into Practice
Moving Research into PracticeMay 2016
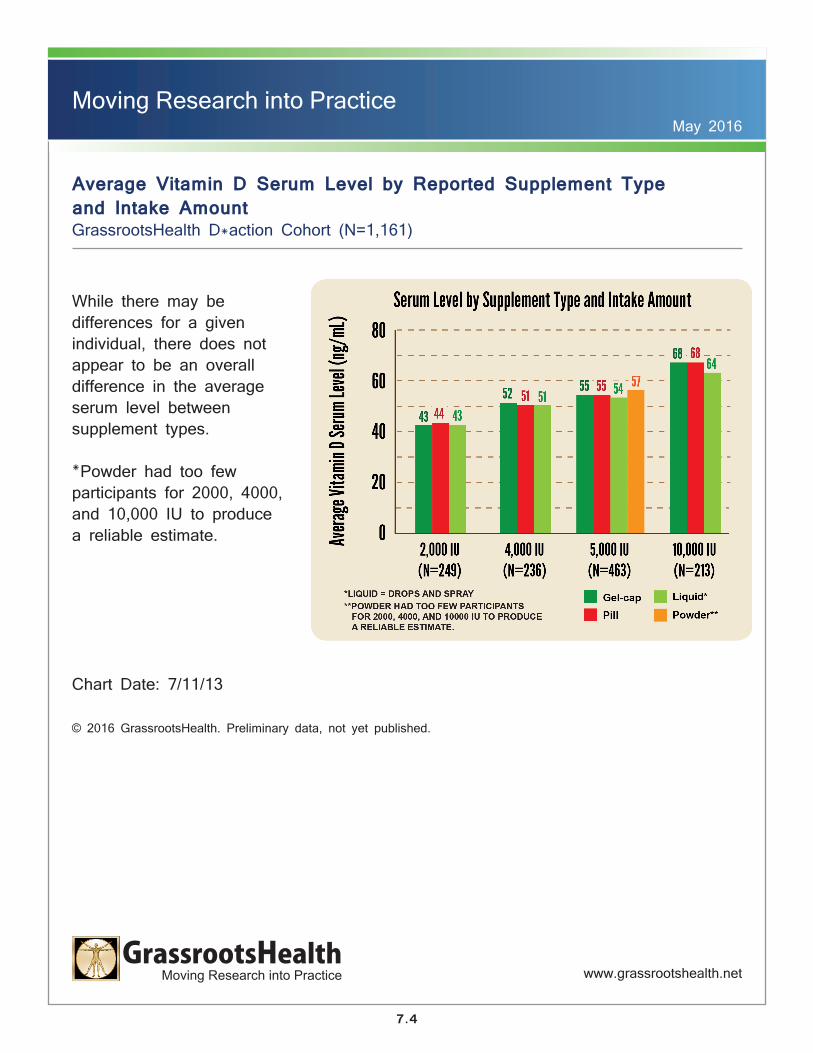
Average Vitamin D Serum Level by Reported Supplement Type and Intake AmountGrassrootsHealth D*action Cohort (N=1,161)
While there may be differences for a given individual, there does not appear to be an overall difference in the average serum level between supplement types. *Powder had too few participants for 2000, 4000, and 10,000 IU to produce a reliable estimate.
Chart Date: 7/11/13
© 2016 GrassrootsHealth. Preliminary data, not yet published.
7.4

www.grassrootshealth.netGrassrootsHealth
Moving Research into Practice
Moving Research into PracticeMay 2016
Average Serum Level by Vitamin D Supplement Amount (Ages 18+ Years) GrassrootsHealth D*action Cohort (N=9,014)
As supplement intake amounts increased, average 25(OH)D concentrations increased (from 28 ng/ml for those taking no supplements to 70 ng/ml for those taking 10,000 IU/day or more).
Chart Date: 1/18/16 ©2016 GrassrootsHealth.
28 35
42 51 54
62 70
0
20
40
60
80Av
erag
e 25(
OH)D
Seru
m Le
vel (
ng/m
l)
Daily Vitamin D Supplement Amounts (IU)
Serum Level by Supplement Amount
YOUR DATA, YOUR ANSWERS
www.grassrootshealth.net
7.5

www.grassrootshealth.netGrassrootsHealth
Moving Research into Practice
Moving Research into PracticeMay 2016
Vitamin D Dose Response Curves for Vitamin A Intake AmountsGrassrootsHealth D*action Cohort (N=3,355)
Evidence suggests that excess vitamin A (as retinol or retinyl palmitate) can bind to the vitamin D receptor and partially block vitamin D action. This is of particular interest as high intakes of vitamin A may actually limit the increase of vitamin D serum levels. In a preliminary analysis of the D*action data, we found 34% of participants report taking vitamin A as retinol or retinyl palmitate in supplements.
Of those who take vitamin A, the average amount is 5,400 IU per day.
Participants who take more than 5,000 IU of vitamin A per day have a lower vitamin D dose response than those who take 5,000 IU or less.
Chart Date: 7/26/13
© 2016 GrassrootsHealth. Preliminary data, not yet published.
7.6
www.grassrootshealth.netGrassrootsHealth
Moving Research into Practice
Moving Research into PracticeMay 2016
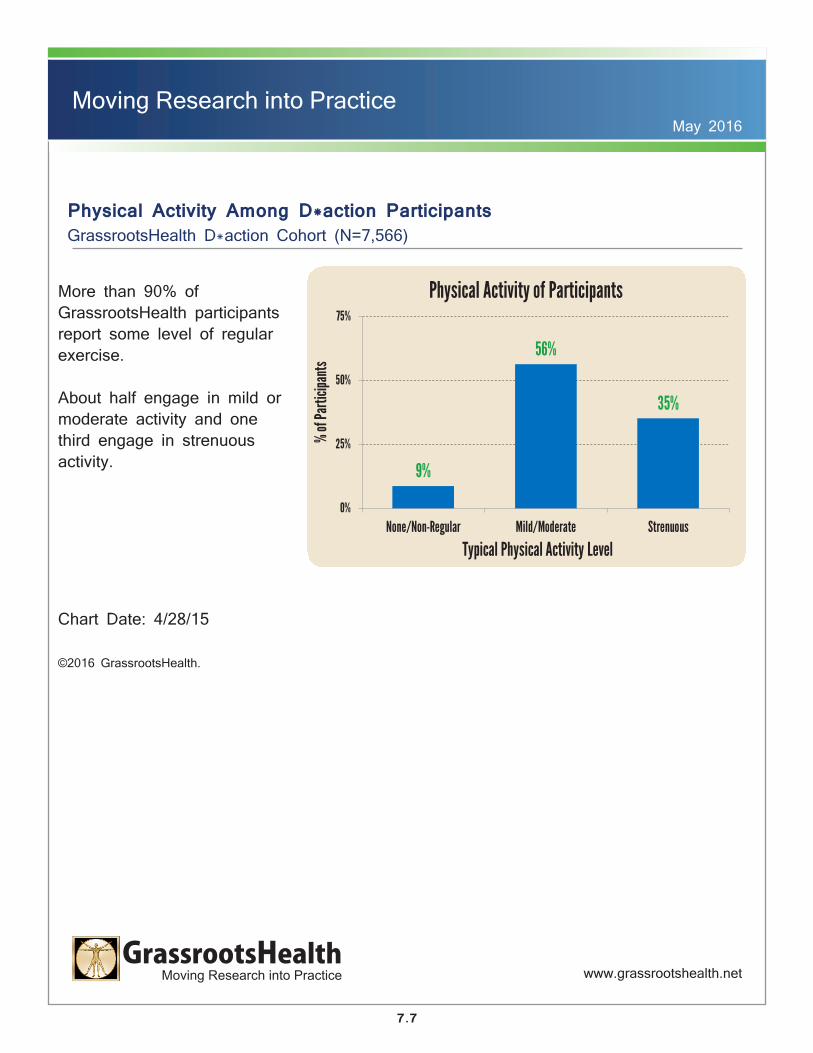
Physical Activity Among D*action Participants GrassrootsHealth D*action Cohort (N=7,566)
More than 90% of GrassrootsHealth participants report some level of regular exercise.
About half engage in mild or moderate activity and one third engage in strenuous activity.
Chart Date: 4/28/15 ©2016 GrassrootsHealth.
9%
56%
35%
0%
25%
50%
75%
None/Non-Regular Mild/Moderate Strenuous
% of
Parti
cipan
ts
Typical Physical Activity Level
Physical Activity of Participants
Chart Date 4/28/15 © 2016 GrassrootsHealth Preliminary data, not yet published
www.grassrootshealth.net
7.7

www.grassrootshealth.netGrassrootsHealth
Moving Research into Practice
Moving Research into PracticeMay 2016
Dose Response by Physical Activity Level GrassrootsHealth D*action Cohort (N=7,566)
We charted dose response curves (intake vs. serum level) by level of physical activity.
Regular exercisers have a slightly higher vitamin D dose response than non-regular exercisers, especially in the lower dose range.
Chart Date: 4/28/15 ©2016 GrassrootsHealth.
0
20
40
60
80
100
0 2,000 4,000 6,000 8,000 10,000
Seru
m 25
(OH)
D (ng
/ml)
Average Daily Vitamin D Intake (IU/day)
Dose Response by Physical Activity Level None/Non-Regular Mild/Moderate Strenuous
www.grassrootshealth.net
YOUR DATA, YOUR ANSWERS
7.8
www.grassrootshealth.netGrassrootsHealth
Moving Research into Practice
Moving Research into PracticeMay 2016
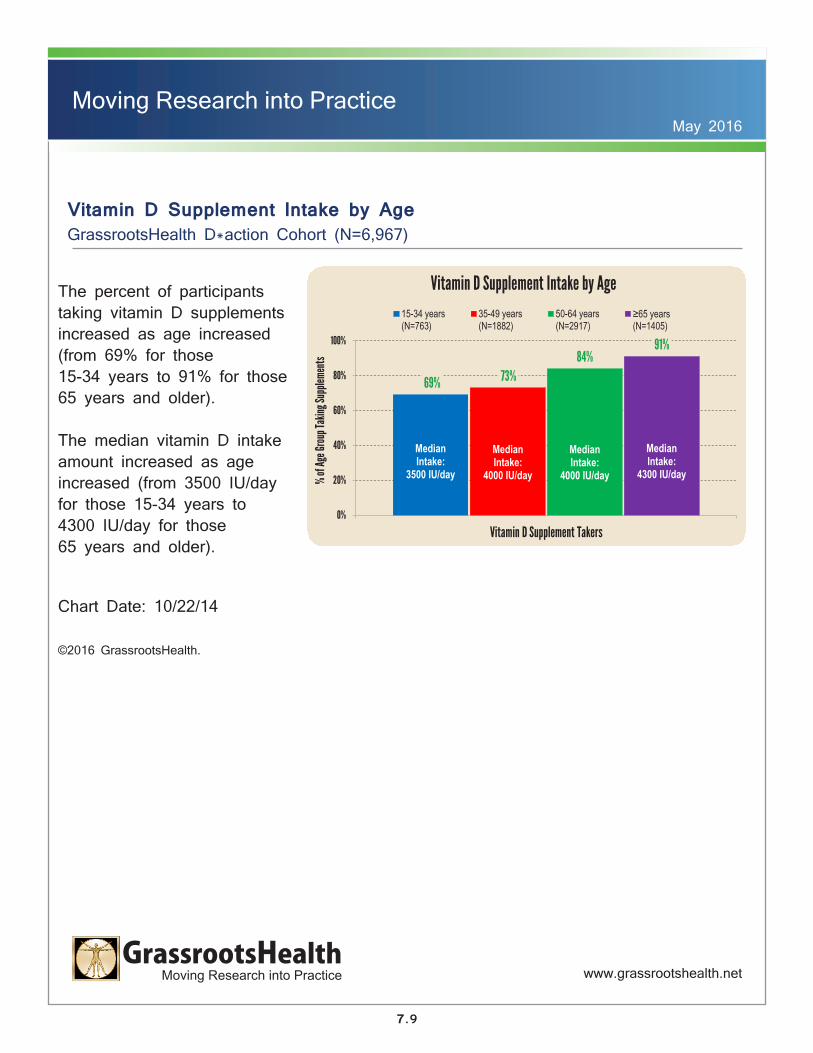
Vitamin D Supplement Intake by Age GrassrootsHealth D*action Cohort (N=6,967)
The percent of participants taking vitamin D supplements increased as age increased (from 69% for those 15-34 years to 91% for those 65 years and older).
The median vitamin D intake amount increased as age increased (from 3500 IU/day for those 15-34 years to 4300 IU/day for those 65 years and older).
Chart Date: 10/22/14 ©2016 GrassrootsHealth.
69% 73% 84%
91%
0%
20%
40%
60%
80%
100%
% of
Age G
roup
Takin
g Sup
pleme
nts
Vitamin D Supplement Takers
Vitamin D Supplement Intake by Age 15-34 years(N=763)
35-49 years(N=1882)
50-64 years(N=2917)
≥65 years (N=1405)
Chart Date 10/22/14 © 2016 GrassrootsHealth
www.grassrootshealth.net
Median Intake:
3500 IU/day
Median Intake:
4000 IU/day
Median Intake:
4000 IU/day
Median Intake:
4300 IU/day
7.9

www.grassrootshealth.netGrassrootsHealth
Moving Research into Practice
Moving Research into PracticeMay 2016
Vitamin D Serum Level by Age GrassrootsHealth D*action Cohort (N=6,967)
Median serum concentration increased by age, from 39 ng/ml for those 15-34 years old to 48 ng/ml for those 65 years and older.
The proportion of those with serum concentrations ≥40 ng/ml increased as age increased (48% for those 15-34 years, 51% for those 35-49 years, 62% for those 50-64 years, and 69% for those 65 years and older).
There was no difference in dose response by age.
Chart Date: 10/23/14 ©2016 GrassrootsHealth.
8%
44%
32%
16%
6%
43%
34%
17%
3%
35% 38%
24%
3%
28%
42%
27%
0%
10%
20%
30%
40%
50%
<20 20-39 40-60 >60
% of
Parti
cipan
ts
Serum 25(OH)D (ng/ml)
Serum Level by Age 15-34 years (N=763)Median = 39 ng/ml
35-49 years (N=1882)Median = 40 ng/ml
50-64 years (N=2917)Median = 45 ng/ml
≥65 years (N=1405) Median = 48 ng/ml
Chart Date 10/23/14 www.grassrootshealth.net
7.10
www.grassrootshealth.netGrassrootsHealth
Moving Research into Practice
Moving Research into PracticeMay 2016
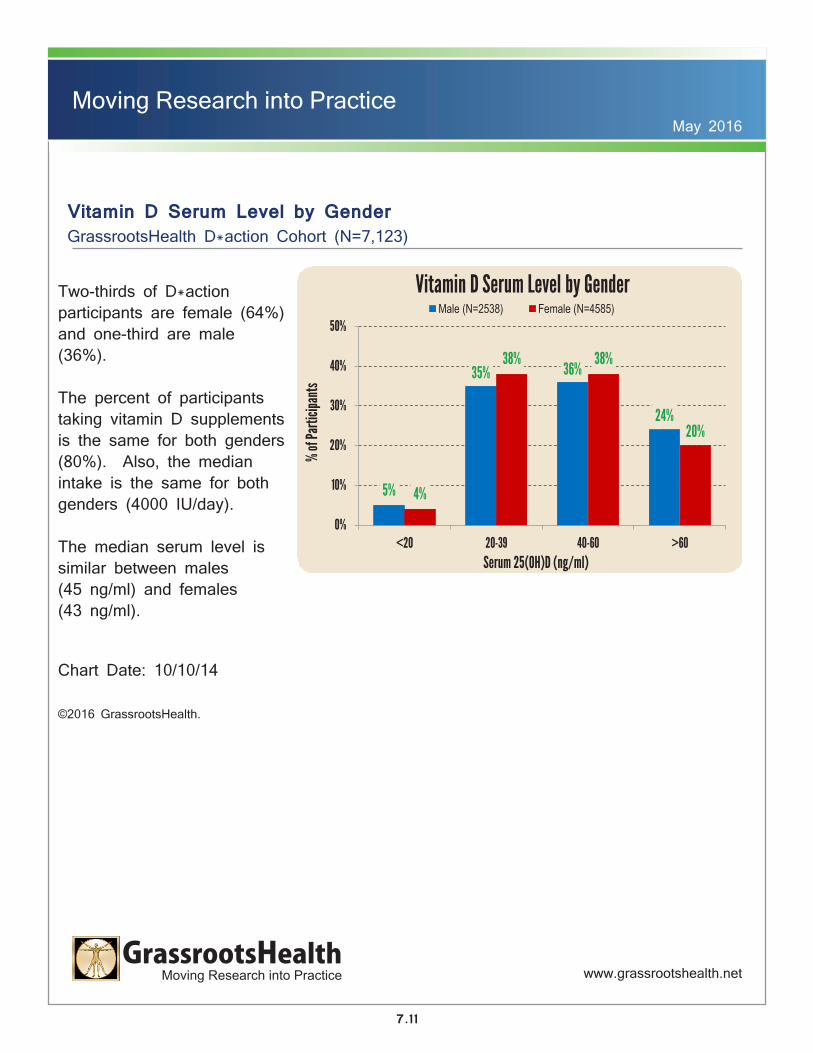
Vitamin D Serum Level by Gender GrassrootsHealth D*action Cohort (N=7,123)
Two-thirds of D*action participants are female (64%) and one-third are male (36%).
The percent of participants taking vitamin D supplements is the same for both genders (80%). Also, the median intake is the same for both genders (4000 IU/day).
The median serum level is similar between males (45 ng/ml) and females (43 ng/ml).
Chart Date: 10/10/14 ©2016 GrassrootsHealth.
5%
35% 36%
24%
4%
38% 38%
20%
0%
10%
20%
30%
40%
50%
<20 20-39 40-60 >60
% of
Parti
cipan
ts
Serum 25(OH)D (ng/ml)
Vitamin D Serum Level by Gender Male (N=2538) Female (N=4585)
Chart Date 10/10/14 © 2016 GrassrootsHealth Preliminary data, not yet published
YOUR DATA, YOUR ANSWERS
www.grassrootshealth.net
7.11
www.grassrootshealth.netGrassrootsHealth
Moving Research into Practice
Moving Research into PracticeMay 2016
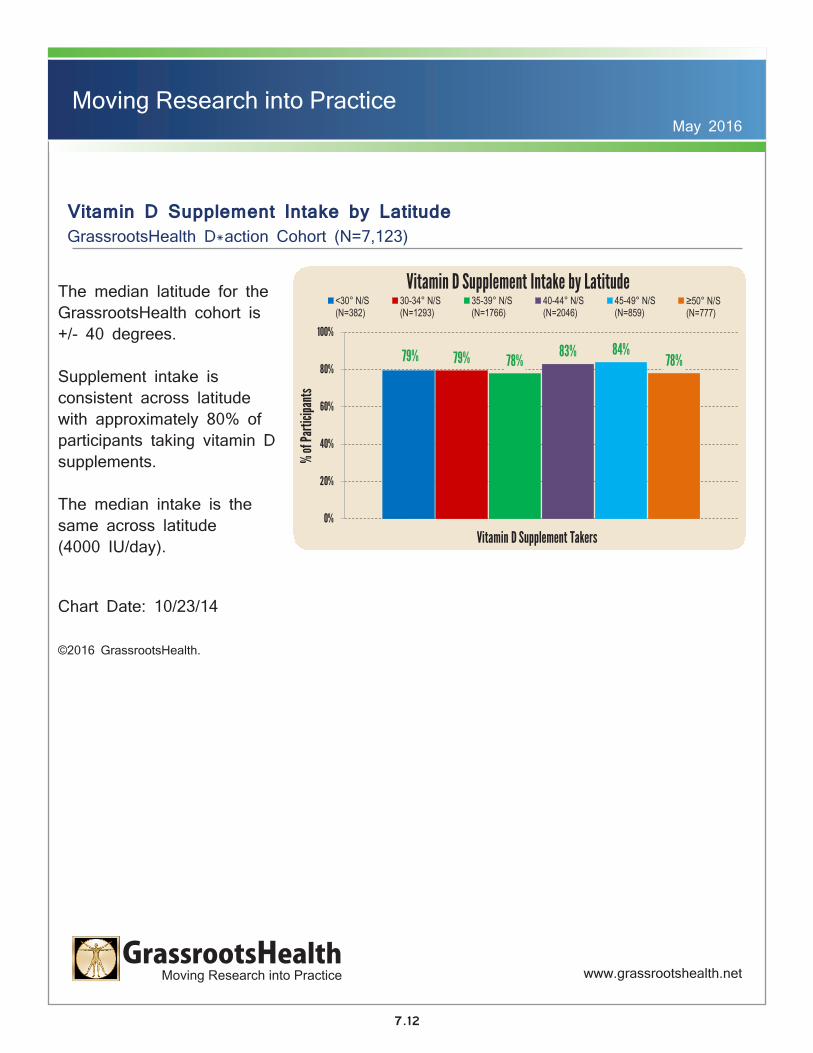
Vitamin D Supplement Intake by Latitude GrassrootsHealth D*action Cohort (N=7,123)
The median latitude for the GrassrootsHealth cohort is +/- 40 degrees.
Supplement intake is consistent across latitude with approximately 80% of participants taking vitamin D supplements.
The median intake is the same across latitude (4000 IU/day).
Chart Date: 10/23/14 ©2016 GrassrootsHealth.
79% 79% 78% 83% 84%
78%
0%
20%
40%
60%
80%
100%
% of
Parti
cipan
ts
Vitamin D Supplement Takers
Vitamin D Supplement Intake by Latitude <30° N/S(N=382)
30-34° N/S(N=1293)
35-39° N/S(N=1766)
40-44° N/S(N=2046)
45-49° N/S(N=859)
≥50° N/S (N=777)
Chart Date 10/23/14 © 2016 GrassrootsHealth Preliminary data, not yet published www.grassrootshealth.net
7.12
www.grassrootshealth.netGrassrootsHealth
Moving Research into Practice
Moving Research into PracticeMay 2016
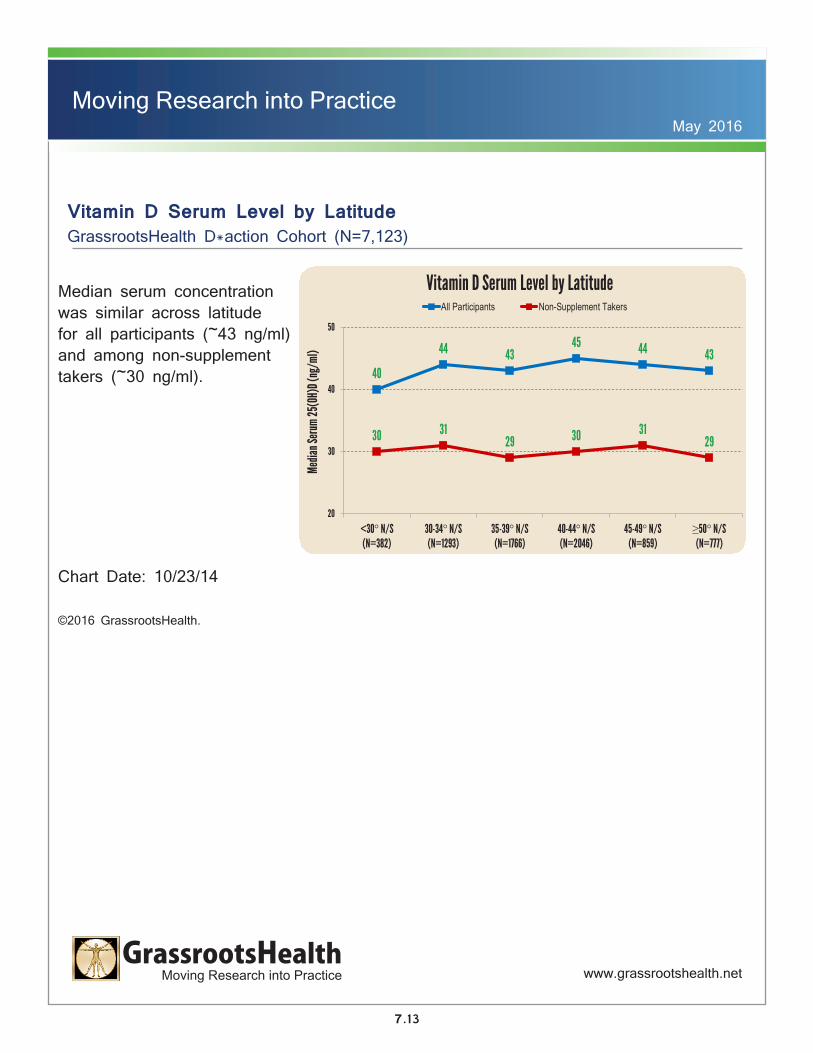
Vitamin D Serum Level by Latitude GrassrootsHealth D*action Cohort (N=7,123)
Median serum concentration was similar across latitude for all participants (~43 ng/ml) and among non-supplement takers (~30 ng/ml).
Chart Date: 10/23/14 ©2016 GrassrootsHealth.
40
44 43 45 44 43
30 31 29 30 31
29
20
30
40
50
<30° N/S(N=382)
30-34° N/S(N=1293)
35-39° N/S(N=1766)
40-44° N/S(N=2046)
45-49° N/S(N=859)
≥50° N/S (N=777)
Media
n Ser
um 25
(OH)
D (ng
/ml)
Vitamin D Serum Level by Latitude All Participants Non-Supplement Takers
Chart Date 10/23/14 © 2016 GrassrootsHealth Preliminary data, not yet published www.grassrootshealth.net
7.13

www.grassrootshealth.netGrassrootsHealth
Moving Research into Practice
Moving Research into PracticeMay 2016
Vitamin D Supplement Intake by Percent Outdoor Occupation GrassrootsHealth D*action Cohort (N=6,808)
As the percentage of work performed outdoors increased, the percentage of participants taking supplements decreased (from 82% for those who perform none of their occupation outdoors to 71% for those who perform >50% of their occupation outdoors).
Chart Date: 10/23/14 ©2016 GrassrootsHealth.
82% 80% 80% 77% 71%
0%
20%
40%
60%
80%
100%
% of
Parti
cipan
ts
Vitamin D Supplement Takers
Vitamin D Supplement Intake by % Outdoor Occupation
None(N=3726)
<10%(N=1623)
10-25%(N=877)
25-50%(N=356)
>50%(N=226)
Chart Date 10/23/14 © 2016 GrassrootsHealth
www.grassrootshealth.net
Percent of Occupation Performed Outdoors During Daylight:
7.14
www.grassrootshealth.netGrassrootsHealth
Moving Research into Practice
Moving Research into PracticeMay 2016
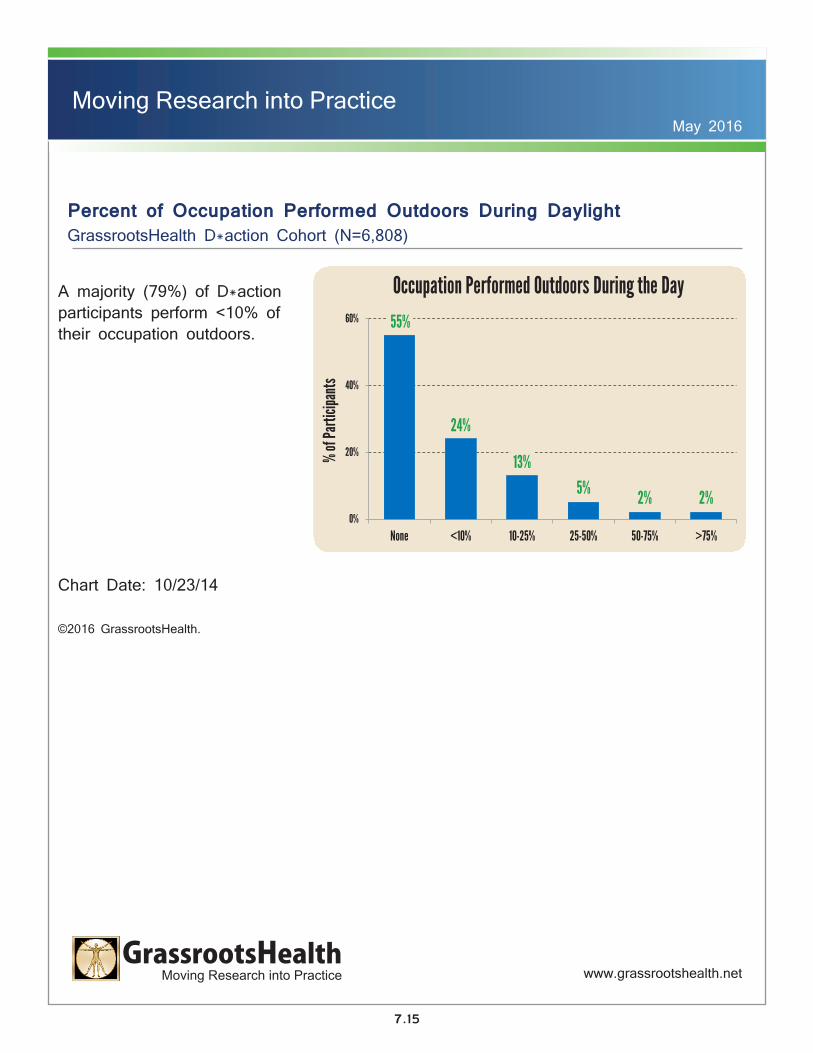
Percent of Occupation Performed Outdoors During Daylight GrassrootsHealth D*action Cohort (N=6,808)
A majority (79%) of D*action participants perform <10% of their occupation outdoors.
Chart Date: 10/23/14 ©2016 GrassrootsHealth.
55%
24%
13% 5% 2% 2%
0%
20%
40%
60%
None <10% 10-25% 25-50% 50-75% >75%
% of
Parti
cipan
ts
Occupation Performed Outdoors During the Day
Chart Date 10/23/14 © 2016 GrassrootsHealth Preliminary data, not yet published
www.grassrootshealth.net
7.15

www.grassrootshealth.netGrassrootsHealth
Moving Research into Practice
Moving Research into PracticeMay 2016
Median Vitamin D Intake by Month of Year* GrassrootsHealth D*action Cohort (N=6,814)
For participants’ first test, the annual average vitamin D intake amount was 1600 IU/day and the average serum level was 40 ng/ml.
For those who tested at least twice, the annual average intake amount for the second test was 4000 IU/day and the average serum level was 47 ng/ml.
Chart Date: 4/2/14 ©2016 GrassrootsHealth.
0
1000
2000
3000
4000
5000
6000
Jan Feb Mar Apr May Jun Jul Aug Sep Oct Nov Dec
Supp
lemen
t Int
ake (
IU/da
y)
Median Vitamin D Intake by Month of Year*
1st Test (N=6814) 2nd Test (N=3209)
*Northern Hemisphere 1st Test Annual Average: 1600 IU/day, 40 ng/ml
Chart Date 4/2/14 © 2016 GrassrootsHealth Preliminary data, not yet published www.grassrootshealth.net
7.16
www.grassrootshealth.netGrassrootsHealth
Moving Research into Practice
Moving Research into PracticeMay 2016
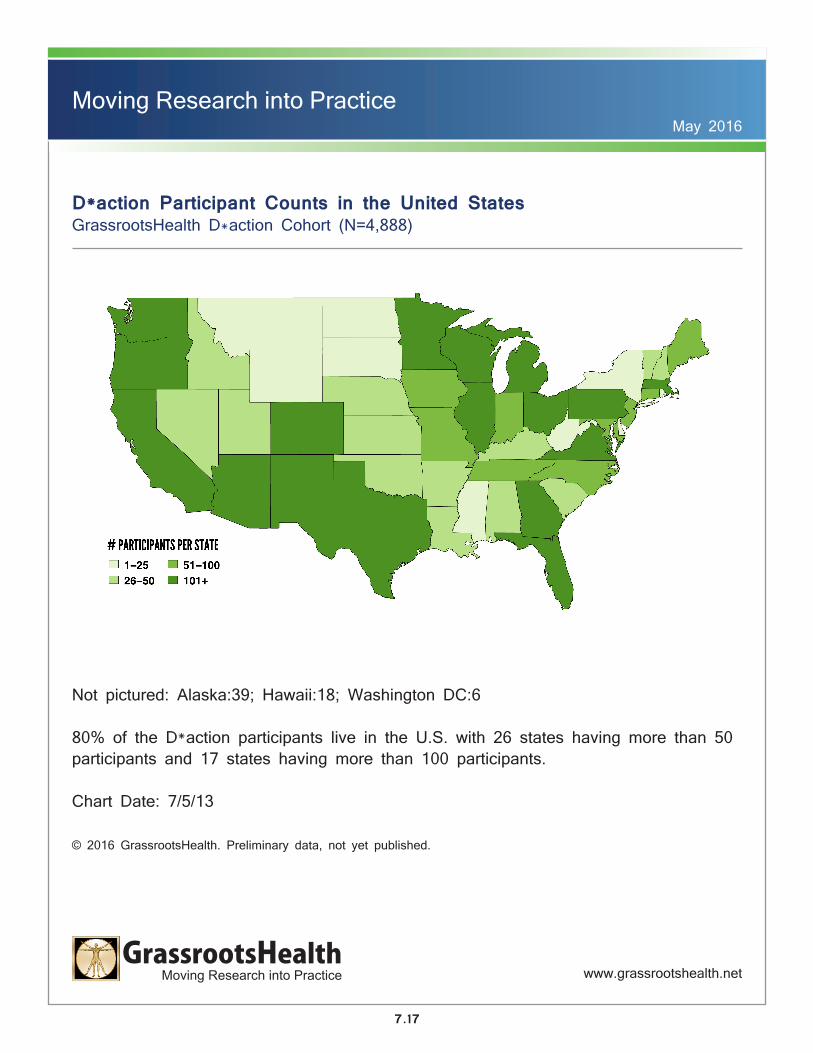
D*action Participant Counts in the United States GrassrootsHealth D*action Cohort (N=4,888)
Not pictured: Alaska:39; Hawaii:18; Washington DC:6
80% of the D*action participants live in the U.S. with 26 states having more than 50 participants and 17 states having more than 100 participants.
Chart Date: 7/5/13
© 2016 GrassrootsHealth. Preliminary data, not yet published.
7.17
www.grassrootshealth.netGrassrootsHealth
Moving Research into Practice
Moving Research into PracticeMay 2016
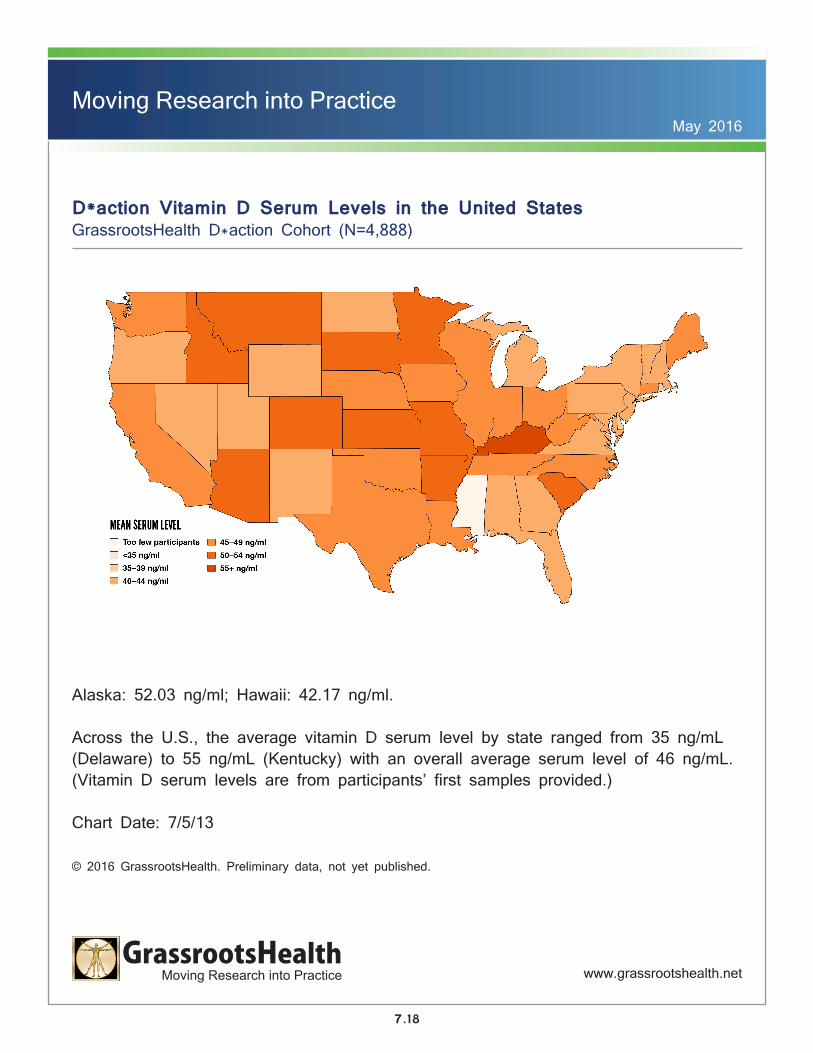
D*action Vitamin D Serum Levels in the United States GrassrootsHealth D*action Cohort (N=4,888)
Alaska: 52.03 ng/ml; Hawaii: 42.17 ng/ml.
Across the U.S., the average vitamin D serum level by state ranged from 35 ng/mL (Delaware) to 55 ng/mL (Kentucky) with an overall average serum level of 46 ng/mL. (Vitamin D serum levels are from participants’ first samples provided.)
Chart Date: 7/5/13
© 2016 GrassrootsHealth. Preliminary data, not yet published.
7.18

www.grassrootshealth.netGrassrootsHealth
Moving Research into Practice
Moving Research into PracticeMay 2016
D*action Around the World GrassrootsHealth D*action Cohort (N=6,125)
D*action has participants in 45 countries on every inhabited continent.Of the non-US residing participants, 46% live in Canada, 30% live in Great Britain, 4% live in Australia, 4% live in Japan, 2% live in the Netherlands, and 14% live in other countries.
Chart Date: 7/5/13
© 2016 GrassrootsHealth. Preliminary data, not yet published.
7.19