Comment on ''Effect of carbide distribution on the ... · fracture toughness in the transition ......
12
HAL Id: hal-00142081 https://hal.archives-ouvertes.fr/hal-00142081 Submitted on 19 Apr 2007 HAL is a multi-disciplinary open access archive for the deposit and dissemination of sci- entific research documents, whether they are pub- lished or not. The documents may come from teaching and research institutions in France or abroad, or from public or private research centers. L’archive ouverte pluridisciplinaire HAL, est destinée au dépôt et à la diffusion de documents scientifiques de niveau recherche, publiés ou non, émanant des établissements d’enseignement et de recherche français ou étrangers, des laboratoires publics ou privés. Comment on ”Effect of carbide distribution on the fracture toughness in the transition temperature region of an SA 508 steel” Benoit Tanguy, Jacques Besson, André Pineau To cite this version: Benoit Tanguy, Jacques Besson, André Pineau. Comment on ”Effect of carbide distribution on the fracture toughness in the transition temperature region of an SA 508 steel”. Scripta Metallurgica, Elsevier, 2003, 49, pp.191-197. <10.1016/S1359-6462(03)00239-2>. <hal-00142081>
Transcript of Comment on ''Effect of carbide distribution on the ... · fracture toughness in the transition ......

HAL Id: hal-00142081https://hal.archives-ouvertes.fr/hal-00142081
Submitted on 19 Apr 2007
HAL is a multi-disciplinary open accessarchive for the deposit and dissemination of sci-entific research documents, whether they are pub-lished or not. The documents may come fromteaching and research institutions in France orabroad, or from public or private research centers.
L’archive ouverte pluridisciplinaire HAL, estdestinée au dépôt et à la diffusion de documentsscientifiques de niveau recherche, publiés ou non,émanant des établissements d’enseignement et derecherche français ou étrangers, des laboratoirespublics ou privés.
Comment on ”Effect of carbide distribution on thefracture toughness in the transition temperature region
of an SA 508 steel”Benoit Tanguy, Jacques Besson, André Pineau
To cite this version:Benoit Tanguy, Jacques Besson, André Pineau. Comment on ”Effect of carbide distribution on thefracture toughness in the transition temperature region of an SA 508 steel”. Scripta Metallurgica,Elsevier, 2003, 49, pp.191-197. <10.1016/S1359-6462(03)00239-2>. <hal-00142081>

Comments on “Effect of carbide distribution
on the fracture toughness in the transition
temperature region of an SA 508 steel”
B. Tanguy, J.Besson, A. Pineau
Ecole des Mines de Paris, Centre des Materiaux, UMR CNRS 7633BP 87, 91003 Evry Cedex, France
Abstract
Critical cleavage stress values and carbide sizes obtained in a recent work by Leeet al. [1] are recalculated using 2D and 3D FE simulations and new constitutivelaw, instead of small scale yielding assumption and likely improper choice for thebehavior of SA 508 steel. A new model based on the weakest link concept with thedetermined carbide size distribution (CSD) is succesfully applied to predict KJc
measurements obtained on SA 508 steel and on a similar material (22NiMoCr3-7).
Key words: A. Toughness, B. Statistical model, C. Finite elements analysis.
1 Introduction
This paper comments on a recent publication by Lee et al. [1] on cleavagefracture of SA 508 steel. Following Curry and Knott [2] who showed thatthe cleavage fracture toughness of a spheroidized steel depends on carbidedistribution, most of the models for cleavage fracture of low alloy and mildsteels are based on a statistical approach. Contrarily to mild steels, the fullcharacterization of the carbide size distribution in quenched and tempered lowalloy steels is difficult to obtain. This is why relevant experimental data arescarcely reported in the literature. In most of the carbide induced cleavagefracture models it is assumed that the carbide size distribution follows an “apriori” function (see e.g. [3,4]).Recently in a comprehensive study by Lee and al. [1] (hereafter referred toas Lee) the carbide size distribution (CSD) of an SA 508 steel, which is aquenched and tempered low alloy steel, was given based on the analysis of morethan 1400 particules. Lee has investigated the effect of carbide distribution onthe fracture toughness, KJc, of this material tested in the lower part of the
Preprint submitted to Elsevier Preprint 10 April 2003

transition temperature region where only cleavage fracture occurs withoutany prior ductile crack growth. Assuming that in this temperature range,cleavage fracture is controlled by a stress criterion and using the maximalprincipal stress profiles given by McMeeking [5] under plane strain small scaleyielding (SSY) conditions, a linear relationship between the critical carbidesize initiating cleavage fracture and the test temperature was found. Based onthis and on the relationship between the critical nearest–neighbour distanceand the CSD, a deterministic relation was proposed between KJc and theCSD.However in Lee’s work anomalously large values for the critical cleavage stresswere reported (see Table 3 in [1]) considering the mechanical properties ofthis material compared to those obtained on the same steel [3] and in a recentstudy on a very similar steel [6]. Moreover the SSY assumption for tests carriedout on PCVN (Precracked Charpy V–Notch) specimens tested at fracturetoughness values as large as 150MPa
√m (see Table 2 in [1]) appears to be
strong.Here, in order to comfort the results obtained by Lee [1], critical cleavage stressvalues have been recalculated based on the mechanical properties of SA 508steel and using finite element (FE) calculations. Firstly the SSY assumptionwas kept in order to check the stress level values reported in Lee’s work.Secondly, 3D numerical simulations of PCVN geometry were performed inorder to validate the SSY assumption. Then, keeping the Lee’s hypothesisthat cleavage fracture in quenched and tempered bainitic steels is induced bycarbides, and using the CSD obtained on SA 508 steel, a further extensionof Lee’s work is made to present a statistical model. This model followsthe Beremin’s formalism [3] but with the CSD given in Lee’s work. Modelparameters are adjusted to experimental results obtained on SA 508 steelwith PCVN geometry and then applied to predict the KJc values of anotherquenched and tempered bainitic steel, 22NiMoCr3-7 material which is veryclose to SA 508.
2 Materials and experiments
Table 1 gives the chemical compositions of the investigated materials. Bothwere quenched and tempered. Full details can be found in [1].
Material C Si Mn P S Ni Cr Cu Mo V Ta Co Al
SA 508 0.18 0.1 1.46 0.006 0.003 0.86 0.15 0.03 0.51 0.004 / / 0.008
22NiMoCr3-7 0.22 0.19 0.89 0.007 0.007 0.87 0.40 0.04 0.55 < .01 < .005 0.011 0.019
Table 1Chemical composition of SA 508 and 22NiMoCr3-7 steels (wt.%)
Details on experiments performed on SA 508 steel are given in [1]. Here it issimply reminded that elastic–plastic fracture toughness, KJc, was determined
2

using precracked Charpy V–notch (PCVN) specimens (10 × 10 × 55mm3)(a0/W ∼ 0.5). Static (ε = 10−3s−1) tensile tests were performed on smoothspecimens in 22NiMoCr3-7 material to determine the stress–strain curves atvarious temperatures. Static plane strain fracture toughness tests were carriedout on CT(1T) specimens according to standard ASTM E 1921–97 with anominal crack length to specimen width ratio (a0/W ) of 0.5. These specimenstested between −90◦C and −30◦C led to pure cleavage fracture.
3 Results
3.1 Tensile properties
The evolution of the yield stress, σY , and ultimate tensile stress, Rm, as afunction of temperature is reported in fig. 1a for both steels. The resultsconcerning SA 508 steel are taken from [1]. As shown in fig. 1, σY and Rm areslightly lower for SA 508 steel than for 22NiMoCr3-7 steel. It is worth notingthat at a given temperature, the difference between σY and Rm is nearly thesame between both steels, which indicates that the hardening capacity forboth materials is quite similar over all the investigated temperature range.The strain hardening exponent, n, in ref. [1], was also given at differenttemperatures. However, the derivation of the function linking the flow stressand the plastic strain was not given in this paper. Assuming that the usualrelation σeq = K × εn was used by the authors and using the Considerecriteria, from which the relation Rm = K(n/e)n is obtained, it is possibleto determine the parameter K at each temperature (the same method waskept at −196◦C where fracture occurred probably before necking) using thetensile properties given for SA 508 steel. Corresponding stress–plastic straincurves obtained at −196◦C and −100◦C are plotted in fig. 1b (thick lines).These curves will be referred to as CL1 model in the following. On the samefigure, the experimental stress–plastic strain curve for 22NiMoCr3-7 steel at−100◦C is also plotted. The stress–strain curves for both materials are veryclose. In the same figure, two other equivalent stress–plastic strain curves arealso reported. These curves were obtained using the yield function given byMcMeeking [5] (see eq. 1).
(σ
σY
)1/N
=σ
σY+
3E
2(1 + ν)
εp
σY(1)
Here it is worth mentionning that the McMeeking’s FE solutions were usedby Lee to obtain the maximum principal stress, σpI , at each test temperature,and that these values were used to calculate the critical carbide size. This
3

later point will be discussed in the following. Keeping the n values given inref. [1] (e.g. n = N in eq. 1), and assuming that the Kirchoff stress tensorcan be approximated by the Cauchy stress tensor, leads to much higher stresslevels (thin lines on fig. 1b referred to as CL2 model in the following) thanstress–strain curves based on SA 508 tensile properties. In particular theultimate tensile stress inferred from eq. 1 is strongly overestimated at bothtemperatures. For simplicity’s sake, results at other experimental temperatures(−140◦C and −75◦C ) not shown here lead to the same conclusions weredrawn.
Rm SA 508Rm 22NiMoCr3-7
σY SA 508σY 22NiMoCr3-7
Rm
σY
Temperature, T (◦C )
σY,
Rm
(MPa)
0-50-100-150-200
1000
900
800
700
600
500
400
−100◦C
−100◦C−196◦C
−196◦C
CL2 model
CL1 model
exp. −100◦C 22NiMoCr3-7
εp, plastic strain
σf
(MPa)
10.80.60.40.20
2000
1800
1600
1400
1200
1000
800
600
400
a b
Fig. 1. Evolution of the tensile properties of SA508 and 22NiMoCr3-7 steels as afunction of temperature. a) Yield stress and ultimate tensile stress b) Flow stresswith CL1 and CL2 models.
3.2 Maximum principal stress, σmaxpI , determination
3.2.1 SA 508 steel [1]
In Lee’s work the σpI values at fracture (critical cleavage stress) waspresumably obtained at each test temperature by using the McMeeking’sFE solutions [5] with CL2 model. Based on the critical stress obtained for22NiMoCr3-7 and A508 steels with CT(1T) geometry [6], it appears thatthe stress values indicated in Lee’s work are anomalously high, especiallywhen considering that they were obtained with a PCVN geometry [7]. Itis reminded that the results presented by McMeeking are based on a SSYassumption, plane strain analysis, and imposing an asymptotic dependenceon mode I elastic crack–tip singular field (for more details see [5]). Similarcalculations to those presented by McMeeking were made in our study butusing the tensile stress–plastic strain curves inferred from the material datagiven by Lee (labelled CL1).
4

FE simulations were performed using software Zebulon [8]. Quadratic elements(8 nodes) with reduced integration were used. The boundary layer radii weremodified in order to verify SSY conditions varying from 6 mm to 225 mm forKJc values included between 36.3 and 150 MPa
√m.
σpI profiles corresponding to the experimental KJc values given by [1] arereported in fig. 2a. This stress reaches a maximum at a distance, Xc. In fig. 2b,the stress profiles corresponding to CL2 model are reported. The maximumvalues of σpI for each experimental KJc value are given in Table. 2 where thevalues reported by Lee are also given.
−75◦C ,KIc = 150MPa√
m−100◦C ,KIc = 81MPa
√m
−140◦C ,KIc = 71MPa√
m−196◦C ,KIc = 36.4MPa
√m
x/(KIc/σY )2
σpI/σ
Y
0.0150.0100.0050.000
5.0
4.0
3.0
2.0
1.0
0.0−75◦C ,KIc = 150MPa
√m
−100◦C ,KIc = 81MPa√
m−140◦C ,KIc = 71MPa
√m
−196◦C ,KIc = 36.4MPa√
m
x/(KIc/σY )2
σpI/σ
Y
0.0150.0100.0050.000
5.0
4.0
3.0
2.0
1.0
0.0
a b
Fig. 2. Maximal principal stress profiles obtained in SSY conditions for SA 508 steela) with CL1 model b) with CL2 model
From these results, two main conclusions can be drawn : (i) The maximumprincipal stress, σmax
pI , values reported by Lee are much higher than thoseobtained from simulations with SSY assumption using the stress–strain curvesof SA 508 steel (CL1 model). (ii) The σmax
pI values reported by Lee are veryclose to those obtained from simulations with SSY assumption using CL2model. Similar values are obtained, except at −196◦C were simulations givelower values. From these results it is inferred that the results presented byLee were obtained using CL2 model as constitutive law for SA 508. Based onfig. 1b, it appears that this hypothesis leads to stress levels much larger thanthose expected from the material properties. It is then concluded that theσmax
pI values reported in Lee’s work were largely overestimated, and, that thecritical carbide sizes calculated from these values were overly underestimated.Plane strain and full 3D simulations of PCVN specimens were also performed.σmax
pI values are reported in Table. 2 while σpI stress profiles obtained ateach test temperatures are shown in fig. 3. It is observed that when the testtemperature is higher than −100◦C , the SSY assumptions are no longer valid.This result is observed for both plane strain and 3D simulations. Thereforethe σmax
pI value is lower than that predicted from SSY assumption.
5

σmaxpI (MPa)
−196◦C −140◦C −100◦C −75◦C
SSY, Lee [1] 3770 2866 2441 2235
SSY + CL1 2694 2192 1954 1844
SSY + CL2 3251 2757 2437 2302
PCVN 3D + CL1 2730 2168 1908 1785
Table 2Comparison between maximum principal stress values, (σmax
pI ), obtained with smallscale yielding assumption (SSY) and full 3D simulations of PCVN tests using twodifferent constitutive laws (CL1 and CL2).
−75◦C ,KJc = 150MPa√
m−100◦C ,KJc = 81MPa
√m
−140◦C ,KJc = 71MPa√
m−196◦C ,KJc = 36.4MPa
√m
Plane strain
x/(KJc/σY )2
σpI/σ
Y
0.0150.010.0050
5.0
4.0
3.0
2.0
1.0
0.0−75◦C ,KJc = 150MPa
√m
−100◦C ,KJc = 81MPa√
m−140◦C ,KJc = 71MPa
√m
−196◦C ,KJc = 36.4MPa√
m
3D
x/(KJc/σY )2
σpI/σ
Y
0.0150.010.0050
5.0
4.0
3.0
2.0
1.0
0.0
a b
Fig. 3. Principal stress profiles in the mid–section of a PCVN specimencorresponding to the experimental fracture toughness values for SA 508 steel. a)Plane strain b) 3D simulations.
3.2.2 22NiMoCr3-7 steel
In order to determine the σmaxpI values corresponding to the KJc values
obtained with this steel, 3D simulations of CT(1T) tests were performed.A good agreement between experimental and simulated load–CMOD curveswere obtained at different temperatures. The calculated values of σmax
pI arereported in Table 3.
3.3 Determination of the critical parameters
Based on the obtained values for σmaxpI and keeping the Lee’s assumptions
according to which cleavage fracture is stress controlled by the propagation ofa microcrack located through the carbides thickness, the critical carbide sizes
6

was calculated by the authors [1] using a modified Griffith equation given by :
dc =4Eγp
π(1 − ν2)(σmaxpI )2
(2)
where γp is the effective surface energy (equal to 7 J/m2 in Lee’s work), ν is thePoisson’s ratio. The calculated results based on PCVN specimens simulationsusing the constitutive equation CL1 for SA 508 steel and experimental tensilestress–plastic strain for 22NiMoCr3-7 steel are reported in Table 3. σmax
pI valuesobtained with both plane strain and 3D simulations are reported in Table. 3for SA 508 steel. These results show that the σmax
pI values obtained from 3Dsimulations are very close to those calculated from plane strain assumption.The evolution of the critical carbide sizes with temperature is reported infig. 4 where Lee’s results are also included. As already indicated by Lee forSA 508 steel, the critical carbide size, dc, increases linearly with increasingtest temperature, but for SA 508 steel the values obtained in the presentstudy are higher due to the lower σmax
pI values obtained. Referring to the CSDgiven by Lee, at the highest test temperature, a very few number of the carbideparticles will be eligible to participate to the nucleation of microcracks. Resultsobtained for 22NiMoCr3-7 steel tested at higher temperature show a weakertemperature dependence of the critical carbide size. However it is observedthat at similar temperature (∼ −80◦C ), both materials lead to similar valuesfor the critical size of carbides particles (∼ 0.7µm), as expected due to thesimilarity of these materials.
22NiMoCr3-7 3DSA 508 ref.[1]
SA 508 3DSA 508 Plane strain
T (◦C )
Critica
lca
rbid
esize
,d
c(µ
m)
-20-50-80-110-140-170-200
0.8
0.7
0.6
0.5
0.4
0.3
0.2
0.1
0
Fig. 4. Critical cardide size (dc) vs test temperature for SA 508 steel and22NiMoCr3-7 steel.
4 Statistical model
Lee showed that the probability of finding carbides larger than a given size,d, is given by :
7
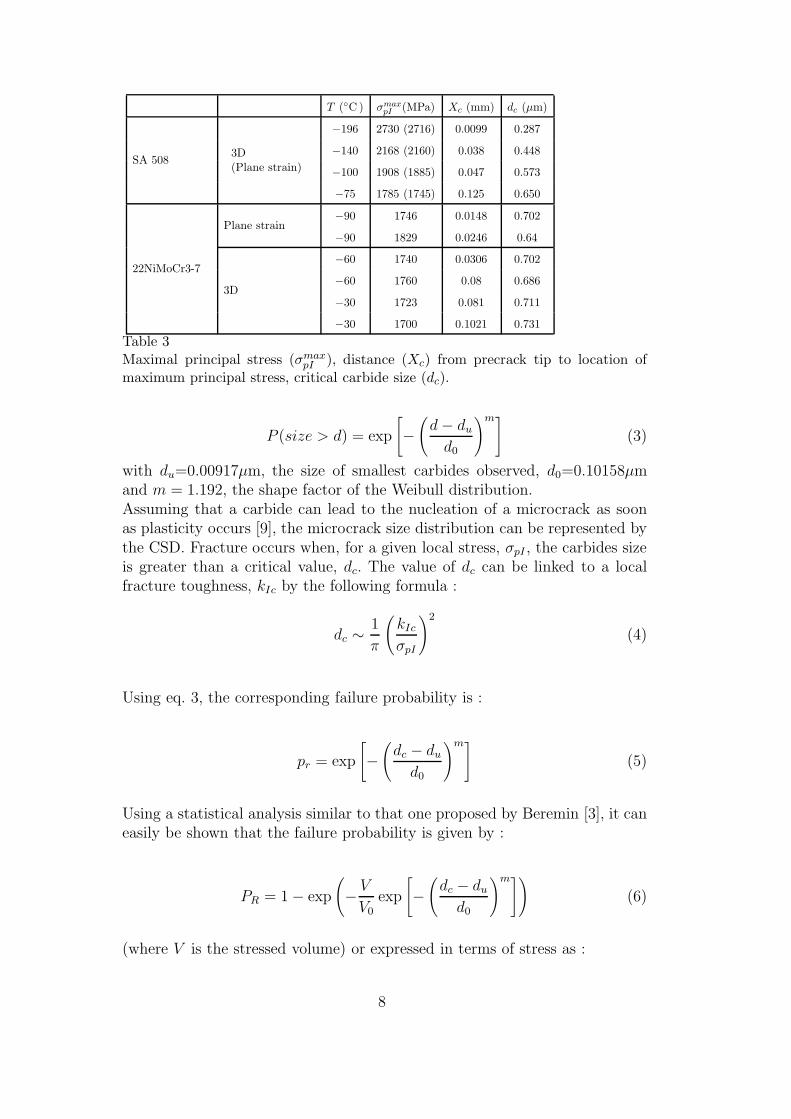
T (◦C ) σmaxpI (MPa) Xc (mm) dc (µm)
SA 5083D(Plane strain)
−196 2730 (2716) 0.0099 0.287
−140 2168 (2160) 0.038 0.448
−100 1908 (1885) 0.047 0.573
−75 1785 (1745) 0.125 0.650
22NiMoCr3-7
Plane strain−90 1746 0.0148 0.702
−90 1829 0.0246 0.64
3D
−60 1740 0.0306 0.702
−60 1760 0.08 0.686
−30 1723 0.081 0.711
−30 1700 0.1021 0.731
Table 3Maximal principal stress (σmax
pI ), distance (Xc) from precrack tip to location ofmaximum principal stress, critical carbide size (dc).
P (size > d) = exp
[−(
d − du
d0
)m](3)
with du=0.00917µm, the size of smallest carbides observed, d0=0.10158µmand m = 1.192, the shape factor of the Weibull distribution.Assuming that a carbide can lead to the nucleation of a microcrack as soonas plasticity occurs [9], the microcrack size distribution can be represented bythe CSD. Fracture occurs when, for a given local stress, σpI , the carbides sizeis greater than a critical value, dc. The value of dc can be linked to a localfracture toughness, kIc by the following formula :
dc ∼ 1
π
(kIc
σpI
)2
(4)
Using eq. 3, the corresponding failure probability is :
pr = exp
[−(
dc − du
d0
)m](5)
Using a statistical analysis similar to that one proposed by Beremin [3], it caneasily be shown that the failure probability is given by :
PR = 1 − exp
(− V
V0exp
[−(
dc − du
d0
)m])(6)
(where V is the stressed volume) or expressed in terms of stress as :
8

PR = 1 − exp
− V
V0exp
−
1
σ2pI
− 1σ2
u
1σ20
m (7)
where σ0 ∼ 1π1/2
kIc
d1/20
. In Eq. 6, the carbide size threshold, du, is equivalent
to the introduction of a stress threshold, σu, such that du ∼ 1π
(kIc
σu
)2. This
expression leads to PR → 0 when the stress is close to 0 and to PR → eV/V0−1eV/V0
when σpI → σu. For sufficiently large values of V/V0, PR tends toward 1.
4.1 Adjustment of the model parameters
Among the four model parameters, σu, σ0, m and V0, the m value is given byLee, i.e. m = 1.192. It is assumed that this value represents also the CSD forthe 22NiMoCr3-7 steel. The reference volume, V0 is chosen following Beremin’swork [3], i.e. as a cubic volume containing about 8 prior austenite grains :50 × 50 × 50µm3. Parameters σu and σ0 were fitted to data obtained fromPVCN tests on SA 508 steel. Actually only the σu parameter has to be fittedon experimental data because it can easily be shown that σu/σ0 = (d0/du)
1/2.In SA 508 steel, σu/σ0 = 3.328 was obtained from Lee. In order to investigatethe predictive capability of the model the parameter σu was determined usingSA 508 fracture toughness measured at −100◦C such that a failure probabilityclose to 50% (45%) was obtained for KJc = 82.9MPa
√m.
5 Results and discussion
Figure 5a shows the evolution of the PR as a function of the KJc obtainedfrom the simulations of PCVN tests for SA 508 steel at the test temperatures.In this figure the experimental KJc values are represented by a full circle.Using the KJc value at −100◦C to fit σu (fig. 5a) leads to σu = 14000MPaand σ0 = 4300MPa. In fig. 5a, it is shown that fitting the σu parameter at−100◦C tends to high PR values for the experimental data obtained at lowertemperatures. It is clear that testing the applicability of the present model tothe results published by Lee [1] would require a set of experimental resultsmuch larger than that reported in their publication.The statistical model was then applied to predict the experimental toughnessscattering obtained on 22NiMoCr3-7 steel for which a wider data base wasavailable. The 3D numerical simulations of CT(1T) tests were post–processedin order to evaluate the failure probabilities. For each test temperature,the KJc values corresponding to PR= 10%, 50% and 90% are shown in
9

fig. 5b. Using σu = 14000MPa leads to a good prediction of the experimentalscattering at all test temperatures investigated (fig. 5b).
−75◦C , ρ = 5µm−100◦C , ρ = 5µm−140◦C , ρ = 5µm−196◦C , ρ = 2µm
KJc (MPa√
m)
PR
20016012080400
1
0.8
0.6
0.4
0.2
0
PR = 90%PR = 50%PR = 10%exp. scatter CT(1T)
ρ = 5µmρ = 5µm
ρ = 2µm
T (◦C)K
Jc(1
T)(
MPa)
0-20-40-60-80-100
200
150
100
50
0
a b
Fig. 5. Evolution of the failure probabilities obtained with the statistical model.a) σu = 14000 MPa fitted on SA 508 results at −100◦C on PCVN geometry(σ0 = 4200MPa, n = 1.192, V0 = 0.000125mm3) b) Prediction of the fracturetoughness scattering on 22NiMoCr3-7 steel with CT(1T) geometry. ρ is the initialmesh crack tip radius.
6 Summary — Conclusions
(1) Anomalously large values for the cleavage stress reported by Lee et al [1]are likely due to two effects in their analysis : (i) the use of a constitutivelaw for SA 508 steel in Mc Meeking numerical calculations which largelyoverestimates the stress–strain curves for this material; (ii) the use ofplane strain SSY assumption which does not apply when the fracturetoughness (i.e. test temperature) is too high.
(2) Lee’s results concerning carbide size distribution are used in a newstatistical model based on the weakest link concept to predict thevariation of fracture toughness with temperature in SA 508 steel.
(3) This model is also applied to another steel (22NIMoCr3-7) for whicha larger data base was available, using the CSD measured by Lee. Agood agreement between experimental and predicted scattering for thefracture toughness is obtained provided that the parameters appearingin this model are correctly fitted.
References
[1] S. Lee, S. Kim, B. Hwang, B. Lee, C. Lee, Acta Mater. 50 (2002) 4755–4762.
10

[2] D. Curry, J. Knott, Metal Science (1979) 341–345.
[3] F. Beremin, Met. Trans. 14A (1983) 2277–2287.
[4] Wallin, K. and Saario, T. and Torronen, K., Metal Science 18 (1984) 13–16.
[5] R. McMeeking, J. Mech. Phys. Solids 25 (1977) 357–381.
[6] B. Tanguy, J. Besson, R. Piques, A. Pineau, in: A. Neimitz, I. Rokach,D. Kocanda, K. Golos (Eds.), ECF 14 , Fracture Mechanics beyond 2000, Vol.III, EMAS Publishing, Sheffield, 2002.
[7] J. Joyce, R. Tregoning, Eng. Fract. Mech. 68 (2001) 861–894.
[8] J. Besson, R. Foerch, Computer Methods in Applied Mechanics and Engineering142 (1997) 165–187.
[9] F. Mudry, Nuclear Engineering and Design 105 (1987) 65–76.
11