COMIC: A tool for composite indices evaluation
37
COMIC: A tool for composite indices evaluation P. Massoli, M. Mazziotta, A. Pareto, C. Rinaldelli Padua, 17th -18th September 2015
Transcript of COMIC: A tool for composite indices evaluation

COMIC: A tool for composite indices
evaluation
P. Massoli, M. Mazziotta, A. Pareto, C. Rinaldelli
Padua, 17th -18th September 2015
Contents
1. Objectives
2. Software requisites
3. What the software can do?
4. Implemented methods
5. Directory tree
6. Input data
Graphical user interface
7. Output data
The “Table of Contents” file
Plots & Tables
8. Further developments
COMIC: A tool for composite indices evaluation
Padua, 17th -18th September 2015
1
Objectives
2
COMIC = COMposite Indices Creator
It has been entirely developed by the authors who are members of the
BES Committee at the Italian Institute of Statistics - ISTAT
This software enables the user to:
calculate composite indices and their subsequent ranks
compare differnt methods of calculation in order to choose the most
appropriate one with ease
Write efficient reports about the results obtained
COMIC: A tool for composite indices evaluation
Padua, 17th -18th September 2015

Software requisites
3
COMIC has been requested to be entirely written in SAS in order to allow experts within the BES Committee to partecipate actively in the implementation and integration of the methods of composition.
COMIC is relatively easy to use and it doesn’t necessitate installation: one simply copies the software on their computer (indipendently of the operative system: Windows, Linux, Unix, ...).
No particular skills are needed to run the software.
COMIC has been developed by using a SAS System Base setup and thus, no particular and specific SAS packages are required as these could hinder its use.
COMIC: A tool for composite indices evaluation
Padua, 17th -18th September 2015

What the software can do?
4
It deals with data pertaining to any type of statistical unit. It currently optimizes
calculations when dealing with statistical units like: regions and groups thereof
(macroregions)
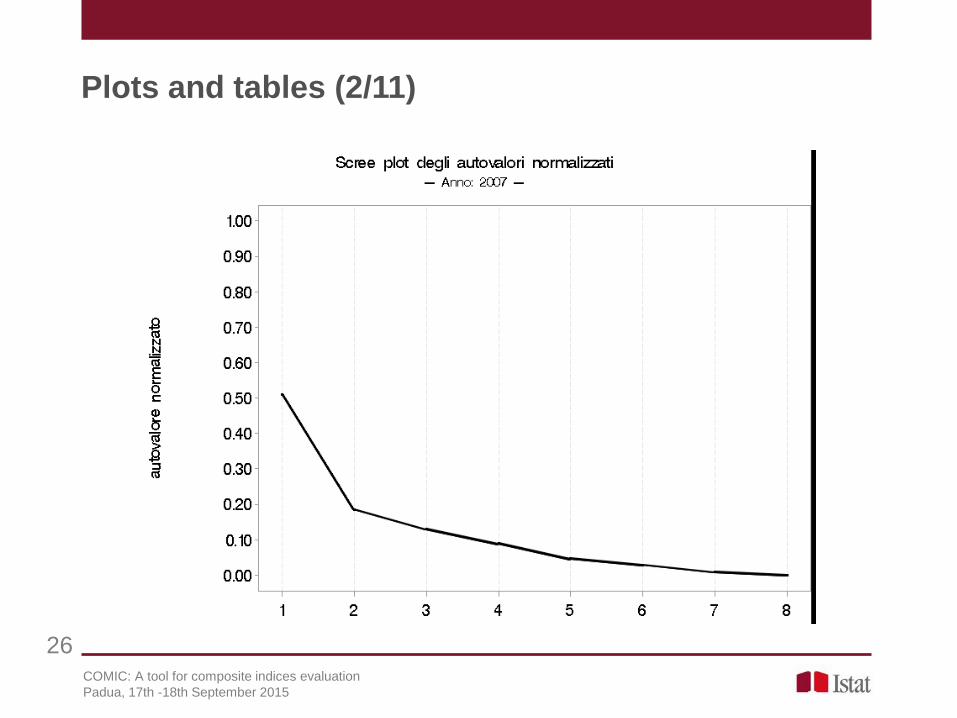
It performs exploratory analysis of the input data (Correlation matrox, ACP,
Factor analysis, communalities, scree plots, matrix plots, …)
It evaluates the rank for each synthesys method or composite index selected
It creates geographical maps of the values of the composite indices (solely for
those statistical units for which it makes sense)
It creates historical series of the composite indices (solely in the case of input
data relevant to two or more time periods)
It creates “speed-acceleration plots (if both a static and a dynamic methods are
selected)
It compares the methods selected by means of cograduation matrices and
scatterplots
It performs an Influence analysus (reports and plots)
COMIC: A tool for composite indices evaluation
Padua, 17th -18th September 2015
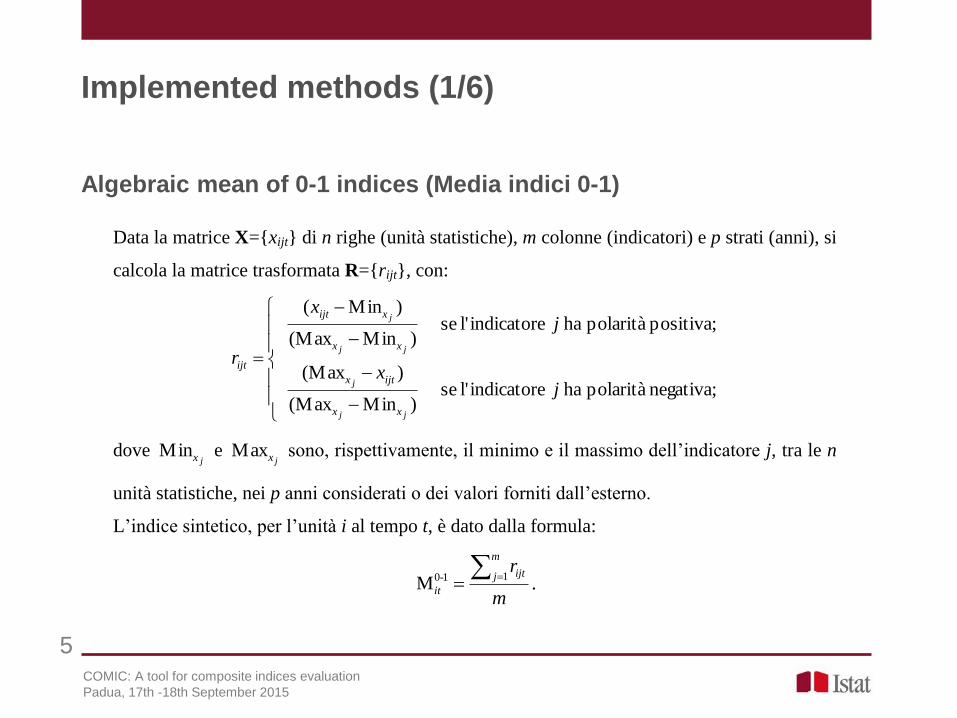
Implemented methods (1/6)
5
Data la matrice X={xijt} di n righe (unità statistiche), m colonne (indicatori) e p strati (anni), si
calcola la matrice trasformata R={rijt}, con:
negativa; polarità ha indicatorel' se )Min(Max
)(Max
positiva; polarità ha indicatorel' se )Min(Max
)Min(
jx
jx
r
jj
j
jj
j
xx
ijtx
xx
xijt
ijt
dove jxMin e
jxMax sono, rispettivamente, il minimo e il massimo dell’indicatore j, tra le n
unità statistiche, nei p anni considerati o dei valori forniti dall’esterno.
L’indice sintetico, per l’unità i al tempo t, è dato dalla formula:
m
rm
j ijt
it
11-0M .
Algebraic mean of 0-1 indices (Media indici 0-1)
COMIC: A tool for composite indices evaluation
Padua, 17th -18th September 2015

Implemented methods (2/6)
6
Data la matrice X={xijt} di n righe (unità statistiche), m colonne (indicatori) e p strati (anni), si
calcola la matrice trasformata Z={zijt}, con:
negativa; polarità ha indicatorel' se S
)M(
positiva; polarità ha indicatorel' se S
)M(
jx
jx
z
jt
jt
jt
jt
x
xijt
x
xijt
ijt
dove jtxM e
jtxS sono, rispettivamente, la media e lo scostamento quadratico medio
dell’indicatore j al tempo t.
L’indice sintetico, per l’unità i al tempo t, è dato dalla formula:
m
zm
j ijtz
it
1M .
Algebraic mean of z-scores (Media z-scores)
COMIC: A tool for composite indices evaluation
Padua, 17th -18th September 2015

Implemented methods (3/6)
7
Data la matrice X={xijt} di n righe (unità statistiche), m colonne (indicatori) e p strati (anni), si
calcola la matrice trasformata Z={zijt}, con:
negativa; polarità ha indicatorel' se 10 S
)M(100
positiva; polarità ha indicatorel' se 10S
)M(100
jx
jx
z
jt
jt
jt
jt
x
xijt
x
xijt
ijt
dove jtxM e
jtxS sono, rispettivamente, la media e lo scostamento quadratico medio
dell’indicatore j al tempo t. L’indice sintetico, per l’unità i al tempo t, è dato dalla formula:
itzzit ititcvSMMPI -/
dove m
zm
j ijt
zit
1M ;
m
zm
j zijt
z
it
it
1
2)M(S ;
it
it
z
z
itM
Scv .
MPI (Mazziotta-Pareto Index)
COMIC: A tool for composite indices evaluation
Padua, 17th -18th September 2015

Implementedmethods (4/6)
8
Data la matrice X={xijt} di n righe (unità statistiche), m colonne (indicatori) e p strati (anni), si
calcola la matrice trasformata R={rijt}, con:
negativa; polarità ha indicatorel' se 7060)Min(Max
)(Max
positiva; polarità ha indicatorel' se 7060)Min(Max
)Min(
jx
jx
r
jtjt
j
jtjt
jt
xx
ijtx
xx
xijt
ijt
dove jtxMin e
jtxMax sono, rispettivamente, il minimo e il massimo dell’indicatore j, tra le n
unità statistiche, nei p anni considerati o dei valori calcolati in modo da porre uguale a 100 un
valore di riferimento (per es., la media nazionale nell’anno base).
L’indice sintetico, per l’unità i al tempo t, è dato dalla formula:
itrrit ititcvSMMPI -/
.
AMPI (Adjusted MPI)
COMIC: A tool for composite indices evaluation
Padua, 17th -18th September 2015

Implemented methods (5/6)
9
Data la matrice X={xijt} di n righe (unità statistiche), m colonne (indicatori) e p strati (anni),
l’indice sintetico ‘statico’, per l’unità i al tempo t, è dato dalla formula:
m
j
m
bjt
ijt
itx
x
1
1
100JS
dove bjtx è il valore base dell’indicatore j al tempo t (per es., la media nazionale nell’anno di
riferimento). L’indice sintetico ‘dinamico’, per l’unità i al tempo t, è dato dalla formula:
m
j
m
tij
ijt
itx
x
1
1
)1(
100JD
dove )1( tijx è il valore dell’indicatore j, per l’unità i al tempo t-1.
Jevons index: static and dynamic
COMIC: A tool for composite indices evaluation
Padua, 17th -18th September 2015
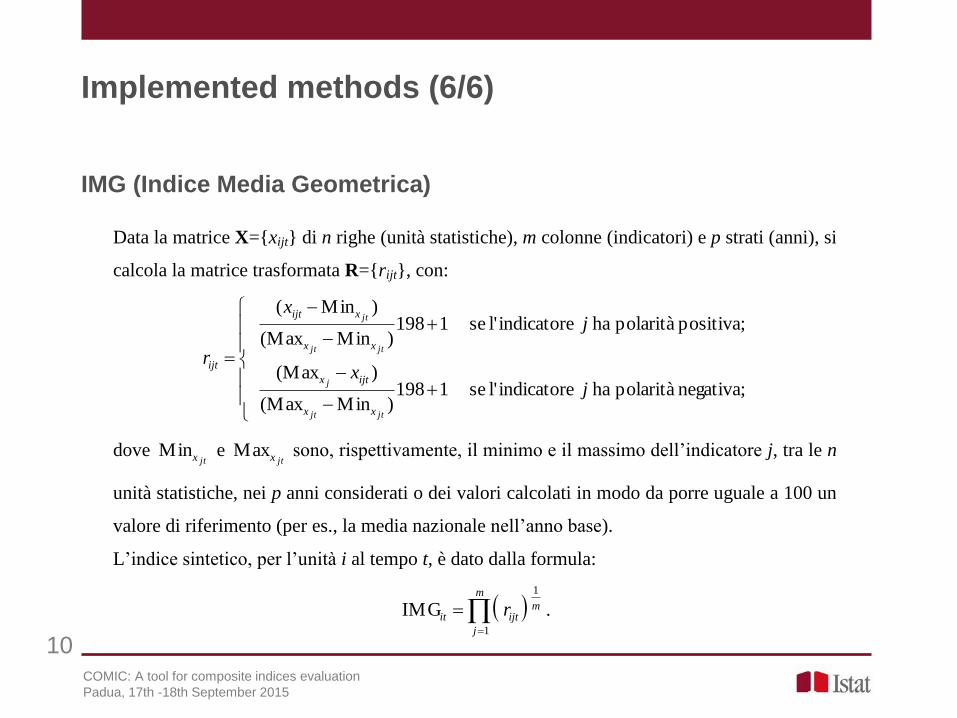
Implemented methods (6/6)
10
Data la matrice X={xijt} di n righe (unità statistiche), m colonne (indicatori) e p strati (anni), si
calcola la matrice trasformata R={rijt}, con:
negativa; polarità ha indicatorel' se 1198)Min(Max
)(Max
positiva; polarità ha indicatorel' se 1198)Min(Max
)Min(
jx
jx
r
jtjt
j
jtjt
jt
xx
ijtx
xx
xijt
ijt
dove jtxMin e
jtxMax sono, rispettivamente, il minimo e il massimo dell’indicatore j, tra le n
unità statistiche, nei p anni considerati o dei valori calcolati in modo da porre uguale a 100 un
valore di riferimento (per es., la media nazionale nell’anno base).
L’indice sintetico, per l’unità i al tempo t, è dato dalla formula:
m
j
mijtit r
1
1
IMG .
IMG (Indice Media Geometrica)
COMIC: A tool for composite indices evaluation
Padua, 17th -18th September 2015
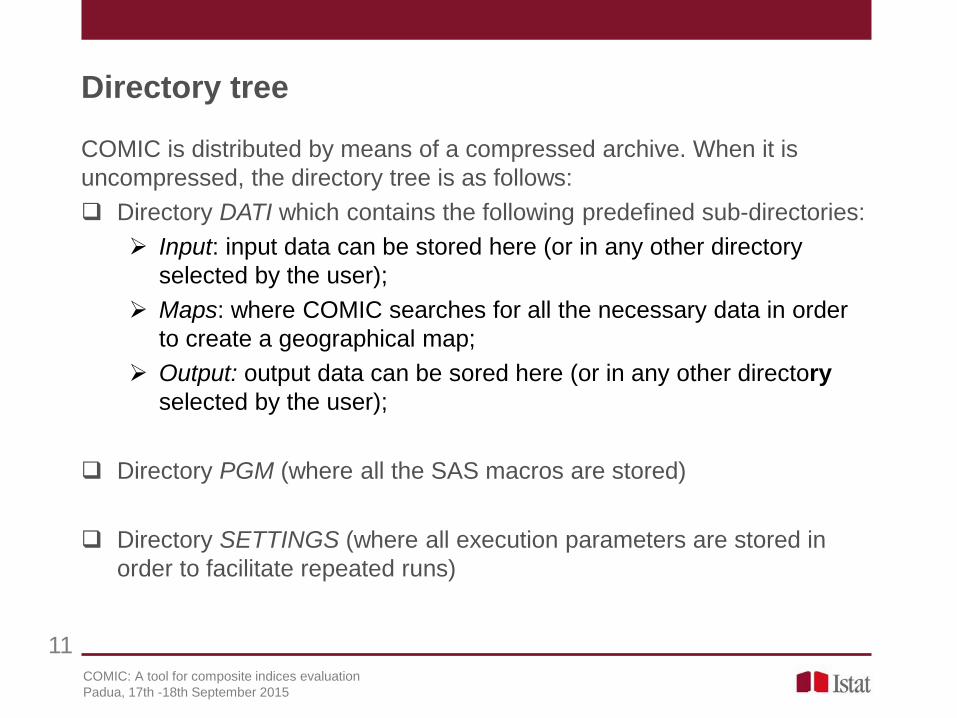
Directory tree
11
COMIC is distributed by means of a compressed archive. When it is
uncompressed, the directory tree is as follows:
Directory DATI which contains the following predefined sub-directories:
Input: input data can be stored here (or in any other directory
selected by the user);
Maps: where COMIC searches for all the necessary data in order
to create a geographical map;
Output: output data can be sored here (or in any other directory
selected by the user);
Directory PGM (where all the SAS macros are stored)
Directory SETTINGS (where all execution parameters are stored in
order to facilitate repeated runs)
COMIC: A tool for composite indices evaluation
Padua, 17th -18th September 2015

Input data (1/2)
12
Four input data set types can be selected:
Microsoft Excel Worksheet (.xls not .xlsx)
ASCII - Comma Separated Values (.csv)
ASCII - Tab Separated Values (.txt)
SAS data set
Metodi per la costruzione di indici sintetici: teoria e pratica – P. Massoli
Roma, 6-7 novembre 2014
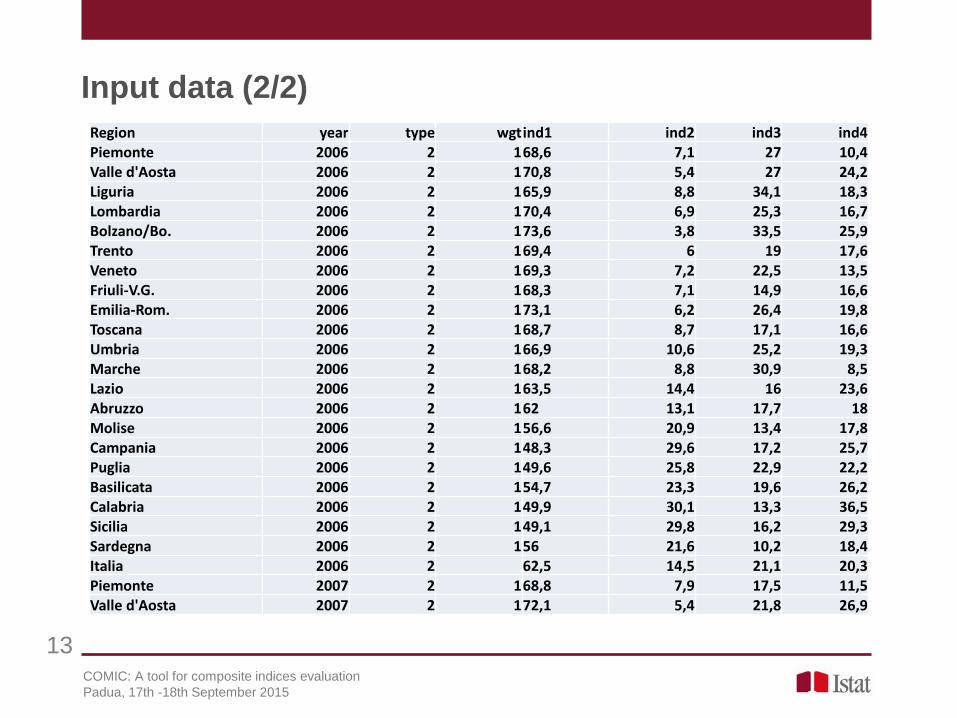
Input data (2/2)
13 COMIC: A tool for composite indices evaluation
Padua, 17th -18th September 2015
Region year type wgt ind1 ind2 ind3 ind4 Piemonte 2006 2 1 68,6 7,1 27 10,4 Valle d'Aosta 2006 2 1 70,8 5,4 27 24,2 Liguria 2006 2 1 65,9 8,8 34,1 18,3 Lombardia 2006 2 1 70,4 6,9 25,3 16,7 Bolzano/Bo. 2006 2 1 73,6 3,8 33,5 25,9 Trento 2006 2 1 69,4 6 19 17,6 Veneto 2006 2 1 69,3 7,2 22,5 13,5 Friuli-V.G. 2006 2 1 68,3 7,1 14,9 16,6 Emilia-Rom. 2006 2 1 73,1 6,2 26,4 19,8 Toscana 2006 2 1 68,7 8,7 17,1 16,6 Umbria 2006 2 1 66,9 10,6 25,2 19,3 Marche 2006 2 1 68,2 8,8 30,9 8,5 Lazio 2006 2 1 63,5 14,4 16 23,6 Abruzzo 2006 2 1 62 13,1 17,7 18 Molise 2006 2 1 56,6 20,9 13,4 17,8 Campania 2006 2 1 48,3 29,6 17,2 25,7 Puglia 2006 2 1 49,6 25,8 22,9 22,2 Basilicata 2006 2 1 54,7 23,3 19,6 26,2 Calabria 2006 2 1 49,9 30,1 13,3 36,5 Sicilia 2006 2 1 49,1 29,8 16,2 29,3 Sardegna 2006 2 1 56 21,6 10,2 18,4 Italia 2006 2 62,5 14,5 21,1 20,3 Piemonte 2007 2 1 68,8 7,9 17,5 11,5 Valle d'Aosta 2007 2 1 72,1 5,4 21,8 26,9

Graphical User Interface (1/6)
14
In order that COMIC may be used even by users with low software skills,
a simple but effective graphic user interface has been created:
The %WINDOW/%DISPLAY SAS Base macro facility has been
implemented in order to catch all the variables/parameters necessary
for a correct COMIC run.
Users communicate with COMIC only by using the GUI (no SAS code
needs to be written).
Many calculations take place automatically and all the data caught by
using the GUI is saved in ASCII files in the SETTINGS directory.
COMIC: A tool for composite indices evaluation
Padua, 17th -18th September 2015

Graphical User Interface: menu (2/6)
15 COMIC: A tool for composite indices evaluation
Padua, 17th -18th September 2015
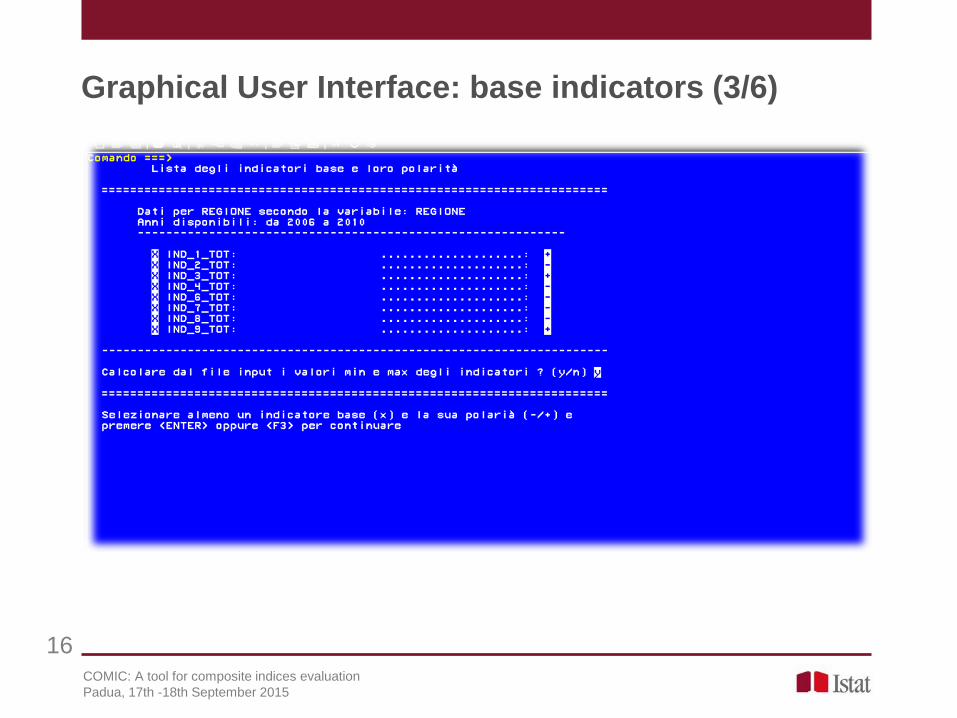
Graphical User Interface: base indicators (3/6)
16 COMIC: A tool for composite indices evaluation
Padua, 17th -18th September 2015

Graphical User Interface: weights (4/6)
17 COMIC: A tool for composite indices evaluation
Padua, 17th -18th September 2015

Graphical User Interface: min/max values (5/6)
18 COMIC: A tool for composite indices evaluation
Padua, 17th -18th September 2015
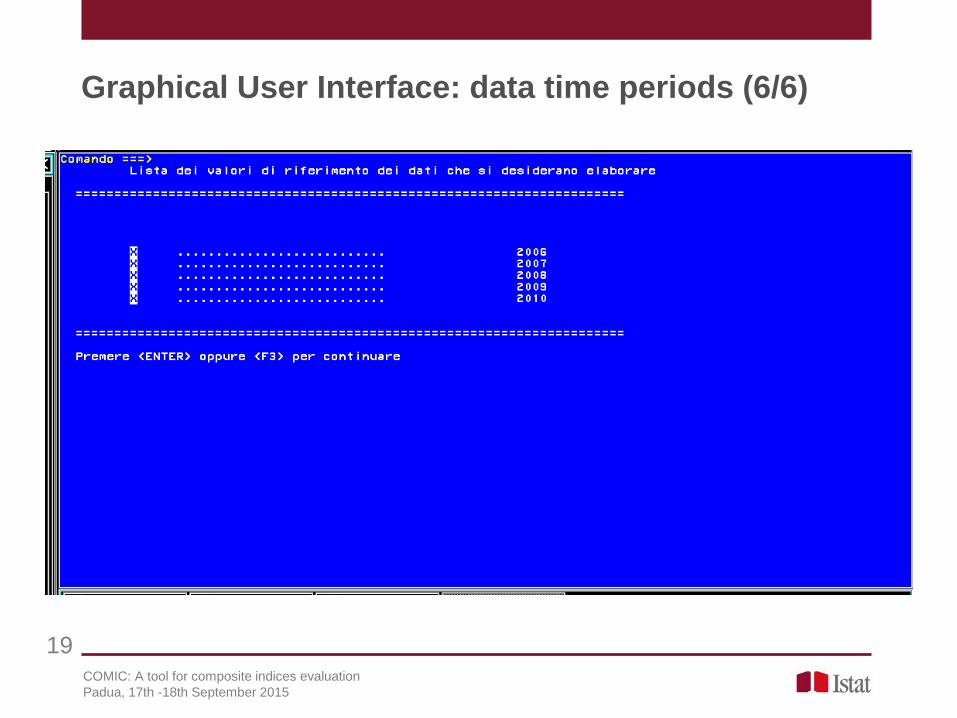
Graphical User Interface: data time periods (6/6)
19 COMIC: A tool for composite indices evaluation
Padua, 17th -18th September 2015
Output data
20
While the software is running, an output sub-directory by the same name
as that of the input data file is created automatically (or overwritten if it
already exists). The directory in question is created within the parent
directory DATI\output or any other directory selected by the user. The
output directory tree in question is as follows:
• Dati: where all the output datasets SAS are saved (ranks, historical
series, …);
• Word: where all the reports in rich text format (rtf) are saved;
• Html: where all the reports written in html language are saved;
In order to facilitate navigation among the reports, a hypertextual “table of
contents” file written in html (sommario.html) is automatically created in
the output directory;
COMIC: A tool for composite indices evaluation
Padua, 17th -18th September 2015

Table of contents (1/4)
21 COMIC: A tool for composite indices evaluation
Padua, 17th -18th September 2015

Table of contents (2/4)
22 COMIC: A tool for composite indices evaluation
Padua, 17th -18th September 2015

Table of contents (3/4)
23 COMIC: A tool for composite indices evaluation
Padua, 17th -18th September 2015
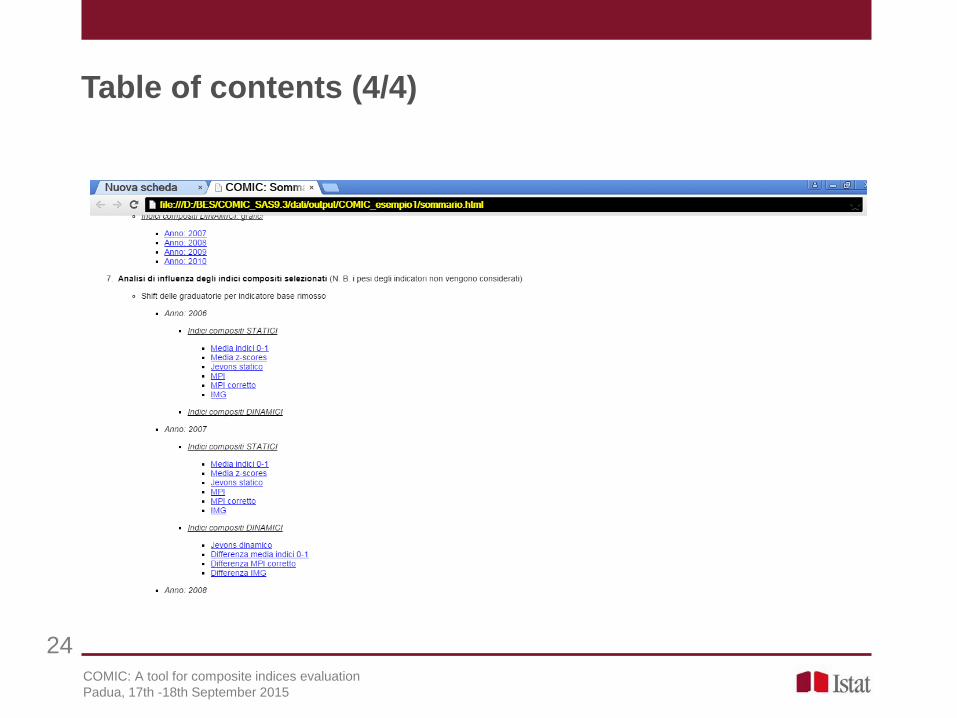
Table of contents (4/4)
24 COMIC: A tool for composite indices evaluation
Padua, 17th -18th September 2015

Plots and tables (1/11)
25 COMIC: A tool for composite indices evaluation
Padua, 17th -18th September 2015
Plots and tables (2/11)
26 COMIC: A tool for composite indices evaluation
Padua, 17th -18th September 2015
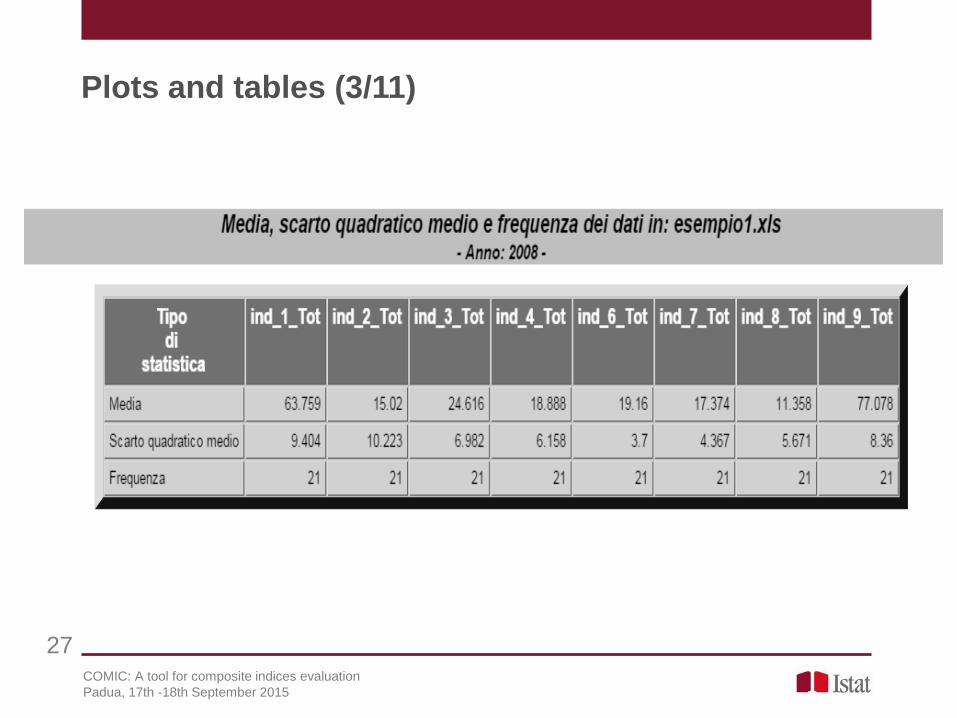
Plots and tables (3/11)
27 COMIC: A tool for composite indices evaluation
Padua, 17th -18th September 2015
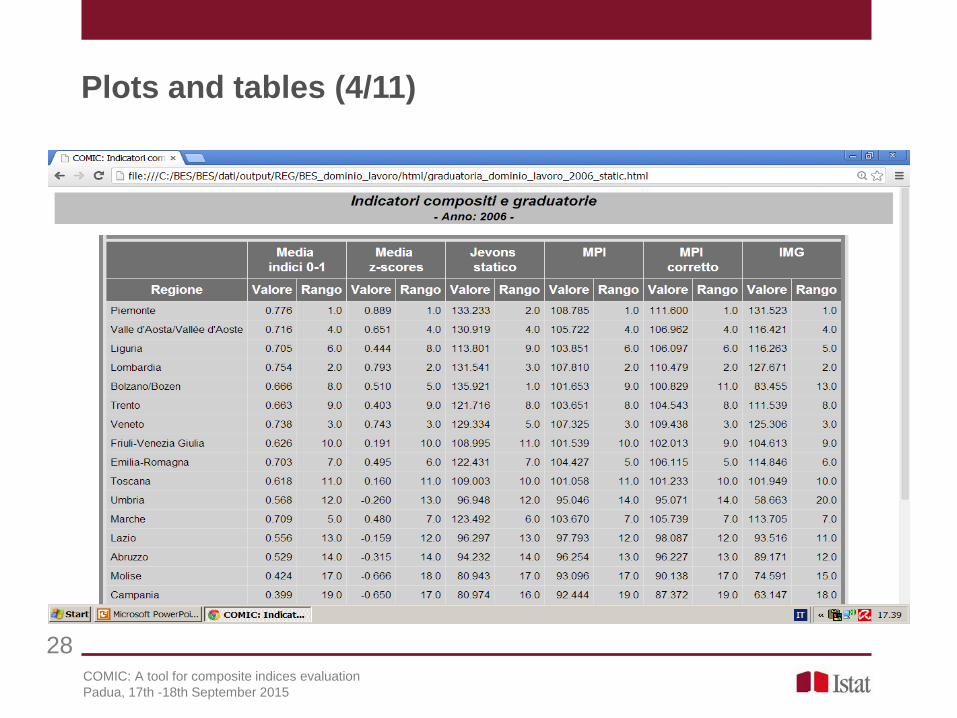
Plots and tables (4/11)
28 COMIC: A tool for composite indices evaluation
Padua, 17th -18th September 2015
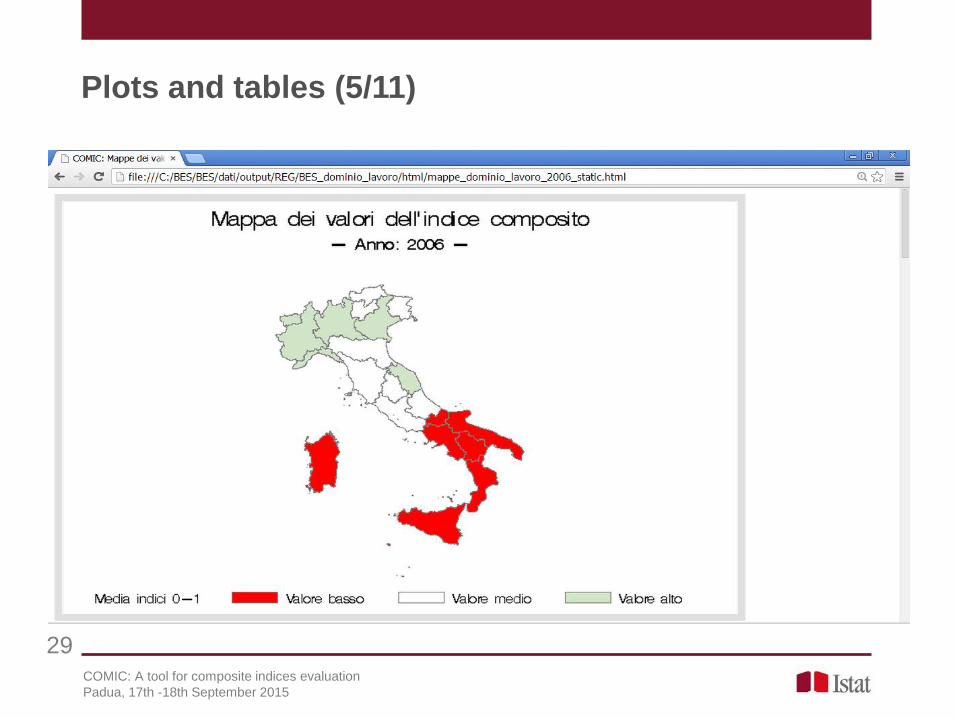
Plots and tables (5/11)
29 COMIC: A tool for composite indices evaluation
Padua, 17th -18th September 2015

Plots and tables (6/11)
30 COMIC: A tool for composite indices evaluation
Padua, 17th -18th September 2015
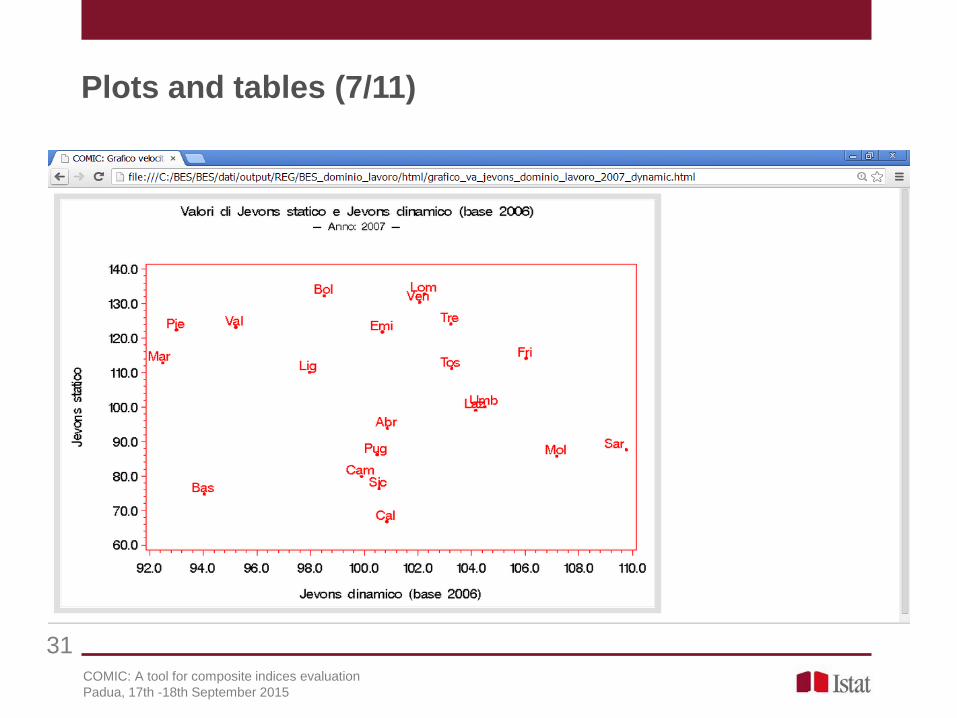
Plots and tables (7/11)
31 COMIC: A tool for composite indices evaluation
Padua, 17th -18th September 2015

Plots and tables (8/11)
32 COMIC: A tool for composite indices evaluation
Padua, 17th -18th September 2015
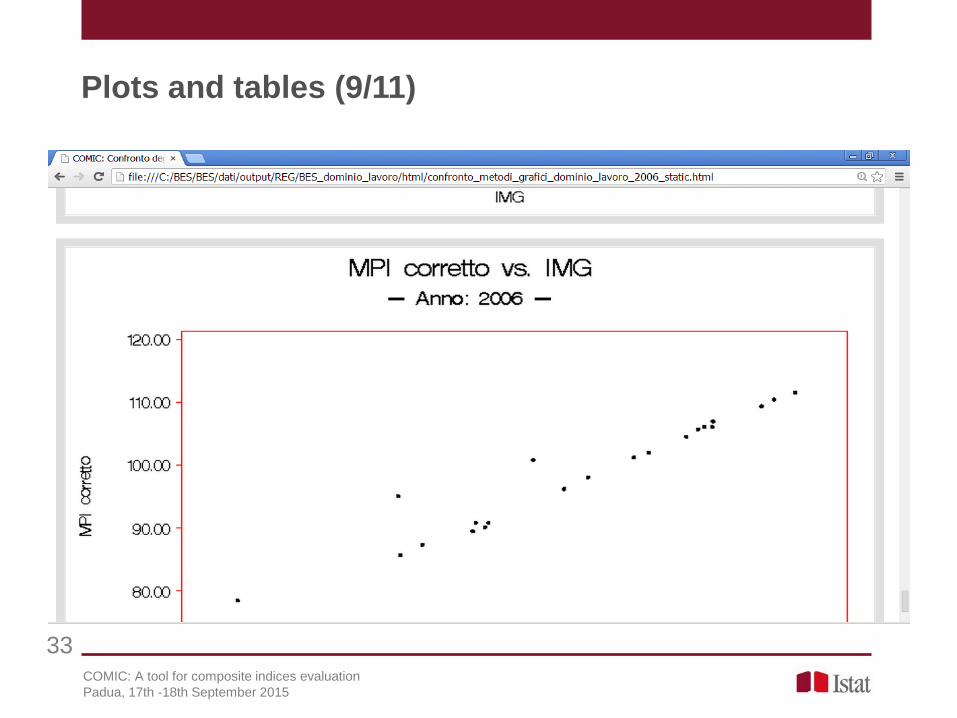
Plots and tables (9/11)
33 COMIC: A tool for composite indices evaluation
Padua, 17th -18th September 2015

Plots and tables (10/11)
34 COMIC: A tool for composite indices evaluation
Padua, 17th -18th September 2015

Plots and tables (11/11)
35 COMIC: A tool for composite indices evaluation
Padua, 17th -18th September 2015

Further developments
36 COMIC: A tool for composite indices evaluation
Padua, 17th -18th September 2015
Some other SAS procedure can be implemented to
enhance exploratory analysis of input data;
World and Europe geograèhical mapping feature will
be added to those already existing;
Another robustness analysis will be added to the
already existing influence analysis in order to better
investigate the implemented methods robustness.