Comfort Securities Limited Daily Research Reports (Daily-Report… · preferred trading strategy...
16
Disclosures and Disclaimer : This report must be read with the disclosures in the Disclosure appendix, and with the Disclaimer, which forms part of it. This document does not contain any investment views or opinions. Comfort Securities Limited Daily Research Reports You will enjoy all the comforts of financial world when you alight with us.
Transcript of Comfort Securities Limited Daily Research Reports (Daily-Report… · preferred trading strategy...

Disclosures and Disclaimer : This report must be read with the disclosures in the Disclosure appendix, and with the Disclaimer, which forms part of it. This document does not contain any investment views or opinions.
Comfort Securities Limited
Daily Research Reports
You will enjoy all the comforts of financial world when you alight with us.

Comfort
Flows From
WISDOM…
Welcome to
The world out there is uncertain. On this backdrop, the market volatility is bound to increase. Believe us, even the big
investors’ sentiment will oscillate—and that is why it is important for us to safely navigate these difficult times.
To do so, Comfort Securities Ltd. brings you this daily market commentary which will help you to sharpen your instincts
on investments in equity markets, gold, silver, crude-oil, USD/INR, the Dow Jones index, Hang Seng index, Euro-Dollar,
etc. On the next few pages, you can learn more about the same. We would love to answer any further questions you may
have in a one-one discussion.
We are pleased to inform you that this report features contributions from the finest analytical minds in the business and
are distinguished by our proactive consulting approach, timely advice, and specific recommendations. We take
satisfaction in seeing clients realize their dreams.
The Comfort Securities team would like to take this opportunity to thank our readers for their support and feedback over
the years. We hope you enjoyed reading this daily newsletter. Above all, we wish that this experience is both
professionally and personally rewarding.
If you have any queries please do contact me or any member of Comfort Securities Ltd. team and we would be glad to
assist.
Best Regards,
Comfort Securities Ltd.Call Us: Tel: 91-22-28811259
Comfort Securities Ltd.
Comfort Securities Limited
Enjoy Your Comfort Zone.
Invest Smart. Build Wealth.
Welcome Note
Thursday26th July, 2018

Stock Of The Day: (F & O)
Forecast and Analysis
CONTENTSCONTENTS
Enjoy Your Comfort Zone.
Invest Smart. Build Wealth.
Title Page No.
'30,000 feet view’: The big picture of Dalal Street 04-07
Stock Of The Day: (F & O) 08-09
Equity Derivatives 10
Daily Pivot Table (Equities) 11
Forecast and Analysis 12-14
Daily Pivot Table (Commodities) 15
Disclaimer 16
'30,000 feet view’:
The big picture of Dalal Street
'30,000 feet view’:
The big picture of Dalal Street

Enjoy Your Comfort Zone.
Invest Smart. Build Wealth.
'30,000 feet view’: newsletter provides insights and themes for Indian equity markets. We also try and cover international themes for the day. This newsletter is quite popular with traders as it covers the most preferred trading strategy for Sensex/Nifty for the day.
In Chart of the day section, we recommend a stock which is likely to move significantly in the short term, clearly defining the supports, the resistances and bias for the stock.
In a nutshell, '30,000 feet view’: covers themes and insights for the day.
‘30,000 feet view’: The big picture of Dalal Street
www.comfortsecurities.co.inEnjoy Your Comfort Zone.
Invest Smart. Build Wealth.
Nifty Outlook
Intraday
Medium Term
Long Term
Key Levels to Watch
Nifty Support
Nifty Resistance
Pivot Level
Nifty
Outlook for the Day
INDICES
Nifty
Bank Nifty
Nifty Auto Index
Nifty FMCG Index
Nifty Infra Index
Nifty IT Index
Nifty Media Index
Nifty Midcap Index
Nifty Metal Index
Nifty Pharma Index
Nifty Reality Index
Nifty Smallcap Index
Sensex
SGX Nifty
‘30,000 feet view’: The big picture of Dalal Street
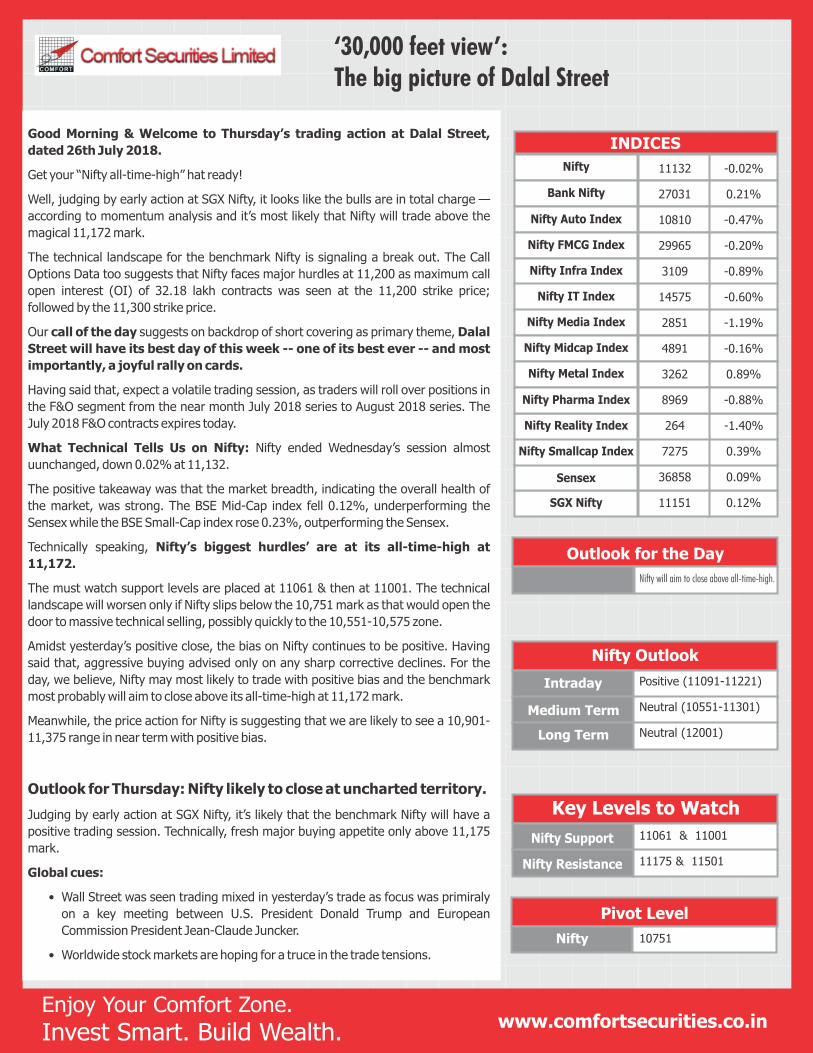
Good Morning & Welcome to Thursday’s trading action at Dalal Street,
dated 26th July 2018.
Get your “Nifty all-time-high” hat ready!
Well, judging by early action at SGX Nifty, it looks like the bulls are in total charge —
according to momentum analysis and it’s most likely that Nifty will trade above the
magical 11,172 mark.
The technical landscape for the benchmark Nifty is signaling a break out. The Call
Options Data too suggests that Nifty faces major hurdles at 11,200 as maximum call
open interest (OI) of 32.18 lakh contracts was seen at the 11,200 strike price;
followed by the 11,300 strike price.
Our call of the day suggests on backdrop of short covering as primary theme, Dalal
Street will have its best day of this week -- one of its best ever -- and most
importantly, a joyful rally on cards.
Having said that, expect a volatile trading session, as traders will roll over positions in
the F&O segment from the near month July 2018 series to August 2018 series. The
July 2018 F&O contracts expires today.
What Technical Tells Us on Nifty: Nifty ended Wednesday’s session almost
uunchanged, down 0.02% at 11,132.
The positive takeaway was that the market breadth, indicating the overall health of
the market, was strong. The BSE Mid-Cap index fell 0.12%, underperforming the
Sensex while the BSE Small-Cap index rose 0.23%, outperforming the Sensex.
Technically speaking, Nifty’s biggest hurdles’ are at its all-time-high at
11,172.
The must watch support levels are placed at 11061 & then at 11001. The technical
landscape will worsen only if Nifty slips below the 10,751 mark as that would open the
door to massive technical selling, possibly quickly to the 10,551-10,575 zone.
Amidst yesterday’s positive close, the bias on Nifty continues to be positive. Having
said that, aggressive buying advised only on any sharp corrective declines. For the
day, we believe, Nifty may most likely to trade with positive bias and the benchmark
most probably will aim to close above its all-time-high at 11,172 mark.
Meanwhile, the price action for Nifty is suggesting that we are likely to see a 10,901-
11,375 range in near term with positive bias.
Outlook for Thursday: Nifty likely to close at uncharted territory.
Judging by early action at SGX Nifty, it’s likely that the benchmark Nifty will have a
positive trading session. Technically, fresh major buying appetite only above 11,175
mark.
Global cues:
• Wall Street was seen trading mixed in yesterday’s trade as focus was primiraly
on a key meeting between U.S. President Donald Trump and European
Commission President Jean-Claude Juncker.
• Worldwide stock markets are hoping for a truce in the trade tensions.
11132 -0.02%
27031 0.21%
10810 -0.47%
29965 -0.20%
3109 -0.89%
14575 -0.60%
2851 -1.19%
4891 -0.16%
3262 0.89%
8969 -0.88%
264 -1.40%
7275 0.39%
36858 0.09%
11151 0.12%
Nifty will aim to close above all-time-high.
Positive (11091-11221)
Neutral (10551-11301)
Neutral (12001)
11061 & 11001
11175 & 11501
10751

www.comfortsecurities.co.inEnjoy Your Comfort Zone.
Invest Smart. Build Wealth.
Technical Strategy
‘30,000 feet view’: The big picture of Dalal Street
Commodity Cues:
• In commodities, oil prices were trading sideways as rising tension between the
United States and Iran highlighted risks to supply while escalating trade
disputes raised the prospect of slower economic growth and perhaps weaker
energy demand.
• Gold futures traded firm after comments from President Donald Trump on U.S.
interest rates and the dollar that weighed heavily on greenback.
• Copper prices too were trading firm in Wednesday’s trade, attempting to
rebound from its lowest level in a year.
Currencies & Bonds:
• In Wednesday’s trade, the US Dollar index was seen consolidating after getting
pummeled on Friday after President Donald Trump accused China and the
European Union of currency and interest-rate manipulation that he says has put
the U.S. at a disadvantage.
• USD/INR was seen consolidating in Wednesday’s trade. Key interweek support
seen at 68.45. Hurdles now seen at 69.11. Intraday Strategy: Sell at CMP,
targeting 68.45 and then aggressive targets at 67.75-69 zone with stop ABOVE
69.21.
Macro Watch:
• All anxious eyes will also be on the progress on monsoon. The street will also
keep a close eye on the movement of Indian Rupee and the Crude-Oil prices as
that could influence investors’ sentiment.
• Amongst macro data, the street will brace for the announcement of the GDP
data for the second quarter will be released on Friday. Recent US Federal
Reserve minutes highlighted that the US economy continued to look strong.
Economists predict GDP expanded at a 4.2 per cent annualised rate, compared
with a 2 per cent increase at the start of the year.
• The Monsoon session of Parliament began from July 18 and will end on August
10th 2018. The Agenda includes 11 legislative bills currently pending in
parliament for consideration and passing. Nine new bills are also proposed to
be introduced.
IPO Watch:
• HDFC AMC’s Rs 2,800-Crore IPO Subscribed 100% On Day 1.
Stocks To Watch:
• Our chart of the day which suggests establishing long positions in stocks
like EXIDE Industries, HDFC and Reliance Industries.
• Bullish stocks: JSW STEEL, EXIDE, YES BANK, HDFC, TCS, BERGER PAINTS,
TATA ELXSI, BAJAJ FINANCE, MARICO, TCS, INDUSIND BANK.
• Bearish stocks: IDFC, BANK OF INDIA, IDEA CELLULAR.
• Larsen’s Q1 profit jumps 36.1% to Rs 1,215 crore versus Rs 892.5 crore;
revenue increases 18.8 percent to Rs 28,283 crore versus Rs 23,811 crore
(YoY).
BANK NIFTY
Action
Target
Support
Resistance
Holding Period
27031
BUY
27751
26597/26101
27251/27901
14 Days.
In yesterday’s trade, Bank Nifty was seen
attempting a breakout, up 0.21%.
Technically, Bank Nifty is consolidating at higher
levels and signaling a major breakout on the daily
charts.
The index is exhibiting a ‘probable flag’ pattern on
the monthly charts; confirmation of strength
above 27,251 mark.
The momentum oscillators continue to be in buy
mode, supporting the buying rationale. Any move
above 27251 mark needs to be backed by
increases in volumes.
Key support to watch in near term is at 26597
zone. Medium term supports seen at 26101 zone.
Establish long positions at CMP, and on declines
to 26750-26901 zone, targeting 27501 zone and
then at 27901-28001 zone with strict stop at
26101.

www.comfortsecurities.co.inEnjoy Your Comfort Zone.
Invest Smart. Build Wealth.
‘30,000 feet
view’: The big
picture of
Dalal Street
‘30,000 feet view’: The big picture of Dalal Street
• Canara Bank Q1 profit rises 11.7 percent to Rs 281.5 crore versus Rs 251.6
crore; NII jumps 43.1 percent to Rs 3,882.9 crore versus Rs 2,713.2 crore (YoY);
net NPA at 6.91 percent versus Vs 7.48 percent and gross NPA at 11.05 percent
versus 11.84 percent (QoQ).
• Show Me the Money: Buy FEDERAL BANK (CMP 86.90): FEDERAL BANK is
aiming to move above its 7-day higher consolidation zone. Positive bias as long
as 80 support is held. Interweek Strategy: Buy between 83.50-85 zone,
targeting 91 and then more aggressive targets located at 97-101 zone. Stop
below 80..
Q1 TO TRICKLE IN:
• Thursday: Bharti Airtel, Biocon, Dr Reddy's Labs, ITC, Maruti Suzuki, Yes Bank,
CESC, Ajmera Realty, Alembic Pharmaceuticals, Bayer Cropscience, Bharat
Financial Inclusion, Cholamandalam Investment, Colgate Palmolive, Container
Corporation, Control Print, Essel Propack, Force Motors, HeidelbergCement,
Jammu & Kashmir Bank, Jindal Stainless (Hisar), Lakshmi Vilas Bank, NIIT,
Novartis, Orient Green Power, Petronet LNG, Quess Corp, SBI Life Insurance,
Schaeffler, Shemaroo, Shriram Transport Finance, Star Cement, Tata Metaliks,
Tata Power, Tata Coffee, Tinplate Company, City Union Bank.
• Friday: HCL Tech, ICICI Bank, M&M Financial
• Stocks banned in F&O segment for today: ADANI ENT.
Bulls Vs. Bears: Time to Pick a Side!!
Preferred trade on Nifty: Nifty (11132): Buy between 11075-11085 zone,
targeting 11175 and then at 11301-11501 zone with stop at 10871.
Preferred trade on Bank Nifty: Bank Nifty (26974): Establish long positions at
CMP, targeting 27501 zone and then at 27752-27901 zone with strict stop at 26451.
Daily Chart of Nifty:

Enjoy Your Comfort Zone.
Invest Smart. Build Wealth.
Comfort stock of the day
Stock Of The Day: (F & O)
When we want to see what's happening far off, we will reach for the binoculars. The binocular helps us to steer out of danger and also accurately spots our targets.
When it comes to trading / investing, that's exactly how Stock Of The Day: (F & O) introduces to the momentum stocks from the list of Future & Option segment, defining their support and resistance levels, and attempts to forecast their movement with a short /medium term perspective.
Stock Of The Day: (F & O)

R2STOCKS LTP S1 S2 R1 TRADING STRATEGYBIAS
Enjoy Your Comfort Zone.
Invest Smart. Build Wealth. www.comfortsecurities.co.in
Stock Of The Day: (F & O)
FEDERAL BANK is aiming to move above its 7-day higher consolidation zone. Positive bias as long as 80 support is held. Interweek Strategy: Buy between 83.50-85 zone, targeting 91 and then more aggressive targets located at 97-101 zone. Stop below 80.
The sequence of higher high/low still intact on daily, weekly and monthly charts. The interweek risk is on the upside with immediate targets at 275. Interweek Strategy: Buy between 267.50-269 zone, targeting 279 and then at 283-287.50 zone with stop below 263.45.
ESCORTS enjoyed a stronbg session in yesterday's trade, up 1.77%. The sequence of higher high/low still intact on monthly charts. Interweek Strategy: Buy between 873-877 zone, targeting 901 and then more aggressive targets located at 915-925 zone. Stop below 853.
Momentum osillators continue to signal strength. MARICO is aiming to close above its all-time-high at 366 mark. Interweek Strategy: Buy between 352-355 zone, targeting 363-368 zone and then more aggressive targets located at 375-381 zone. Stop below 347.45.
YES BANK is signaling a major breakout on monthly charts. Key support seen at 367.50 zone. Key hurdles seen at 395. Interweek Strategy: Buy between 377-379 zone, targeting 395 and then at 407-411 zone. Stop below 367.05.
Federal Bank & YES Bank likely to bring joy to investors. Establish long positions on early dips with interweek perspective.
FEDERAL BANK
EXIDE INDUSTRIES
ESCORTS
MARICO
YES BANK
86.9 83.5 80 91 101 Positive
273.6 267.5 257.5 279 287.5 Positive
886.3 873 827.5 911 925 Positive
358.05 347.5 339 367.5 381 Positive
383.8 377.05 367.5 395 411 Positive

www.comfortsecurities.co.inEnjoy Your Comfort Zone.
Invest Smart. Build Wealth.
EQUITY DERIVATIVESLooking into the future from present.
Changes in Open Interest (OI) in yesterday’s trade.
Nifty Spot
Bank Nifty Future
VIX
Premium
Nifty Future OI
Bank Nifty Spot OI
BSE Cash Vol. (Rs. in Cr)
NSE Cash Vol.(Rs. in Cr)
NSE Derivative Vol. (Rs. in Cr)
Index Future Volumes
Stock Future Volumes
Index Option Volumes
Stock Option Volumes
Total
Cash Volumes (INR in Cr.)
YesterdayDay Before Yesterday
Derivatives Vol.(INR in Cr.)
No of contracts
Turnover (Rs. In cr.)
Major Changes in Nifty Options (OI)
Thursday26th July, 2018
Market Summary: In yesterday’s trading session, the benchmark Nifty was seen struggling to strike its all-
time-high at 11,172 mark as traders digested the latest batch of quarterly earnings and
paused for breath after last three day’s rally. The smart money refrained from making big bets ahead of a key meeting between U.S.
President Donald Trump and European Commission President Jean-Claude Juncker. Worldwide stock markets are hoping for a truce in the trade tensions. Amongst Broader Indices, the BSE Midcap Index was moderately down by -0.12%, the
Small Cap Index was up 0.23% as it outperformed the Sensex.
Amongst the sectoral indices, outperforming the Sensex/Nifty were BSE Metal Index (up
0.82%), BSE Oil & Gas Index (up 0.18%), BSE Bankex Index (up 0.14%)
Amongst the sectoral indices, underperforming the Sensex/Nifty were BSE Power Index
(down 1.52%), BSE Realty Index (down 1.32%), BSE Consumer Durables Index (down
0.98%).
Amongst stock specific action, positive bias was seen in stocks like Indiabulls Housing (up
3.80%), Bajaj Finserv (1.79%), SBIN (up 1.69%)
Among stocks drifting down were: NTPC (down 4.10%), Lupin (down 2.92%), HCL Tech
(down 2.68%).
Maximum Call Open Interest (OI) stands at 11500 Strike Price, followed by 11000 Strike
Price for August Series. Call writing was seen at strike prices 10800-11550 for August
expiry.
Maximum Put Open Interest (OI) was seen at strike price 11000 followed by 10,500
strike price for August series. Put writing was the theme at 10600-11050 strike prices for
August series. As per Wednesday’s provisional data available on the NSE, Foreign institutional investors
(FIIs) sold shares worth Rs. 1195.75 crores. Domestic institutional investors bought
shares worth Rs. 97.64 crores in the Indian equity market.
Highest OI Nifty: Calls 11500: 19.99 L - Puts 11000: 25.22 L
Highest OI Bank Nifty: Calls 27500: 7.11 L - Puts 26000: 5.70 L
Change in Stock Open Interest (OI) in previous day’s trade.
Long Buildup: NALCO, TATA STEEL, NCC, PETRONET, BHARAT FORGE.
Short Buildup: TATA MOTORS, HCC, DLF, BHARTI AIRTEL, TECHM.
Short Covering: RELIANCE, NHPC, ENGINEERSIND, HINDZINC, CANBK.
Long Unwinding: AXIS BANK, DABUR, M&M, TATA GLOBAL, IOC.
Stocks banned in F&O segment for today: ADANI ENT
New In Ban: NIL.Out of Ban: NIL.
Future Call: SELL M&M AUGUST FUTURES at CMP 915.10. Targets:
903.75 and then at 890. Stop: 926.50. Holding Period: 0-3 days.
Analyst’s Remark: Weakening Momentum. (M&M August Futures
CMP 915.10).
Option Call: SELL BANK NIFTY JULY PE strike price 26800 at CMP
20.35. Maximum Profit: Rs. 814. Loss: Unlimited. Stop: Hold Put
Option till July expiry. (Bank Nifty July Futures CMP 27036).
11132.00 (-0.021%)
27031.30 (+0.21%)
12.2075 (-2.09%)
+26
1.4 crores (+40.46%)
11.48 lakhs (+66.83%)
3515.16 3565.44
32393.16 34563.31
905673 874238
283866 25429
1915113 130727
6939483 673522
1015197 75995
10153659 905673
Calls in lakhs (%Change)
11200 32.18 (0%)
11100 16.67 (-41%)
11300 21.55 (-1%)
Puts in lakhs (% Change)
11100 25.9 (-4%)
11000 49.78 (-10%)
11050 13.71 (+54%)

www.comfortsecurities.co.in
DAILY PIVOT TABLE
Enjoy Your Comfort Zone.
Invest Smart. Build Wealth.
Instrument Close S1 S2 R1 R2 200 Day SMA Reversal Point Trend
All level indicated above are based on cash market prices.
Pivot Point
PP : Pivot Point : This is trigger point for weekly buy/sell based on the price range of the previous week.R1 : Resistance one : 1st Resistance over PP. R2 : Resistance two : 2nd Resistance over R1.S1 : Support one : 1st support after PP. S2 : Support Two : 2nd support after S1.
As per the tool, the trader should take BUY position just above PP and keep the stop loss of PP and the first target would be R1.If R1 is crossed then R2 becomes the next target with the stop loss at R1.
Similarly if price goes below PP the trader should SELL and keep the PP as Stop loss and the first target would be S1.
If S1 is crossed then S2 becomes the next target with the stop loss at S1.This is a trading tool. The key to use of this tool is the use of STOP LOSS.
Thursday26th July, 2018
NIFTY 11132 11111.12 11090.23 11155.02 11178.03 11134.13 10525.34 UP
BANKNIFTY 27031.3 26955.77 26880.23 27090.42 27149.53 27014.88 25634.4 UP
NIFTYMID50 4891.05 4870.2 4849.35 4921.95 4952.85 4901.1 5146.59 DOWN
ACC 1469.65 1445.67 1421.68 1494.02 1518.38 1470.03 1585.11 DOWN
ADANIENT 199.8 187.23 174.67 208.83 217.87 196.27 152.95 UP
ADANIPORTS 398.75 392.82 386.88 403.07 407.38 397.13 395.57 UP
AJANTPHARM 1032.8 1018.67 1004.53 1055.57 1078.33 1041.43 1264.63 DOWN
ALBK 42.85 42.25 41.65 43.65 44.45 43.05 57.98 DOWN
AMARAJABAT 790.2 782.75 775.3 802.05 813.9 794.6 793.04 DOWN
ANDHRABANK 31.95 31.37 30.78 32.67 33.38 32.08 47.46 DOWN
APOLLOTYRE 276.85 270.78 264.72 282.93 289.02 276.87 265.02 UP
ARVIND 433.8 428.1 422.4 437.75 441.7 432.05 414.08 UP
ASHOKLEY 110.15 108.62 107.08 112.67 115.18 111.13 133.56 DOWN
ASIANPAINT 1450.15 1417.47 1384.78 1486.72 1523.28 1454.03 1197.27 UP
AUROPHARMA 585.85 579.43 573.02 595.78 605.72 589.37 638.44 DOWN
AXISBANK 532.25 525.33 518.42 543.33 554.42 536.42 535.25 DOWN
BAJAJ-AUTO 2638.6 2610.3 2582 2682.6 2726.6 2654.3 3040.99 DOWN
BAJAJFINSV 6949.5 6829.93 6710.37 7074.53 7199.57 6954.97 5387.81 UP
BAJFINANCE 2705.05 2671.93 2638.82 2758.23 2811.42 2725.12 1900.45 UP
BALKRISIND 1200.2 1183.48 1166.77 1226.43 1252.67 1209.72 1111.25 UP
BALRAMCHIN 66.65 65.52 64.38 67.82 68.98 66.68 107.89 DOWN
BANKBARODA 131.8 129.9 128 134.3 136.8 132.4 147.97 DOWN
BANKINDIA 88.2 86.83 85.47 89.48 90.77 88.12 132.77 DOWN
BATAINDIA 892.6 880.42 868.23 901.87 911.13 889.68 763.42 UP
BEL 101 98.87 96.73 104.82 108.63 102.68 149.96 DOWN
BEML 768.4 756.63 744.87 786.83 805.27 775.07 1265.33 DOWN
BERGEPAINT 316.5 311.23 305.97 323.63 330.77 318.37 266.74 UP
BHARATFIN 1191.4 1185.53 1179.67 1196.63 1201.87 1190.77 1071.7 UP
BHARATFORG 621.35 605.85 590.35 635.3 649.25 619.8 698.12 DOWN
BHARTIARTL 352.3 345.27 338.23 357.57 362.83 350.53 433.61 DOWN
BHEL 71.65 68.85 66.05 76.4 81.15 73.6 86.62 DOWN
BIOCON 553.3 543.42 533.53 569.82 586.33 559.93 559.09 DOWN
BPCL 395.65 389.7 383.75 400.45 405.25 394.5 450.57 DOWN
BRITANNIA 6444 6408 6372 6502 6560 6466 5162.83 UP
CANBK 258.95 249.72 240.48 265.97 272.98 256.73 306.07 DOWN
CANFINHOME 355.7 347.33 338.97 362.03 368.37 353.67 444.9 DOWN
CASTROLIND 163.65 161.93 160.22 165.83 168.02 164.12 188.83 DOWN
CEATLTD 1357.55 1336.7 1315.85 1379.7 1401.85 1358.85 1599.96 DOWN
CENTURYTEX 904.85 891.28 877.72 923.13 941.42 909.57 1190.44 DOWN
CESC 914.75 907.5 900.25 925 935.25 917.75 1008.17 DOWN
CGPOWER 62.05 60.97 59.88 63.62 65.18 62.53 78.66 DOWN
CHENNPETRO 291.25 285.62 279.98 295.42 299.58 289.78 365.15 DOWN
CHOLAFIN 1497.3 1481.57 1465.83 1521.47 1545.63 1505.73 1413.44 UP
CIPLA 623.9 614.57 605.23 632.12 640.33 622.78 592.76 UP
COALINDIA 264.65 262.6 260.55 266.6 268.55 264.55 281.57 DOWN
COLPAL 1124.5 1117.67 1110.83 1130.17 1135.83 1123.33 1107.45 UP
CUMMINSIND 669.95 661.37 652.78 678.27 686.58 669.68 796.91 DOWN
DABUR 371.6 368.78 365.97 375.78 379.97 372.97 352.06 UP
DALMIABHA 2578.55 2540.78 2503.02 2628.08 2677.62 2590.32 2825.69 DOWN
DCBBANK 159.95 157.48 155.02 164.08 168.22 161.62 179.72 DOWN
DHFL 612.65 608.6 604.55 619.05 625.45 615 590.26 UP
DISHTV 69.85 68.92 67.98 71.27 72.68 70.33 74.67 DOWN
DIVISLAB 1096.95 1080.73 1064.52 1109.08 1121.22 1092.87 1062.41 UP
DLF 183.5 180.58 177.67 188.08 192.67 185.17 215.11 DOWN
DRREDDY 2088.2 2067.33 2046.47 2103.28 2118.37 2082.42 2227.45 DOWN
EICHERMOT 27288.3 26962.2 26636.1 27757.2 28226.1 27431.1 29318 DOWN
ENGINERSIN 134.55 130.68 126.82 136.83 139.12 132.97 161.77 DOWN
EQUITAS 139.9 137.95 136 141.15 142.4 139.2 148.02 DOWN
ESCORTS 886.3 868.38 850.47 903.18 920.07 885.27 830.97 UP
EXIDEIND 273.6 269.8 266 277.7 281.8 273.9 228.72 UP
FEDERALBNK 86.9 86.03 85.17 88.23 89.57 87.37 98.8 DOWN
GAIL 364.65 361.05 357.45 369.4 374.15 365.8 344.91 UP
GLENMARK 565.7 559.97 554.23 573.22 580.73 567.48 569.23 DOWN
GMRINFRA 18.1 17.82 17.53 18.57 19.03 18.28 18.43 DOWN
GODREJCP 1356.45 1343.7 1330.95 1374.1 1391.75 1361.35 1070.89 UP
GODREJIND 608.85 599.55 590.25 621.55 634.25 612.25 583.24 UP
GRANULES 93.55 91.85 90.15 94.7 95.85 93 112.92 DOWN
GRASIM 985.8 967.62 949.43 1004.97 1024.13 986.78 1109.52 DOWN
GSFC 108.65 107.45 106.25 110.3 111.95 109.1 130.84 DOWN
HAVELLS 602.8 596.03 589.27 612.78 622.77 606.02 532.63 UP
HCC 11.4 10.95 10.5 12.15 12.9 11.7 28.19 DOWN
HCLTECH 964.3 951.7 939.1 985.2 1006.1 972.6 927.99 UP
HDFC 2000.85 1986.08 1971.32 2013.73 2026.62 1998.97 1812.45 UP
HDFCBANK 2170.35 2161.3 2152.25 2178.1 2185.85 2169.05 1932.88 UP
HDIL 19.4 18.83 18.27 20.08 20.77 19.52 44.13 DOWN
HEROMOTOCO 3110.05 3059.53 3009.02 3162.68 3215.32 3112.17 3621.63 DOWN
HEXAWARE 456.45 446.17 435.88 471.22 485.98 460.93 380.48 UP
HINDALCO 209 206.57 204.13 212.37 215.73 209.93 242.82 DOWN
HINDPETRO 281.95 278.97 275.98 284.72 287.48 281.73 366.25 DOWN
HINDUNILVR 1652.95 1634.32 1615.68 1675.52 1698.08 1656.88 1412.17 UP
HINDZINC 281.85 275.95 270.05 285.35 288.85 279.45 303.95 DOWN
IBREALEST 159.6 156.48 153.37 163.48 167.37 160.37 200.78 DOWN
IBULHSGFIN 1307.4 1272.28 1237.17 1331.23 1355.07 1296.12 1234.11 UP
ICICIBANK 274.65 272.4 270.15 276.75 278.85 274.5 299.89 DOWN
ICICIPRULI 403.6 379.2 354.8 419.8 436 395.4 397.31 UP
ICIL 81.9 80.35 78.8 83.85 85.8 82.3 98.49 DOWN
IDBI 58.9 58.03 57.17 60.03 61.17 59.17 63.14 DOWN
IDEA 54.9 54.13 53.37 56.13 57.37 55.37 79.52 DOWN
IDFC 45.35 44.8 44.25 45.95 46.55 45.4 54.99 DOWN
IDFCBANK 38.4 37.9 37.4 39.15 39.9 38.65 50.03 DOWN
IFCI 16.3 16.02 15.73 16.67 17.03 16.38 21.95 DOWN
IGL 294.95 284.67 274.38 300.87 306.78 290.58 294.79 UP
INDIACEM 113.3 111.17 109.03 116.62 119.93 114.48 152.79 DOWN
INDIANB 331.9 324.33 316.77 336.93 341.97 329.37 340.36 DOWN
INDIGO 1022.4 1004.08 985.77 1044.63 1066.87 1026.32 1218.41 DOWN
INDUSINDBK 1965.05 1946.5 1927.95 1977.1 1989.15 1958.55 1772.95 UP
INFIBEAM 177.4 172.53 167.67 180.93 184.47 176.07 157.62 UP
INFRATEL 286.9 282.93 278.97 291.38 295.87 287.42 347.52 DOWN
INFY 1383.75 1368.2 1352.65 1396.55 1409.35 1381 1124.24 UP
IOC 163.1 160.93 158.77 164.48 165.87 162.32 183.56 DOWN
IRB 194 189.83 185.67 201.03 208.07 196.87 230.08 DOWN
ITC 286.15 283.92 281.68 287.67 289.18 285.43 267.68 UP
JETAIRWAYS 308.25 302.98 297.72 316.43 324.62 311.17 595.71 DOWN
JINDALSTEL 200.25 196.07 191.88 205.82 211.38 201.63 218.94 DOWN
JISLJALEQS 77.4 76.12 74.83 79.27 81.13 77.98 109.06 DOWN
JPASSOCIAT 14.95 14.48 14.02 15.68 16.42 15.22 18.28 DOWN
JSWENERGY 64.15 63.22 62.28 65.42 66.68 64.48 79.05 DOWN
JSWSTEEL 317.1 309.33 301.57 326.13 335.17 318.37 294.53 UP
JUBLFOOD 1400.35 1354.9 1309.45 1467.9 1535.45 1422.45 1084 UP
JUSTDIAL 557.55 551.57 545.58 565.67 573.78 559.68 496.67 UP
KOTAKBANK 1314.9 1300.1 1285.3 1323.6 1332.3 1308.8 1136.19 UP
KPIT 291.5 288.68 285.87 295.03 298.57 292.22 216.56 UP
KSCL 590.35 584.03 577.72 598.13 605.92 591.82 526.63 UP
KTKBANK 114.05 109.4 104.75 121.3 128.55 116.65 134.64 DOWN
L&TFH 184.25 179.2 174.15 187.15 190.05 182.1 171.41 UP
LICHSGFIN 525.7 519.47 513.23 535.97 546.23 529.73 541.64 DOWN
LT 1320.7 1310.92 1301.13 1333.22 1345.73 1323.43 1294.36 UP
LUPIN 796.95 783.62 770.28 816.67 836.38 803.33 850.36 DOWN
M&M 910.1 904.2 898.3 920.5 930.9 914.6 783.59 UP
M&MFIN 486 481.03 476.07 492.23 498.47 487.27 462.59 UP
MANAPPURAM 101.65 100.32 98.98 103.67 105.68 102.33 108.67 DOWN
MARICO 358.05 353.92 349.78 361.27 364.48 357.13 319.13 UP
MARUTI 9758.95 9681.35 9603.75 9856.2 9953.45 9778.6 8875.01 UP
MCDOWELL-N 578.5 573.3 568.1 585.75 593 580.55 649.76 DOWN
MCX 823.65 781.43 739.22 854.43 885.22 812.22 846.67 DOWN
MGL 876.75 858.95 841.15 888.05 899.35 870.25 992.62 DOWN
MOTHERSUMI 299.2 293.7 288.2 306.2 313.2 300.7 339.34 DOWN
MRF 78208.75 77249.17 76289.59 79034.17 79859.59 78074.59 71876.1 UP
MRPL 79.9 78.62 77.33 81.57 83.23 80.28 112.64 DOWN
MUTHOOTFIN 393.25 385.4 377.55 406.7 420.15 398.85 427.3 DOWN
NATIONALUM 63.1 61.58 60.07 64.03 64.97 62.52 75.09 DOWN
NBCC 67.25 66.17 65.08 68.87 70.48 67.78 106.06 DOWN
NCC 92.4 88.7 85 94.95 97.5 91.25 115.32 DOWN
NMDC 102 99.3 96.6 103.6 105.2 100.9 124.24 DOWN
NTPC 151 148.18 145.37 155.48 159.97 152.67 169.58 DOWN
OFSS 3881.3 3840.97 3800.63 3935.82 3990.33 3895.48 3921 DOWN
OIL 205.25 203.28 201.32 208.53 211.82 206.57 230.29 DOWN
ONGC 159.05 157.28 155.52 160.78 162.52 159.02 180.32 DOWN
ORIENTBANK 73 69.83 66.67 76.93 80.87 73.77 103.05 DOWN
PCJEWELLER 83.9 78.53 73.17 90.08 96.27 84.72 313.16 DOWN
PEL 2700.05 2681.78 2663.52 2730.73 2761.42 2712.47 2612.64 UP
PETRONET 221.1 216.33 211.57 224.93 228.77 220.17 237.13 DOWN
PFC 78.05 75.75 73.45 79.35 80.65 77.05 102.18 DOWN
PIDILITIND 1117.65 1088.43 1059.22 1135.43 1153.22 1106.22 948.16 UP
PNB 79.25 78.28 77.32 80.33 81.42 79.37 127.34 DOWN
POWERGRID 175.65 173.9 172.15 178.2 180.75 176.45 199.84 DOWN
PTC 75.8 73.72 71.63 77.42 79.03 75.33 99.73 DOWN
PVR 1138.5 1109.62 1080.73 1180.27 1222.03 1151.38 1356.04 DOWN
RAMCOCEM 694.3 686.65 679 701.15 708 693.5 745.27 DOWN
RAYMOND 847.25 833.97 820.68 857.57 867.88 844.28 977.29 DOWN
RBLBANK 569.95 566.5 563.05 576.15 582.35 572.7 514.99 UP
RCOM 13.85 13.2 12.55 15.05 16.25 14.4 19.38 DOWN
RECLTD 98.2 95.33 92.47 100.08 101.97 97.22 136.5 DOWN
RELCAPITAL 383.55 375.4 367.25 389.35 395.15 381.2 456.9 DOWN
RELIANCE 1115.15 1105.23 1095.32 1124.03 1132.92 1114.12 943.34 UP
RELINFRA 398.25 393.12 387.98 404.02 409.78 398.88 452.26 DOWN
REPCOHOME 621.85 605.27 588.68 631.62 641.38 615.03 605.13 UP
RPOWER 31.8 31.18 30.57 32.63 33.47 32.02 39.52 DOWN
SAIL 74.7 73.5 72.3 76.1 77.5 74.9 79.56 DOWN
SBIN 271.85 267.38 262.92 274.58 277.32 270.12 279.63 DOWN
SHREECEM 17492.25 17346.5 17200.75 17691.5 17890.75 17545.75 17192.45 UP
SIEMENS 961.25 951.38 941.52 973.93 986.62 964.07 1138.93 DOWN
SOUTHBANK 18.05 17.7 17.35 18.5 18.95 18.15 27.41 DOWN
SREINFRA 52.35 51.22 50.08 53.77 55.18 52.63 87.42 DOWN
SRF 1667.8 1627.5 1587.2 1701.1 1734.4 1660.8 1878.55 DOWN
SRTRANSFIN 1283.65 1258.03 1232.42 1301.63 1319.62 1276.02 1378.12 DOWN
STAR 361.75 356.8 351.85 367.3 372.85 362.35 655.03 DOWN
SUNPHARMA 558.15 553.32 548.48 565.17 572.18 560.33 535.55 UP
SUNTV 765.45 751.95 738.45 785.6 805.75 772.1 897.08 DOWN
SUZLON 8.05 7.78 7.52 8.48 8.92 8.22 12.1 DOWN
SYNDIBANK 40.8 40.4 40 41.3 41.8 40.9 63.96 DOWN
TATACHEM 672.2 666.12 660.03 678.17 684.13 672.08 719.69 DOWN
TATACOMM 577.65 569.93 562.22 589.43 601.22 581.72 642.13 DOWN
TATAELXSI 1465.45 1367.97 1270.48 1520.97 1576.48 1423.48 1072.85 UP
TATAGLOBAL 236.9 232.3 227.7 245 253.1 240.4 269.83 DOWN
TATAMOTORS 257.85 255.4 252.95 261 264.15 258.55 362.08 DOWN
TATAMTRDVR 141.2 139.37 137.53 143.87 146.53 142.03 206.37 DOWN
TATAPOWER 67.8 67.05 66.3 69 70.2 68.25 84.04 DOWN
TATASTEEL 536 530.67 525.33 539.67 543.33 534.33 631.24 DOWN
TCS 1981.5 1965.93 1950.37 1999.53 2017.57 1983.97 1543.96 UP
TECHM 631.35 623.65 615.95 642.6 653.85 634.9 592.85 UP
TITAN 865.9 855.4 844.9 874 882.1 863.5 847.88 UP
TV18BRDCST 47.25 45.47 43.68 48.67 50.08 46.88 55.82 DOWN
TVSMOTOR 540.35 533.23 526.12 549.73 559.12 542.62 660.98 DOWN
UBL 1110.55 1092.43 1074.32 1126.33 1142.12 1108.22 1088.41 UP
UJJIVAN 386.25 381.5 376.75 393.5 400.75 388.75 378.04 UP
ULTRACEMCO 4044.85 3974.43 3904.02 4125.13 4205.42 4054.72 4085.52 DOWN
UNIONBANK 81.85 80.3 78.75 83.6 85.35 82.05 117.51 DOWN
UPL 637.75 624.28 610.82 647.23 656.72 633.77 722.99 DOWN
VGUARD 203.2 199.83 196.47 208.23 213.27 204.87 223.23 DOWN
VOLTAS 570.5 562 553.5 583 595.5 574.5 590.94 DOWN
WIPRO 274.7 272.63 270.57 276.73 278.77 274.67 287.3 DOWN
WOCKPHARMA 575.3 565.3 555.3 586.05 596.8 576.05 739.25 DOWN
YESBANK 382.9 378.7 374.5 389.9 396.9 385.7 330.79 UP
ZEEL 521.05 513.7 506.35 528.75 536.45 521.4 563.6 DOWN

Enjoy Your Comfort Zone.
Invest Smart. Build Wealth.
Comfort ‘Forecast and Analysis’
Forecast and Analysis is a daily newsletter that provides technical update on all the major instruments of the world like Gold, Silver, Crude Oil, US Dollar Index and USD/INR. We define their support and resistance levels and attempt to forecast their movement with a short / medium term perspective. Also in the report, a trader will find bias for the mentioned instruments.
This newsletter is also quite popular with a market participant who loves to have insight & theme on MCX Gold, MCX Silver as well MCX Crude-Oil.
Forecast and Analysis

Instrument TRADING STRATEGYLTP S1 S2 R1 R2 Bias
www.comfortsecurities.co.in
MCX GOLD
MCX SILVER
MCX CRUDE OIL
MCX COPPER
MCX NATURAL GAS
USD-INR
Forecast and Analysis …Direction at a glance
Enjoy Your Comfort Zone.
Invest Smart. Build Wealth.
In yesterday's trade, MCX Gold was seen inching up. Bias continues to be neutral. Confirmation of strength above 30101. Interweek Strategy: Establish long positions at CMP, targeting 30101 and then at 30500-30711 zone. Stop 29211.
Silver prices too were seen trading rangebound. Major buying advised only above 39953. Interweek Strategy: Establish long positions at CMP, targeting 39251-39451 zone and then at 39953 mark. Stop 37201.
Bias on crude-oil continues to be neutral. Key support seen at 4627. Confirmation of strength above 4951. Interweek strategy: Sell between 4801-4811 zone, targeting 4627 zone and then 4501 and then at 4295-4311 zone with stop at 4971.
Copper prices were seen inching up in yesterday's trade. Support now seen at 411. Confirmation of strength only above 451. Interweek strategy: Establish sell positions on strength between 431-433 zone, targeting 411 and then at 401-405 zone with stop at 451.
Natural Gas prices were seen consolidating in yesterday's trade with positive bias. Key supports now at 185. Interweek strategy: Establish long positions at CMP, targeting 201 and then aggressive targets at 217-223 zone with stop at 183.
USD/INR was seen consolidating in yesterday's trade. Key interweek support seen at 68.45. Hurdles now seen at 69.11. Intraday Strategy: Sell at CMP, targeting 68.45 zone with stop ABOVE 69.21.
29875 29551 29211 30101 30711 Neutral
38505 37951 37201 39451 39953 Neutral
4761 4501 4295 4807 4951 Negative
430 411 401 433 451 Neutral
190.00 185.00 179.00 201.00 225.00 Neutral
68.79 68.45 67.75 69.11 70.05 Neutral
Gold prices seen trading firm as Trump’s remarks seen hurting U.S dollar.

Instrument TRADING STRATEGYLTP S1 S2 R1 R2
www.comfortsecurities.co.in
GOLD $
SILVER ($)
WTI CRUDE OIL ($ )
EUR/USD
Forecast and Analysis …Sailing global trend
Bias
DOW JONES
US Dollar Index
Enjoy Your Comfort Zone.
Invest Smart. Build Wealth.
Wall Street struggles as investors digest mixed earnings and brace for Trump-Juncker meeting.
In yesterday's trade, gold prices traded firm amidst slipping US Dollar. Hurdles now seen at 1245. Confirmation of strength only above 1261. Support seen at 1201-1205 zone.
Silver prices were seen inching up in yesterday's trade, tracking rebound in gold prices. Confirmation of strength only above 16.21. At the moment downside risk remains at 15.05.
Crude-Oil prices were seen consolidating in yesterday's trade. Major hurdles now seen at 71.50 zone. Interweek strategy: Sell between 70-70.50 zone, targeting 67.45 zone and then at 65 zone with stop at 71.75.
The EUR/USD was seen trading sideways in yesterday's trade. Technically, the bias continues to be neutral with key support to watch on EUR/USD at 1.1505. Hurdles seen at 1.1901.
The U.S. dollar was seen trading rangebound in yesterday's trade. Technically, bias now shifts to neutral. Hurdles at 97.50. Downside well supported at 92.50. Major weakness now only below 92.50.
At Wall Street, the Dow Jones index was seen struggling for direction in yesterday's trade amidst stream of overall positive earnings reports that overshadowed geopolitical tensions. Bias shifts to neutral.
1238 1221 1201 1245 1261 Neutral
15.56 15.05 14.21 16.21 17.09 Neutral
68.96 67.45 65 70.05 71.5 Negative
1.1693 1.1505 1.4445 1.1901 1.2205 Neutral
94.61 92.50 89.25 97.50 99.00 Neutral
25917 23405 22501 25505 26125 Neutral

www.comfortsecurities.co.in
DAILY PIVOT TABLE
Enjoy Your Comfort Zone.
Invest Smart. Build Wealth.
CommodityExchange Close S1 S2 R1 R2200 Day
SMA Reversal
Point Trend
MCX ALUMINUM
MCX CARDAMOM
NCDEX CASTOR
NCDEX CHANA
MCX COPPER
MCX COTTON
MCX CRUDE-OIL
MCX GOLD
NCDEX GAUR GUM
NCDEX GAUR SEED
NCDEX JEERA
MCX LEAD
MCX MENTHA OIL
MCX NATURAL GAS
MCX NICKLE
NCDEX RM SEED
MCX SILVER
NCDEX SUGAR
NCDEX SOYA BEAN
MCX ZINC
142.25 140.85 139.45 144.1 145.95 142.7 142.74 DOWN
1174 1163.67 1153.33 1183.67 1193.33 1173.33 1027.74 DOWN
4514 4475.67 4437.33 4573.67 4633.33 4535.33 4231.74 UP
4175 4126 4077 4253 4331 4204 4028.56 UP
428.95 422.33 415.72 434.48 440.02 427.87 450.55 UP
22130 21966.67 21803.33 22296.67 22463.33 22133.33 20411.85 DOWN
4745 4682 4619 4793 4841 4730 4168.3 UP
29863 29752 29641 29953 30043 29842 30172.87 UP
8961 8849.67 8738.33 9183.67 9406.33 9072.33 8611.8 DOWN
4185.5 4137.33 4089.17 4263.33 4341.17 4215.17 3975.25 UP
19735 19426.67 19118.33 19986.67 20238.33 19678.33 17690.67 UP
147.2 145.48 143.77 149.03 150.87 147.32 160.47 UP
1504.3 1482.87 1461.43 1537.97 1571.63 1516.53 1438.14 DOWN
188.5 187.27 186.03 189.37 190.23 188.13 188.05 UP
934.3 920.6 906.9 945.8 957.3 932.1 875.58 UP
4166 4136.67 4107.33 4206.67 4247.33 4177.33 3983.12 UP
38450 38169.66 37889.33 38710.66 38971.33 38430.33 39086.84 UP
2709 2709 2709 2709 2709 2709 3619.22 DOWN
3352 3320 3288 3382 3412 3350 3404.35 DOWN
181.1 177.93 174.77 183.78 186.47 180.62 209.64 DOWN
Thursday26th July, 2018

Comfort Securities Ltd.
DISCLAIMER: This is solely for information of clients of Comfort Securities Ltd. and does not construe to be an investment advice. It is also not intended as an offer or solicitation for the purchase and sale of any financial instruments. Any action taken by you on the basis of the information contained herein is your responsibility alone and Comfort Securities Ltd. its subsidiaries or its employees or associates will not be liable in any manner for the consequences of such action taken by you. We have exercised due diligence in checking the correctness and authenticity of the information contained in this recommendation, but Comfort Securities Ltd. or any of its subsidiaries or associates or employees shall not be in any way responsible for any loss or damage that may arise to any person from any inadvertent error in the information contained in this recommendation or any action taken on basis of this information.
Technical analysis studies market psychology, price patterns and volume levels. It is used to forecast future price and market movements. Technical analysis is complementary to fundamental analysis and news sources. The recommendations issued herewith might be contrary to recommendations issued by Comfort Securities Ltd. in the company research undertaken as the recommendations stated in this report is derived purely from technical analysis. Comfort Securities Ltd. has based this document on information obtained from sources it believes to be reliable but which it has not independently verified; Comfort Securities Ltd. makes no guarantee, representation or warranty and accepts no responsibility or liability as to its accuracy or completeness. The opinions contained within the report are based upon publicly available information at the time of publication and are subject to change without notice. The information and any disclosures provided herein are in summary form and have been prepared for informational purposes. The recommendations and suggested price levels are intended purely for trading purposes. The recommendations are valid for the day of the report however trading trends and volumes might vary substantially on an intraday basis and the recommendations may be subject to change. The information and any disclosures provided herein may be considered confidential. Any use, distribution, modification, copying, forwarding or disclosure by any person is strictly prohibited. The information and any disclosures provided herein do not constitute a solicitation or offer to purchase or sell any security or other financial product or instrument. The current performance may be unaudited. Past performance does not guarantee future returns. There can be no assurance that investments will achieve any targeted rates of return, and there is no guarantee against the loss of your entire investment.
POTENTIAL CONFLICT OF INTEREST DISCLOSURE (as on date of report)Disclosure of interest statement – • Analyst interest of the stock /Instrument(s): - No. • Firm interest of the stock / Instrument (s): - No.
Enjoy Your Comfort Zone. Invest Smart. Build Wealth. www.comfortsecurities.co.in
Registered Office Mumbai:
Comfort Securities Ltd.
A-301, Hetal Arch, S.V. Road, Opp. Natraj Mkt.,
Malad (W), Mumbai 400 064
Phone: 91-22-28811259, 28449765, 28825509
Fax: 91-22-28892527
Email: [email protected]
Comfort Securities Limited
605, 6th Floor, DDA2 Building,
New Delhi 110058,
Janakpuri District Center,
Janakpuri, Delhi, 110058
011 4568 0560
Comfort Securities Ltd
2nd Floor, Shop No S14, T 14,
Friends Tower, Sanjay Place,
Agra