
COLLISIONAL DE-EXCITATION CROSS-SECTION … 1 iss'.' p jan 3 0 1973 collisional de-excitation...
41
AEDC-TR-72-132 1 ISS'.' p JAN 3 0 1973 COLLISIONAL DE-EXCITATION CROSS-SECTION MEASUREMENT OF ELECTRONIC STATES OF ATOMIC AND MOLECULAR HYDROGEN BY COLLISION WITH MOLECULAR HYDROGEN J. W. L. Lewis and W. D. Williams ARO, Inc. October 1972 Approved for public release; distribution unlimited. VON KÄRMÄN GAS DYNAMICS FACILITY ARNOLD ENGINEERING DEVELOPMENT CENTER AIR FORCE SYSTEMS COMMAND ARNOLD AIR FORCE STATION, TENNESSEE Property of U. S. Air Force ASDC LT2UASY F40600-73-C-0004
Transcript of COLLISIONAL DE-EXCITATION CROSS-SECTION … 1 iss'.' p jan 3 0 1973 collisional de-excitation...

AEDC-TR-72-132
1
ISS'.' p
JAN 3 0 1973
COLLISIONAL DE-EXCITATION CROSS-SECTION
MEASUREMENT OF ELECTRONIC STATES OF ATOMIC AND MOLECULAR HYDROGEN BY
COLLISION WITH MOLECULAR HYDROGEN
J. W. L. Lewis and W. D. Williams
ARO, Inc.
October 1972
Approved for public release; distribution unlimited.
VON KÄRMÄN GAS DYNAMICS FACILITY
ARNOLD ENGINEERING DEVELOPMENT CENTER
AIR FORCE SYSTEMS COMMAND
ARNOLD AIR FORCE STATION, TENNESSEE
Property of U. S. Air Force ASDC LT2UASY
F40600-73-C-0004

NOTICES When U. S. Government drawings specifications, or other data are used for any purpose other than a definitely related Government procurement operation, the Government thereby incurs no responsibility nor any obligation whatsoever, and the fact that the Government may have formulated, furnished, or in any way supplied the said drawings, specifications, or other data, is not to be regarded by implication or otherwise, or in any manner licensing the holder or any other person or corporation, or conveying any rights or permission to manufacture, use, or sell any patented invention that may in any way be related thereto.
Qualified users may obtain copies of this report from the Defense Documentation Center.
References to named commercial products in this report are not to be considered in any sense as an endorsement of the product by the United States Air Force or the Government.

AEDC-TR-72-132
COLLISIONAL DE-EXCITATION CROSS-SECTION MEASUREMENT OF ELECTRONIC STATES
OF ATOMIC AND MOLECULAR HYDROGEN BY COLLISION WITH MOLECULAR HYDROGEN
J. W. L. Lewis and W. D. Williams
ARO, Inc.
Approved for public release; distribution unlimited.
AEDC-TR-72-132
FOREWORD
The work reported herein was sponsored by the Arnold Engineering Development Center (AEDC), Air Force Systems Command (AFSC), Arnold Air Force Station, Tennessee under Program Element 65802F.
The results of the research presented here were obtained by ARO, Inc. (a subsidiary of Sverdrup &. Parcel and Associates, Inc.), contract operator of AEDC under F40600-72-C-0003. The work was conducted under ARO Project Nos. VW5216 and VW5220 from July 1. 1971 to March 1, 1972. The manuscript was submitted for publication on June, 14, 1972.
The authors express their appreciation to A. D. Killian for his aid in operation and maintenance of the apparatus.
This technical report has been reviewed and is approved.
MAURICE A. CLERMONT ROBERT O. DIETZ Captain, CF Acting Director Research and Development Directorate of Technology
Division Directorate of Technology
ü

AEDC-TR-72-132
ABSTRACT
The HftJ Ho, and H lines of the Balmer series of atomic hydrogen and the G*£g—^B1^^ molecular hydrogen system were produced by 40- kev electron beam excitation of molecular hydrogen at room temperature. The collisional de-excitation cross section of the above-mentioned ex- cited electronic states in collision with H^X^^g was measured.
ui

AEDC-TR-72-132
CONTENTS
Page
ABSTRACT iii NOMENCLATURE . . .' vi
I. INTRODUCTION 1 1. 1 Background 1 1. 2 Electron Beam Excitation of Hydrogen 1 1.3 Collisional De-Excitation of the Radiating State ... 3
II. EXPERIMENTAL APPARATUS 2. 1 Electron Beam Source 5 2. 2 Collision Chamber and Vacuum System 6 2. 3 Optical and Electronics Detection System 7
III. EXPERIMENTAL RESULTS AND ANALYSIS 3. 1 Experimental Results 8 3. 2 Analysis 9
IV. CONCLUSIONS 14 REFERENCES 15
APPENDIXES
I. ILLUSTRATIONS
Figure
1. Energy Level Diagram of Atomic Hydrogen 19
2. Partial Electronic Energy Level Diagram of H, 20
3. Experimental System 21
4. Gas Flow Tube Liner 22
5. Optical Arrangement . 23
6. Electronics System 24
7. Spectral Scan of Hydrogen Radiation 25
8. Hc Photon Emission Rate versus Beam Current 26
9. S/I versus H2 Pressure for Ho Transition 27
10. Quenching Curve for Ha Transition 28
11. Quenching Curve for Hn Transition 29

AEDC-TR-72-132
Page
12. Quenching Curve for H Transition 30
13. Quenching Curve for H2(G-»-B) Transition 31
II. TABLES
1. H2G1Eg—»-H^B1!;* Line Assignment 32
II. Experimental Results 32
NOMENCLATURE
A: Einstein spontaneous emission coefficient, sec
AJ-J/AJ Branching Factor
a~ First Bohr radius
C Constant
dj Collision diameter of specie i
d^ Effective collision diameter of species i and j
e Electronic charge and electron
Ha a line of Balmer series
Hg j3 line of Balmer series
H«, y line of Balmer series
h Planck's constant
hv Photon of energy hi/
I Electron beam current
k. Quenching rate constant of specie i, cc/sec/molecule
L Electron beam length observed by optics, cm
M Molecular weight, gm/mole
Mc^ Mach number for centerline of flow tube
N Gas number density, molecules/ cc
Pr Prandtl number
R Universal gas constant, cgs
VI

AEDC-TR-72-132
Re Reynolds number
r Atomic electron radius
S(u) Photon emission rate, sec
s(A.) Wavelength dependent quantum yield
T Temperature, °K
x/D Ratio of axial distance to tube diameter
7 Ratio of constant pressure to constant volume specific heat o
X Wavelength, A 2
(Tgi Electron-molecule cross section for g—^i excitation, cm
cq Variance of measured quantity for determination number i
cr^ij) Inelastic partial cross section for the i to j transition, cm
°M Variance of the set of all data
a|j(i) Elastic cross section of specie i, cm2
9 2 CTjnd) Inelastic cross section of specie i, cm
Tj Lifetime of state i, sec
u) Detector solid angle subtended at the excitation volume, sr
vu

AEDC-TR-72-132
SECTION I INTRODUCTION
1.1 BACKGROUND
The use of the electron beam fluorescence technique for flow-field diagnostics is an established method for experimentally determining local values of gas density and temperature (Refs. 1, 2, and 3). How- ever, the majority of previous applications has been to flow fields com- prised of either common gases, such as N2» O9' anc* a*r' or no^^e
gases, such as He and Ar, and their mixtures. Diagnostics of other flow fields of current interest such as rocket engine exhausts and flowing gas laser systems presents additional difficulties in that the number of flow-field constituents can be quite large and, also, the appropriate electron beam excitation cross sections and the collisional de-excitation, or quenching , cross sections are in many cases unknown. This absence of required data is exemplified by gaseous molecular hydrogen, H2, which is a constituent found in the above-mentioned types of flow fields. Although previous investigations (Refs. 4 and 5) of electron beam colli- sions with H2 have been made, the purpose of the measurements was the elucidation of the various excitation processes of the collision and, as a result, the highest beam energy employed has been 6 kev (Ref. 5), far less than the typical value of 40 kev used for flow-field diagnostics. As the results of Vroom and deHeer (Ref. 5) demonstrate, the excita-. tion of atomic hydrogen, H, radiation systems, the predominant radiating species of the gas, is only partially optically allowed, and, consequently, extrapolation using a Fano diagram of excitation cross sections acquired at 6 kev to an electron beam energy of 40 kev should be avoided. Addi- tionally, no excitation cross-section data of excited molecular H2 states exist. As the gas density increases, the probability of collision between the electronically excited atom or molecule and the ground state species become larger, and effects of collisional quenching on the radiation in- tensity of the excited species must be taken into account and, at pres- ent, quenching cross-section data of atomic and molecular hydrogen are rare. For these reasons a study of excitation and de-excitation cross sections of electronic states of H and H2 was initiated, and the re- sults of the measurements of collisional de-excitation of the H(n = 5, 4, and 3) and H2G Et states by ^X^Eg are presented in this report.
1.2 ELECTRON BEAM EXCITATION OF HYDROGEN
The various excitation processes of H2 by collision with a high en- ergy electron beam include the following

AEDC-TR-72-132
e + H2 *- H + H** + e
\ -H* + H + hi/ (1)
e + H2 »» H+ + H** + 2(
\. r* •«H*+hi/ (2)
e + H, *-HS*+ e l2 \. H%+hv (3)
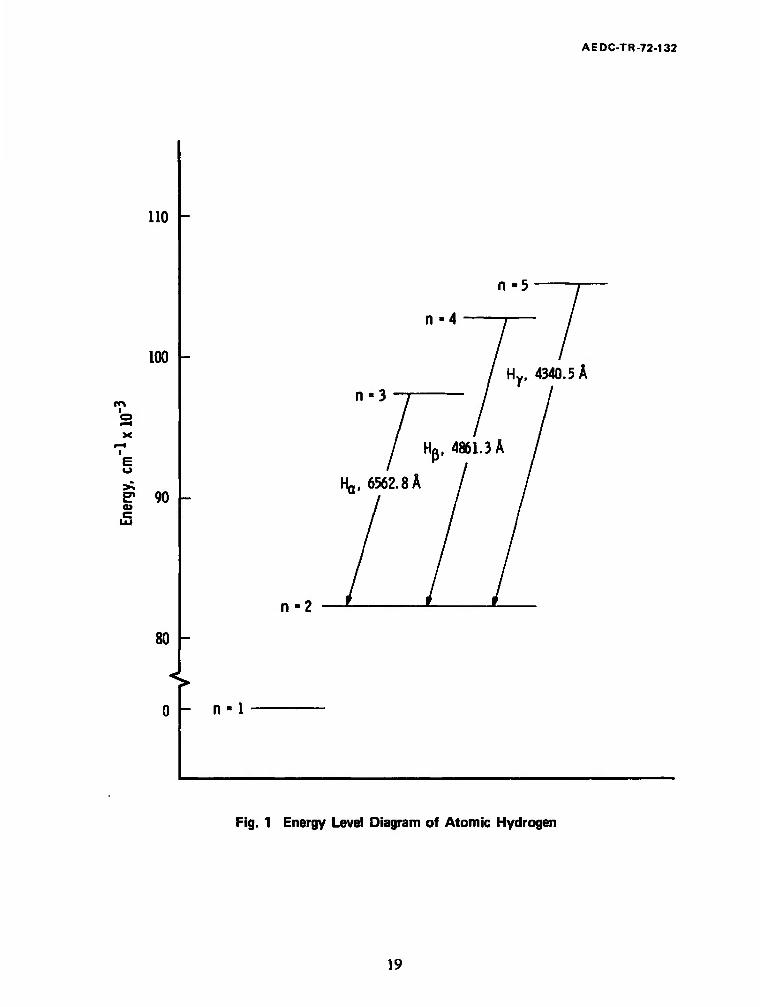
Equation (1) shows the dissociative excitation mechanism which re- sults in two neutral H atoms, one of which is in an excited state repre- sented by H** which then decays radiatively to a lower state H by the emission of a photon hv. Equation (2) represents dissociative-ionization, resulting in atomic radiation, and Eq. (3) shows the excitation process for excited electronic states of H2. No stable H2 states are known to exist (Ref. 6). Included among the states excited by the processes of (1) and (2) are the H(n = 3, 4, 5) atomic states, and Fig. 1 shows a sim- plified energy level diagram of H. The radiative transitions available to the H(n * 3, 4, 5) states are indicated in Fig. 1 (Appendix I).
As shown in Fig. 1, the following transitions, the Balmer series of H, are available for observation (Ref. 5) in the visible spectral region:
H(n = 5) »-H(n - 2) + hv (4340. 5 Ä) (4)
H(n = 4) >-H(n = 2) + hv (4861. 3 A) (5)
and
H(n = 3) *-H(n = 2) + hv (6562. 8 A) (6)
where Eqs. (4) through (6) are known as the H , Ho, and H systems, respectively. These particular transitions are the result of either dis- sociative excitation or ionization processes and, therefore, should be relatively insensitive to the vibrational or rotational temperatures of the H2xl£g molecules. Additionally, resonance absorption effects are absent for the Balmer series, and, therefore, the Balmer series of atomic transitions is a reasonable choice for use for flow-field diagnostics of local H2 density.
o Several emission lines observed at approximately 4634 A are tenta-
tively identified as various P and R branch transitions of the (0, 0) band of the H2 G Eg(3da) *-B1Ej(2pc7) electronic transition. Using the potential constants given by Herzberg (Ref. 7) for the G and B states of H2, wavelengths for the possibly observed R and P branch (0, 0) band
AEDC-TR-72-132
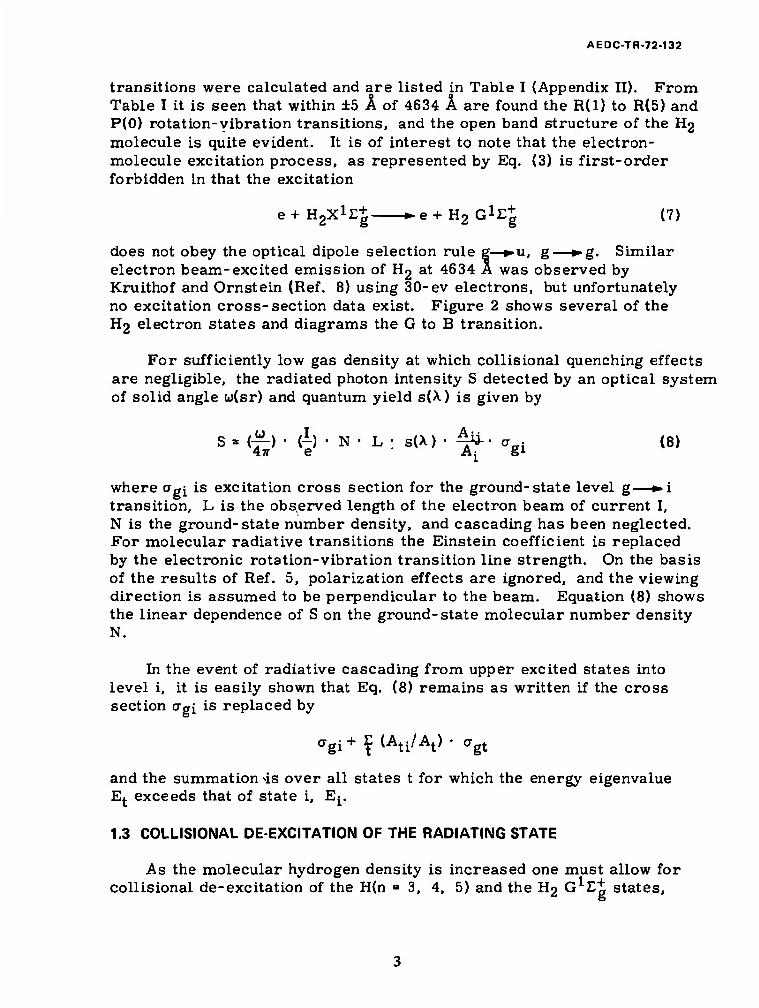
transitions were calculated and are listed in Table I (Appendix II). From Table I it is seen that within ±5 Ä of 4634 A are found the R(l) to R(5) and P(0) rotation-vibration transitions, and the open band structure of the H2 molecule is quite evident. It is of interest to note that the electron- molecule excitation process, as represented by Eq. (3) is first-order forbidden in that the excitation
e+HgXiEj ►e+H2G1E+ (7)
does not obey the optical dipole selection rule g—^u, g—^g. Similar electron beam-excited emission of H2 at 4634 A was observed by Kruithof and Ornstein (Ref. 8) using 30-ev electrons, but unfortunately no excitation cross-section data exist. Figure 2 shows several of the H2 electron states and diagrams the G to B transition.
For sufficiently low gas density at which collisional quenching effects are negligible, the radiated photon intensity S detected by an optical system of solid angle u(sr) and quantum yield s(X) is given by
S » (~) • (-) • N • L : s(X) • 4^' <7ffi (8) 4w e A^ g1
where Ugi is excitation cross section for the ground-state level g—*>i transition, L is the observed length of the electron beam of current I, N is the ground-state number density, and cascading has been neglected. For molecular radiative transitions the Einstein coefficient is replaced by the electronic rotation-vibration transition line strength. On the basis of the results of Ref. 5, polarization effects are ignored, and the viewing direction is assumed to be perpendicular to the beam. Equation (8) shows the linear dependence of S on the ground-state molecular number density N.
In the event of radiative cascading from upper excited states into level i, it is easily shown that Eq. (8) remains as written if the cross section cxgi is replaced by
CTgi+? <Ati'At> ■ CTgt
and the summation 4s over all states t for which the energy eigenvalue Ej exceeds that of state i, E^.
1.3 COLLISIONAL DE-EXCITATION OF THE RADIATING STATE
As the molecular hydrogen density is increased one must allow for collisional de-excitation of the H(n = 3, 4, 5) and the H2 G*Et states,

AEDC TR-72-132
assuming binary collisions to be the appropriate collision mechanism. Collision of two excited species is negligible for the gas density regime of interest. The quenching process of the atomic and molecular hydro- gen states is shown in Eqs. (9a) and (9b) and is nonspecific in the sense that the final states nx, ny, and X, Y radiating and quenching are unknown:
1 k3 H(n = 3, 4, 5) + H2 Ej—*"H(nx) + H2(X) ± Kinetic energy (9a)
kjg H2G1Z:g + H2
1Eg *-H2(ny) + H2(Y) ± Kinetic energy (9b)
where k^ is the respective inelastic (or super-elastic) rate constant in units of cc/molecule-sec. With this model, as shown in Ref. 3, the in- clusion of collisional quenching in the decay channels yields the following equation relating S to gas density N
S *-£- . (-) • L • s(X) • a . • AH T« • N/(l + k. - ri • N) (10) Air e s1 lJ l 1 l
where T,- is the radiative lifetime of the ith state, H(n =3, 4, 5) or H2GiEg in this case. One sees that S is no longer linear with respect to the density N of H2^Eg, but rather the slope of S versus N is a de- creasing function of N, S eventually becoming insensitive to increases in number density, and thereby becoming unsuited for flow-field diag- nostic measurements of local gas density.
From Eq. (10) it is seen that measurement of S as a function of gas number density N provides an experimental determination of k^r^ and therefore k^, if the radiative lifetime of the radiating state is known. Equation (10) can be written as
N/(S/I) -^-(1+ klTiN> (11)
where C = — * —- ■ s(A.) • a„\ • AH ■ T: and is a constant for the meas- 4ir e e1 lJ i urement. The ratio of the slope to the intercept of N/(S/I) versus N therefore yields k^ • T^, or the quenching rate constant k^.
The quenching rate constant k^ may be expressed in terms of a quenching cross section cr£n(i) using the relation (Ref. 9)
o ... ,8R T, 1/2 .,„. ki ■ fffixfO * ^TST) (12)
7rM

AEDC-TR-72-132
where R is the universal gas constant, T is the gas temperature, and M is the reduced mass of the colliding pair of species. As shown in Ref.7, the assumptions required for derivation of Eq. (12) include (a) a Max- well-Bo ltz mann distribution of molecular velocities, (b) uniform gas spatial distribution, (c) hard-sphere binary-collision process, and (d) zero activation energy for the collisional transfer.
Using the same assumptions one can write the elastic rate constant lq(el) as
Mel) = a|1(i)(8RT/jrM)1/2
where cr?i(i) = w^ii and the effective collision idameter is
where d^ and dj are the collision diameters of species i and j, respec- tively.
One can now obtain the average inelastic transition probability per collision for state i, vix.,
Pt = Vk^el) = crj/Ü/a^U)
thereby obtaining information concerning the efficiency of the collisional process.
SECTION II EXPERIMENTAL APPARATUS
2.1 ELECTRON BEAM SOURCE
The high energy beam of electrons is provided by a modified TV- type electron gun with magnetic focusing and deflection as shown in Fig. 3 and is essentially the same as that described in Refs. 2 and 3. The electron beam energy was 40 kev with the collision chamber grounded. Sulfur hexafluoride gas was used for pressurization of high voltage con- trols, including the lead wires of the gun, to eliminate arcing and co- rona phenomena, and operation has been achieved at accelerating voltages in excess of 60 kev with the present system. The gun system is mainr tained at pressures less than 10 torr using two-stage differential pumping, and the beam is injected into the outer scattering cell through a 1-mm (0. 040-in. ) orifice. The electron source provides in the excit-

AEDC-TR-72-132
ation region typical beam currents of approximately 1. 25 ma at 40-Kev energy, and this represented 50 to 75 percent of the cathode emission current. After traversal of the gas sample the current was collected by a water-cooled, copper Faraday cup coated with colloidal graphite to suppress secondary emission. Furthermore, the collector was de- signed to minimize the effects of secondary emission by requiring mul- tiple electron-collector collisions in order to re-enter the excitation region.
2.2 COLLISION CHAMBER AND VACUUM SYSTEM
The collision chamber is shown in Fig. 4 in more detail, and it is seen that the gas flow occurs within an annular water-cooled liner which is contained within--and exhausts into--the main collision cham- ber. As shown in Fig. 3, pumping is provided by a 4-in. oil dif- fusion pump and two ring-jet pumps which are backed by a Stokes mechanical roughing pump. The gas entering the flow tube is precooled and enters the annular liner as slug flow. The length of the liner was chosen so that the distance from the entrance of the liner to the point of electron beam excitation was in excess of the laminar hydrodynamic entry length (x/D)ve^ required for a fully developed velocity profile, as estimated by (Ref. 10):
(x/D)vel= Re/20 (13)
where x is the axial distance along the tube of diameter D confining a flow with Reynolds number (Re). Fulfillment of this criterion provides a fully developed laminar Poiseuille flow at the point of electron beam excitation, thereby enabling estimates of flow velocity gradients to be made. Additionally, the thermal entry length (x/D)te^ is given by (Ref. 10)
(x/D)tel = Pr (x/D)vel (13a)
and the Prandtl number for gases is approximately 0. 1\ therefore, the thermal boundary layer is fully developed before reaching the point of electron beam excitation. The precooling reservoir was maintained at approximately the same temperature as the cooling annular liner. The mass flow rate of H2 was approximately 0. 5 mg/sec, and the flow tuhe Mach number varied from approximately 0. 01 to 0. 08. Therefore, the existence of radial gradients in the gas temperature must be due to fric- tional heating effects. An estimate of such radial gradients can be ob- tained by considering the well-known problem of fully developed Poiseuille flow in a circular tube of wall temperature T0. It is easily shown that the centerline temperature Tmax for a subsonic flow of centerline Mach

AEDC-TR-72-132
number Mcj is given by
<Tmax - T0)/Tmax = <±) [Pr(T " 1) (Mcl)2]
where y is the specific heat ratio for the gas. For H2 it is easily seen that Tmax differs from TQ by less than 0. 1 percent for Mach numbers less than 0. 1, and therefore, the effect of radial temperature gradients is negligible. The temperatures of the flow tube liner and the reser- voir were monitored by nine thermocouples located at various positions, including the water-cooled electron beam entrance orifice shown in Fig. 4 and the Faraday cup, and no significant gradients were present.
The chamber was pumped to a pressure of approximately 5 x 10"° torr, and the pumping lines were purged with argon for approximately two hours to remove residual oxygen-containing air from the system. Research grade hydrogen gas was then injected into the flow system, and flow was maintained for approximately one hour before data acquisition •was begun. The pressure, as measured with a calibrated MKS Baratron, was systematically increased or decreased, steady state was achieved and data recorded. This procedure was repeated until the quenching curve was sufficiently defined, as described in a following section.
2.3 OPTICAL AND ELECTRONICS DETECTION SYSTEM
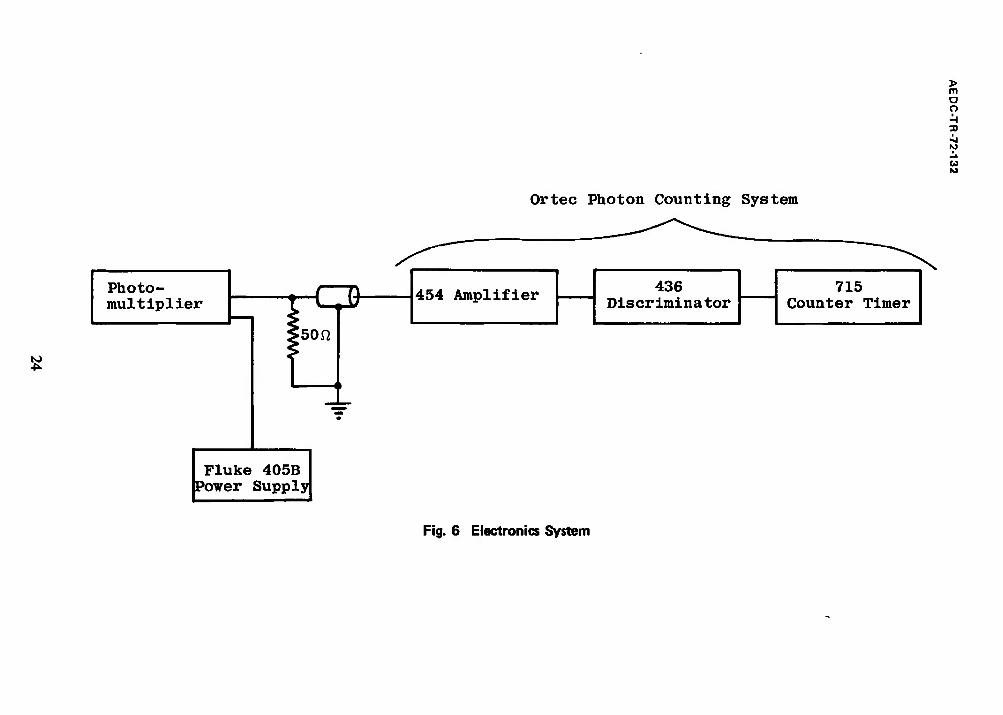
Two different optical arrangements were used for data acquisition. The Hg radiation, as well as the other transitions investigated, was ob- served in a direction perpendicular to both the electron beam and the gas flow as Fig. 5 shows. The Ho radiation was collected by a lens of 5-cm diameter and 250-mm focal length, passed through a Dove prism to ensure complete collection of the radiation and focused onto the en- trance slit of a 3/4-m Spex monochromator with a 1180-gm/mm, 5000- A blaze grating. The output at the exit slit was detected by a gaseous- nitrogen-cooled photomultiplier tube, and the data were acquired using both an EMI 6256B and an RCA 7265 tube. The spectral bandwidth of the HA data was a minimum of 4 A and a maximum of 8 A for the series of measurements. The photomultiplier output was processed by a pulse amplifier, discriminator, and counter, the last of which recorded the total number of photon counts over a specified counting interval. Figure 6 shows the electronic system used for data acquisition. Linearity of the system has been verified using the variation of output signal as a function of beam current at constant density for the first negative system of N2. The observed photon emission rate was always sufficiently low that no dead-time corrections were required of the 20-MHz counter out- put. An additional precaution taken to ensure repeatability of the data
AEDCTR-72-132
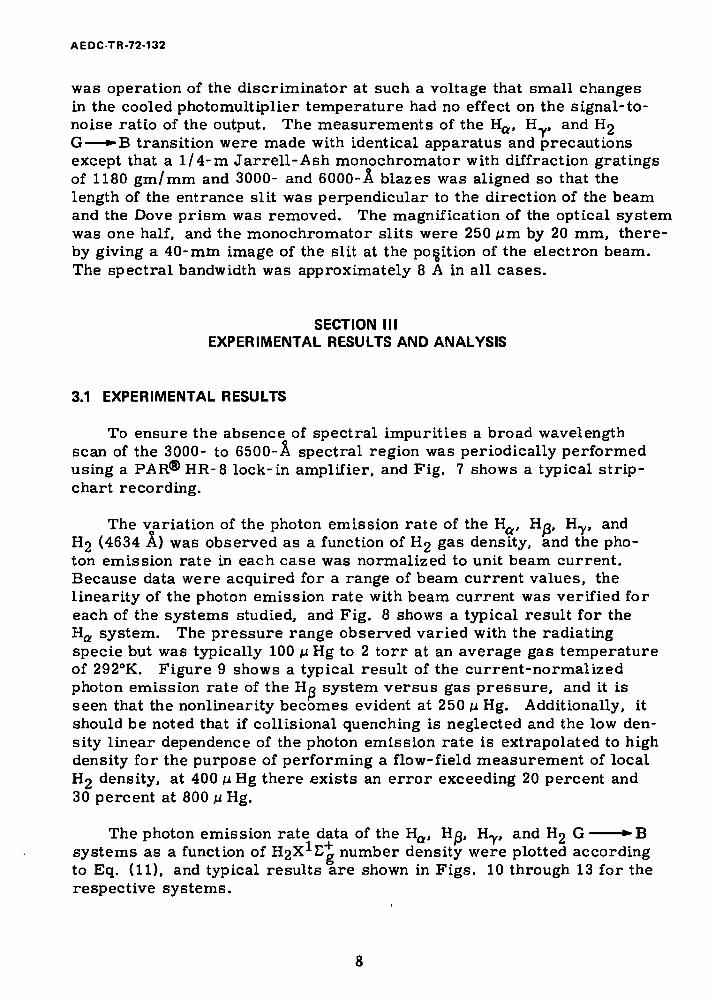
was operation of the discriminator at such a voltage that small changes in the cooled photomultiplier temperature had no effect on the signal-to- noise ratio of the output. The measurements of the Ha, H , and H2 G—^B transition were made with identical apparatus and precautions except that a 1/4-m Jarrell-Ash monochromator with diffraction gratings of 1180 gm/mm and 3000- and 6000-Ä blazes was aligned so that the length of the entrance slit was perpendicular to the direction of the beam and the Dove prism was removed. The magnification of the optical system was one half, and the monochromator slits were 250 ßm by 20 mm, there- by giving a 40-mm image of the slit at the position of the electron beam. The spectral bandwidth was approximately 8 A in all cases.
SECTION III EXPERIMENTAL RESULTS AND ANALYSIS
3.1 EXPERIMENTAL RESULTS
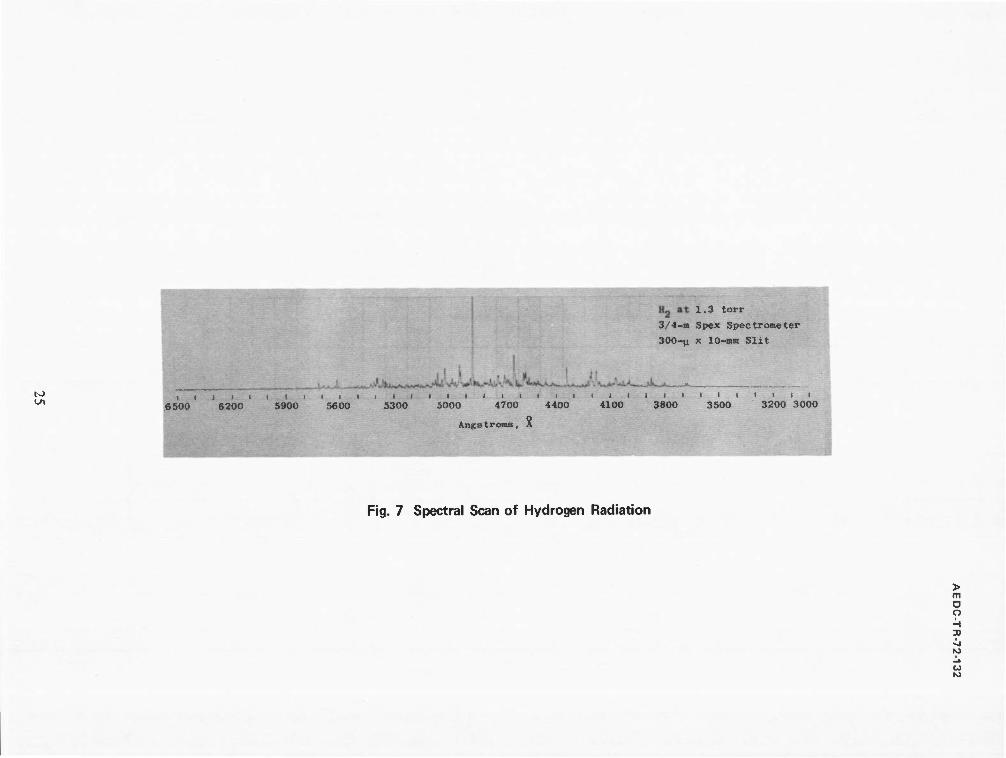
To ensure the absence of spectral impurities a broad wavelength scan of the 3000- to 6500-Ä spectral region was periodically performed using a PAR®HR-8 lock-in amplifier, and Fig. 7 shows a typical strip- chart recording.
The variation of the photon emission rate of the Ha, Ho, H^,, and H2 (4634 A) was observed as a function of H2 gas density, and the pho- ton emission rate in each case was normalized to unit beam current. Because data were acquired for a range of beam current values, the linearity of the photon emission rate with beam current was verified for each of the systems studied, and Fig. 8 shows a typical result for the Hö system. The pressure range observed varied with the radiating specie but was typically 100 u Hg to 2 torr at an average gas temperature of 292°K. Figure 9 shows a typical result of the current-normalized photon emission rate of the Ho system versus gas pressure, and it is seen that the nonlinearity becomes evident at 250 p Hg. Additionally, it should be noted that if collisional quenching is neglected and the low den- sity linear dependence of the photon emission rate is extrapolated to high density for the purpose of performing a flow-field measurement of local H2 density, at 400 ß Hg there exists an error exceeding 20 percent and 30 percent at 800 u Hg.
The photon emission rate data of the Ha, Uß, Hy, and H2 G *»B systems as a function of ^X^E* number density were plotted according to Eq. (11), and typical results are shown in Figs. 10 through 13 for the respective systems.

AEDC-TR-72-132
A computer calculation of the least-squares fit of the data to an equation of the form of Eq. (11) was performed, and the individual mea- sured values of k^i were obtained as well as the statistical error a± of the fit to the data (Ref. 11). The weighted mean value of ki( k^ of the Jj[ individual determinations of a given transition, as well as the uncer- tainty a»» of the set of data were determined using (Ref. 11)
Ji Ji kt» E Mj)/a?(j)/[E l/a?(j)] (14)
and
1/aMi= E1 l/crfcj) (15)
and the values obtained are listed in Table II. The values of 2a^j^ listed in Table II are the approximate 95-percent confidence level values.
For the Balmer series the radiative, field-free lifetimes were ob- tained from Ref. 12 and used to obtain the quenching rates Tc^ of each atomic state, and these values are given in Table If. The H^G^-Eg life- time was assumed to be 10 nsec merely for the purpose of comparison, and its value of Tci is shown in Table II.
Using the hard-sphere binary-collision model representation and Eq. (12), the inelastic cross section a? (i) for each excited state was calculated and listed in Table II.
3.2 ANALYSIS
3.2.1 Atomic Hydrogen De-Excitation
The deactivation cross-section experimental results which are shown in Table II clearly-demonstrate a trend of decreasing cross sec- tion with increase of electronic excitation energy of the hydrogen atom. Since the Bohr radius r of the excited electron of a hydrogen atom varies as
r = n2 aQ
one would intuitively expect the elastic cross section or the collision rate of H2 with H(n) to increase as the excitation energy increased (Ref. 13). Therefore, it is obvious that the deactivation efficiency of the H(n),

AEDC-TR-72-132
H2X^Eg(v a 0) collision decreases as the atomic electronic excitation energy increases. Such a variation in the behavior of the deactivation cross section may be due to a resonance effect in the energy transfer mechanism; i. e., the de-excitation process found to be most efficient is that process which minimizes the amount of energy AE to be trans- ferred either to or from the translational mode, all other factors being equal. Therefore, one is led to consider possible energy transfer mech- anisms from the H(n ■ 3, 4, 5) states to the H2 molecule for which a minimum A E is required.
Considering first the n = 3 state the following deactivation schemes represent processes for which (1) AE is minimized and/or (2) the transition is allowed according to the optical selection rules. It will be seen that the transitions are of two general types: (1) electronic-to- electronic energy transfer and (2) electronic-to-vibrational energy transfer (Ref. 14).
(1) Electronic-to-Electronic Energy Transfer
H(n»3)+H2X1E+{V=0)—*-H(n=l) + H2B12:J(v*5)+0. 13 ev (16a)
which can be written as
[_(H)3, (H2)XQJ + 0» 13 ev» where subscripts represent the initial state and superscripts the final state. For H2> Xv represents H2X E~(v) and Bv represents H2B1E*(V). The energy +0. 13 ev represents an exoergic transfer of 0. 13 ev,
[(H)J, (H2)xo] -0.011 ev (16b)
The vibrational energy .eigenvalues of Dieke (Ref. 15) are used for the H2B1E+—t» H^E* transition.
(2) Electronic-to-Vibrational Energy Transfer
[(H)§. (H2)XQ]+ 1-372 ev (16c)
[(H)2, (H2)xo] + °- 886 ev tl6d)
[(H)§, (H2)^g] + 0. 429 ev (16e)
[(H)2, (H2)xo] + 0. 001 ev (16f)
[(H)§, (H2)^] - 0. 397 ev (16g)
10

AEDC-TR-72-132
and
[(H)^ (H2)xo]_ °-762 ev <16n)
The electronic excitation processes of Eqs. (16a) and (16b) were selected so that (1) excitation transfer is g » u allowed, (2) the Franck- Condon rule is obeyed, and (3) AE is minimized. The electronic-to- vibrational transfer cases of Eqs. (16c) through (16h) show that for AE to be minimized the I^X1^« molecule must undergo a multiquanta, Av ■ 4, transition.
In a similar manner one can arrive at the following possibilities for deactivation of the H(n = 4) and H(n * 5) states:
[(H)J. (H2)|J°] + 0. 12 ev (17a)
[(H)J, (HgjgJ1] - 0.0035 ev (17b)
[<H)J, (H2)xo]+ °-265 ev (17c)
[<H)J, (H2)xo]- °-010 ev <17d> [(H)i (H2)^J]+ 0.144 ev (17e)
[(H)3, (H2)^] _ 0.342 ev (17f)
and
[(H)g, (H2)§J3] + 0. 067 ev (18a)
[(H)J. (H2)gJ4] - 0.045 ev (18b)
[<H)gf (H2)JJ]+ 0.451 ev (18c)
[(H)|. (H2)^Q] " °-005 ev <18d)
[(H)jj, (H2)xo]- 0.492 ev (18e)
[(H)|, (H2)^j] - 0.210 ev (18f)
[(H)4, (H2)|Q] - 0.636 ev (18g)
Considering the H(n * 3) transitions and specifically Eqs. (16a) through (16h), it is seen that the magnitude of the energy imbalance AE as a function of vibrational quantum number change Av is sharply peaked
11

AEDC-TR-72-132
for Av ■ 4. However, it is well known that multiquanta processes are inherently inefficient (Ref. 16), and consequently one must conclude that the deactivation process of Eq. (16f) is unlikely so long as no poten- tial curve crossing occurs. One is left with the processes of Eqs. (16a) and (16b) as likely deactivation mechanisms.
For the possible H(n = 4) deactivation mechanisms, the deactivation paths of Eqs. (17c)- and (17d) are both multiquanta jumps for the H2X E+(v = 0) molecule and are, therefore, unlikely. Equation (17f) indicates a double quantum jump of the H2 molecule which is endoergic by 0. 342 ev and is negligible, since on the basis of hard-sphere, Maxwell-Boltzmann kinetic theory, only approximately one in every 10 collisions possesses sufficient translational energy to provide the 0. 34- ev energy deficiency. One is left, therefore, with the process of Eq. (17e) which is a single quantum jump process and is exoergic by 0. 144 ev. The electronic-to-electronic processes of Eqs. (17a) and (17b) are both Franck-Condon allowed and possible from the standpoint of the endoergicity of the decay path. Therefore, for the deactivation of the H(n = 4) state, one has the possible decay paths represented by Eqs. (17a), (17b), and (17e).
For the deactivation of the H(n = 5) state, similar reasoning nar- rows the possible decay paths to those represented by Eqs. (18a), (18b), (18c), and (18d).
From the above considerations the suggested possible deactivation mechanisms for the H(n = 3, 4, 5) states are:
for the H(n -3),
[(H)J, (H2)^]+ 0.13 ev (16a)
[(H)g, (H2)|g] - 0.011 ev (16b)
for H(n = 4),
[(H)J, (H2)|J°] + 0.12 ev (17a)
[(H)*. (HgJ^J1] " 0.0035 ev (17b)
[(H)3, (H2)xJ]+ 0.144 ev (17e)
12

AEDC-TR-72-132
and for H(n =5),
[(H)J, (H2)|J3] + 0. 067 ey (18a)
[(H)J, (H)|J4]- 0.045 ev (18b)
[(H)3, (H2)xJ] +0.451 ev (18c)
[(H)^ (H2)x§l - 0.005 ev (18d)
It should be noted that in principle, processes of the type repre- sented by Eqs. (17e), (18c), and (18d) are experimentally detectable for they represent collisional cascading processes. If such processes are present both the pressure variation of the photon emission rate S and the value of the absorption coefficient obtained from a simultaneous measurement of either the H(n = 3) —*-H(n = 4) or H(n = 4)—*>H(n = 5) transitions should so indicate. However, accurate interpretation of the results of such measurements requires knowledge of the electron-mole- cule excitation cross section of the H(n ■ 3, 4, 5) states at 40 kev, and such data do not at present exist. It can only be said that within the precision of the current measurement, collisional cascading effects were not observed for the Ho and H0 quenching curves.
If one assumes that the quenching of the H(n =3, 4, 5) states is rep- resented by processes described by Eqs. (16a), (16b), (17a), (17b), and (18a), (18b), respectively, on the assumption of no potential curve crossing and an interaction potential factorable in the electron_coordi- nates of the atom and molecule, the use of electric dipole selection rules should provide a first approximation for calculation of the cross section. Neglecting constants and the factor representing efficiency of conversion of electronic to translational energy, the deactivation cross section CT (ij) for the i to j transition can be written as
<r2(ij) « Ay qvv, (19)
where qwi represents the Franck-Condon factor of the H2X £g(v) to H2B1E^(vl) excitation. Therefore, using values of qvvi given by Spindler (Ref. 17), one finds, using Eq. (19),
CT2(3 1) : a2(4 1) : CT
2(5 1) = 1 : 0. 18 : 0.05 (20)
13

AEDCTR-72-132
The experimental results of Table II give
CT2(3 1) : CT
2(4 1) : o2(5 1) = 1 : 0. 42 : 0. 12 (21)
which yields order-of-magnitude agreement with Eq. (20).
3.2.2 Molecular Hydrogen
o Because the emitted radiation detected at 4634 A is only tentatively
identified as arising from the H^G1^*—^H231EU transition, a nominal value of 10 msec was assumed for the radiative lifetime, yielding an inelastic cross section of 38 A2 as shown in Table II. If the transition identification is correct it is felt that the assumed lifetime value may be too small by less than an order of magnitude, in which case the mea- sured cross section quoted in Table II will be increased to a value much larger than the gas kinetic value.
SECTION IV CONCLUSIONS
The collisional quenching of the H(n = 3, 4, 5) states by ground state H2 is suggested as being the result of electronic-to-electronic energy transfer processes in which the H atom is deactivated to its ground electronic state and H2 is excited to the H^B^I!* state. Although there is a wide variation of quenching cross sections, as shown in Table II, it should be noted that the kT products of the three states are of the same order of magnitude. Inasmuch as it is the kT product rather than CT in w^ich determines the density variation of the electron-beam- induced fluorescense, it is seen that on the basis of quenching there is little to recommend one transition over the other, based on room tem- perature measurements. The molecular hydrogen transition, however, exhibits a kr product at room temperature which is significantly less than any of the atomic transitions. However, temperature dependencies are likely to be greater for the molecular transition than for the atomic excitations produced by dissociative excitation. Further measurements investigating the temperature dependence of excitation and quenching of both the atomic and molecular transitions are required.
14

AEDC-TR-72-132
REFERENCES
1. Muntz, E. P. and Marsden, D. J. Rarefied Gas Dynamics II. Edited by J. A. Laurmann, Academic Press, New York, 1963.
2. Williams, W. D., Hornkohl, J. O., and Lewis, J. W. L. "Electron Beam Probe for a Low Density Hypersonic Wind Tunnel." AEDC-TR-71-61 (AD727004), July 1971.
3. Norman, Wendell, Kinslow, Max, and Lewis, J. W. L. "Experi- mental Study of Simulated High Altitude Rocket Exhaust Plumes-." AEDC-TR-71-25 (AD726555), July 1971.
4. Massey, H. S. W., Burhop, E. H. S., and Gilbody, H. B. Electronic and Ionic Impact Phenomena, Volume II. Oxford at the Clarendon Press, 1969.
5. Vroom, D. A. and de Heer, F. J. "Production of Excited Atoms by Impact of Fast Electrons on Molecular Hydrogen and Deuterium." Jour. Chem. Phys., Vol. 50, 1969, pp. 580- 590.
6. Sharp, E. T. "Potential Energy Curves for Molecular Hydrogen and its Ions. " Atomic Data, Vol. 2, 1971, pp. 119-169.
7. Herzberg, G. Molecular Spectra and Molecular Structure I. Spectra of Diatomic Molecules. D. Van Nostrand Company, Inc., Princeton, New Jersey, 1964.
8. Kruithof, A. A. and Ornstein, L. S. "Anregung Einiger Spek- tralinien des Wasserstoffmoleküls durch Electronstoss. " Physica, Vol. 2, 1935, pp. 611-617.
9. Johnston, H. S. Gas Phase Reaction Rate Theory. The Ronald Press Company, New York, 1966.
10. Kays, W. M. Convective Heat and Mass Transfer. McGraw-Hill Book Company, New York, 1966.
11. Beers, Y. Introduction to the Theory of Error. Addison-Wesley Publishing Company, Inc., Reading, Massachusetts, 1953.
12. Wiese, W. L., Smith, M. W. , and Glennon, B. M. Atomic Transition Probabilities, Vol. I. NSRDS-NB4, U. S. Gov- ernment Printing Office, Washington, D. C. , 1966.
13. Hirschfelder, J. O. , Curtiss, C. F. , and Bird, R. B. Molecular Theory of Gases and Liquids. John Wiley and Sons, Inc., New York, 1954.
15

AEDC-TR-72-132
14. Gaydon, A. G. and Hurle, I. R. The Shock Tube in High- Temperature Chemical Physics. Reinhold Publishing Cor- poration, New York, 1963.
15. Oieke, G. H. "The Molecular Spectrum of Hydrogen and Its Isotopes. " Jour. Mol. Spec., Vol. 2, 1958, pp. 494-517.
16. Dickens, P. G., Linnett, J. W., and Sovers, O. "Collisional Energy Transfer Between Electronic and Vibrational Degrees of Freedom. " Disc. Far. Soc., Vol. 33, 1962, pp. 52-60.
17. Spindler, R. J. "Franck-Condon Factors for Band Systems of Molecular Hydrogen-1. " J. Quant. Spectrosc. Radiat. Transfer, Vol. 9, 1969, pp. 597-626.
16

AEDC-TR-72-132
APPENDIXES I. ILLUSTRATIONS
II. TABLES
17
AEDC-TR-72-132
HO
100
i
P 90 01 c
80
n-3
n -5
n -4
Hy, 4340.5 Ä
Hß, 4861.3 A
HQ, 6562.8 A
n-2
- n-1
Fig. 1 Energy Level Diagram of Atomic Hydrogen
19

AEDC-TR-72-132
120
110
I
° 100 E? a»
90
2.198
GLZ ♦ .^s>
Sketch of i|r* vp (Not to Scale)
1 ±
G - B Transition
-*^- B2Z*
0.7 0.8 0.9 1.0 1.1 1.2 Equilibrium Distance, re, A
1.3 1.4
Fig. 2 Partial Electronic Energy Level Diagram of H2
20

,a PrwsuriMd with SFj
(O
> m O n H 3)
Fig. 3 Experimental System w ro

to to
Quartz Viewing Window
Coolant Lines
Electrically Insulated and Cooled Injection
Mass Spectrometer Port (Opposite Viewing Window)
Electron Gun
Pressure Gage c *» Pumps
Gas Supply
Milliammeter —I
Scale
3 in.
Cooled Faraday Cup
> m o
H
«
Fig. 4 Gas Flow Tube Liner

Test Chamber
Quartz View Port
250-mm Focal Length Quartz Lens
1/4-m Spectrometer
Cooled 7265 Photomultiplier
Fig. 5 Optical Arrangement > m O O ■H 30
> m o r>
■ -J ro
tS M
Ortec Photon Counting System
Photo- multiplier <ZD
• 50ft
454 Amplifier 436 Discriminator
715 Counter Timer
Fluke 405B Power Supply
Fig. 6 Electronics System
to
1.3 torr
3/4-m Spex Spectrometer
300-y X 10-mm Slit
tii iii i i i i i i i i t i i i t i t i i i i i i t t i i t i
6500 6200 5900 5600 5300 5000 4700 4400 4100 3800 3500 3200 3000
Angstroms . X
ft^l Fig. 7 Spectral Scan of Hydrogen Radiation
> m O o
w

AEOC-TR-72-132
to
tr>
»
50
45
rpi
40
35
7f\
0.8 0.9 1.0 1.1 1.2 1.3 1.4 1.5
I, ma
Fig. 8 Ha Photon Emission Rate versus Beam Current
26

AEDC-TR-72-132
28
24
20
m i o
x
\ u 0) tn \
Co
Ö
o u
en
16
12
8
t 1
J w
1 i
/
i '
/
t f
1 T
9
/ f t
/ J ' J
//
0.2 0.4
V 0.6
torr 0.8 1.0
Fig. 9 S/l versus H2 Pressure for Hß Transition
27

oo
1.0
1.6
£ 1.4 c 13
l_
i i.2 —■
i/S
cC 1-0
. 0.8
n A
100
o
U
200 300 400 500
PH2- ^
600 700 800 900 1000
Fig. 10 Quenching Curve for Ha Transition

.Q l_
CO
3.Ö
3.6 f>
3.4
3.2 3
3.0
2.8
2.6
2.4
2.2
2.0
1.8
1 h
0.2 0.4 0.6 0.8 PH2. torr >
m D O
Fig. 11 Quenching Curve for Hß Transition

o
w
to
oo CNI
4.u
3.5
3.0
2.5
2.0
1.5
0.2 0.4 0.6 pH2. t°rr
0.8
> m □ o H 30
io
W IO
1.0
Fig. 12 Quenching Curve for H<y Transition

Oi
m A
■- -a
to
CVJ
n -
6
0.2 0.4 0.6 0.8 1.0 1.2 1.4 1.6 1.8 2.0 2.2 2.4 2.6 2.8 3.0 PH2' torr
Fig. 13 Quenching Curve for H2(G -*■ B) Transition
> m D O H 3> ■
■•J
I
W ro

AEDC-TR-72-132
TABLE 1 HzG'ZJ-^HzB'SJ LINE ASSIGNMENT
x, Ä Designation
R(l)
o X, A Designation
4629.3 4636.0 P(0)
4632.8 R(2) 4653.0 P(D 4635.3 R(3) 4674.4 P(2>
4535.9 R(4) 4693.3 P(3)
4633. 1 R(5) 4709.8 P(4)
4626.6 R{6) 4722.3 P(5)
4519.6 R(7) 4730.1 P(6)
4662.9 R(8> 4736.6 P(7)
TABLE II EXPERIMENTAL RESULTS
State k£ ± 2CTMi.
cc/ sec/molecule xlO9
FiTi- cc/molecule
x 10"
*?n<i>. (Ä)2
76
K
n ■ 3 2. 30 ±0. 14 2.3 290.6
4 0.97 ±0.08 3.2 32 296.0
5 0. 27 ± 0. 02 2.3 8.9 291.4
«2Gl4 0.94 ± 0. 12* 0.94 38 292.2
Assumed radiative lifetime of 10.0 nsec
32

UNCLASSIFIED Security Classification
DOCUMENT CONTROL DATA -R&D (Security classification of title, body of abstract and indexing annotation must be entered when the overall report la classified)
i ORIGINATING ACTIVITY (Corporate author)
Arnold Engineering Development Center Arnold Air Force Station, Tennessee 37389
2a. REPORT SECURITY CLASSIFICATION
UNCLASSIFIED 2b. CROUP
N/A 3 REPORT TITLE
COLLISIONAL DE-EXCITATION CROSS-SECTION MEASUREMENT OF ELECTRONIC STATES OF ATOMIC AND MOLECULAR HYDROGEN BY COLLISION WITH MOLECULAR HYDROGEN
« DESCRIPTIVE NOTES (Typ* of report end Inclusive dales)
Final Report - July 1, 1971 to March 1, 1972 8 AU THORlS) (First name, middle Initial, last name)
J. W. L. Lewis and W. D. Williams, ARO, Inc
e- REPORT DATE
October 1972 7a. TOTAL NO. OF PAGES
39 7*. NO. OF REFS
17 ■a. CONTRACT OR GRANT NO. «a. ORIGINATOR'S REPORT NUMBERIS)
6. PROJEC T NO.
e. Program Element 65802F
AEDC-TR-72-132
ob. OTHER REPORT NO(S) (Any other numbs» that may be assigned this report)
ARO-VKF-TR-72-89 10 DISTRIBUTION STATEMENT
Approved for public release; distribution unlimited.
II SUPPLEMENTARY NOTES
Available in DDC
12. SPONSORING MILITARY ACTIVITY
Arnold Engineering Development Center, Air Force Systems Command, Arnold AF Station, Tenn. 37389
13. ABSTRACT
The H , HQ, and H lines of the Balmer series of atomic hydrogen i°4. P 1 + Y
and the GXS -* B 2„ molecular hydrogen system were produced by 40-kev u electron beam excitation of molecular hydrogen at room temperature. The collisional de-excitation cross section of the above-mentioned ex- cited electronic states in collision with H0 X
12+ was measured. 2 g
DD FORM I NOV 8S 1473 UNCLASSIFIED
Security Classification

UNCLASSIFIED Security Classification
14. KKV WORD!
ROL« »T
LINK ■ LINK C
NOLI WT ROLE WT
flow measurement
hydrogen
spectral lines
electron beams
fluorescence
collision cross sections
UNCLASSIFIED Security Classification