
College Information System
132
Page | 1 COLLEGE INFORMATION SYSTEM ABSTACT: The technology being used now a day to gather college info is presented in this case study. The main purpose of inventing this COLLEGE INFORMATION SYSTM is to help the college students and the faculty members by providing the information needed. College information system deals with the information related to students studying in a particular college, information regarding the fee structure, availability of seats, number of staff members and their salaries, number of courses provided and the information regarding the labs and workshop. In this system, the major role played by the RUQAYYA AMATULLAH 03085009
-
Upload
sugarbaibs89 -
Category
Documents
-
view
138 -
download
6
Transcript of College Information System

P a g e | 1
COLLEGE INFORMATION SYSTEM
ABSTACT:
The technology being used now a day to gather college info is presented
in this case study. The main purpose of inventing this COLLEGE
INFORMATION SYSTM is to help the college students and the faculty
members by providing the information needed.
College information system deals with the information related to students
studying in a particular college, information regarding the fee structure,
availability of seats, number of staff members and their salaries, number of
courses provided and the information regarding the labs and workshop.
In this system, the major role played by the students, staff members and
the administrator.
RUQAYYA AMATULLAH 03085009
P a g e | 2
PROBLEM STATEMENT
A Problem statement is a class concise designation of the issues that need to be
addressed by a problem solving team and should be presented to them or created
by them before they try to solve the problem.
When bringing together a team to achieve a particular purpose efficiently
provide them with a problem statement. A good problem statement answers the
following questions:
What is the problem?
Who has the problem? Or who is the client customer?
This should explain who needs the solution and who will decide the problem has
been solved.
What is the scope and limitations that can be used to solve the problem?
What are the features of the problem?
When the student has to gather the information regarding the courses,
conductance of exam, the admission process and when to submit the
assignment, they have to visit to college. By this the students have to waste their
precious time for doing so.
RUQAYYA AMATULLAH 03085009
P a g e | 3
PROPOSED SYSTEM
In college information system, we can easily get the information about the
admission, seats and vacancies in a particular course and college through a
single click and also fee can be paid easily.
By this system, it is also easy for a student to find books easily in the
library and also old questions papers.
RUQAYYA AMATULLAH 03085009

P a g e | 4
SOFTWARE REQUIREMENT SPECIFICATION OF COLLEGE INFORMATION SYSTEM.
1. INTRODUCTION
1.1 Purpose:This SRS describes the software functional and non-functional requirement for
collecting the information about college students, staff and about the official
work. This document is to be used by students, staff and other college team that
will involve in working of college.
1.2 Project Scope and Product Features:The College Information System will permit process impact gathering
information about students from admission cell and give it to staff. And another
very important impact is taking classes, conducting exams, maintaining fee
details and examination etc., this is some important features of college
information system.
1.3 Definitions, Abbreviations, Acronyms:ACTIVITY : an activity on going and atomic execution within a state machine.
ALLOTMENT: allotting seat to the eligible students.
RUQAYYA AMATULLAH 03085009
P a g e | 5
1.4 References:1. www.processimpact.com/corporate/standards/PI_intranet_dev_std.doc .
2. www.google.com
3. www.wikipedia.com
1.5 Overview:This case study helps us to understand the functioning of college management,
staff and student to access the data easily.
2 OVERALL DESCRIPTION
2.1 Product PerspectiveThe College Information System is a new system that can help to maintaining
student and staff information easily and it will maintains the student records and
fee records of student and staff salary details and other important information
related to college management.
2.2 Product Functions:
STUDENT The student is the main user class of College Information System.
First student should attend the counseling and they would get the
admission into the college. After that student attend all classes and
examinations which will be conducted by college staff.
STAFF In college information system staffs play the major roll. Staff
include of lecturers, H.O.D, principal. Staff can conduct the classes
RUQAYYA AMATULLAH 03085009
P a g e | 6
for students, giving assignments to them and maintaining attendant
record of the students.
H.O.D H.O.D collects the attendant’s records from lecturers, displaying
notices and distributing memos and hall tickets of students and also
conducting seminars. These are the major activities of H.O.D.
PRINCIPAL Principal maintains the whole college management. The main activity
for principal is to hire the college staff and distributing their salaries
and conducting placements.
2.3 User characteristics: Students should be aware of Internet.
User should have a valid id.
2.4 Assumptions and Dependencies:ASSUMPTION: The college management system used at any time for the
college management and the students who were studied in that college
management.
DEPENDENCY: the operating system of the college management system
depends on personal and official information about students, staff, and H.O.D
ect. By using the proposed system of college management system the allotment
of seats become easier.
RUQAYYA AMATULLAH 03085009
P a g e | 7
3 SPECIFIC FUNCTIONS
3.1 FUNCTIONAL REQUIREMENTS
3.1.1 Functional requirement1
3.1.1.1 Introduction:
In the college management system the major requirement is the information of
the student, that is provided for proposed system.
3.1.1.2 Input:
All the details like personal and official details are given as input to the
proposed system.
3.1.1.3 Processing:
In the processing of student information in college management system is
extended with the information of attendance and official performances of
student.
3.1.1.4 Output:
The details of student information in college management system can be access
easily by this proposed system.
3.1.2 Functional requirement2
3.1.2.1 Introduction:
In the college management system another major requirement is the information
regarding staff is provided for proposed system.
RUQAYYA AMATULLAH 03085009
P a g e | 8
3.1.2.2. Input:
All the details like personal and official details are given as input to the
proposed system
3.1.1.3 Processing:
In the processing of staff information in college management system is extended
with the information of experience and official performances of staff members.
3.1.1.4 Output:
The details of staff information in college management system can be access
easily by this proposed system.
RUQAYYA AMATULLAH 03085009
P a g e | 9
UNIFIED MODELING LANGUAGE
INTRODUCTION:
The unified modeling language (UML) is a standard language for writing
software blue prints.
The UML is a language for
Visualizing
Specifying
Constructing
Documenting
The artifacts of a software system:
UML is a language that provides vocabulary and the rules for combing words in
that vocabulary for the purpose of communication.
A modeling language is a language whose vocabulary and rules focus on the
concept and physical representation of a system.
Vocabulary and rules of a language tell us how to create and real well formed
models, but they don’t tell you what model you should create and when should
create them.
RUQAYYA AMATULLAH 03085009
P a g e | 10
VISUALIZING:
The UML is more than just a bunch of graphical symbols. In UML each symbol
has well defined semantics. In this manner one developer can write a model in
the UML and another developer or even another tool can interpret the model
unambiguously.
SPECIFYING:
UML is used fro specifying means building models that are precise,
unambiguous and complete.
UML addresses the specification of all the important analysis, design and
implementation decisions that must be made in developing and deploying a
software intensive system.
CONSTRUCTING:
UML is not a visual programming language but its models can be directly
connected to a variety of programming languages.
This means that it is possible to map from a model in the UML to a
programming language such as java, c++ or Visual Basic or even to tables in a
relational database or the persistent store of an object-oriented database.
This mapping permits forward engineering. The generation of code from a
UML model into a programming language.
The reverse engineering is also possible you can reconstruct a model from
an implementation back into the UML.
RUQAYYA AMATULLAH 03085009

P a g e | 11
DOCUMENTING:
UML is a language for Documenting. A software organization produces all sorts
of artifacts in addition to raw executable code. These artifacts include
Requirements, Architecture, Design, Source code, Project plans, Test, Prototype,
and Release.
Such artifacts are not only the deliverables of a project, they are also critical in
controlling, measuring and communicating about a system during its
development and after its deployment.
CONCEPTUAL MODEL OF THE UML:
To understand the UML, we need to form a conceptual model of the language
and this requires learning three major elements.
The UML Basic Building Blocks.
The Rules that direct how those building blocks may be put together.
Some common mechanisms that apply throughout the UML.
As UML describes the real time systems it is very important to make a
conceptual model and then proceed gradually. Conceptual model of UML can be
mastered by learning the following three major elements:
RUQAYYA AMATULLAH 03085009

P a g e | 12
UML BUILDING BLOCKS:
Rules to connect the building blocks
Common mechanisms of UML
This chapter describes all the UML building blocks. The building blocks of
UML can be defined as:
Things
Relationships
Diagrams
THINGS:
Things are the most important building blocks of UML. Things can be:
Structural
Behavioral
Grouping
An notational
STRUCTURAL THINGS:
The Structural things define the static part of the model. They represent physical
and conceptual elements. Following are the brief descriptions of the structural
things.
RUQAYYA AMATULLAH 03085009
P a g e | 13
CLASS:
Class represents set of objects having similar responsibilities.
INTERFACE:
Interface defines a set of operations which specify the responsibility of a class.
COLLABORATION:
Collaboration defines interaction between elements.
USE CASE:
Use case represents a set of actions performed by a system for a specific goal.
RUQAYYA AMATULLAH 03085009
P a g e | 14
COMPONENT:
Component describes physical part of a system.
NODE:
A node can be defined as a physical element that exists at run time.
BEHAVIORAL THINGS:
A behavioral thing consists of the dynamic parts of UML models. Following are the behavioral things:
INTERACTION:
Interaction is defined as a behavior that consists of a group of messages exchanged among elements to accomplish a specific task.
RUQAYYA AMATULLAH 03085009
P a g e | 15
STATE MACHINE:
State machine is useful when the state of an object in its life cycle is important.
It defines the sequence of states an object goes through in response to events.
Events are external factors responsible for state change.
GROUPING THINGS:
Grouping things can be defined as a mechanism to group elements of a UML
model together. There is only one grouping thing available.
PACKAGE:
Package is the only one grouping thing available for gathering structural and behavioral things.
RUQAYYA AMATULLAH 03085009

P a g e | 16
ANNOTATIONAL THINGS:
Annotational things can be defined as a mechanism to capture remarks,
descriptions, and comments of UML model elements. Note is the only one
Annotational thing available.
Note:
A note is used to render comments, constraints etc of an UML element.
RELATIONSHIP IN UML
Relationship is another most important building block of UML. It shows how
elements are associated with each other and this association describes the
functionality of an application.
There are four kinds of relationships available.
DEPENDENCY:
RUQAYYA AMATULLAH 03085009
P a g e | 17
Dependency is a relationship between two things in which change in one
element also affects the other one.
ASSOCIATION:
Association is basically a set of links that connects elements of an UML model.
It also describes how many objects are taking part in that relationship.
GENERALIZATION:
Generalization can be defined as a relationship which connects a specialized
element with a generalized element. It basically describes inheritance
relationship in the world of objects.
REALIZATION:
Realization can be defined as a relationship in which two elements are
connected. One element describes some responsibility which is not implemented
and the other one implements them. This relationship exists in case of interfaces.
RUQAYYA AMATULLAH 03085009
P a g e | 18
UML DIAGRAMS
UML diagrams are the ultimate output of the entire discussion. All the elements,
relationships are used to make a complete UML diagram and the diagram
represents a system.
The visual effect of the UML diagram is the most important part of the entire
process. All the other elements are used to make it a complete one.
UML includes the following nine diagrams and the details are described in the
following chapters.
Class diagram
Object diagram
Use case diagram
Sequence diagram
Collaboration diagram
Activity diagram
State chart diagram
Deployment diagram
RUQAYYA AMATULLAH 03085009
P a g e | 19
Component diagram
CLASS DIAGRAM
OVERVIEW:
The class diagram is a static diagram. It represents the static view of an
application. Class diagram is not only used for visualizing, describing and
documenting different aspects of a system but also for constructing executable
code of the software application.
The class diagram describes the attributes and operations of a class and also the
constraints imposed on the system. The class diagrams are widely used in the
modeling of object oriented systems because they are the only UML diagrams
which can be mapped directly with object oriented languages.
The class diagram shows a collection of classes, interfaces, associations,
collaborations and constraints. It is also known as a structural diagram.
RUQAYYA AMATULLAH 03085009
P a g e | 20
PURPOSE:
The purpose of the class diagram is to model the static view of an application.
The class diagrams are the only diagrams which can be directly mapped with
object oriented languages and thus widely used at the time of construction.
The UML diagrams like activity diagram, sequence diagram can only give the
sequence flow of the application but class diagram is a bit different. So it is the
most popular UML diagram in the coder community.
So the purpose of the class diagram can be summarized as:
Analysis and design of the static view of an application.
Describe responsibilities of a system.
Base for component and deployment diagrams.
Forward and reverse engineering.
RUQAYYA AMATULLAH 03085009
P a g e | 21
How to draw Class Diagram?
Class diagrams are the most popular UML diagrams used for construction of
software applications. So it is very important to learn the drawing procedure of
class diagram.
Class diagrams have lot of properties to consider while drawing but here the
diagram will be considered from a top level view.
Class diagram is basically a graphical representation of the static view of the
system and represents different aspects of the application. So a collection of
class diagrams represent the whole system.
The following points should be remembered while drawing a class diagram:
The name of the class diagram should be meaningful to describe the aspect of
the system.
Each element and their relationships should be identified in advance.
Responsibility (attributes and methods) of each class should be clearly
identified.
For each class minimum number of properties should be specified. Because
unnecessary properties will make the diagram complicated.
RUQAYYA AMATULLAH 03085009
P a g e | 22
Use notes when ever required to describe some aspect of the diagram. Because
at the end of the drawing it should be understandable to the developer/coder.
Finally, before making the final version, the diagram should be drawn on plain
paper and rework as many times as possible to make it correct.
Now the following diagram is an example of an Order System of an application.
So it describes a particular aspect of the entire application.
First of all Order and Customer are identified as the two elements of the system
and they have a one to many relationship because a customer can have multiple
orders.
We would keep Order class is an abstract class and it has two concrete classes
(inheritance relationship) SpecialOrder and NormalOrder.
The two inherited classes have all the properties as the Order class. In addition
they have additional functions like dispatch () and receive ().
So the following class diagram has been drawn considering all the points
mentioned above:
RUQAYYA AMATULLAH 03085009
P a g e | 23
Where to use Class Diagrams?
Class diagram is a static diagram and it is used to model static view of a system.
The static view describes the vocabulary of the system.
Class diagram is also considered as the foundation for component and
deployment diagrams. Class diagrams are not only used to visualize the static
view of the system but they are also used to construct the executable code for
forward and reverse engineering of any system.
Generally UML diagrams are not directly mapped with any object oriented
programming languages but the class diagram is an exception.
RUQAYYA AMATULLAH 03085009

P a g e | 24
Class diagram clearly shows the mapping with object oriented languages like
Java, C++ etc. So from practical experience class diagram is generally used for
construction purpose.
So in a brief, class diagrams are used for:
Describing the static view of the system.
Showing the collaboration among the elements of the static view.
Describing the functionalities performed by the system.
Construction of software applications using object oriented languages.
OBJECT DIAGRAM:
Object diagram shows a set of objects and there
relationships.Object diagram represents static snapshot of
instances of the things found in class diagram.
These diagrams addresses static design view or static process
view of a system.
USE CASE DIAGRAM
OVERVIEW:
To model a system the most important aspect is to capture the dynamic
behaviour. To clarify a bit in details, dynamic behaviour means the behaviour of
the system when it is running /operating.
RUQAYYA AMATULLAH 03085009

P a g e | 25
So only static behaviour is not sufficient to model a system rather dynamic
behaviour is more important than static behaviour. In UML there are five
diagrams available to model dynamic nature and use case diagram is one of
them. Now as we have to discuss that the use case diagram is dynamic in nature
there should be some internal or external factors for making the interaction.
These internal and external agents are known as actors. So use case diagrams are
consists of actors, use cases and their relationships. The diagram is used to
model the system/subsystem of an application. A single use case diagram
captures a particular functionality of a system.
So to model the entire system numbers of use case diagrams are used.
PURPOSE:
The purpose of use case diagram is to capture the dynamic aspect of a system.
But this definition is too generic to describe the purpose.
Because other four diagrams (activity, sequence, collaboration and Statechart)
are also having the same purpose. So we will look into some specific purpose
which will distinguish it from other four diagrams.
Use case diagrams are used to gather the requirements of a system including
internal and external influences. These requirements are mostly design
requirements. So when a system is analyzed to gather its functionalities use
cases are prepared and actors are identified.
Now when the initial task is complete use case diagrams are modelled to present
the outside view.
So in brief, the purposes of use case diagrams can be as follows:
Used to gather requirements of a system.
RUQAYYA AMATULLAH 03085009
P a g e | 26
Used to get an outside view of a system.
Identify external and internal factors influencing the system.
Show the interacting among the requirements are actors.
How to draw Component Diagram?
Use case diagrams are considered for high level requirement analysis of a
system. So when the requirements of a system are analyzed the functionalities
are captured in use cases.
So we can say that uses cases are nothing but the system functionalities written
in an organized manner. Now the second things which are relevant to the use
cases are the actors. Actors can be defined as something that interacts with the
system.
The actors can be human user, some internal applications or may be some
external applications. So in a brief when we are planning to draw an use case
diagram we should have the following items identified.
Functionalities to be represented as an use case Actors
RELATIONSHIPS AMONG THE USE CASES AND ACTORS.
Use case diagrams are drawn to capture the functional requirements of a system.
So after identifying the above items we have to follow the following guidelines
to draw an efficient use case diagram.
The name of a use case is very important. So the name should be chosen in such
a way so that it can identify the functionalities performed.
RUQAYYA AMATULLAH 03085009
P a g e | 27
Give a suitable name for actors.
Show relationships and dependencies clearly in the diagram.
Do not try to include all types of relationships. Because the main purpose of the
diagram is to identify requirements.
Use note when ever required to clarify some important points.
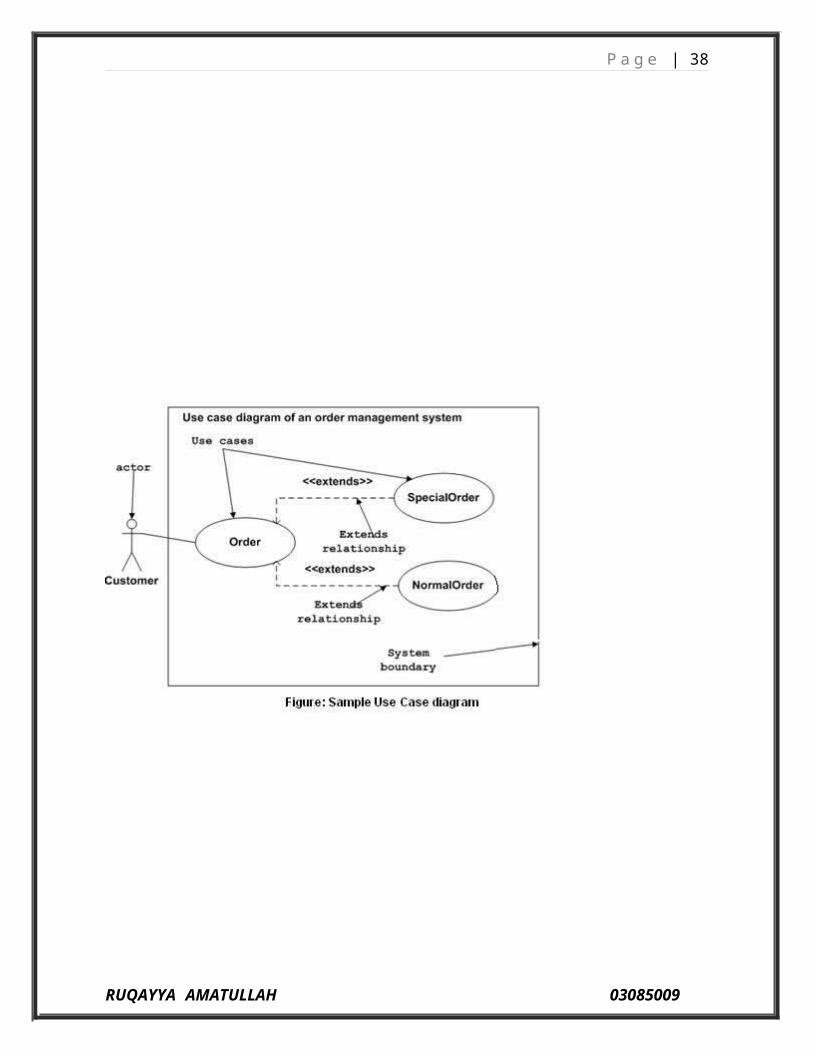
The following is a sample use case diagram representing the order management
system. So if we look into the diagram then we will find three use cases (Order,
SpecialOrder and NormalOrder) and one actor which is customer.
The SpecialOrder and NormalOrder use cases are extended from Order use
case. So they have extends relationship. Another important point is to identify
the system boundary which is shown in the picture. The actor Customer lies
outside the system as it is an external user of the system.
RUQAYYA AMATULLAH 03085009

P a g e | 28
INTERACTION DIAGRAM
We have two types of interaction diagrams in UML. One is sequence diagram
and the other is a collaboration diagram. The sequence diagram captures the
time sequence of message flow from one object to another and the collaboration
RUQAYYA AMATULLAH 03085009
P a g e | 29
diagram describes the organization of objects in a system taking part in the
message flow.
So the following things are to identified clearly before drawing the interaction
diagram:
Objects taking part in the interaction.
Message flows among the objects.
The sequence in which the messages are flowing.
Object organization.
Following are two interaction diagrams modeling order management system.
The first diagram is a sequence diagram and the second is a collaboration
diagram.
THE SEQUENCE DIAGRAM:
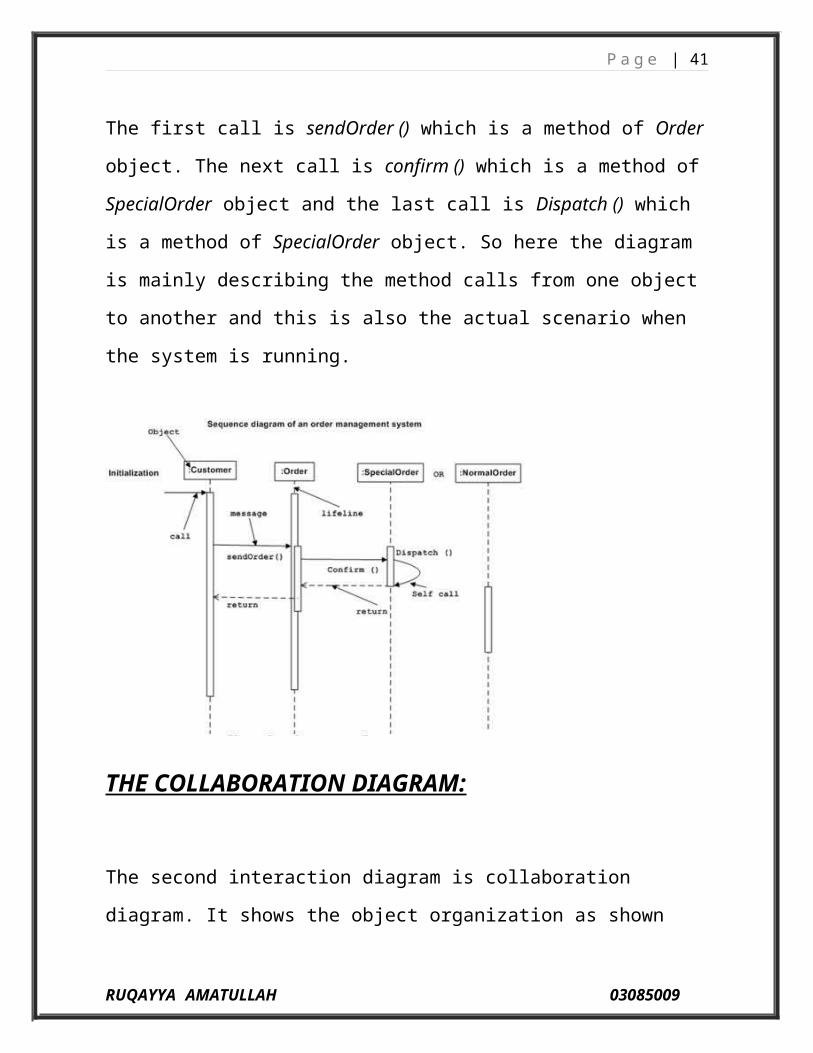
The sequence diagram is having four objects (Customer, Order, SpecialOrder
and NormalOrder).
RUQAYYA AMATULLAH 03085009
P a g e | 30
The following diagram has shown the message sequence for SpecialOrder
object and the same can be used in case of NormalOrder object. Now it is
important to understand the time sequence of message flows. The message flow
is nothing but a method call of an object.
The first call is sendOrder () which is a method of Order object. The next call is
confirm () which is a method of SpecialOrder object and the last call is Dispatch
() which is a method of SpecialOrder object. So here the diagram is mainly
describing the method calls from one object to another and this is also the actual
scenario when the system is running.
THE COLLABORATION DIAGRAM:
The second interaction diagram is collaboration diagram. It shows the object
organization as shown below. Here in collaboration diagram the method call
RUQAYYA AMATULLAH 03085009

P a g e | 31
sequence is indicated by some numbering technique as shown below. The
number indicates how the methods are called one after another. We have taken
the same order management system to describe the collaboration diagram.
The method calls are similar to that of a sequence diagram. But the difference is
that the sequence diagram does not describe the object organization where as the
collaboration diagram shows the object organization.
Now to choose between these two diagrams the main emphasis is given on the
type of requirement. If the time sequence is important then sequence diagram is
used and if organization is required then collaboration diagram is used.
Where to use Interaction Diagrams?
we have already discussed that interaction diagrams are used to describe
dynamic nature of a system. now we will look into the practical scenarios where
RUQAYYA AMATULLAH 03085009

P a g e | 32
these diagrams are used. to understand the practical application we need to
understand the basic nature of sequence and collaboration diagram.
the main purposes of both the diagrams are similar as they are used to capture
the dynamic behaviour of a system. but the specific purposes are more important
to clarify and understood.
sequence diagrams are used to capture the order of messages flowing from one
object to another. and the collaboration diagrams are used to describe the
structural organizations of the objects taking part in the interaction. a single
diagram is not sufficient to describe the dynamic aspect of an entire system so a
set of diagrams are used to capture is as a whole.
the interaction diagrams are used when we want to understand the message flow
and the structural organization. now message flow means the sequence of
control flow from one object to another and structural organization means the
visual organization of the elements in a system.
in a brief the following are the usages of interaction diagrams:
to model flow of control by time sequence.
to model flow of control by structural organizations.
for forward engineering.
for reverse engineering.
STATE CHART DIAGRAM
OVERVIEW :
RUQAYYA AMATULLAH 03085009
P a g e | 33
The name of the diagram itself clarifies the purpose of the diagram and other
details. It describes different states of a component in a system. The states are
specific to a component/object of a system.
A State chart diagram describes a state machine. Now to clarify it state machine
can be defined as a machine which defines different states of an object and these
states are controlled by external or internal events.
Activity diagram explained in next chapter, is a special kind of a State chart
diagram. As State chart diagram defines states it is used to model lifetime of an
object.
PURPOSE:
Statechart diagram is one of the five UML diagrams used to model dynamic
nature of a system. They define different states of an object during its lifetime.
And these states are changed by events. So Statechart diagrams are useful to
model reactive systems. Reactive systems can be defined as a system that
responds to external or internal events.
Statechart diagram describes the flow of control from one state to another state.
States are defined as a condition in which an object exists and it changes when
some event is triggered. So the most important purpose of Statechart diagram is
to model life time of an object from creation to termination.
Statechart diagrams are also used for forward and reverse engineering of a
system. But the main purpose is to model reactive system.
Following are the main purposes of using State chart diagrams:
To model dynamic aspect of a system.
RUQAYYA AMATULLAH 03085009

P a g e | 34
To model life time of a reactive system.
To describe different states of an object during its life time.
Define a state machine to model states of an object.
How to draw Component Diagram?
State chart diagram is used to describe the states of different objects in its life
cycle. So the emphasis is given on the state changes upon some internal or
external events. These states of objects are important to analyze and implement
them accurately.
State chart diagrams are very important for describing the states. States can be
identified as the condition of objects when a particular event occurs.
Before drawing a State chart diagram we must have clarified the following
points:
Identify important objects to be analyzed.
Identify the states.
Identify the events.
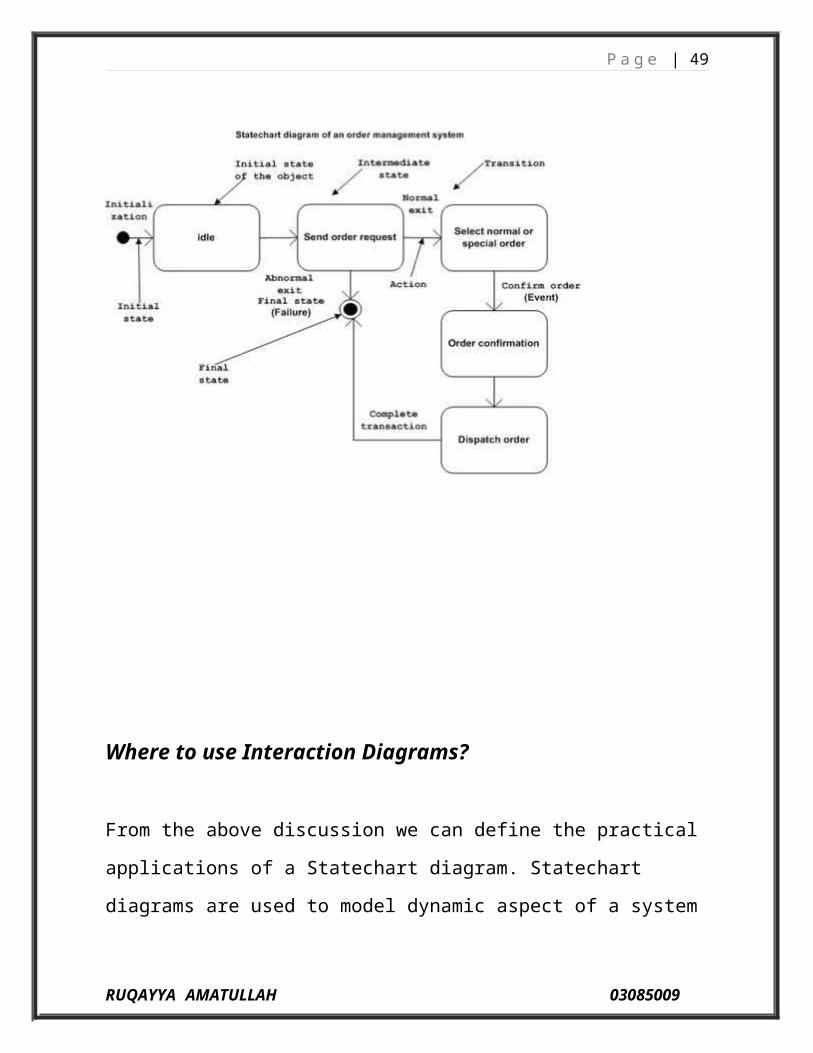
The following is an example of a State chart diagram where the state of Order
object is analyzed.
The first state is an idle state from where the process starts. The next states are
arrived for events like send request, confirm request, and dispatch order. These
events are responsible for state changes of order object.
During the life cycle of an object (here order object) it goes through the
following states and there may be some abnormal exists also. This abnormal exit
may occur due to some problem in the system. When the entire life cycle is
complete it is considered as the complete transaction as mentioned below.
RUQAYYA AMATULLAH 03085009
P a g e | 35
The initial and final state of an object is also shown below.
Where to use Interaction Diagrams?
From the above discussion we can define the practical applications of a
Statechart diagram. Statechart diagrams are used to model dynamic aspect of a
RUQAYYA AMATULLAH 03085009
P a g e | 36
system like other four diagrams disused in this tutorial. But it has some
distinguishing characteristics for modeling dynamic nature.
Statechart diagram defines the states of a component and these state changes are
dynamic in nature. So its specific purpose is to define state changes triggered by
events. Events are internal or external factors influencing the system.
Statechart diagrams are used to model states and also events operating on the
system. When implementing a system it is very important to clarify different
states of an object during its life time and statechart diagrams are used for this
purpose. When these states and events are identified they are used to model it
and these models are used during implementation of the system.
If we look into the practical implementation of Statechart diagram then it is
mainly used to analyze the object states influenced by events. This analysis is
helpful to understand the system behaviour during its execution.
So the main usages can be described as:
To model object states of a system.
To model reactive system. Reactive system consists of reactive objects.
To identify events responsible for state changes.
Forward and reverse engineering.
ACTIVITY DIAGRAM
OVERVIEW :
RUQAYYA AMATULLAH 03085009

P a g e | 37
Activity diagram is another important diagram in UML to describe dynamic
aspects of the system.
Activity diagram is basically a flow chart to represent the flow form one activity
to another activity. The activity can be described as an operation of the system.
So the control flow is drawn from one operation to another. This flow can be
sequential, branched or concurrent. Activity diagrams deals with all type of flow
control by using different elements like fork, join etc.
PURPOSE :
The basic purposes of activity diagrams are similar to other four diagrams. It
captures the dynamic behaviour of the system. Other four diagrams are used to
show the message flow from one object to another but activity diagram is used
to show message flow from one activity to another.
Activity is a particular operation of the system. Activity diagrams are not only
used for visualizing dynamic nature of a system but they are also used to
construct the executable system by using forward and reverse engineering
techniques. The only missing thing in activity diagram is the message part.
It does not show any message flow from one activity to another. Activity
diagram is some time considered as the flow chart. Although the diagrams looks
like a flow chart but it is not. It shows different flow like parallel, branched,
concurrent and single.
So the purposes can be described as:
Draw the activity flow of a system.
Describe the sequence from one activity to another.
Describe the parallel, branched and concurrent flow of the system.
RUQAYYA AMATULLAH 03085009
P a g e | 38
How to draw Component Diagram?
Activity diagrams are mainly used as a flow chart consists of activities
performed by the system. But activity diagram are not exactly a flow chart as
they have some additional capabilities. These additional capabilities include
branching, parallel flow, swimlane etc.
Before drawing an activity diagram we must have a clear understanding about
the elements used in activity diagram. The main element of an activity diagram
is the activity itself. An activity is a function performed by the system. After
identifying the activities we need to understand how they are associated with
constraints and conditions.
So before drawing an activity diagram we should identify the following
elements:
Activities
Association
Conditions
Constraints
Once the above mentioned parameters are identified we need to make a mental
layout of the entire flow. This mental layout is then transformed into an activity
diagram.
The following is an example of an activity diagram for order management
system. In the diagram four activities are identified which are associated with
conditions. One important point should be clearly understood that an activity
diagram cannot be exactly matched with the code. The activity diagram is made
to understand the flow of activities and mainly used by the business users.
The following diagram is drawn with the four main activities:
RUQAYYA AMATULLAH 03085009
P a g e | 39
Send order by the customer
Receipt of the order
Confirm order
Dispatch order
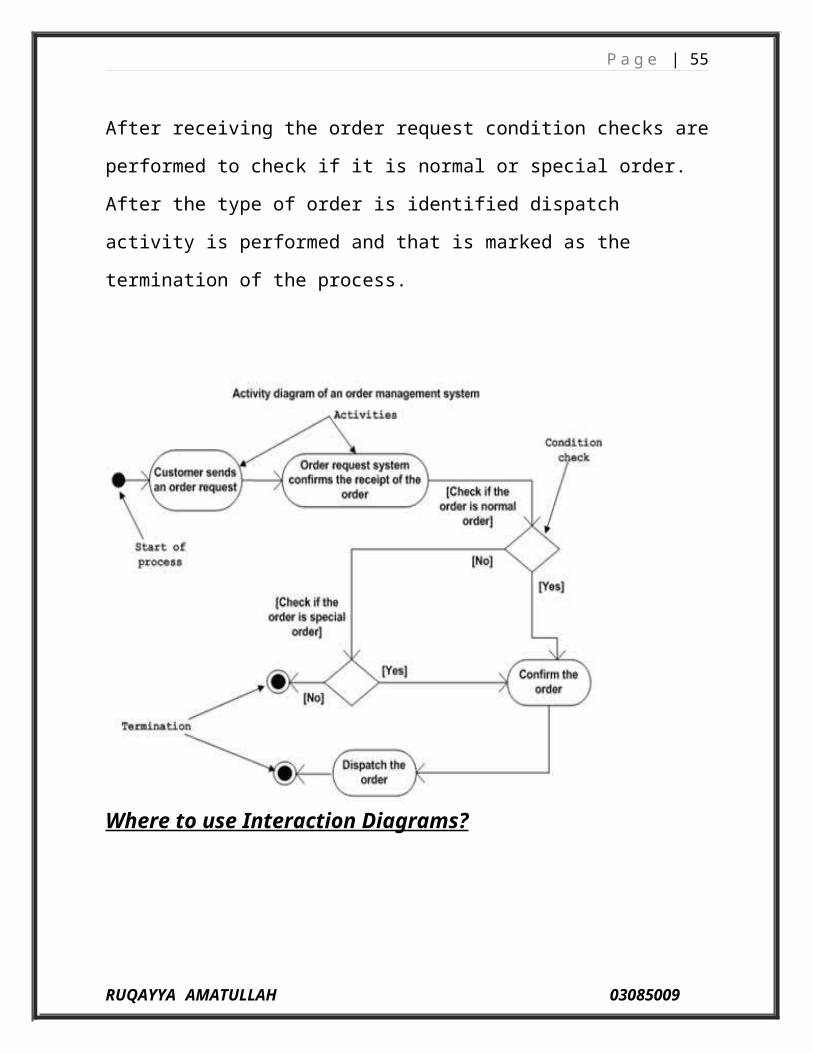
After receiving the order request condition checks are performed to check if it is
normal or special order. After the type of order is identified dispatch activity is
performed and that is marked as the termination of the process.
Where to use Interaction Diagrams?
RUQAYYA AMATULLAH 03085009

P a g e | 40
The basic usage of activity diagram is similar to other four UML diagrams. The
specific usage is to model the control flow from one activity to another. This
control flow does not include messages.
The activity diagram is suitable for modeling the activity flow of the system. An
application can have multiple systems. Activity diagram also captures these
systems and describes flow from one system to another. This specific usage is
not available in other diagrams. These systems can be database, external queues
or any other system.
Now we will look into the practical applications of the activity diagram. From
the above discussion it is clear that an activity diagram is drawn from a very
high level. So it gives high level view of a system. This high level view is
mainly for business users or any other person who is not a technical person.
This diagram is used to model the activities which are nothing but business
requirements. So the diagram has more impact on business understanding rather
implementation details.
Following are the main usages of activity diagram:
Modeling work flow by using activities.
Modeling business requirements.
High level understanding of the system's functionalities.
Investigate business requirements at a later stage.
COMPONENT DIAGRAM
RUQAYYA AMATULLAH 03085009
P a g e | 41
OVERVIEW :
Component diagrams are different in terms of nature and behaviour. Component
diagrams are used to model physical aspects of a system.
Now the question is what are these physical aspects? Physical aspects are the
elements like executables, libraries, files, documents etc which resides in a node.
So component diagrams are used to visualize the organization and relationships
among components in a system. These diagrams are also used to make
executable systems.
PURPOSE:
Component diagram is a special kind of diagram in UML. The purpose is also
different from all other diagrams discussed so far. It does not describe the
functionality of the system but it describes the components used to make those
functionalities.
So from that point component diagrams are used to visualize the physical
components in a system. These components are libraries, packages, files etc.
Component diagrams can also be described as a static implementation view of a
system. Static implementation represents the organization of the components at
a particular moment.
A single component diagram cannot represent the entire system but a collection
of diagrams are used to represent the whole.
So the purpose of the component diagram can be summarized as:
Visualize the components of a system.
Construct executables by using forward and reverse engineering.
Describe the organization and relationships of the components.
RUQAYYA AMATULLAH 03085009

P a g e | 42
How to draw Component Diagram?
Component diagrams are used to describe the physical artifacts of a system. This
artifact includes files, executables, libraries etc.
So the purpose of this diagram is different, Component diagrams are used during
the implementation phase of an application. But it is prepared well in advance to
visualize the implementation details.
Initially the system is designed using different UML diagrams and then when
the artifacts are ready component diagrams are used to get an idea of the
implementation.
This diagram is very important because without it the application cannot be
implemented efficiently. A well prepared component diagram is also important
for other aspects like application performance, maintenance etc.
So before drawing a component diagram the following artifacts are to be
identified clearly:
Files used in the system.
Libraries and other artifacts relevant to the application.
Relationships among the artifacts.
Now after identifying the artifacts the following points needs to be
followed:
Use a meaningful name to identify the component for which the diagram
is to be drawn.
Prepare a mental layout before producing using tools.
Use notes for clarifying important points.
RUQAYYA AMATULLAH 03085009

P a g e | 43
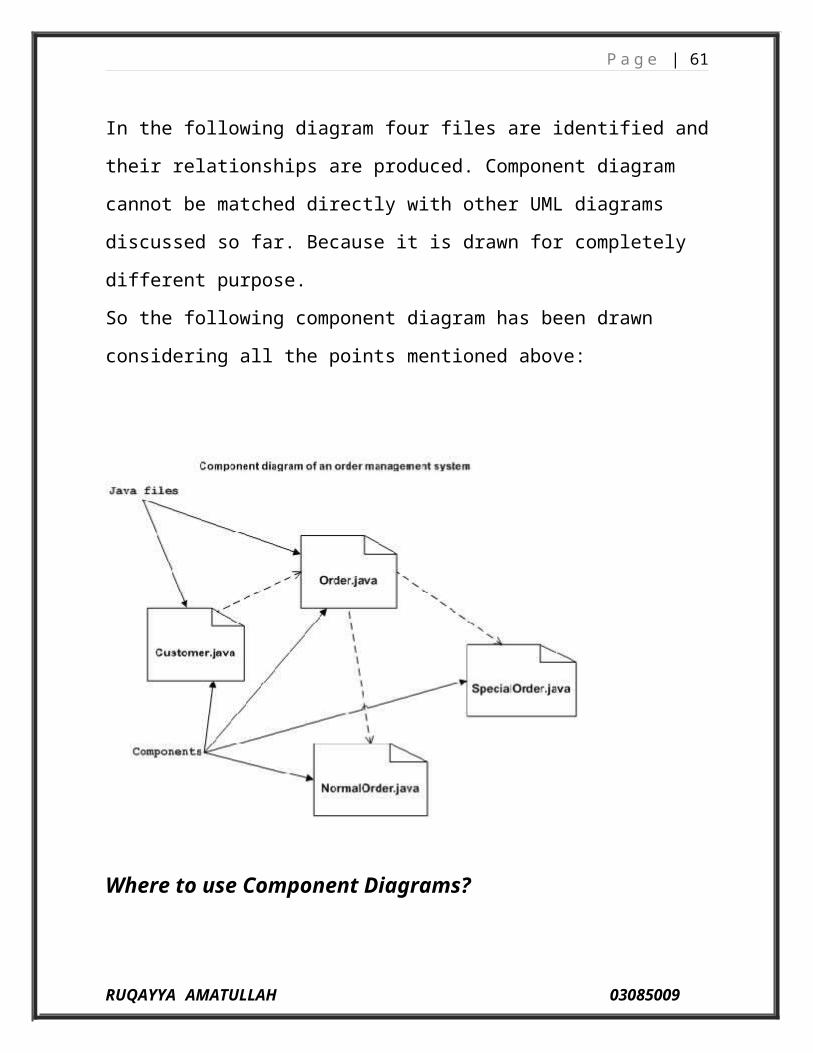
The following is a component diagram for order management system. Here the
artifacts are files. So the diagram shows the files in the application and their
relationships. In actual the component diagram also contains dlls, libraries,
folders etc.
In the following diagram four files are identified and their relationships are
produced. Component diagram cannot be matched directly with other UML
diagrams discussed so far. Because it is drawn for completely different purpose.
So the following component diagram has been drawn considering all the points
mentioned above:
Where to use Component Diagrams?
RUQAYYA AMATULLAH 03085009
P a g e | 44
We have already described that component diagrams are used to visualize the
static implementation view of a system. Component diagrams are special type of
UML diagrams used for different purposes.
These diagrams show the physical components of a system. To clarify it, we can
say that component diagrams describe the organization of the components in a
system.
Organization can be further described as the location of the components in a
system. These components are organized in a special way to meet the system
requirements.
As we have already discussed those components are libraries, files, executables
etc. Now before implementing the application these components are to be
organized. This component organization is also designed separately as a part of
project execution.
Component diagrams are very important from implementation perspective. So
the implementation team of an application should have a proper knowledge of
the component details.
Now the usage of component diagrams can be described as:
Model the components of a system.
Model database schema.Model executables of an application.Model system's source code.
DEPLOYMENT DIAGRAM
RUQAYYA AMATULLAH 03085009

P a g e | 45
OVERVIEW:
Deployment diagrams are used to visualize the topology of the physical
components of a system where the software components are deployed.
So deployment diagrams are used to describe the static deployment view of a
system. Deployment diagrams consist of nodes and their relationships.
PURPOSE:
The name Deployment itself describes the purpose of the diagram. Deployment
diagrams are used for describing the hardware components where software
components are deployed. Component diagrams and deployment diagrams are
closely related.
Component diagrams are used to describe the components and deployment
diagrams shows how they are deployed in hardware.
UML is mainly designed to focus on software artifacts of a system. But these
two diagrams are special diagrams used to focus on software components and
hardware components.
So most of the UML diagrams are used to handle logical components but
deployment diagrams are made to focus on hardware topology of a system.
Deployment diagrams are used by the system engineers.
The purpose of deployment diagrams can be described as:
Visualize hardware topology of a system.
Describe the hardware components used to deploy software components.
Describe runtime processing nodes.
How to draw Component Diagram?
RUQAYYA AMATULLAH 03085009
P a g e | 46
Deployment diagram represents the deployment view of a system. It is related to
the component diagram. Because the components are deployed using the
deployment diagrams. A deployment diagram consists of nodes. Nodes are
nothing but physical hardwares used to deploy the application.
Deployment diagrams are useful for system engineers. An efficient deployment
diagram is very important because it controls the following parameters
Performance
Scalability
Maintainability
Portability
So before drawing a deployment diagram the following artifacts should be
identified:
Nodes
Relationships among nodes.
The following deployment diagram is a sample to give an idea of the
deployment view of order management system. Here we have shown nodes as:
Monitor
Modem
Caching server
Server
The application is assumed to be a web based application which is deployed in a
clustered environment using server 1, server 2 and server 3. The user is
RUQAYYA AMATULLAH 03085009

P a g e | 47
connecting to the application using internet. The control is flowing from the
caching server to the clustered environment.
So the following deployment diagram has been drawn considering all the points
mentioned above:
RUQAYYA AMATULLAH 03085009
P a g e | 48
Where to use Deployment Diagrams?
Deployment diagrams are mainly used by system engineers. These diagrams are
used to describe the physical components (hardwares), their distribution and
association.
To clarify it in details we can visualize deployment diagrams as the hardware
components/nodes on which software components reside.
Software applications are developed to model complex business processes. Only
efficient software applications are not sufficient to meet business requirements.
Business requirements can be described as to support increasing number of
users, quick response time etc.
To meet these types of requirements hardware components should be designed
efficiently and in a cost effective way.
Now a day's software applications are very complex in nature. Software
applications can be stand alone, web based, distributed, mainframe based and
many more. So it is very important to design the hardware components
efficiently.
So the usage of deployment diagrams can be described as follows:
To model the hardware topology of a system.
To model embedded system.
To model hardware details for a client/server system.
To model hardware details of a distributed application.
Forwar
d and reverse engineering.
RUQAYYA AMATULLAH 03085009
P a g e | 49
UML NOTATIONS
UML notations are the most important elements in modeling. Efficient and
appropriate use of notations is very important for making a complete and
meaningful model. The model is useless unless its purpose is depicted properly.
So learning notations should be emphasized from the very beginning. Different
notations are available for things and relationships. And the UML diagrams are
made using the notations of things and relationships. Extensibility is another
important feature which makes UML more powerful and flexible.
The chapter describes the UML Basic Notations in more details. This is just an
extension to the UML buildling block section I have discussed in previous
chapter.
STRUCTURAL THINGS:
Graphical notations used in structural things are the most widely used in UML.
These are considered as the nouns of UML models. Following are the list of
structural things.
Classes
Interface
Collaboration
Use case
Active classes
Components
Nodes
Class Notation:
RUQAYYA AMATULLAH 03085009
P a g e | 50
UML class is represented by the diagram shown below. The diagram is
divided into four parts.
The top section is used to name the class.
The second one is used to show the attributes of the class.
The third section is used to describe the operations performed by the
class.
The fourth section is optional to show any additional components.
Classes are used to represent objects. Objects can be anything having properties
and responsibility.
RUQAYYA AMATULLAH 03085009

P a g e | 51
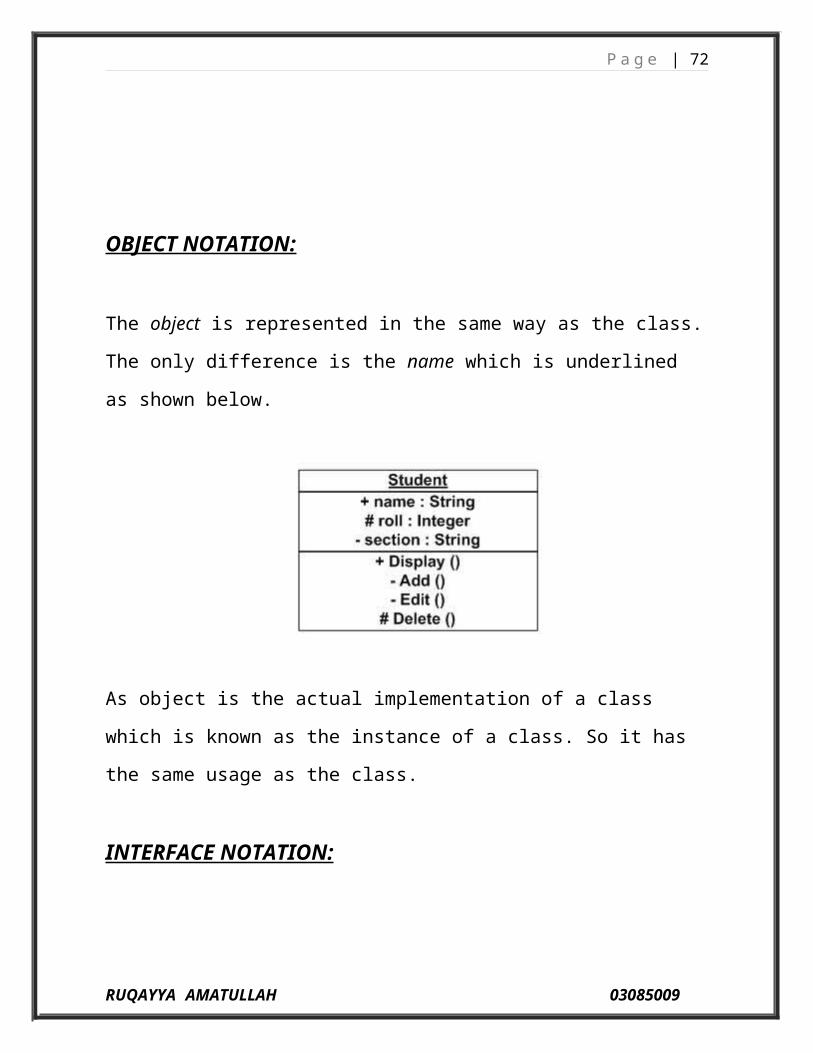
OBJECT NOTATION:
The object is represented in the same way as the class. The only difference is the
name which is underlined as shown below.
As object is the actual implementation of a class which is known as the instance
of a class. So it has the same usage as the class.
INTERFACE NOTATION:
Interface is represented by a circle as shown below. It has a name which is
generally written below the circle.
RUQAYYA AMATULLAH 03085009
P a g e | 52
Interface is used to describe functionality without implementation. Interface is
the just like a template where you define different functions not the
implementation. When a class implements the interface it also implements the
functionality as per the requirement.
COLLABORATION NOTATION:
Collaboration is represented by a dotted eclipse as shown below. It has a name
written inside the eclipse.
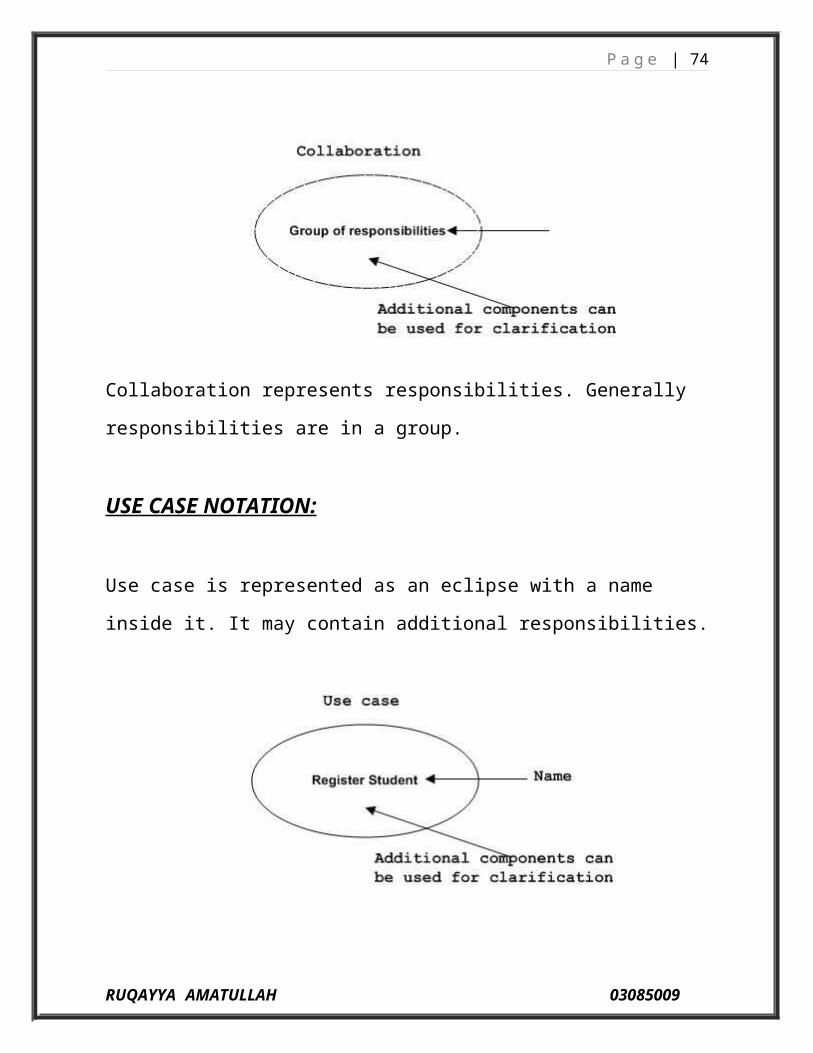
Collaboration represents responsibilities. Generally responsibilities are in a
group.
USE CASE NOTATION:
Use case is represented as an eclipse with a name inside it. It may contain
additional responsibilities.
RUQAYYA AMATULLAH 03085009
P a g e | 53
Use case is used to capture high level functionalities of a system.
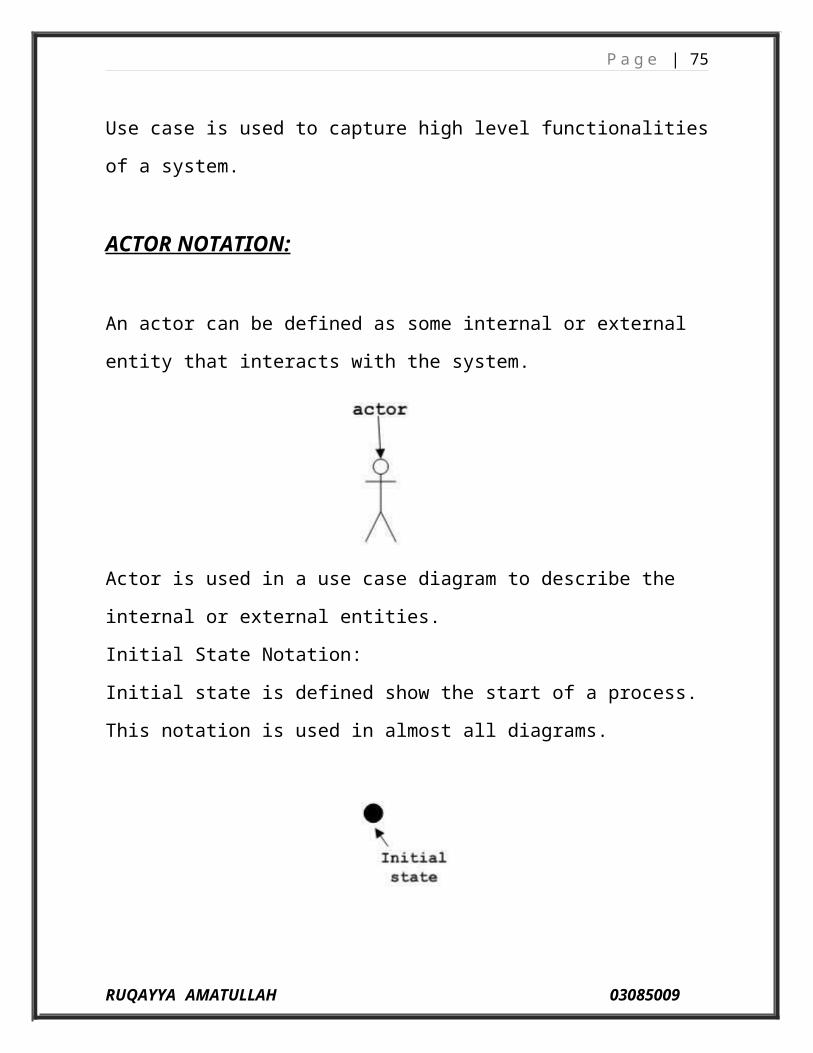
ACTOR NOTATION:
An actor can be defined as some internal or external entity that interacts with the
system.
Actor is used in a use case diagram to describe the internal or external entities.
Initial State Notation:
Initial state is defined show the start of a process. This notation is used in almost
all diagrams.
RUQAYYA AMATULLAH 03085009
P a g e | 54
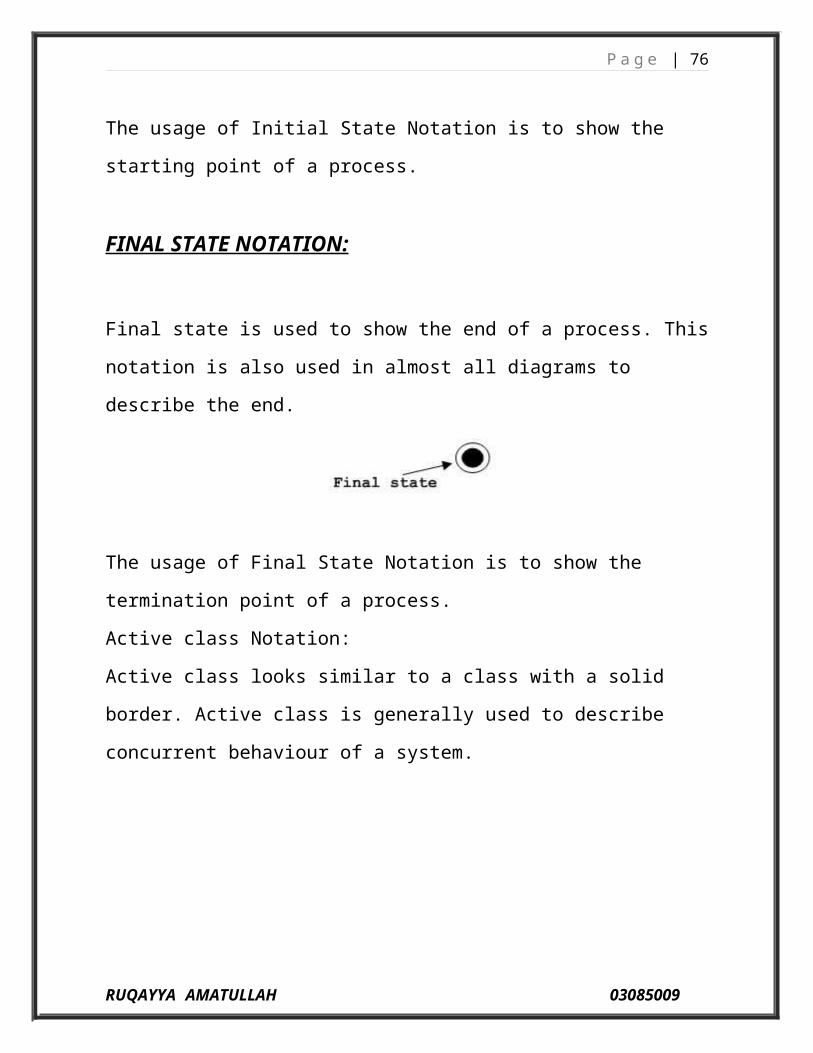
The usage of Initial State Notation is to show the starting point of a process.
FINAL STATE NOTATION:
Final state is used to show the end of a process. This notation is also used in
almost all diagrams to describe the end.
The usage of Final State Notation is to show the termination point of a process.
Active class Notation:
Active class looks similar to a class with a solid border. Active class is generally
used to describe concurrent behaviour of a system.
Active class is used to represent concurrency in a system.
RUQAYYA AMATULLAH 03085009
P a g e | 55
COMPONENT NOTATION:
A component in UML is shown as below with a name inside. Additional
elements can be added wherever required.
Component is used to represent any part of a system for which UML diagrams
are made.
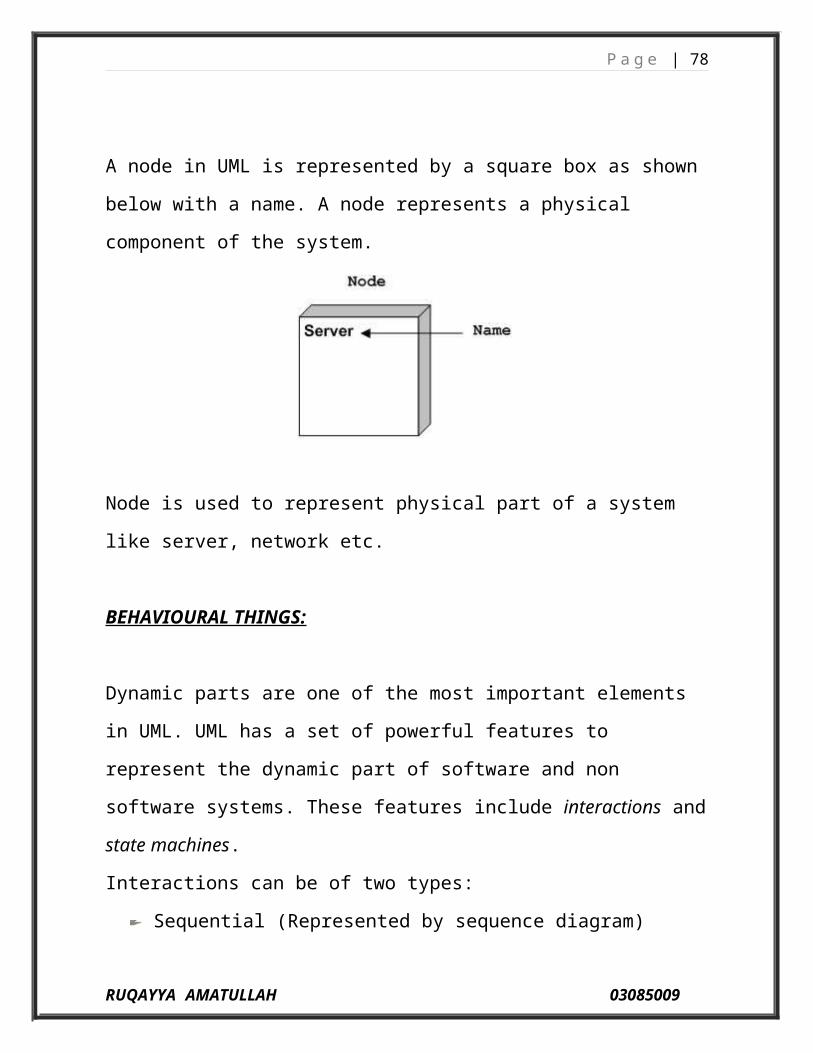
NODE NOTATION:
A node in UML is represented by a square box as shown below with a name. A
node represents a physical component of the system.
Node is used to represent physical part of a system like server, network etc.
RUQAYYA AMATULLAH 03085009
P a g e | 56
BEHAVIOURAL THINGS:
Dynamic parts are one of the most important elements in UML. UML has a set
of powerful features to represent the dynamic part of software and non software
systems. These features include interactions and state machines.
Interactions can be of two types:
Sequential (Represented by sequence diagram)
Collaborative (Represented by collaboration diagram)
Interaction Notation:
Interaction is basically message exchange between two UML components. The
following diagram represents different notations used in an interaction.
Interaction is used to represent communication among the components of a
system.
State machine Notation:
State machine describes the different states of a component in its life cycle. The
notations are described in the following diagram.
RUQAYYA AMATULLAH 03085009
P a g e | 57
State machine is used to describe different states of a system component. The
state can be active, idle or any other depending upon the situation.
GROUPING THINGS:
Organizing the UML models are one of the most important aspects of the
design. In UML there is only one element available for grouping and that is
package.
RUQAYYA AMATULLAH 03085009
P a g e | 58
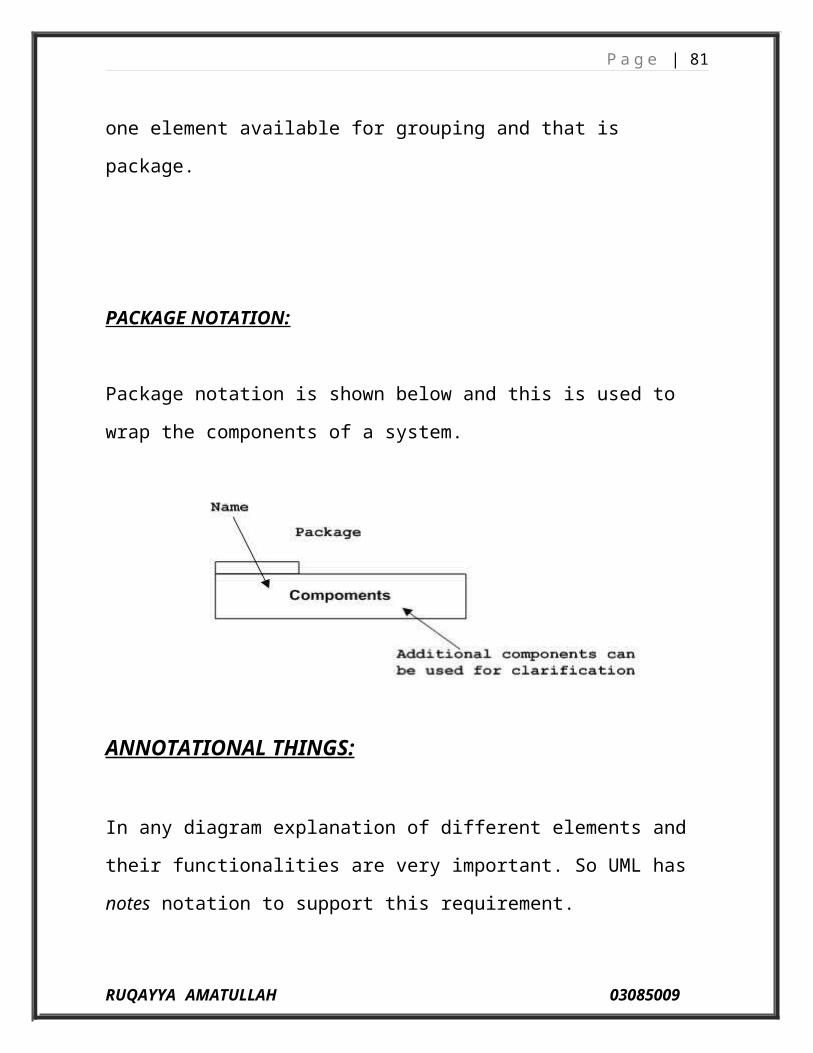
PACKAGE NOTATION:
Package notation is shown below and this is used to wrap the components of a
system.
ANNOTATIONAL THINGS:
In any diagram explanation of different elements and their functionalities are
very important. So UML has notes notation to support this requirement.
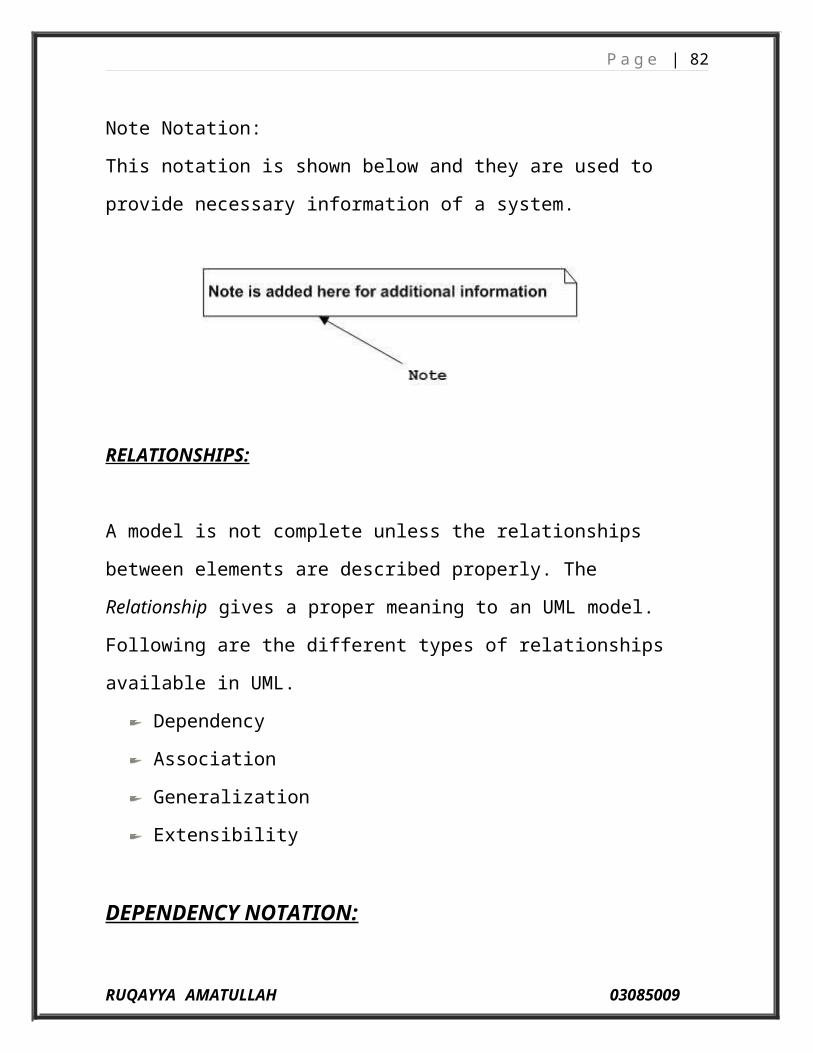
Note Notation:
This notation is shown below and they are used to provide necessary
information of a system.
RUQAYYA AMATULLAH 03085009
P a g e | 59
RELATIONSHIPS:
A model is not complete unless the relationships between elements are described
properly. The Relationship gives a proper meaning to an UML model.
Following are the different types of relationships available in UML.
Dependency
Association
Generalization
Extensibility
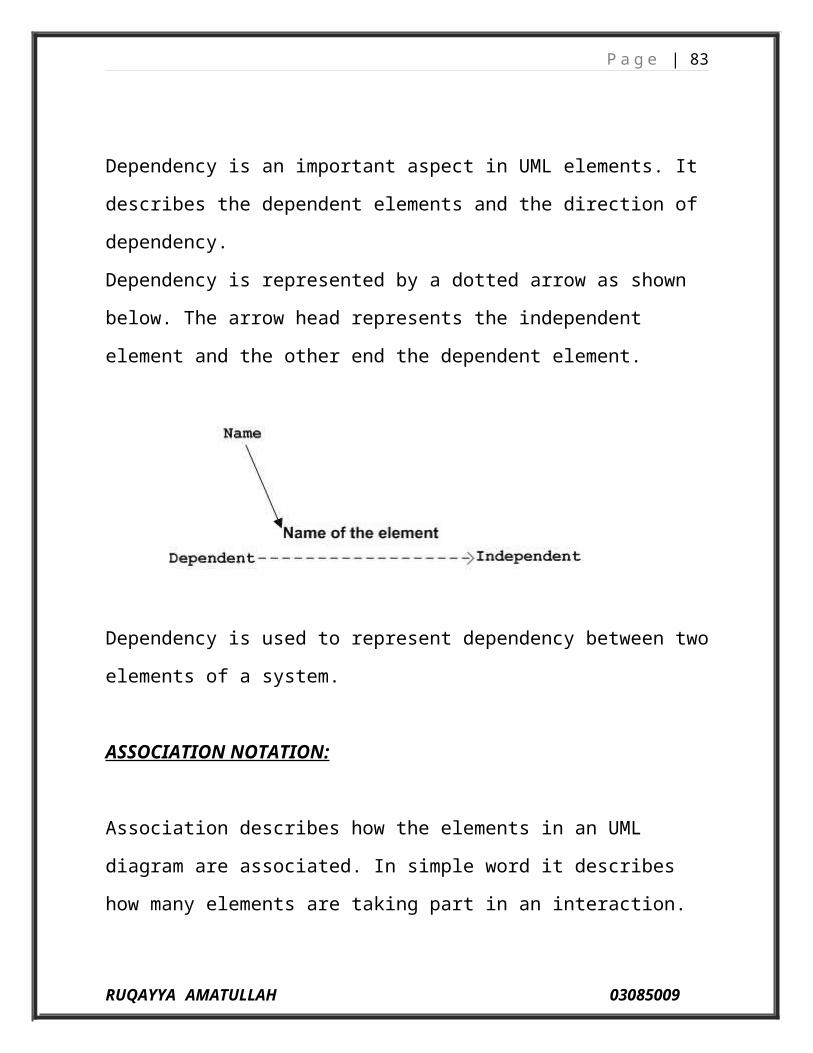
DEPENDENCY NOTATION:
Dependency is an important aspect in UML elements. It describes the dependent
elements and the direction of dependency.
Dependency is represented by a dotted arrow as shown below. The arrow head
represents the independent element and the other end the dependent element.
Dependency is used to represent dependency between two elements of a system.
RUQAYYA AMATULLAH 03085009
P a g e | 60
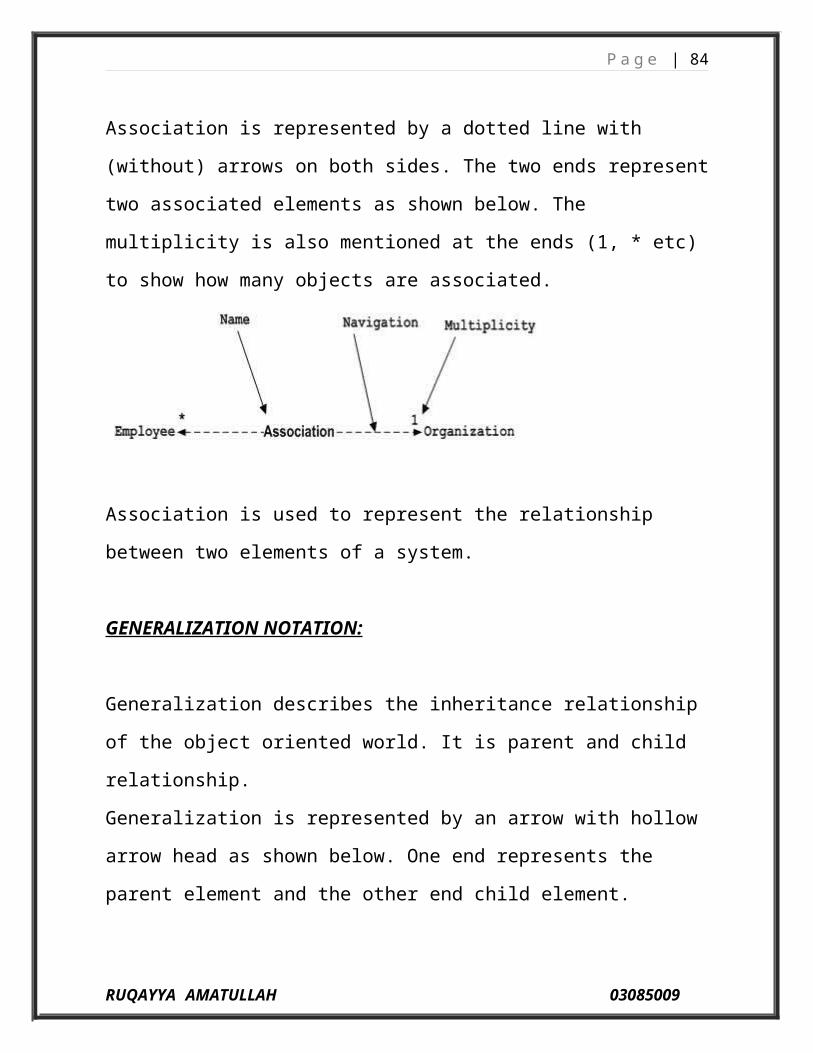
ASSOCIATION NOTATION:
Association describes how the elements in an UML diagram are associated. In
simple word it describes how many elements are taking part in an interaction.
Association is represented by a dotted line with (without) arrows on both sides.
The two ends represent two associated elements as shown below. The
multiplicity is also mentioned at the ends (1, * etc) to show how many objects
are associated.
Association is used to represent the relationship between two elements of a
system.
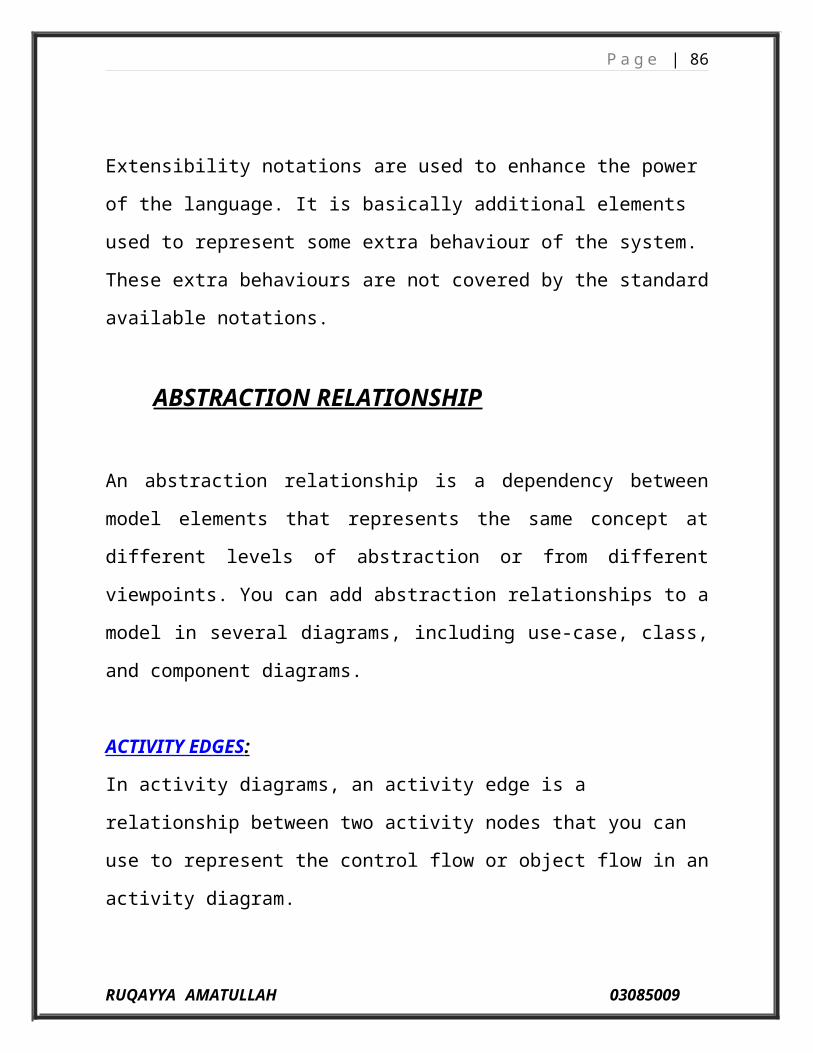
GENERALIZATION NOTATION:
Generalization describes the inheritance relationship of the object oriented
world. It is parent and child relationship.
Generalization is represented by an arrow with hollow arrow head as shown
below. One end represents the parent element and the other end child element.
RUQAYYA AMATULLAH 03085009
P a g e | 61
Generalization is used to describe parent-child relationship of two elements of a
system.
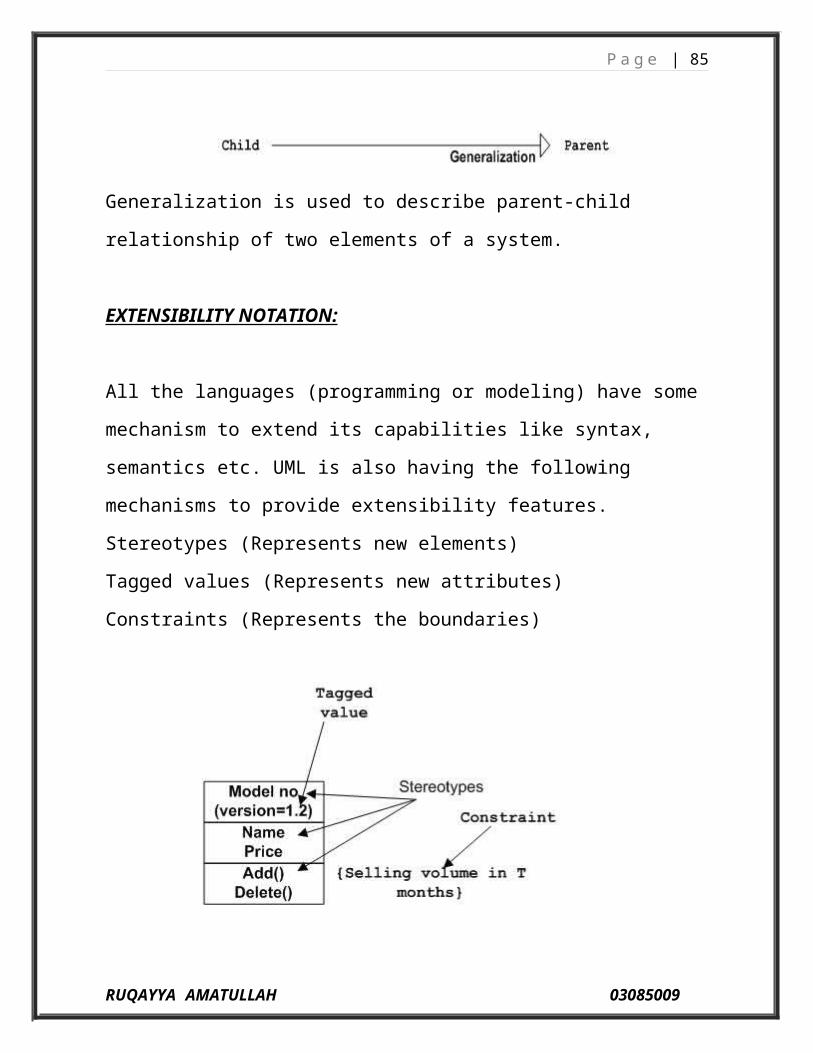
EXTENSIBILITY NOTATION:
All the languages (programming or modeling) have some mechanism to extend
its capabilities like syntax, semantics etc. UML is also having the following
mechanisms to provide extensibility features.
Stereotypes (Represents new elements)
Tagged values (Represents new attributes)
Constraints (Represents the boundaries)
Extensibility notations are used to enhance the power of the language. It is
basically additional elements used to represent some extra behaviour of the
system. These extra behaviours are not covered by the standard available
notations.
RUQAYYA AMATULLAH 03085009
P a g e | 62
ABSTRACTION RELATIONSHIP
An abstraction relationship is a dependency between model elements that
represents the same concept at different levels of abstraction or from different
viewpoints. You can add abstraction relationships to a model in several
diagrams, including use-case, class, and component diagrams.
ACTIVITY EDGES :
In activity diagrams, an activity edge is a relationship between two activity
nodes that you can use to represent the control flow or object flow in an activity
diagram.
AGGREGATION RELATIONSHIPS :
An aggregation relationship depicts a classifier as a part of, or as subordinate to,
another classifier.
ASSOCIATION RELATIONSHIPS :
In UML models, an association is a relationship between two classifiers, such as
classes or use cases, that describes the reasons for the relationship and the rules
that govern the relationship.
BINDING RELATIONSHIPS :
In UML models, a binding relationship is a relationship that assigns values to
template parameters and generates a new model element from the template.
RUQAYYA AMATULLAH 03085009
P a g e | 63
COMMUNICATION PATHS :
In UML modeling, a communication path is a type of association between nodes
in a deployment diagram that shows how the nodes exchange messages and
signals.
COMPOSITION RELATIONSHIPS :
A composition relationship, which was named composition association
relationship in UML 1.4, represents whole–part relationships and is a form of
aggregation. A composition relationship specifies that the lifetime of the part
classifier is dependent on the lifetime of the whole classifier.
DEPENDENCY RELATIONSHIPS :
In UML modeling, a dependency relationship is a relationship in which changes
to one model element (the supplier) impact another model element (the client).
You can use dependency relationships in class diagrams, component diagrams,
deployment diagrams, and use case diagrams.
DEPLOYMENT RELATIONSHIPS :
In UML modeling, deployment relationships specify that a particular node type
supports the deployment of an artifact type.
DIRECTED ASSOCIATION RELATIONSHIPS
In UML models, directed association relationships are associations that are
navigable in only one direction.
RUQAYYA AMATULLAH 03085009
P a g e | 64
GENERALIZATION RELATIONSHIPS :
In UML modeling, a generalization relationship is a relationship in which one
model element (the child) is based on another model element (the parent).
Generalization relationships are used in class, component, deployment, and use
case diagrams.
IMPLEMENTATION RELATIONSHIPS :
In UML modeling, an implementation relationship is a specialized type of
realization relationship between a classifier and a provided interface. The
implementation relationship specifies that the realizing classifier must conform
to the contract that the provided interface specifies.
INCLUDE RELATIONSHIPS :
In UML modeling, an include relationship is a relationship in which one use
case (the base use case) includes the functionality of another use case (the
inclusion use case). The include relationship supports the reuse of functionality
in a use case model.
MANIFESTATION RELATIONSHIPS :
In UML modeling, a manifestation relationship shows which model elements,
such as components or classes, are manifested in an artifact. The artifact
manifests, or includes, a specific implementation for, the features of one or
several physical software components.
RUQAYYA AMATULLAH 03085009
P a g e | 65
REALIZATION RELATIONSHIPS :
In UML modeling, a realization relationship is a relationship between two model
elements, in which one model element (the client) realizes the behavior that the
other model element (the supplier) specifies. Several clients can realize the
behavior of a single supplier. You can use realization relationships in class
diagrams and component diagrams.
USAGE RELATIONSHIPS :
In UML modeling, a usage relationship is a type of dependency relationship in
which one model element (the client) requires another model element (the
supplier) for full implementation or operation.
RUQAYYA AMATULLAH 03085009
P a g e | 66
COMMON MECHANISMS IN UML
Specifications
textual statement of syntax & semantics
diagrams give view of specification
Adornments
elements in UML - unique graphical notation
adornments - added information about class
Common Divisions
general property vs. specific instance
class vs. object
use case vs. use case instance
UML syntax: underline name of instance
separation of interface & implementation
interface - contract
implementation - concrete realization of contract
RUQAYYA AMATULLAH 03085009

P a g e | 67
Extensibility Mechanisms
stereotype
allows creation of new kinds of building blocks from existing ones
tagged value
allows creation of new information in specification
constraint
allows addition of new rules & modification of existing rules
RUQAYYA AMATULLAH 03085009
P a g e | 68
\Rules Of UML
specify what model should look like
semantic rules for
names
scope
visibility
integrity
execution
Common properties of models
elided - hide some elements for simplicity
incomplete
inconsistent
rules of UML make it easier to address these problems
RUQAYYA AMATULLAH 03085009
P a g e | 69
ARCHITECTURE OF UML
Any real world system is used by different users. The users can be developers,
testers, business people, analysts and many more. So before designing a system
the architecture is made with different perspectives in mind. The most important
part is to visualize the system from different viewer.s perspective. The better we
understand the better we make the system.
UML plays an important role in defining different perspectives of a system.
These perspectives are:
Design
Implementation
Process
Deployment
And the centre is the Use Case view which connects all these four. A Use case
represents the functionality of the system. So the other perspectives are
connected with use case.
Design of a system consists of classes, interfaces and collaboration. UML
provides class diagram, object diagram to support this.
Implementation defines the components assembled together to make a
complete physical system. UML component diagram is used to support
implementation perspective.
RUQAYYA AMATULLAH 03085009
P a g e | 70
Process defines the flow of the system. So the same elements as used in Design
are also used to support this perspective.
Deployment represents the physical nodes of the system that forms the
hardware. UML deployment diagram is used to support this perspective.
TERMS AND CONCEPTS:
UML 2.2 has 14 types of diagrams divided into two categories.[10] Seven
diagram types represent structural information, and the other seven represent
general types of behavior, including four that represent different aspects of
interactions. These diagrams can be categorized hierarchically as shown in the
following class diagram:
UML does not restrict UML element types to a certain diagram type. In general,
every UML element may appear on almost all types of diagrams; this flexibility
has been partially restricted in UML 2.0. UML profiles may define additional
diagram types or extend existing diagrams with additional notations.
In keeping with the tradition of engineering drawings, a comment or note
explaining usage, constraint, or intent is allowed in a UML diagram.
RUQAYYA AMATULLAH 03085009

P a g e | 71
STRUCTURE DIAGRAMS
Structure diagrams emphasize what things must be in the system
being modeled:
Class diagram: the class diagrams describes the structure of a system by
showing the system's classes, their attributes, and the relationships among the
classes.
Component diagram: depicts how a software system is split up into
components and shows the dependencies among these components.
Composite structure diagram: describes the internal structure of a class and
the collaborations that this structure makes possible.
Deployment diagram: serves to model the hardware used in system
implementations, and the execution environments and artifacts deployed on
the hardware.
Object diagram: shows a complete or partial view of the structure of a
modeled system at a specific time.
Package diagram: depicts how a system is split up into logical groupings by
showing the dependencies among these groupings.
Profile diagram: operates at the metamodel level to show stereotypes as
classes with the <<stereotype>> stereotype, and profiles as packages with the
<<profile>> stereotype. The extension relation (solid line with closed, filled
arrowhead) indicate what metamodel element a given stereotype is
extending.
Since structure diagrams represent the structure they are used extensively in
documenting the architecture of software systems.
BEHAVIOR DIAGRAMS
RUQAYYA AMATULLAH 03085009
P a g e | 72
Behavior diagrams emphasize what must happen in the system being modeled:
Activity diagram: represents the business and operational step-by-step
workflows of components in a system. An activity diagram shows the
overall flow of control.
State machine diagram: standardized notation to describe many systems,
from computer programs to business processes.
Use case diagram: shows the functionality provided by a system in terms
of actors, their goals represented as use cases, and any dependencies
among those use cases.
Since behavior diagrams illustrate the behaviour of a system, they are used
extensively to describe the functionality of software systems.
CLASS DIAGRAM
RUQAYYA AMATULLAH 03085009

P a g e | 73
The class diagram describes the attributes and operations of a class and also the
constraints imposed on the system. The class diagrams are widely used in the
modelling of object oriented systems because they are the only UML diagrams
which can be mapped directly with object oriented languages.
The class diagram shows a collection of classes, interfaces, associations,
collaborations and constraints. It is also known as a structural diagram.
CONTENTS:
Class diagrams commonly contain the following things
Classes
Interfaces
Collaborations
Dependency,generation and association relationships
Fig: Class Diagram
RUQAYYA AMATULLAH 03085009
P a g e | 74
3.1.1.1 CLASS DIAGRAM FOR COLLEGE INFORMATION SYSTEM
STAFF
name : stringid : integerqualification : stringcourses : stringexperience : integerpast record : intgeraddress : integer
taking classes()evaluatng papers()condutng xams()giving assgnmnts()conducting labs()
ADDMISSION CELL
name : stringbranch name : stringcollege name : stringuniversity name : stringvacancies of seats : intno of branches : inttype of addmission : string
seat allotment()provides fee details()tally certificates()
BRANCHES
name : stringbranch id : integercode : stringno of students : integer
STUDENT
name : stringroll no : integerbranch : stringaddress : stringph no : integer
read()write()attending exam()submtng assgnmt()attndng classes()doing projects()
HOD
name : stringqualification : stringexperience : intname of dept : stringcontact no : integer
displaying the notice()displaying the attednce()displaying marks()issuing halltickets()issuing memos()conducting seminars()
PRINCIPAL
name : stringqualification : stringexperience : integerpast record : integercontact no : integer
managing college()provide info abt placements()hiring staff members()keepng a track of a studnt()manage fee details()
Fig: Use Class Diagram
RUQAYYA AMATULLAH 03085009
P a g e | 75
USE CASE DIAGRAM
Use case diagrams are used to gather the requirements of a system including
internal and external influences. These requirements are mostly design
requirements. So when a system is analyzed to gather its functionalities use
cases are prepared and actors are identified.
Now when the initial task is complete use case diagrams are modelled to present
the outside view.
So in brief, the purposes of use case diagrams can be as follows:
Used to gather requirements of a system.
Used to get an outside view of a system.
Identify external and internal factors influencing the system.
Show the interacting among the requirements are actors.
Fig: Use Case Diagram
RUQAYYA AMATULLAH 03085009
P a g e | 76
USE CASE DIAGRAM FOR THE STUDENT ,STAFF AND CONTRLLER OF EXAM
attending classes
generate results
STUDENT
submitting assignments
exams
<<extend>>
conducting xams
declaring exam datesCONTROLLER OF XAM
issuing hallticket
study
doing projects
conducting exams
taking classes
updates
STAFF
*-
conducting labs
evaluating papers<<extend>>
giving assignments
<<include>>
attendence updates
<<extend>>
Fig: Use Case Diagram between student, staff and controller of exam.
RUQAYYA AMATULLAH 03085009

P a g e | 77
USE CASE DIAGRAM FOR THE PRINCIPAL AND H.O.D
displaying notice
conducting seminarsHO.D
distributing halltickets
hiring staff
providing info about placements
PRINCIPAL
managing colege
distributing memos
<<extend>>
RUQAYYA AMATULLAH 03085009
P a g e | 78
Fig: Use Case Diagram between H.O.D. and principal.
INTERACTION DIAGRAM
That is why sequence and collaboration diagrams are used to capture dynamic
nature but from a different angle.
So the purposes of interaction diagram can be describes as:
To capture dynamic behavior of a system.
To describe the message flow in the system.
To describe structural organization of the objects.
To describe interaction among objects.
Fig:Sequence Diagram
RUQAYYA AMATULLAH 03085009
P a g e | 79
Fig: Collaboration Diagram
RUQAYYA AMATULLAH 03085009

P a g e | 80
SEQUENCE DIAGRAM FOR THE COLLEGE INFORMATION SYSTEM
STUDENTSTUDENT ADMISSION CELL
ADMISSION CELL
STAFFSTAFF
access college info
applying for admission
request conformation
enter the info.
payment of fee
receipt
send student's record
Fig: Sequence Diagram between student, staff and admission cell.
RUQAYYA AMATULLAH 03085009
P a g e | 81
STUDENTSTUDENT STAFFSTAFF H.O.DH.O.D
conducting classes
attending classes
giving assignments
submitting assignmnts
conducting tests
attending tests
giving info andattecdence record
Fig: Sequence Diagram between student, staff and H.O.D..
RUQAYYA AMATULLAH 03085009
P a g e | 82
STUDENTSTUDENTCONTROLLER
OF EXAMSCONTROLLER
OF EXAMS
declaring exam dates and fee
payment of xam fee
issuinf halltickets and conducting xams
attending xams
declaring results
Fig: Sequence Diagram between student and controller of exam.
RUQAYYA AMATULLAH 03085009
P a g e | 83
COLLABORATION DIAGRAM FOR THE COLLEGE INFORMATION SYSTEM
STUDENT : _BindingIteratorImplBase
ADMISSION CELL
STAFF
1: access college info2: applying for admission
3: request conformation
4: enter the info.5: payment of fee
6: receipt
7: send student's record
Fig: Collaboration Diagram between student,admission cell and staff.
RUQAYYA AMATULLAH 03085009
P a g e | 84
STUDENT
STAFF
H.O.D
1: conducting classes
2: attending classes
3: giving assignments
4: submitting assignmnts
5: conducting tests
6: attending tests
7: giving info andattecdence record
Fig: Collaboration Diagram between student,staff abd H.O.D.
CONTROLLER OF EXAMS
STUDENT
1: declaring exam dates and fee
2: payment of xam fee
3: issuinf halltickets and conducting xams
4: attending xams
5: declaring results
Fig: Collaboration Diagram between student and controller of exam.
RUQAYYA AMATULLAH 03085009
P a g e | 85
ACTIVITY DIAGRAM
Activity diagram is another important diagram in UML to describe dynamic
aspects of the system.
Activity diagram is basically a flow chart to represent the flow form one activity
to another activity. The activity can be described as an operation of the system.
So the control flow is drawn from one operation to another. This flow can be
sequential, branched or concurrent. Activity diagrams deals with all type of flow
control by using different elements like fork, join etc.
RUQAYYA AMATULLAH 03085009
P a g e | 86
staff
collecting info
conducting xams
view status of class
managing staff
issuing hallticket
isuuing memos
conducting seminars
H.O.DSTAFF
RUQAYYA AMATULLAH 03085009
P a g e | 87
principal
managing the colg
if staff<50
hiring staff
distributing salaries
view status
RUQAYYA AMATULLAH 03085009
P a g e | 88
student
submitt appln
view status
...
...
attend classeswrite the exam ...
view the status
collecting applications
verifying certi ficates
allotment of seats
eligible for seats
collecting fees
fork
join
ADMISSION CELLSTUDENT
BRANCHING
RUQAYYA AMATULLAH 03085009
P a g e | 89
A branch specifies alternate paths takes based on some Boolean expressionBranch is represented by diamondBranch may have one incoming transition and two or more outgoing one on each outgoing transition,you place a Boolean expression shouldn’t overlap but they should cover all possibilities.
FORKING AND JOINING
ForkA fork represents the splitting of a single flow of control into two or more concurrentFlow of control.A fork may have one incoming transition and two or more outgoing transitions, each of which represents an independent flow of control.Below fork the activities associated with each of these path continues in parallel.
JoinA join represents the synchronization of two or more concurrent flows of control.A join may have two or more incoming transition and one outgoing transition.Above the join the activities associated with each of these paths continues in parallel.
Swimlane : Swimlanes are useful when we model workflows of business processes to partition the activity states on an activity diagram into groups.Each group representing the business organization responsible for those activities,these groups are called swimlanes.
RUQAYYA AMATULLAH 03085009

P a g e | 90
Submission the Appl ication
Form Accepted
Verify
Login
Download the study material
View the Academic info
logout
join
fork
correct
incorrect
Fig: Fork and Join for the student Admission
RUQAYYA AMATULLAH 03085009

P a g e | 91
FORK AND JOIN DIAGRAM FOR THE RESULT
Submission the Exam Form
verify
View the Hal l ticket
Appear the Exam
Verify
View the Result Print out the certi ficate
fork
join
correct
Pass
Fig:Fork and join diagram for the result
RUQAYYA AMATULLAH 03085009
P a g e | 92
STATE CHART DIAGRAM
A state chart diagrams a state machine, emphasizing the flow of control from
state to state.
CONTENTS
State chart diagrams commonly contain
Simply state and composite states
Transitions, including events and actions
COMMON USE
They are use to model the dynamic aspects of a system.
Event ordered behavior of any kind of objects, to model reactive objects.
RUQAYYA AMATULLAH 03085009
P a g e | 93
STATE CHART DIAGRAM FOR COLLEGE INFORMATION SYSTEM
ACTIVE
Issuing Notification
processing admission
conducting class and exams
generation of results
scheduling of time table
Issuing Notification
processing admission
conducting class and exams
generation of results
scheduling of time table
idle
user input
Fig: State Chart Diagram
RUQAYYA AMATULLAH 03085009
P a g e | 94
COMPONENT DIAGRAM
Component diagrams are different in terms of nature and behaviour. Component
diagrams are used to model physical aspects of a system.
Now the question is what are these physical aspects? Physical aspects are the
elements like executables, libraries, files, documents etc which resides in a node.
So component diagrams are used to visualize the organization and relationships
among components in a system. These diagrams are also used to make
executable systems.
Fig: Component Diagram
RUQAYYA AMATULLAH 03085009
P a g e | 95
COMPONENT DIAGRAM FOR COLLEGE INFORMATION SYSTEM
college information system .exe
issuing notification
processing addmission
conducting classes and exams
NewSubprogSpec1NewSubprogSpec2
NewSubprogSpec3
NewMainSubprog1NewMainSubprog2 NewMainSubprog3
Fig: Component Diagram
RUQAYYA AMATULLAH 03085009
P a g e | 96
DEPLOYMENT DIAGRAM
Deployment diagrams are used to visualize the topology of the physical
components of a system where the software components are deployed.
So deployment diagrams are used to describe the static deployment view of a
system. Deployment diagrams consist of nodes and their relationships.
Purpose:
The name Deployment itself describes the purpose of the diagram. Deployment
diagrams are used for describing the hardware components where software
components are deployed. Component diagrams and deployment diagrams are
closely related.
Component diagrams are used to describe the components and deployment
diagrams shows how they are deployed in hardware.
Fig: Deployment Diagram
RUQAYYA AMATULLAH 03085009
P a g e | 97
DEPLOYMENT DIAGRAM FOR THE COLLEGE INFORMATION SYSTEM
COLLE...
STUDENT
STAFF H.O.D PRINCIPAL
Fig: Deployment Diagram
RUQAYYA AMATULLAH 03085009
P a g e | 98
CONCLUSION
That's it! You have successfully completed the online orientation for college
information system. You've learned about quite a few different services
available to you here at college information system and undoubtedly you'll want
to explore them further at your leisure.
RUQAYYA AMATULLAH 03085009